The influence of residential wood combustion on the concentrations of PM2.5 in four Nordic cities - ACP
←
→
Page content transcription
If your browser does not render page correctly, please read the page content below

Atmos. Chem. Phys., 20, 4333–4365, 2020
https://doi.org/10.5194/acp-20-4333-2020
© Author(s) 2020. This work is distributed under
the Creative Commons Attribution 4.0 License.
The influence of residential wood combustion on the concentrations
of PM2.5 in four Nordic cities
Jaakko Kukkonen1 , Susana López-Aparicio2 , David Segersson3 , Camilla Geels4 , Leena Kangas1 , Mari Kauhaniemi1 ,
Androniki Maragkidou1 , Anne Jensen4 , Timo Assmuth5 , Ari Karppinen1 , Mikhail Sofiev1 , Heidi Hellén1 ,
Kari Riikonen1 , Juha Nikmo1 , Anu Kousa6 , Jarkko V. Niemi6 , Niko Karvosenoja5 , Gabriela Sousa Santos2 ,
Ingrid Sundvor7 , Ulas Im4 , Jesper H. Christensen4 , Ole-Kenneth Nielsen4 , Marlene S. Plejdrup4 ,
Jacob Klenø Nøjgaard4 , Gunnar Omstedt3 , Camilla Andersson3 , Bertil Forsberg8 , and Jørgen Brandt4
1 Finnish Meteorological Institute, Erik Palmenin aukio 1, P.O. Box 503, 00101 Helsinki, Finland
2 Norwegian Institute for Air Research, Instituttveien 18, P.O. Box 100, 2027 Kjeller, Norway
3 Swedish Meteorological and Hydrological Institute, 60176 Norrköping, Sweden
4 Department of Environmental Science – Atmospheric modeling, Aarhus University, Frederiksborgvej 399, 4000 Roskilde,
Denmark
5 Finnish Environment Institute, Latokartanonkaari 11, 00790 Helsinki, Finland
6 Helsinki Region Environmental Services Authority, Ilmalantori 1, 00240 Helsinki, Finland
7 Institute of Transport Economics, Gaustadalléen 21, 0349 Oslo, Norway
8 Department of Public Health and Clinical Medicine, Umeå University, 90187 Umeå, Sweden
Correspondence: Jaakko Kukkonen (jaakko.kukkonen@fmi.fi)
Received: 14 June 2019 – Discussion started: 12 July 2019
Revised: 19 February 2020 – Accepted: 4 March 2020 – Published: 15 April 2020
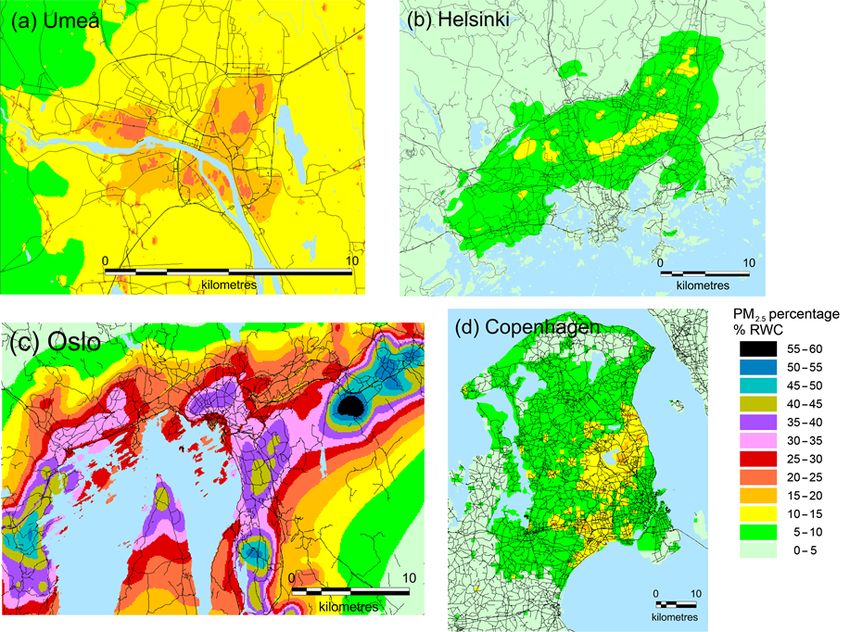
Abstract. Residential wood combustion (RWC) is an impor- erage fractions of PM2.5 concentrations attributed to RWC
tant contributor to air quality in numerous regions world- within the considered urban regions ranged spatially from
wide. This study is the first extensive evaluation of the influ- 0 % to 15 %, from 0 % to 20 %, from 8 % to 22 % and from
ence of RWC on ambient air quality in several Nordic cities. 0 % to 60 % in Helsinki, Copenhagen, Umeå and Oslo, re-
We have analysed the emissions and concentrations of PM2.5 spectively. In particular, the contributions of RWC in cen-
in cities within four Nordic countries: in the metropolitan tral Oslo were larger than 40 % as annual averages. In Oslo,
areas of Copenhagen, Oslo, and Helsinki and in the city wood combustion was used mainly for the heating of larger
of Umeå. We have evaluated the emissions for the relevant blocks of flats. In contrast, in Helsinki, RWC was solely used
urban source categories and modelled atmospheric disper- in smaller detached houses. In Copenhagen and Helsinki, the
sion on regional and urban scales. The emission inventories highest fractions occurred outside the city centre in the sub-
for RWC were based on local surveys, the amount of wood urban areas. In Umeå, the highest fractions occurred both in
combusted, combustion technologies and other relevant fac- the city centre and its surroundings.
tors. The accuracy of the predicted concentrations was eval-
uated based on urban concentration measurements. The pre-
dicted annual average concentrations ranged spatially from
4 to 7 µg m−3 (2011), from 6 to 10 µg m−3 (2013), from 4 1 Introduction
to more than 13 µg m−3 (2013) and from 9 to more than
13 µg m−3 (2014), in Umeå, Helsinki, Oslo and Copenhagen, The combustion of wood or other kinds of biomass for resi-
respectively. The higher concentrations in Copenhagen were dential heating and cooking is a significant source of atmo-
mainly caused by the relatively high regionally and continen- spheric pollution, both in developed and developing coun-
tally transported background contributions. The annual av- tries (e.g. Patel et al., 2013; Sigsgaard et al., 2015; Butt et
al., 2016). Biomass combustion and the combustion of res-
Published by Copernicus Publications on behalf of the European Geosciences Union.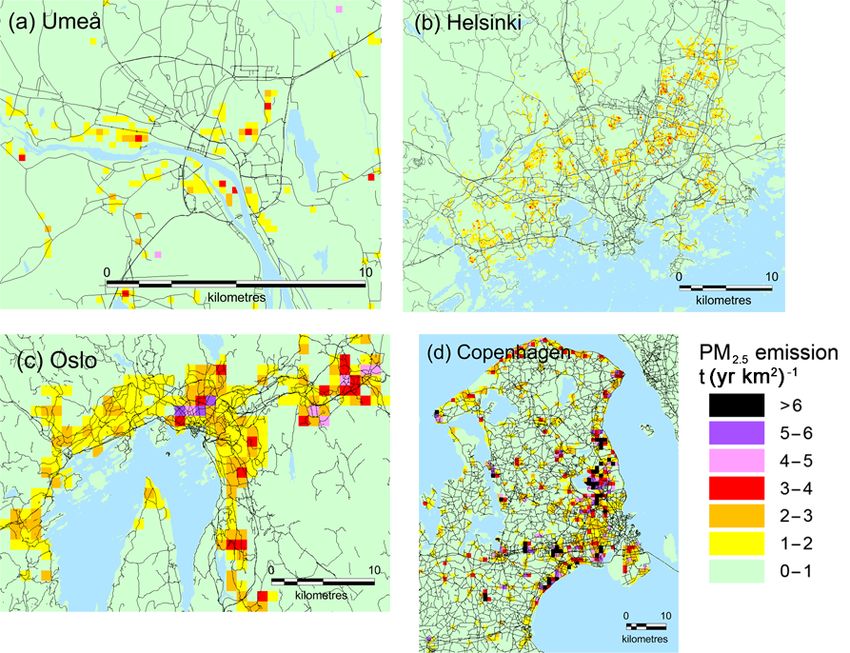
4334                                                  J. Kukkonen et al.: Influence of residential wood combustion on PM2.5

idential solid fuels (RSF), such as wood crop residue, ani-        responsible for 22 %, 15 %, 32 % and 12 % of the concen-
mal waste, coal and charcoal (Butt et al., 2016; Capistrano et     trations, respectively. In another study conducted by Butt et
al., 2017), have been found to contribute significantly to par-    al. (2016), their computations showed that the largest resi-
ticulate matter emissions in numerous countries worldwide          dential emissions of PM2.5 occurred in East Asia, South Asia
(e.g. Karagulian et al., 2015; Butt et al., 2016; Vicente and      and eastern Europe.
Alves, 2018; Im et al., 2019). In addition, such combustion           Regarding RWC findings in Europe, Brandt et al. (2013),
results in emissions of harmful or toxic gaseous pollutants,       based on emissions for 2000 and the Economic Valuation
such as CO, CO2 , NOx , heavy metals (i.e. Pb, Cu, Fe, Zn,         of Air pollution (EVA) system, estimated that non-industrial
and Hg, etc.), polycyclic aromatic hydrocarbons (PAHs) and         combustion (dominated by RWC) contributed to approxi-
other toxic compounds (Patel et al., 2013; Capistrano et al.,      mately 10 % of the total health costs due to air pollution in
2017).                                                             Europe. Two studies for major cities in the UK indicated
   Epidemiological studies have documented that both short-        that the contributions of RWC to particulate matter were
and long-term exposure to smoke from biomass and RSF               clearly lower than those observed for Nordic cities and part
combustion are responsible for chronic obstructive pul-            of the cities in continental Europe (Fuller et al., 2014; Har-
monary disease (COPD), acute lower respiratory and cardio-         rison et al., 2012). Fuller et al. (2014) reported that 9 % of
vascular disease, pneumonia, tuberculosis, asthma, and even        ambient PM10 in London in 2010 was attributed to RWC.
lung cancer (Patel et al., 2013; Sigsgaard et al., 2015; Capis-    Harrison et al. (2012) reported RWC contributions, which
trano et al., 2017). Several studies have pointed out the strong   were below 1 % of ambient PM2.5 concentrations in Lon-
relationship between particulate matter from biomass burn-         don and Birmingham. Cordell et al. (2016) evaluated the im-
ing and severe consequences on health, including hospital-         pacts of biomass burning in the UK, the Netherlands, Bel-
isations, cardiovascular and respiratory problems, and pre-        gium and France. Their findings indicated that the contribu-
mature mortality (McGowan et al., 2002; Pope and Dockery,          tion of biomass combustion to PM10 concentrations during
2006; Sanhueza et al., 2009; Brook et al., 2010). According        the winter ranged from 2.7 % to 11.6 %. Lanz et al. (2010)
to WHO (2011, 2014), approximately 4 million deaths can            reported that wood-burning emissions accounted for 17 %–
be attributed to RSF combustion every year worldwide. Butt         49 % of organic aerosol in winter across the greater Alpine
et al. (2016) evaluated that the global annual excess adult        region during 2002–2009. Yttri et al. (2019) analysed the car-
premature mortality attributed to residential emissions was        bonaceous particle fraction at nine European locations dur-
308 000. In Europe and North America, 29 000 premature             ing winter, spring and autumn. The contribution of RWC was
deaths have been estimated to be ascribed annually to resi-        substantial, accounting for 30 %–50 % of the total carbon in
dential biomass burning (Chafe et al., 2015).                      particles at most sites.
   For simplicity, in this article we mainly use the term resi-       There are also several publications on RWC in Nordic
dential wood combustion (RWC), which includes the com-             countries. Im et al. (2019) evaluated that the largest domestic
bustion of various wood products. The concept of RWC               emission sector of PM2.5 in Denmark, Finland and Norway
refers here to either detached residential houses, row (ter-       was non-industrial combustion. Non-industrial combustion
raced) houses or medium-sized blocks of flats. The term            and industry in Sweden were found to contribute to PM2.5
“small-scale combustion” (SSC) has also been used in the           emissions a comparable amount. Im et al. (2019) also es-
literature to refer to combustion from stationary small-scale      timated that the total premature mortality cases due to air
appliances. Such appliances can be used, e.g. in homes, in         pollution were approximately 4000 in Denmark and Sweden
small- and medium-scale industry, and in heat and energy           and approximately 2000 in Finland and Norway. Markers
production. However, this definition does not include small-       of processes and abundant sources of particles were appor-
scale combustion in traffic. Clearly, the concept SSC is more      tioned based on measurements during a summer campaign
comprehensive and includes more fuels and sources com-             at four Norwegian rural background sites in 2009 by Yttri et
pared to RWC.                                                      al. (2011). In late summer, biomass burning contributed only
   With respect to RWC globally, Vicente and Alves (2018)          3 %–7 % to the carbonaceous aerosol. According to Hedberg
evaluated that residential fuel burning is responsible for         et al. (2006), RWC was responsible for 70 % of the fine par-
a substantial share of particulate matter concentrations in        ticle mass in a small city in northern Sweden in 2002. In
Africa (34 %), central and eastern Europe (32 %), northwest-       addition, Glasius et al. (2006) reported that PM2.5 concen-
ern Europe (22 %), southern China (21 %), Southeast Asia           trations in a small Danish rural village were approximately
(19 %), and India (16 %). According to the review of Karag-        4 µg m−3 higher than at a nearby background monitoring site
ulian et al. (2015), 25 % of urban ambient air pollution from      during the winter period. Their findings regarding the obser-
PM2.5 was attributed to traffic, 15 % to industrial activities,    vation of high PM2.5 concentrations during the evening and
20 % to domestic fuel burning, 22 % to unspecified anthro-         at night were consistent with a local heating source. In a later
pogenic sources, and 18 % to natural dust and salt. Regarding      study, RWC was analysed in a similar village and season in
northwestern, western, central and eastern, and southwest-         the same region (Glasius et al., 2008). The local contribution
ern Europe, they reported that domestic wood burning was           of RWC to PM2.5 corresponded to 10 % of ambient PM2.5 .

Atmos. Chem. Phys., 20, 4333–4365, 2020                                             www.atmos-chem-phys.net/20/4333/2020/
J. Kukkonen et al.: Influence of residential wood combustion on PM2.5                                                          4335

   Moreover, Saarnio et al. (2012) reported that the average         2.1     The considered cities, regions and measurement
contributions of RWC to ambient PM2.5 concentrations in                      networks
the Helsinki Metropolitan Area (HMA) ranged from 18 %
to 29 % at two urban sites and from 31 % to 66 % at two              The locations of the selected cities and the domains are pre-
suburban sites during various periods within the colder half         sented in Fig. 1. The considered domain sizes were selected
of the year. Local wood combustion sources were reported             mainly based on the sizes of the cities and their surround-
to be especially responsible for the increased concentrations        ing metropolitan areas; the domain is therefore largest for
at suburban sites. Hellén et al. (2017) observed that the lo-        Copenhagen and smallest for Umeå.
cal emissions from residential wood combustion caused high             The geographical locations and the air quality measure-
benzo(a)pyrene (BaP) and levoglucosan concentrations in              ment stations addressed in this study are presented in
the HMA. The BaP concentrations exceeded the European                Figs. 2a–d. All the considered cities are located either on the
Union target value for the annual average concentrations             coast or in the immediate vicinity of the coast of the Baltic
(1 ng m−3 ) in certain suburban detached-house areas.                Sea. Characterisations of the geographical regions and cli-
   Some studies have also specifically addressed particulate         mates of the cities have been presented in Appendix A.
carbonaceous matter from wood burning (Genberg et al.,
2011; Yttri et al., 2011; Szidat et al., 2009; Helin et al., 2018;   2.1.1    Concentration measurement networks
Aurela et al., 2015).
   The overarching aim of this article is to evaluate the in-        Concentration measurements for Umeå
fluence of RWC within urban regions on air quality in four
Nordic cities, i.e. Copenhagen, Helsinki, Oslo and Umeå.             For Umeå, we took into consideration both long-term mea-
The more specific objectives include, first, to present and          surements and the results of a measurement campaign. The
inter-compare the methodologies for evaluating the emis-             long-term measurements were conducted from 2006 to 2011
sions and dispersion of fine particulate matter originating          at two sites in the city of Umeå (Västra Esplanaden and Bib-
from RWC in four Nordic cities. Second, we aim to com-               lioteket). The site of Västra Esplanaden is classified as an
pare the predicted concentrations with the available air qual-       urban traffic site; it is a roadside station located in a street
ity measurements. Third, we intend to present and analyse            canyon with relatively dense traffic. The site of Biblioteket
numerical results on the PM2.5 concentrations. In particu-           is classified as an urban background site; it is located on a
lar, we will quantify the influence of RWC in urban regions          rooftop in central Umeå. The long-term measurements were
on the PM2.5 concentrations. We will also report and evalu-          conducted using TEOM 1400A (Thermo Fisher Scientific,
ate the current regulations regarding the emissions and con-         Waltham, MA, USA).
centrations from RWC. This article presents a systematic as-            A monitoring campaign was also carried out to evaluate
sessment of the influences of RWC on air quality in several          the performance of the modelling approach (Omstedt et al.,
Nordic cities for the first time.                                    2014). The measurements were carried out in the villages
                                                                     of Sävar, Vännäs, and Vännäsby, situated in the vicinity of
                                                                     Umeå, and at Tavleliden, located in the southernmost out-
2   Methods                                                          skirts of the city. The stations of Sävar, Vännäs, Vännäsby
                                                                     and Tavleliden are classified as residential sites.
This study focuses on three Nordic capital regions, Oslo,
                                                                        All monitoring campaign measurements of PM2.5 were
Helsinki, and Copenhagen, and one smaller city, including its
                                                                     carried out using filter collection. For Sävar and Vännäsby,
neighbouring area, Umeå. Our aim was to investigate greater
                                                                     the filters were changed on a daily basis, and for Tavleliden
capital or urban areas, instead of solely focusing on the areas
                                                                     and Vännäs they were changed at weekly intervals. The anal-
of the cities. For instance, we address the Helsinki Metropoli-
                                                                     ysis of the filters was gravimetric (weighting before and after
tan Area, which contains four separate cities. However, for
                                                                     measurements under standardised conditions).
simplicity, we chose to refer in the following to the capital
regions simply as Oslo, Helsinki and Copenhagen.
                                                                     Concentration measurements for Helsinki
   Umeå was selected instead of the Swedish capital due to
lack of detailed information about the influence of RWC in
                                                                     For this study, we have selected three measurement stations
Stockholm. This article presents the results for 1 year for
                                                                     that mainly represent the influence of RWC in residential ar-
each city. The target years are 2011 for Umeå, 2013 for
                                                                     eas (Vartiokylä, Tapanila and Kauniainen) and three stations
Helsinki and Oslo, and 2014 for Copenhagen.
                                                                     that represent either pollution originating from vehicular traf-
   We have addressed the contributions of RWC originating
                                                                     fic in the centre of Helsinki (Mannerheimintie) or at smaller
from sources within the target urban regions. Clearly, a frac-
                                                                     regional urban centres within the Helsinki Metropolitan Area
tion of the regional background is also originated from RWC
                                                                     (Leppävaara and Tikkurila). In addition, we have selected
that is located outside the considered urban regions.
                                                                     two stations that represent urban (Kallio2) and regional back-
                                                                     ground (Luukki). All the PM2.5 monitors were equivalent ref-

www.atmos-chem-phys.net/20/4333/2020/                                                 Atmos. Chem. Phys., 20, 4333–4365, 2020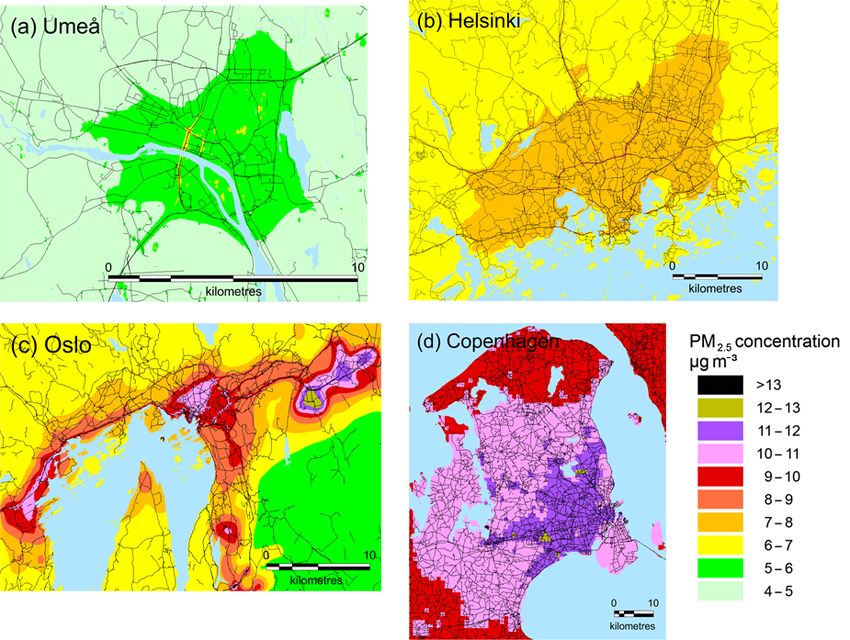
4336                                                   J. Kukkonen et al.: Influence of residential wood combustion on PM2.5

Figure 1. The locations of the selected cities and domains. The physical sizes of the domains have been indicated in the inserted smaller
maps.

erence instruments (i.e. TEOM 1400AB, SHARP 5030, FH                   Inter-comparison of the measurement networks in the
62 I-R and Grimm 180).                                                 target cities

Concentration measurements for Oslo                                    Generally, the locations of the stations in the target cities
                                                                       have been selected using similar or the same criteria (accord-
All the available monitoring stations in Oslo in 2013 were             ing to the European Union directives and guidance). For each
classified as either urban or suburban traffic, or urban back-         target city, we have selected regional and urban background
ground. There were no stations originally designed to mea-             stations and urban traffic and RWC stations. Stations repre-
sure the influence of residential combustion; however, sev-            senting all of these categories were available for all the cities.
eral stations were influenced by pollution from RWC.                      However, in the case of Oslo, the official categorisation of
   At all the considered monitoring stations in Oslo, PM2.5            the stations did not include any RWC stations. We have there-
is measured by continuous monitors and logged with a time              fore selected a few urban stations in Oslo, which we consid-
resolution of 1 h. All monitors are equivalent reference in-           ered to be most representative for the pollution attributed to
struments (i.e. TEOM 1400A, TEOM 1405DF-FDMS and                       RWC, to stand for RWC in this study.
Grimm-EDM180).
                                                                       2.2   Emission inventories for the target cities
Concentration measurements for Copenhagen
                                                                       The assessment of emissions located within the target cities
The Danish Air Quality Monitoring Network includes five                is addressed in this section. The regional- and continental-
measuring sites in close vicinity of Copenhagen. There are             scale emissions are discussed in the context of regional dis-
three sites in central Copenhagen: two street sites and one            persion modelling. We first present an overview and sum-
urban background site. We have also used data measured at              mary of the emission modelling both for RWC and for all
a suburban site of Hvidovre, located outside of Copenhagen,            the other urban sources. More detailed descriptions of the as-
and at a regional background site in a rural area at Risø. The         sessment of RWC emissions are presented in the following
PM2.5 observations were performed using the Low-Volume                 section.
Sampling reference method.

Atmos. Chem. Phys., 20, 4333–4365, 2020                                                  www.atmos-chem-phys.net/20/4333/2020/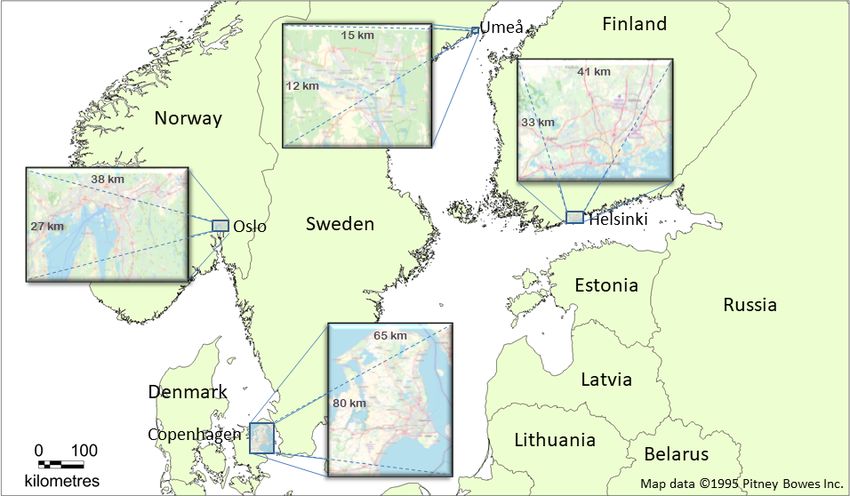
J. Kukkonen et al.: Influence of residential wood combustion on PM2.5                                                                    4337

Figure 2. The geographical locations of the cities and the air quality measurement stations for (a) Umeå, (b) Helsinki, (c) Oslo and (d) Copen-
hagen. The panels represent the locations of the stations in 2011 for Umeå, 2013 for Helsinki and Oslo, and 2014 for Copenhagen, respec-
tively. The most densely populated central areas of the cities are shown with a light mauve colour. Notation for the stations is as follows.
(a) Umeå: (1) Biblioteket, (2) Västra Esplanaden, (3) Sävar, (4) Tavleliden, (5) Vännäsby, (6) Vännäs. (b) Helsinki: (1) Kallio, (2) Tikkurila,
(3) Mannerheimintie, (4) Leppävaara, (5) Vartiokylä, (6) Tapanila, (7) Kauniainen, (8) Luukki. (c) Oslo: (1) Sofienbergparken, (2) Grøn-
land, (3) Skøyen, (4) Bekkestua, (5) Vigernes, (6) Alnabru, (7) Rv4 Aker Sykehus, (8) Manglerud, (9) Kirkeveien, (10) Bygdøy Alle,
(11) Hjortnes, (12) Smestad, (13) Eilif Dues vei. (d) Copenhagen: (1) HCØ, (2) HCAB, (3) JGTV, (4) Hvidovre, (5) Risø. © OpenStreetMap
contributors 2019. Distributed under a Creative Commons BY-SA License.

2.2.1   Overview of the emission inventories                              (iii) the spatial distribution of the emissions. In the case of
                                                                          Umeå, Helsinki and Copenhagen, various national or local
                                                                          register data have also been used.
An overview of the emission inventories regarding RWC is                     Information about the combusted wood is subsequently
presented in Table 1. In all the cities, the emissions inventory          combined with the corresponding emission factors. The
from RWC was based on (i) surveys regarding the amounts                   assessment of emission factors has been based on either
and use of wood stoves, boilers, and other relevant appli-                on national measurements (Oslo) or a combination of na-
ances; (ii) national or literature-based emission factors; and

www.atmos-chem-phys.net/20/4333/2020/                                                       Atmos. Chem. Phys., 20, 4333–4365, 2020
4338                                                        J. Kukkonen et al.: Influence of residential wood combustion on PM2.5

Table 1. Assessment of the emissions of PM2.5 that originated from RWC and their spatial resolution in the target cities.

                                Umeå                         Helsinki                   Oslo                       Copenhagen
    Data and information         (i) Survey on the            (i) Survey concern-        (i) Survey regarding       (i) Survey of unit
    sources regarding the            amounts      of              ing the amount             the amount and             consumption
    use of wood for com-             wood stoves and              of wood com-               temporal      vari-        and age for dif-
    bustion as well as com-          boilers and the              busted,     types          ability of wood            ferent types of
    bustion appliances               habits of wood               and amounts of             combusted com-             residences
                                     combustion.                  fireplaces,   and          piled by Statistics    (ii) Register     data
                                 (ii) Register     data           habits of wood             Norway                      of the location
                                      gathered by chim-           combustion for                                         of     appliances
                                      ney sweepers                detached      and                                      from     chimney
                                                                  semi-detached                                          sweepers
                                                                  houses
                                                                                                                   (iii) Danish     energy
                                                              (ii) Regional     ba-                                      statistics    and
                                                                   sic register for                                      building      and
                                                                   dwellings                                             dwelling register
                                                                                                                   (iv) Spatial distribu-
                                                                                                                        tion is evaluated
                                                                                                                        by the SPREAD
                                                                                                                        model (Plejdrup
                                                                                                                        et al., 2016)

    Assessment of emis-         Combination of results       Combination of results     National measurements      Combination of results
    sion factors                from national mea-           from national mea-         reported by Haakonsen      from the EMEP/EEA
                                surement programmes          surement programmes        and Kvingedal (2001)       Guidebook (European
                                and available literature     and available literature                              Environment Agency,
                                (Omstedt et al., 2014)       (Kaski et al., 2016;                                  2016) and national
                                                             Savolahti et al., 2016)                               measurements
    Spatial resolution of the   Appliances          were     100 × 100 m2               1 × 1 km2                  1 × 1 km2
    predicted emissions of      treated as point sources.
    PM2.5
    Basis for spatial alloca-   Geocoded addresses of        Average wood use for       The amount of wood         Average wood con-
    tion of emissions, i.e.     combustion appliances        houses with different      consumed in the dis-       sumption in different
    gridding                    based on a survey and        primary heating meth-      tricts in Oslo based on    types of houses and
                                chimney sweeper regis-       ods; the location of the   a survey carried out by    the location of the
                                ter                          houses is taken from       Statistics Norway          appliances based on
                                                             the local building and                                chimney sweepers reg-
                                                             dwelling register                                     ister; the locations of
                                                                                                                   houses are taken from
                                                                                                                   the Danish building and
                                                                                                                   dwelling register
    Basis for temporal allo-    Measured local contri-       Information gathered in    Based on a survey car-     Temporal profile eval-
    cation of emissions         butions of the concen-       questionnaires (Kaski      ried out by Statistics     uated by Friedrich and
                                trations of PM2.5 as a       et al., 2016)              Norway                     Reis (2004)
                                proxy variable

tional measurements and results from the available literature               on the ambient temperature. In the case of Oslo, the varia-
(Umeå, Helsinki and Copenhagen). All measurements that                      tion in emissions on the ambient temperature has also been
were used for the assessment of emission factors were based                 taken into account, based on measured weekly average am-
on methodologies using cooled flue gases and dilution cham-                 bient temperatures.
bers.                                                                          In the inventory for Umeå, the individual RWC sources
   Clearly, the RWC emissions are dependent on the tem-                     were treated separately. For the other cities, the computed
poral variation in the meteorological conditions, especially                RWC emissions have been gridded on various spatial resolu-

Atmos. Chem. Phys., 20, 4333–4365, 2020                                                        www.atmos-chem-phys.net/20/4333/2020/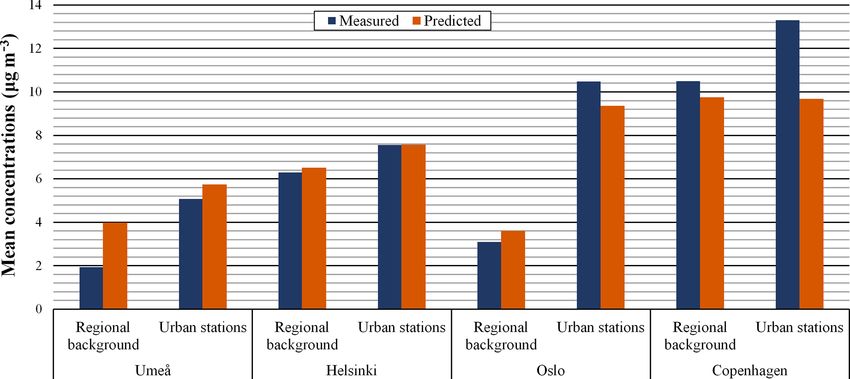
J. Kukkonen et al.: Influence of residential wood combustion on PM2.5                                                              4339

tions from 100 × 100 m2 (Helsinki) to 1 × 1 km2 (Oslo and          The survey included also an air quality monitoring campaign.
Copenhagen).                                                       Based on the register data gathered by the chimney sweep-
   An overview of the emission inventories for the other rele-     ers, we selected a representative sample of 178 houses with
vant source categories is presented in Table 2. Vehicular traf-    a stove or a boiler. A total of 176 houses were willing to par-
fic exhaust emissions have been included for all the cities.       ticipate in the survey; these households were subsequently
The suspension emissions originating from vehicular traffic        visited. The residents were interviewed using a form with
have been included for Umeå, Helsinki and Oslo. The emis-          questions mainly regarding the type of stove or boiler, the
sions from shipping have been included for Umeå, Oslo and          principal type of heating, biofuel consumption, biofuel type,
Copenhagen. In the case of Helsinki, Kukkonen et al. (2018)        combustion habits, and the actions taken to reduce energy
presented a detailed analysis regarding the contribution of        consumption.
shipping on the PM2.5 concentrations based on computations            A bottom-up inventory was made of the amounts of wood
for a 3-year period. They found that the contribution of ship-     stoves and boilers based on (i) the above-mentioned sur-
ping, including harbour activities, to the ambient air PM2.5       vey on the habits of wood consumption and combustion and
concentrations varied from 10 % to 20 % near major har-            (ii) register data that had been gathered by the local chimney
bours to a negligible contribution in most other parts of the      sweepers. In combining these two information sources, we
metropolitan area.                                                 have extended the information of the above-mentioned sur-
   However, the emission inventories for source categories         vey to the whole building stock, i.e. we have assumed that the
other than RWC were not the main focus of this article. Their      habits of wood consumption and combustion are the same in
more detailed descriptions have therefore been presented in        the households that were not included in the survey as well.
Appendix B.                                                           The inventory was compiled in Västerbotten county in
                                                                   2009. This dataset includes information about the types of
2.2.2   Detailed descriptions of the assessment of                 equipment, such as boilers (wood or oil), stoves, pellet boiler,
        emissions from RWC                                         and open fireplaces, and their geocoded addresses. A total of
                                                                   more than 54 thousand appliances were identified within the
For the estimation of the emissions of wood combustion,            county. About 23 % of them were wood boilers, 10 % pellet
one needs to know numerous factors, including (i) the spa-         boilers, 64 % stoves and 3 % oil boilers.
tial distributions of the various categories of buildings using       We estimated the amounts of combusted wood and the
wood combustion; (ii) the amounts and distribution of fire-        emission factors based on dilution chamber experiments by
wood used; (iii) the shares of primary and secondary heating       Omstedt et al. (2014). Separate emission factors were used
sources; (iv) the amounts of wood used and the numbers of          for (i) wood-, (ii) pellet-, and (iii) oil-fuelled boilers; (iv) fire-
boilers, stoves, fireplaces, sauna stoves, and other heating de-   places and stoves; and (v) summer houses and cottages.
vices; and (v) the emission factors for the different types of        The temporal variations in the emissions originating from
heating devices (Kukkonen et al., 2018).                           wood combustion were evaluated using the measured local
   The information about the use of wood and the heating           contributions of the concentrations of PM2.5 as a proxy vari-
device technologies is mostly based on surveys. Moreover,          able. The local contributions of the PM2.5 concentrations
in cases where the survey year and the study year are not          were estimated by subtracting the modelled regional back-
the same, the information about the changes of technologies        ground concentration from the local measurements. All mea-
and fuels in time is also needed. There are also other factors     surement stations used for these estimations were located in
that may have a substantial influence on the assessment of         areas with a substantial amount of RWC.
RWC emissions, which are commonly estimated in a simpli-
fied manner, or even neglected in evaluating the emissions of
                                                                   The assessment of emissions from RWC for Helsinki
RWC (e.g. Savolahti et al., 2016). These include (i) the com-
positions of wood fuels, e.g. their humidity, the tree species,
and the pre-processing and storage of wood, and (ii) the vari-     Emissions from RWC were based on an emission inventory
ations in the habits and procedures of combustion (Kukko-          for the years 2013–2014, including the spatial and tempo-
nen et al., 2018). For these reasons, the uncertainties in the     ral variation in emissions. We estimated the amount of wood
RWC emission estimates of PM2.5 are commonly higher than           combusted in 12 different fireplace types and the procedures
those for most other major emission source sectors (e.g. Kar-      and habits for the combustion by using a questionnaire. Its re-
vosenoja et al., 2018).                                            sults were applied for all detached and semi-detached houses
                                                                   in the area.
The assessment of emissions from RWC for Umeå                         The spatial distribution of the emissions was based on
                                                                   average wood use per combustion appliance type for each
A survey regarding the habits of wood consumption and              main heating method of a house based on the questionnaires
combustion was carried out in four areas in 2013, which in-        (Kaski et al., 2016). The emissions were allocated to the loca-
cluded a recently constructed suburb and three small towns.        tion of the houses available in the local building and dwelling

www.atmos-chem-phys.net/20/4333/2020/                                                Atmos. Chem. Phys., 20, 4333–4365, 2020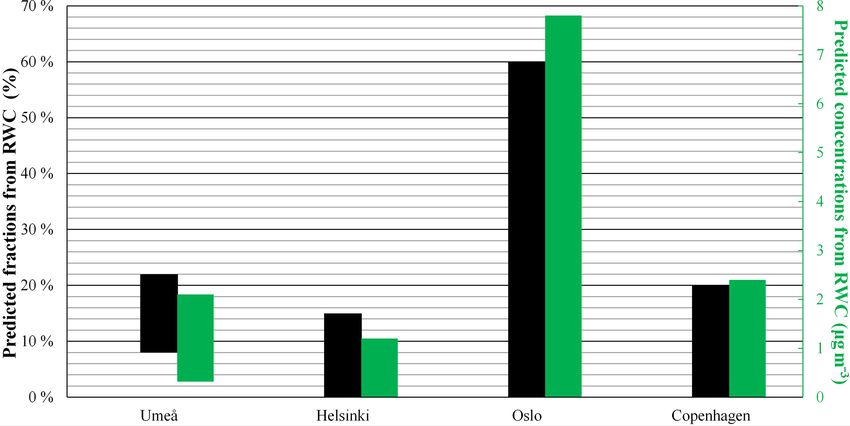
4340                                                       J. Kukkonen et al.: Influence of residential wood combustion on PM2.5

Table 2. Assessment of the traffic flows and emissions from vehicular traffic and other source categories (except for RWC) in the target cities.

                                             Umeå                      Helsinki                  Oslo                      Copenhagen
 Vehicular traffic flows   Vehicular traf-   Traffic flow model        Traffic flow model        Traffic flow    model     National      GIS-based
 and emissions             fic flows         EMME/2 and mea-           EMME/2 and mea-           RTM23+                    road network and traffic
                                             sured data                sured data                                          database. The spatial
                                                                                                                           distribution is done by
                                                                                                                           the SPREAD model
                           Vehicular ex-     Emission        factors   The LIPASTO emis-         NILUs traffic emission    The SPREAD emission
                           haust emissions   by     Hausberger    et   sion model                model                     model (for the Danish
                                             al. (2009)                                                                    area)
                           Vehicular         Resuspension model by     The     FORE   traffic    The NORTRIP traffic       Not included
                           suspension        Omstedt et al. (2005)     suspension   emission     suspension emission
                           emissions                                   model (Kauhaniemi et      model (Denby et al.,
                                                                       al., 2011)                2013)
 Shipping emissions                          Modelled         using    Not included in the       Based    on      López-   An updated version of
                                             SHIPAIR       (Segers-    modelling                 Aparicio et al. (2017b)   the AIS-based inven-
                                             son, 2014)                                          and US EPA (2009)         tory for Denmark (Ole-
                                                                                                                           sen et al., 2009)
 Other sources                               National compilation of   Not included in the       Industrial  emissions     Fugitive    emissions
                                             emissions originating     modelling                 and emissions from        from fuels and emis-
                                             from off-road machin-                               off-road mobile com-      sions from industrial
                                             ery and major point                                 bustion                   processes, agriculture,
                                             sources in Sweden                                                             and waste modelled by
                                                                                                                           SPREAD

register, and the emissions were allocated to the 100×100 m2               amount of wood combusted was collected based on the sur-
grid.                                                                      vey in terms of the type of technology, i.e. open fireplace,
   The temporal variation (monthly, weekly, hourly) of emis-               wood stove produced before 1998 and wood stove produced
sions was estimated based on the information gathered in                   after 1998.
questionnaires (Kaski et al., 2016). The temporal variation                   The emission factors were extracted from Haakonsen and
was estimated separately for three different source cate-                  Kvingedal (2001), which were based on a review of the re-
gories: heating boilers, sauna stoves, and other fireplaces.               sults from different tests for various fireplaces in Norway.
However, the information was not sufficient to quantitatively              Separate emission factors were used for conventional wood
model the influence of meteorological variables on the emis-               stoves, certified wood stoves and open fireplaces.
sions.                                                                        The seasonal variations in emissions were taken into ac-
   The emission factors for different types of fireplaces were             count by modelling their variation using their dependency
adopted based on the results of national measurement pro-                  on the ambient temperature based on observed weekly av-
grammes and the literature (Kaski et al., 2016; Savolahti                  erage ambient temperatures. The weekly mean temperatures
et al., 2016). The spatial distribution of RWC emissions                   measured at the station of Blindern in 2013 were used in the
was based on the regional basic register for dwellings, pro-               parameterisation.
vided by the Helsinki Region Environmental Services Au-
thority; this register contains information about primary heat-            The assessment of emissions from RWC for Copenhagen
ing methods.
                                                                           A survey was conducted regarding the unit consumption of
                                                                           wood and age of different types of residences by the Danish
The assessment of emissions from RWC for Oslo
                                                                           Technological Institute in 2015. A distinction was made be-
                                                                           tween villas, apartments and allotments that were either con-
The RWC emissions were estimated based on a bottom-up                      nected or unconnected to district heating. The survey also in-
approach by using the data of a dedicated survey. The survey               cluded information about the age of the appliance, distributed
was carried out by Statistics Norway; its aim was to assess                into four age categories. For RWC in the Copenhagen area,
the use of wood combustion and heating habits in Oslo. The                 detailed data were also used on the location of the appliances
results of the survey include information about the amount                 based on the chimney sweeper register data for Copenhagen
of wood consumed in the districts in Oslo, and informa-                    in 2015.
tion on how the wood combustion varies temporally in terms
of weeks, days and hours of the day. Information about the

Atmos. Chem. Phys., 20, 4333–4365, 2020                                                         www.atmos-chem-phys.net/20/4333/2020/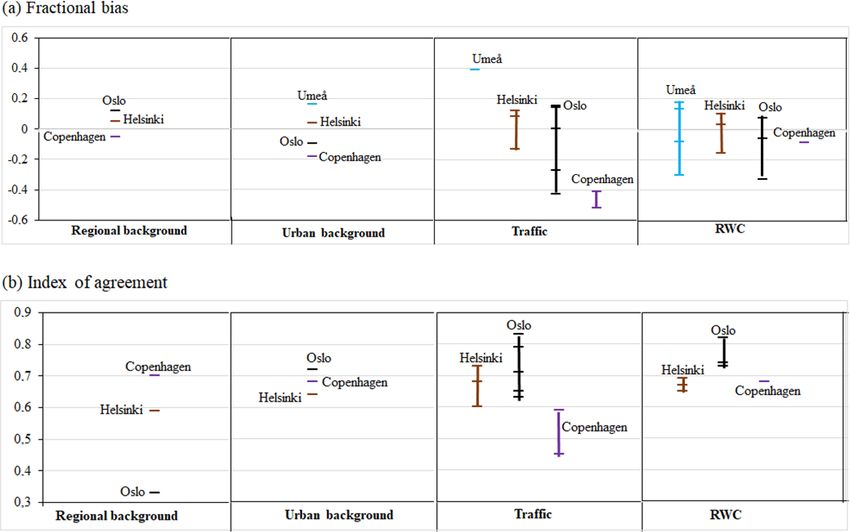
J. Kukkonen et al.: Influence of residential wood combustion on PM2.5                                                        4341

   The assessment of the emissions for the Danish area were         2.3.1   Overview of dispersion modelling
based on the SPREAD model. The SPREAD model is an in-
tegrated database system for high-resolution (1 km × 1 km)          An overview of the dispersion modelling has been presented
spatial distribution of emissions (Plejdrup et al., 2016). The      in Table 3. The assessment of the regional background con-
SPREAD model includes emission distributions for each sec-          centrations was based on chemical transport modelling in all
tor in the Danish emission inventory system. In this study,         the cities, except for Umeå, for which the assessment of the
the emission factors included in this national inventory were       regional background was based on a combination of mea-
used (Nielsen et al., 2017). These were based on emission           sured data and the results of regional background modelling.
factors of the EMEP/EEA Guidebook (European Environ-                For the urban-scale assessments, multiple-source Gaussian
ment Agency, 2016) and national measurements.                       modelling systems were used for all the cities. As the focus
   The emission inventory for RWC was also based on                 on this study was on RWC, the dispersion in street canyons
wood consumption information taken from the Danish en-              was modelled only for one street canyon measurement sta-
ergy statistics. The spatial distribution of RWC emissions          tion in Umeå. The spatial resolutions of the modelling of the
was based on the Danish building and dwelling register,             dispersion originating from RWC ranged from a couple or
which includes information about building use and on pri-           a few tens of metres (Oslo, Umeå) to 100 m (Helsinki) and
mary and secondary heating installations.                           1 km (Copenhagen).
                                                                       Chemical reactions were included in the regional-scale
                                                                    computations for all the cities. However, chemical reactions
2.2.3    Inter-comparison of the emission inventories in            and aerosol transformation processes were not included in
         the target cities                                          the urban-scale computations. However, it has previously
                                                                    been shown that gas-to-particle transformation reactions do
For all target cities, we have included the most important          not have a major influence on the annual average PM2.5 con-
emission source categories. The emissions from vehicular            centrations in Nordic cities on urban distance scales (Kukko-
traffic exhausts and RWC have been included for all the             nen et al., 2016; Karl et al., 2016). The impacts of aerosol
cities, and the suspension emissions originating from vehicu-       processes (such as nucleation, condensation and evaporation,
lar traffic were included for all cities except for Copenhagen.     and coagulation) on the annually averaged PM2.5 concentra-
In the case of Copenhagen, traffic suspension emissions have        tions have been found to be minor, although these can be
only a minor importance, mainly due to the fact that stud-          significant in specific dispersion conditions and for the finer
ded tires are not used, in contrast with the other target cities.   aerosol modes (Karl et al., 2016; Pohjola et al., 2007).
The emissions from shipping have been included for all cities
except for Helsinki, as the contribution of shipping has previ-     2.3.2   Detailed descriptions of dispersion modelling
ously been found to have a relatively minor influence on con-
centrations of PM2.5 in that city (Kukkonen et al., 2018). In       For each domain, we first address the assessment of the re-
summary, we can evaluate that these omissions in the emis-          gional background concentrations and, second, the disper-
sion inventories will result only in minor uncertainties in the     sion of urban contributions to concentrations.
final results of this study.
   Based on previous studies, the uncertainties related to the      Atmospheric dispersion modelling for Umeå
estimation of RWC emissions were expected to be relatively
large compared to those for the other included source cat-          The regional background contribution was estimated based
egories. However, detailed high-resolution emission inven-          on the measured data from two regional background sta-
tories of RWC were available for all target cities. The emis-       tions (Bredkälen and Vindeln) and on the modelled spatial
sion inventories for RWC were based on similar, although not        concentration distributions. The stations of Bredkälen and
identical, methodologies in the target cities. In all the cities,   Vindeln are situated approximately 350 km to the west and
the inventories were based on surveys regarding the amounts         50 km northwest of Umeå, respectively. For the year 2013,
and use of relevant appliances, national or literature-based        to account for the influence of concentration gradients be-
emission factors, and the evaluations of the spatial distribu-      tween Umeå and the station of Bredkälen, we have added
tion of emissions.                                                  a contribution of 1.28 µg m−3 to the measured concentra-
                                                                    tions at Bredkälen, based on the computations by Omstedt
                                                                    et al. (2014). Similar yearly adjustments were also made for
2.3     Atmospheric dispersion modelling for the target
                                                                    the years 2006–2011, based on results from the atmospheric
        cities
                                                                    chemistry transport model MATCH and corrections using
                                                                    earlier measurements at the closer Vindeln station (Segers-
First, we present an overview and summary of the dispersion         son et al., 2017).
modelling, and, second, we present a more detailed descrip-            The larger spatial-scale meteorological values were ex-
tion of dispersion modelling in the target cities.                  tracted from the predictions of the Swedish version of the

www.atmos-chem-phys.net/20/4333/2020/                                                Atmos. Chem. Phys., 20, 4333–4365, 2020
4342 J. Kukkonen et al.: Influence of residential wood combustion on PM2.5
Table 3. Atmospheric dispersion modelling and its spatial resolution in the target cities.
Umeå Helsinki Oslo Copenhagen
Assessment of regional background Measured values at a Predictions of the Predictions of model Predictions of the hemi-
concentrations regional background regional- and global- ensemble using seven spheric chemical trans-
station scale chemical trans- regional-scale chemical port model DEHM
port model SILAM transport models
Urban-scale dispersion Residential Multiple-source Gaus- Multiple-source Gaus- Multiple-source Eule- Gaussian plume-in grid
modelling wood combus- sian model DISPER- sian model UDM-FMI rian model EPISODE model – Urban Back-
tion SION ground Model (UBM)
Vehicular Multiple-source Gaus- Roadside dispersion Multiple-source Eule- Gaussian plume-in grid
traffic for the sian model DISPER- model CAR-FMI rian model EPISODE, model – Urban Back-
whole city SION including sub-grid ground Model (UBM)
Gaussian line source
modelling
Vehicular traf- Street canyon disper- Street canyon mod- Street canyon mod- Street canyon mod-
fic in street sion model OSPM elling (OSPM) is elling was not included elling (OSPM) was
canyons included in the mod- in the modelling system included in the mod-
elling system but was elling system but was
not used in this study not used in this study
Spatial resolution Near the sources Vehicular traffic: from For the entire For the entire mod-
50 × 50 m2 at substan- 20 m in the vicinity modelling domain elling domain 1×1 km2
tial distances from the of traffic sources to 20 × 20 m2
sources 3 km2 500 m on the outskirts
of the area; RWC:
100 × 100 m2
numerical weather prediction model HIRLAM with a hori- as friction velocity, sensible heat flux, and boundary layer
zontal resolution of 22 km. The finer, mesoscale meteorolog- height. The model also includes a detailed description of
ical data for dispersion modelling was provided by the oper- plume rise and building downwash effects. The OML model
ational mesoscale analysis system Mesan (Häggmark et al., has previously been used to investigate the influence of wood
2000), which is based on an optimal interpolation technique. combustion on particulate matter concentrations in residen-
All available measurements from synoptic and automatic sta- tial areas in Denmark (Glasius et al., 2008) and in the north-
tions, radars, and satellites were analysed with hourly time ern part of Sweden (Omstedt et al., 2011). In cases where
resolution on an 11 × 11 km2 grid across northern Europe. sources are described using spatially gridded emissions, a
The following meteorological parameters were used: wind Gaussian model included in the Airviro air quality man-
speed and direction at a height of 10 m, ambient temperature agement system was applied (SMHI, 2017). Segersson et
and humidity at a height of 2 m, cloud cover, global radiation, al. (2017) presented a more detailed description of dispersion
and precipitation. Boundary layer parameters, such as fric- modelling methodology for other sources than RWC.
tion velocity, sensible heat flux and boundary layer height, The chimney height for RWC was set to 5 m and the effec-
were calculated using methods from van Ulden and Holtslag tive plume rise was then evaluated by the model depending
(1985), Holtslag et al. (1995) and Zilitinkevich and Mironov on meteorological conditions. The concentrations were com-
(1996). puted on a receptor grid that was different for the contribu-
The dispersion of pollutants from RWC and vehicular traf- tions from RWC and vehicular traffic.
fic were modelled using the Gaussian multiple-source disper- The OSPM model (Operational Street Pollution Model;
sion model DISPERSION (Omstedt, 1988). The DISPER- Berkowicz, 2000) can be used to estimate the dispersion and
SION model contains a Gaussian finite-length line source transformation of vehicular and urban background pollution
dispersion model. For point sources, the DISPERSION in a street canyon. In this study, the model was used to esti-
model includes a revised version of the Gaussian OML (Op- mate the concentrations at the considered street canyon mea-
erational Meteorological Air Quality model) point source surement station. The OSPM model was run twice, both with
model (Omstedt et al., 2011). For a more detailed description and without the influence of the surrounding buildings. The
of the model and its evaluation against experimental data, the difference between these two model computations is a mea-
reader is referred to Omstedt et al. (2011) and Gidhagen et sure for the concentration increment caused by the buildings.
al. (2013). This concentration difference was subsequently added to the
The dispersion parameters of the DISPERSION model values obtained by the urban background computations.
are continuous functions of boundary-layer parameters, such
Atmos. Chem. Phys., 20, 4333–4365, 2020 www.atmos-chem-phys.net/20/4333/2020/J. Kukkonen et al.: Influence of residential wood combustion on PM2.5 4343
Atmospheric dispersion modelling for Helsinki Overall, the model performance for predicting the PM2.5
concentrations has been either fairly good or good. For in-
stance, for the predicted and measured hourly concentrations
The regional background concentrations were computed us- at 18 sites in London, the medians of correlation, index of
ing the SILAM model (Sofiev et al., 2006, 2015) for the agreement and factor of two of all stations were 0.80 %,
European domain. A detailed description of these compu- 0.86 % and 74 %, respectively (Singh et al., 2014).
tations has been presented by Kukkonen et al. (2018). For The dispersion of RWC emissions was evaluated with the
this study, we selected four grid points of the SILAM com- Urban Dispersion Model of the Finnish Meteorological In-
putations that were closest to the Helsinki Metropolitan Area stitute UDM-FMI (Karppinen et al., 2000c). The model is a
(HMA) but outside the urban domain. We then computed an multiple-source Gaussian dispersion model for various sta-
hourly average of the concentration values at these four lo- tionary source categories (point, area and volume sources).
cations and used that value as the regional background for The modelling system has been evaluated against measure-
all the chemical components of particulate matter, except for ment data of urban measurement networks (e.g. Karppinen
mineral dust. In the case of mineral dust, we used the low- et al., 2000c; Kousa et al., 2001).
est hourly value within the four selected points. The latter In this study, the RWC emissions were treated as area
procedure was adopted to avoid potential double counting of sources of the size 100 m × 100 m. The height of the sources
occasional releases of dust originating from the considered was assumed to be equal to 7.5 m, including the initial plume
urban area. rise. This altitude was assumed to be the combined average
The meteorological input variables for the urban-scale height of detached and semi-detached houses and chimneys
modelling were based on synoptic weather observations from in the area.
the stations of Helsinki-Vantaa airport (18 km north of the
city centre) and Harmaja (marine station south of Helsinki), Atmospheric dispersion modelling for Oslo
radiation measurements of Helsinki-Vantaa, and sounding
observations from Jokioinen (90 km northwest of Helsinki) The regional background concentrations were extracted
for the year 2013. Measured meteorological data were anal- from the ensemble reanalysis that was comprised of seven
ysed using the meteorological pre-processing model of the regional-scale chemical transport models (Marécal et al.,
Finnish Meteorological Institute (MPP-FMI) adapted for ur- 2015): CHIMERE, EMEP, EURAD-IM, LOTOS-EUROS,
ban environment (Karppinen et al., 2000a). The MPP-FMI MATCH, MOCAGE and SILAM. Within this ensemble, the
model is based on the energy budget method of van Ulden models had a common framework in terms of meteorology,
and Holtslag (1985), and its output consists of hourly time se- chemical boundary conditions and emissions. However, the
ries of meteorological data needed for dispersion modelling, models have differences in terms of their aerosol represen-
including temperature, wind speed, wind direction, Monin– tations, chemistry schemes, physical parameterisations, and
Obukhov length, friction velocity, and boundary layer height. different implementations for use of the input data.
The same meteorological parameters were used for the whole The meteorological variables used as modelling input
HMA. were hourly measurements extracted from the data of the
For urban dispersion modelling, we used a roadside dis- meteorological stations in the simulated domain (the stations
persion model and a multiple-source Gaussian model. We did of Valle Hovin, Blindern, Alna, Tryvannshøgda and Kjeller).
not model dispersion in street canyons. All these stations are located within the Oslo municipality,
The urban-scale dispersion of vehicular emissions was except for the station of Kjeller, which is located at a dis-
evaluated with the CAR-FMI model (Contaminants in the tance of approximately 25 km to the northeast. The variables
Air from a Road – Finnish Meteorological Institute; e.g. related to wind and atmospheric stability were used as input
Kukkonen et al., 2001). The model is a Gaussian finite-length in a preprocessing diagnostic wind field model. The hourly
line source model, which computes an hourly time series of wind field data produced by the wind field model were input
the pollutant dispersion. The dispersion parameters are mod- to the urban-scale dispersion modelling.
elled as a function of Monin–Obukhov length, friction ve- The atmospheric dispersion modelling was done with
locity and boundary layer height. The modelling system con- the EPISODE model. This model is a combined three-
taining the CAR-FMI model has been evaluated against the dimensional Eulerian and Lagrangian air pollution disper-
measured data of urban measurement networks for gaseous sion model, which has been developed for urban- and local-
pollutants and particulate matter in the HMA, London and scale applications (Slørdal et al., 2003, 2008). The Eule-
Birmingham, UK (e.g. Karppinen et al., 2000b; Kousa et al., rian part of the model consists of a numerical solution of
2001; Kauhaniemi et al., 2008; Aarnio et al., 2016; Sokhi the atmospheric mass conservation equation of the pollutant
et al., 2008; Singh et al., 2014; Srimath et al., 2017), and species in a three-dimensional grid. The Lagrangian part con-
for gaseous pollutants against the results of a field measure- sists of separate sub-grid models for line and point sources.
ment campaign and other roadside dispersion models as well Topography has been included as input data in the regional-
(Kukkonen et al., 2001; Ottl et al., 2001; Levitin et al., 2005). scale modelling for the Oslo domain. The topography within
www.atmos-chem-phys.net/20/4333/2020/ Atmos. Chem. Phys., 20, 4333–4365, 20204344 J. Kukkonen et al.: Influence of residential wood combustion on PM2.5
the domain is defined on the Eulerian grid in terms of the Umeå, for which these were assessed based on both mea-
elevation above sea level. sured data and the results of chemical transport models. All
The line source model is an integrated Gaussian type of the applied chemical transport models for Copenhagen,
model, whereas the point source model is a Gaussian puff Helsinki and Umeå (DEHM, SILAM and MATCH) have
trajectory model. The EPISODE model has been used for previously been extensively evaluated against experimen-
a large number of applications, including the assessment of tal data. The regional background assessment for Oslo was
air quality and air pollution control measures in urban areas based on an ensemble of seven European models. The uncer-
(e.g. Sundvor and López-Aparicio, 2014), and in a forecast- tainties of the estimates on regional background are therefore
ing system for seven city regions in Norway. not expected to have a major influence on the results and con-
clusions of this study.
Atmospheric dispersion modelling for Copenhagen Multiple-source Gaussian modelling systems were used
for the urban-scale assessments in all target cities. All of
The Danish multiscale integrated model system THOR these modelling systems (DISPERSION, UDM-FMI and
(Brandt et al., 2001, 2003) has for this study been set up for a CAR-FMI, EPISODE and UBM) have previously been
domain over Greater Copenhagen. The system combines the widely used and analysed against measured data. However,
Danish Eulerian Hemispheric model (DEHM) and the Urban the spatial resolutions of the modelling of the dispersion var-
Background Model (UBM). ied between the cities, from tens of metres (in Helsinki and
The DEHM model (Christensen, 1997) is a chemistry Oslo) to 1 km (Copenhagen). These differences in resolution
transport model describing the concentration fields of 73 have to be taken into account in the interpretation of the re-
photochemical compounds (NOx , SOx , volatile organic com- sults.
pounds, NHx , CO, etc.) and nine classes of particulate matter
(e.g. PM2.5 , PM10 , TSP, sea salt, and fresh and aged black 2.4 Statistical model performance parameters
carbon). The regional model covers the Northern Hemi-
sphere, with higher resolution over Europe (50 km × 50 km), For simplicity, we have mainly considered two selected sta-
northern Europe (16.7 km×16.7 km) and Denmark (5.6 km× tistical model performance parameters: the index of agree-
5.6 km). The DEHM model has been extensively evalu- ment (IA) and the fractional bias (FB). The IA is a measure
ated (Brandt et al., 2012; Zare et al., 2014; Solazzo et al., of the agreement of the measured and predicted time series
2012a, b). of concentrations, and the FB is a measure of the agreement
The regional background concentrations were extracted of the longer-term (e.g. annual) average concentrations.
on a 5.6 × 5.6 km2 grid. The meteorological fields were The index of agreement is defined as follows (Willmott,
provided by the Weather Research and Forecasting (WRF) 1981):
Model (Skamarock et al., 2008) using the same do- Pn 2
i=1 (Pi − Oi )
mains as the DEHM model. The anthropogenic emissions IA = 1 − P 2 , (1)
n
for the regional modelling were based on a combina- i=1 Pi − Ō + Oi − Ō
tion of a number of emission inventories including the where n is the number of data points, and P and O refer
EMEP emissions for Europe in particular (http://www.ceip. to predicted and observed pollutant concentrations, respec-
at/webdab_emepdatabase/emissions_emepmodels/, last ac- tively. The overbar refers to an average value. Factor of 2 is
cess: 2 April 2020). Within the Danish area, the emissions defined as the fraction of data for which 0.5 ≤ P /O ≤ 2.
were based on the SPREAD emissions model. Temporal pro- Fractional bias is given by the following equation:
files of emissions, depending on the emission type, were in-
cluded. 2 P̄ − Ō
FB = , (2)
The Urban Background Model (UBM) is a Gaussian P̄ + Ō
plume model, including a simplified description of photo-
where P and O are the mean values of the predicted and
chemical reactions of NOx and ozone. The model was set up
observed values, respectively.
for the selected urban domain on a resolution of 1 × 1 km2 ,
and hourly background concentrations were provided by the
DEHM model. The UBM model has been used for assess- 3 Results
ments of air pollution in Denmark, e.g. as part of the Danish
AirGis system (Hvidtfeldt et al., 2018; Khan et al., 2019). First, the numerical predictions will be evaluated against
measured urban-scale data regarding the PM2.5 concentra-
2.3.3 Inter-comparison of the dispersion modelling in tions in the four target cities. Second, the predicted emissions
the target cities originating from RWC will be presented and analysed. Third,
the ambient air concentrations of PM2.5 and the contributions
The regional background concentrations were computed us- from RWC to these concentrations will be presented and dis-
ing chemical transport models for all the cities, except for cussed. We have also presented an overview of the regulatory
Atmos. Chem. Phys., 20, 4333–4365, 2020 www.atmos-chem-phys.net/20/4333/2020/J. Kukkonen et al.: Influence of residential wood combustion on PM2.5 4345
frameworks regarding RWC in four Nordic countries in Ap- tends to result in an under-prediction of the local influence of
pendix E. vehicular traffic. A better model performance was obtained
in a previous study for the street stations in Copenhagen,
3.1 Evaluation of the predicted concentrations against when the street pollution model OSPM was used (Khan et al.,
measured data 2019). For the finer-resolution computations for Helsinki and
Oslo, there is no substantial systematic difference between
The results of the model evaluation are summarised and re- the model performance at traffic stations compared with the
viewed in this section. The detailed model evaluation results corresponding RWC stations.
have been presented in Appendix C. The measured and predicted annual average concentra-
The ranges of values of two statistical parameters, index tions have been summarised in Fig. 4. Both the measured
of agreement (IA) and fractional bias (FB), for the daily av- and predicted concentration values are highest for Copen-
erage concentration values of PM2.5 values are presented in hagen, caused mainly by the relatively high regional back-
Fig. 3a–b. The IA is a measure of the agreement of the mea- ground contributions, compared with the other three cities.
sured and predicted time series of concentrations, whereas The concentrations are second highest for Oslo, mainly due
FB is a measure of the agreement of the average (annual or to substantial urban contributions. In the case of the compu-
during several months) values of the concentrations. In the tations for Denmark, the predicted regional background has
case of regional and urban background stations, we have se- been evaluated at the station of RISO; however, this station
lected one station for each city, whereas for traffic and RWC is not optimally representative for the regional-scale back-
stations, the range of values is shown by a vertical line, and ground of Copenhagen.
the value for each station is shown by short horizontal lines.
In the case of Umeå, the distributions of the temporal vari- 3.2 Emissions of PM2.5 originating from RWC
ations in the emissions originating from wood combustion
were evaluated using the measured concentrations of PM2.5 . The results of the emission inventories regarding RWC for
It was therefore not reasonable to perform an evaluation of PM2.5 have been presented in Fig. 5a–d.
the temporal variation in the predicted values for Umeå; this The results show that the emission values originating
would have required evaluating modelling that is partly based from RWC were the highest for the domains of Copenhagen
on the same experimental values. The IA values have there- and Oslo; these range from negligible to more than 5.0 or
fore not been presented for that city. 6.0 t (yr km2 )−1 in some limited areas in Oslo and Copen-
In the case of Oslo, there were no measurement stations hagen, respectively. The emission values within the domains
that would have been officially nominated by the local au- of Helsinki and Umeå reach up to a few tons per square kilo-
thorities as measuring the influence of RWC. We have there- metre per year.
fore selected the three stations that we considered to be most In the case of Helsinki and Copenhagen, the highest emis-
influenced by RWC. sion values of RWC were mainly located outside the city cen-
The results in Fig. 3a–b facilitate an assessment of model tres. In particular, in the Helsinki region, the highest emis-
performance in terms of the cities and the categories of the sions were detected in detached and semi-detached-house ar-
stations. The FB values are reasonably good, considered here eas; these were situated to the west, east and north of the
as the range from −0.20 to +0.20, for all the regional and centre of Helsinki. The detailed locations of these areas were
urban background values and for most of the traffic and RWC reported by Hellén et al. (2017). For Copenhagen, the high-
stations. However, for some of the traffic and RWC sites, the est emission strengths were also slightly outside the most
FB values are substantial, especially for two traffic stations densely built city centre; the highest concentrations were ob-
in Copenhagen (substantial under-prediction of the model), served in the suburban areas of Copenhagen.
one traffic station in Umeå (over-prediction), and two traffic In the Helsinki area, the buildings are mainly kept warm
and one RWC station in Oslo (under-prediction). In the case using an extensive district heating system, electricity heat-
of the stations in Copenhagen, the under-prediction is to be ing and/or geothermal heat pumps. However, these systems
expected, as we have applied an urban background model on have only a minor impact on the local air quality. The district
a spatial resolution of 1 × 1 km2 . heating is mainly produced in energy plants burning fossil fu-
The IA values are also fairly good, considered here as els; most of these plants have very high stacks. On the other
IA > 0.55, in most cases. The agreement of the time series hand, wood combustion is mainly used as a secondary heat-
of daily measured and modelled values is worse for the re- ing system in detached or semi-detached houses. In addition,
gional background values in Oslo and for one traffic station it is common to use fireplaces and sauna stoves in suburban
in Copenhagen. In particular, the IA values for the traffic detached houses. Wood combustion appliances were used in
stations are lower for Copenhagen, compared with the cor- approximately 90 % of the detached houses in the Helsinki
responding values in Helsinki and Oslo. This is due to the area in 2013. Helsinki was the only target city in which sauna
coarser spatial model resolution (1 × 1 km2 ) in Copenhagen, stoves were an important source of PM2.5 emissions. There is
compared with those in the other three target cities, which a high correlation between the spatial density of the detached
www.atmos-chem-phys.net/20/4333/2020/ Atmos. Chem. Phys., 20, 4333–4365, 2020You can also read