Intercomparison of biomass burning aerosol optical properties from in situ and remote-sensing instruments in ORACLES-2016 - Atmos. Chem. Phys
←
→
Page content transcription
If your browser does not render page correctly, please read the page content below
Atmos. Chem. Phys., 19, 9181–9208, 2019
https://doi.org/10.5194/acp-19-9181-2019
© Author(s) 2019. This work is distributed under
the Creative Commons Attribution 4.0 License.

Intercomparison of biomass burning aerosol optical properties from
in situ and remote-sensing instruments in ORACLES-2016
Kristina Pistone1,2 , Jens Redemann3 , Sarah Doherty4 , Paquita Zuidema5 , Sharon Burton6 , Brian Cairns7 ,
Sabrina Cochrane8 , Richard Ferrare6 , Connor Flynn9 , Steffen Freitag10 , Steven G. Howell10 , Meloë Kacenelenbogen2 ,
Samuel LeBlanc1,2 , Xu Liu6 , K. Sebastian Schmidt8 , Arthur J. Sedlacek III11 , Michal Segal-Rozenhaimer1,2 ,
Yohei Shinozuka12,2 , Snorre Stamnes6 , Bastiaan van Diedenhoven13,7 , Gerard Van Harten14 , and Feng Xu14
1 Bay  Area Environmental Research Institute, Moffett Field, CA, USA
2 NASA    Ames Research Center, Moffett Field, CA, USA
3 School of Meteorology, University of Oklahoma, Norman, OK, USA
4 JISAO, University of Washington, Seattle, WA, USA
5 University of Miami/Rosenstiel School of Marine and Atmospheric Science, Miami, FL, USA
6 NASA Langley Research Center, Hampton, VA, USA
7 NASA Goddard Institute for Space Studies, New York, NY, USA
8 University of Colorado, Boulder, CO, USA
9 Pacific Northwest National Laboratory, Richland, WA, USA
10 University of Hawaii at Manoa, Honolulu, HI, USA
11 Brookhaven National Laboratory, Brookhaven, NY, USA
12 Universities Space Research Association, Mountain View, CA, USA
13 Columbia University, Center for Climate System Research, New York, NY, USA
14 Jet Propulsion Laboratory, California Institute of Technology, Pasadena, CA, USA

Correspondence: Kristina Pistone (kristina.pistone@nasa.gov)

Received: 15 February 2019 – Discussion started: 20 February 2019
Revised: 8 June 2019 – Accepted: 11 June 2019 – Published: 18 July 2019

Abstract. The total effect of aerosols, both directly and on     present results from six of the eight independent instruments
cloud properties, remains the biggest source of uncertainty in   or instrument combinations, all applied to measure or retrieve
anthropogenic radiative forcing on the climate. Correct char-    aerosol absorption and single-scattering albedo. Most but not
acterization of intensive aerosol optical properties, particu-   all of the biomass burning aerosol was located in the free
larly in conditions where absorbing aerosol is present, is a     troposphere, in relative humidities typically ranging up to
crucial factor in quantifying these effects. The southeast At-   60 %. We present the single-scattering albedo (SSA), absorb-
lantic Ocean (SEA), with seasonal biomass burning smoke          ing and total aerosol optical depth (AAOD and AOD), and
plumes overlying and mixing with a persistent stratocumu-        absorption, scattering, and extinction Ångström exponents
lus cloud deck, offers an excellent natural laboratory to make   (AAE, SAE, and EAE, respectively) for specific case stud-
the observations necessary to understand the complexities of     ies looking at near-coincident and near-colocated measure-
aerosol–cloud–radiation interactions. The first field deploy-    ments from multiple instruments, and SSAs for the broader
ment of the NASA ORACLES (ObseRvations of Aerosols               campaign average over the month-long deployment. For the
above CLouds and their intEractionS) campaign was con-           case studies, we find that SSA agrees within the measurement
ducted in September of 2016 out of Walvis Bay, Namibia.          uncertainties between multiple instruments, though, over all
   Data collected during ORACLES-2016 are used to derive         cases, there is no strong correlation between values reported
aerosol properties from an unprecedented number of simul-        by one instrument and another. We also find that agreement
taneous measurement techniques over this region. Here, we

Published by Copernicus Publications on behalf of the European Geosciences Union.
9182 K. Pistone et al.: Biomass burning SSA intercomparison
between the instruments is more robust at higher aerosol tion (i.e., higher BC content) (e.g., Liu et al., 2014; Vakkari
loading (AOD400 > 0.4). et al., 2014; Pokhrel et al., 2016). Column-average SSA, as
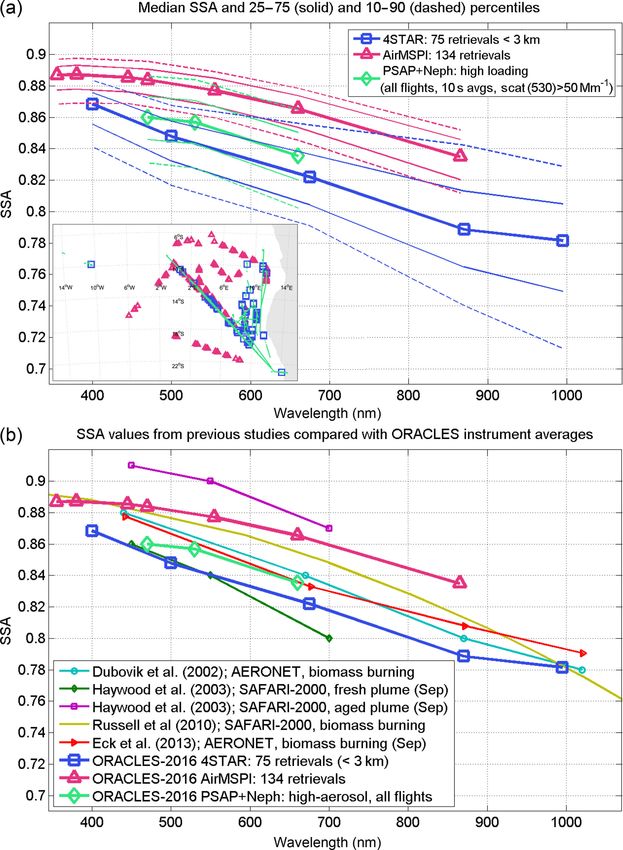
The campaign-wide average and range shows differ- discussed here, may be composed of contributions from sev-
ences in the values measured by each instrument. We eral different aerosol types. SSA, among other parameters,
find the ORACLES-2016 campaign-average SSA at 500 nm is essential for the determination of direct aerosol radiative
(SSA500 ) to be between 0.85 and 0.88, depending on the effects. SSA has been shown to evolve with BB plume loca-
instrument considered (4STAR, AirMSPI, or in situ mea- tion, age, mixing state, emission source, and distance from
surements), with the interquartile ranges for all instruments source (e.g., Haywood et al., 2003; Eck et al., 2013; Kono-
between 0.83 and 0.89. This is consistent with previous valov et al., 2017).
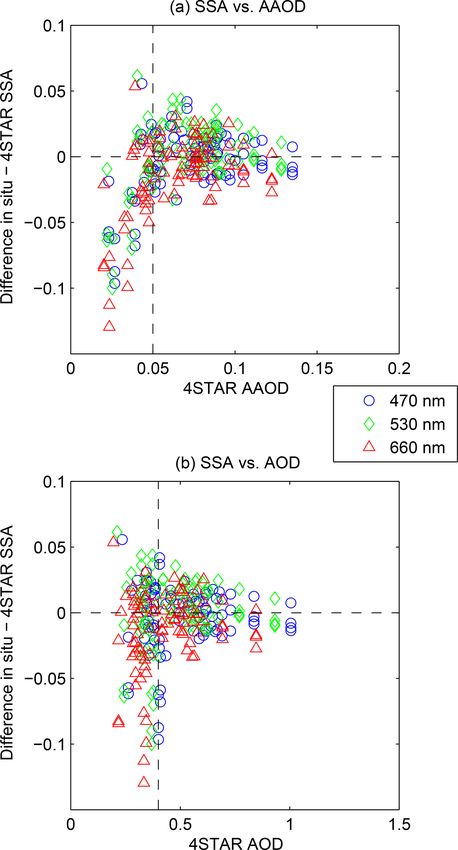
September values reported over the region (between 0.84 Other important parameters are the aerosol optical depth
and 0.90 for SSA at 550nm). The results suggest that the (AOD) and the absorbing component of AOD (AAOD, de-
differences observed in the campaign-average values may fined as AOD · (1 − SSA)), which indicate the magnitude of
be dominated by instrument-specific spatial sampling differ- the column (absorbing) aerosol loading. In the present work,
ences and the natural physical variability in aerosol condi- AODs from the different retrievals are presented to assess the
tions over the SEA, rather than fundamental methodological similarity between temporally and spatially dislocated scenes
differences. observed by the different instruments, and since the retrievals
of AOD and SSA are not necessarily uncoupled, AOD can
be a useful diagnostic. However, as we focus here on inten-
sive aerosol properties, the climatological AOD values are
1 Introduction not discussed. Finally, we discuss the Ångström exponents
from each retrieval method (AAE, SAE, and EAE for the ab-
Atmospheric aerosols are an important component of the cli- sorption, scattering, and extinction Ångström exponents, re-
mate system in terms of their direct, semi-direct, and indi- spectively). Ångström exponents are given by the log-space
rect radiative effects. A primary factor governing the over- slope of absorption, scattering, or extinction aerosol optical
all magnitude of these effects is the composition, size, mix- depths versus wavelength, and are frequently used to char-
ing state, and concentration (and, consequently, the radiative acterize atmospheric aerosol. As AAE is primarily (though
properties) of the aerosol in a given location. While, on the not entirely) determined by aerosol composition (Russell
global average, aerosols predominantly cool the planet by re- et al., 2010; Bahadur et al., 2012) and SAE is primarily as-
flecting sunlight back to space, shortwave-absorbing aerosols sociated with aerosol size, these parameters can be instruc-
(such as those from biomass burning sources) are also ca- tive in understanding the nature of the aerosol in question.
pable of warming the planet by directly absorbing sunlight EAE is shown as well, to place these results in the con-
(called the direct effect: Chylek and Coakley, 1974; Meyer text of other remote-sensing results which measure extinc-
et al., 2015; Zhang et al., 2016). Aerosols can additionally af- tion, though EAE closely follows SAE since extinction is
fect cloud properties by microphysical indirect effects affect- dominated by scattering for almost all atmospheric aerosols.
ing droplet size and lifetime (e.g., Twomey, 1974; Albrecht, Accurate representation of the magnitude and variability of
1989; McComiskey and Feingold, 2012; Lu et al., 2018); by these aerosol properties on a regional scale has significant
altering surface evaporation, cloud burn-off rates, and atmo- implications for aerosol radiative effects calculated using cli-
spheric dynamics, the so-called semi-direct aerosol effects mate models and/or satellite data. As different instruments
(e.g., Ackerman et al., 2000; Koch and Del Genio, 2010; (such as those incorporated into this work) may rely on dif-
Wilcox, 2010; Sakaeda et al., 2011; Wilcox, 2012; Gordon ferent physical measurement principles, each with different
et al., 2018); or by some combination of the above (e.g., Ade- considerations and limitations (Table 1), an understanding of
biyi and Zuidema, 2018; Brown et al., 2018). how distinct observations compare to one another is a critical
In this work, we focus on the aerosol single-scattering piece in gaining an understanding of our observational lim-
albedo (SSA), the ratio of aerosol scattering to total ex- itations for key parameters and hence in calculating aerosol
tinction. SSA is a key intensive property which relates to effects and their uncertainties.
the aerosol composition while being independent of the to- This paper presents data from the NASA ORACLES (Ob-
tal aerosol loading. Weakly absorbing or non-absorbing par- seRvations of Aerosols above CLouds and their intErac-
ticles such as sea salt will have SSA close to 1, whereas tionS) campaign (Zuidema et al., 2016), a multi-year, multi-
biomass burning (BB) smoke made up of more highly ab- platform collaboration to sample clouds and BB aerosol over
sorbing soot particles will have SSA less than 1. These BB the southeast Atlantic Ocean (SEA). During the 2016 ORA-
SSAs are typically observed to be between 0.7 and 0.95 (e.g., CLES deployment, two NASA aircraft (a P-3 and an ER-2)
Dubovik et al., 2002; Eck et al., 2013; Sayer et al., 2014), were flown with a suite of aerosol, cloud, radiation, and mete-
though laboratory studies show these values can be much orological instruments for remote-sensing and in situ obser-
lower under conditions of high modified combustion effi- vations. The remainder of this section gives a brief context of
ciencies and low organic (versus black carbon) mass frac- previous observations over this region (Sect. 1.1), their impli-
Atmos. Chem. Phys., 19, 9181–9208, 2019 www.atmos-chem-phys.net/19/9181/2019/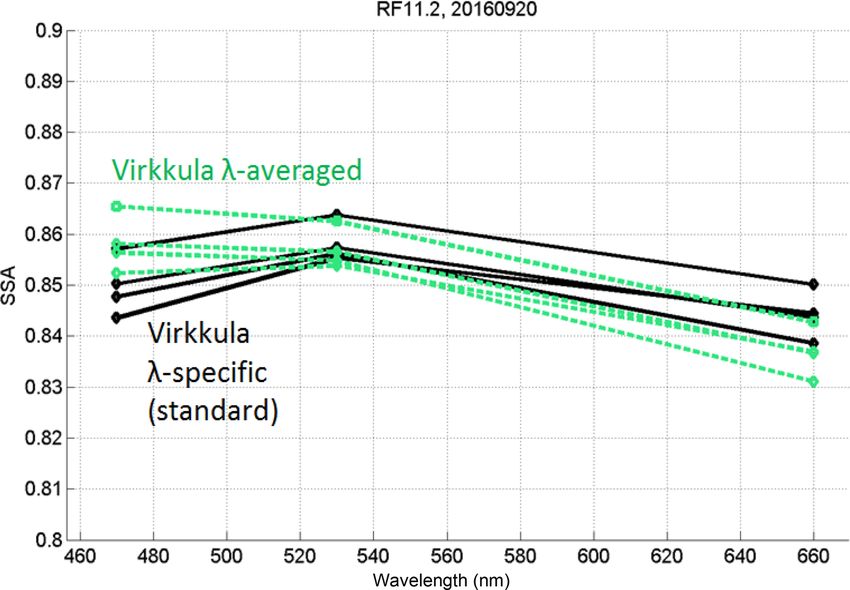
K. Pistone et al.: Biomass burning SSA intercomparison                                                                     9183

cations (Sect. 1.2) and an overview of the ORACLES cam-            aerosol properties as well as their relative geometry. In this
paign (Sect. 1.3). Section 2 describes data and methods used,      context, the ORACLES aircraft-based dataset, designed to
including the ORACLES instrumentation, flight paths, and           sample the region of highest cloud cover and BB smoke con-
comparison case criteria. Section 3.1 details two case stud-       centration, provides important and heretofore unique obser-
ies of the multi-instrument comparisons (in situ and remote-       vations of both aerosol and clouds over the southeast Atlantic
sensing instruments), and Sect. 3.2 presents campaign-wide         Ocean, due to both improved instrumentation since SAFARI-
comparisons of in situ versus remote-sensing measurements.         2000 and because ORACLES focused on regions farther off
Finally, in Sect. 4, we describe the broader picture of the        the southern African coast than previously measured.
average aerosol properties measured over the region during            The previous studies give a somewhat limited yet still
ORACLES-2016 and discuss how these results fit within the          useful view of the temporal and seasonal trends in SSA
context of previous observations. Additional considerations        for a limited set of locations within this region (Fig. 1). In
of the in situ data are provided in Appendix A.                    the SAFARI-2000 campaign, aircraft instrumentation was
                                                                   used to sample both the aged aerosol plume (a few days
1.1   SEA aerosol climatology                                      old) and fresh biomass aerosol (a few minutes old) over
                                                                   Namibia and the coastal SEA. The mean SSA of the aged
The SEA is a particularly important region in the context of       haze was reported by Haywood et al. (2003) as 0.91, 0.90,
understanding aerosol–radiation and aerosol–cloud interac-         and 0.87 at 450, 550, and 700 nm using a combination
tions. This region exhibits a persistent stratocumulus cloud       of an in situ aircraft-based Particle Soot Absorption Pho-
deck off the western coast of Africa. During the southern          tometer (PSAP) and nephelometer. However, Leahy et al.
African biomass burning season (August to October), these          (2007) reported a lower “best estimate” (campaign-average)
clouds are situated under and/or within plumes of absorb-          SSA550 nm of 0.85 ± 0.02 using the SAFARI airborne flux ra-
ing aerosols originating from widespread continental fires.        diometry and in situ measurements combined with ground-
The smoke is lofted in continental convection and then ad-         based AERONET retrievals; the individual flux radiometry
vected westward in the southerly branch of the African east-       estimate is described in Bergstrom et al. (2003) and Russell
erly jet at a typical altitude of 3–5 km in September (Adebiyi     et al. (2010) and included separately in Fig. 1. For a SAFARI
and Zuidema, 2016), which approximately coincides with             flight specifically targeting fresh biomass burning smoke, the
the observed plume altitude over the region. The composi-          reported SSA was lower, at 0.86, 0.84, and 0.80 (Haywood
tion of these aerosols (as reflected in the SSA parameter) can     et al., 2003). Thus, even within a single campaign, past work
change the magnitude and even the sign of the radiative forc-      has shown a sizable range in BB aerosol properties. It should
ing effects of aerosol over clouds (e.g., Chand et al., 2009;      be noted that the SAFARI over-ocean flights were conducted
Zuidema et al., 2016; Cochrane et al., 2019; Kacenelenbo-          within a more southern region (generally 15–25◦ S) than the
gen et al., 2019).                                                 heart of the seasonal aerosol plume typically described as
   Compared with other regions of the world, there have been       extending approximately 0–15◦ S (Zuidema et al., 2016).
relatively few studies measuring aerosol properties (micro-        The ORACLES sampling area spans both these latitude
physical or radiative) either directly over the southeast At-      ranges (0–25◦ S) but frequently sampled westward of the SA-
lantic or near their source in Sub-Saharan Africa. Nonethe-        FARI region. SAFARI also made many measurements over
less, there is still a good deal of previous work which can        the continent, closer to biomass burning sources, whereas
help to place the ORACLES observations in context. A key           the ORACLES measurements were made entirely over the
observational dataset is from the Southern African Regional        ocean. It is therefore likely that the SAFARI measurements
Science Initiative (SAFARI-2000) campaign which used air-          were of generally younger aerosol than the ORACLES mea-
craft to measure aerosol properties over and in close proxim-      surements, including the aerosol identified as “aged” within
ity to the coast of southern Africa in September 2000, includ-     Haywood et al. (2003).
ing both aged aerosol and fresh biomass plumes (e.g., Hay-            An AERONET-based climatology by Dubovik et al.
wood et al., 2003; Schmid et al., 2003; Leahy et al., 2007;        (2002) indicated that the African BB site (Zambia, 15◦ 150 S,
Russell et al., 2010). SAFARI-2000 also resulted in the es-        23◦ 090 E) had the lowest SSA (i.e., strongest absorption)
tablishment of several sites of the AErosol RObotic NET-           and the strongest SSA spectral dependence (i.e., steepest
work (AERONET) on the African continent; these allow for           slope, SSA440 nm = 0.88 to SSA1020 nm = 0.78) among the
longer-term climatological analysis near emission sources          four geographical BB regions considered. This was attributed
(e.g., Quéfacé et al., 2003; Magi and Hobbs, 2003; Swap            to the greater flaming versus smoldering characteristics of
et al., 2003; Eck et al., 2003, 2013). Passive and active satel-   these fires compared with other regions. Using data from
lite observations have also been used to detect and quantify       the same long-term AERONET site at Mongu, Zambia,
aerosol above clouds over the SEA region (e.g., Chand et al.,      Eck et al. (2013) found a seasonal progression of increas-
2008, 2009; Waquet et al., 2013; Jethva et al., 2014; Torres       ing full-column SSA (decreasing relative absorption) over
et al., 2012; Liu et al., 2015), though such studies typically     the July-to-November burning season based on data from
need to assume (through lookup tables or models) cloud and         1997 to 2005. SSA increased from SSA440 nm = 0.84 in July

www.atmos-chem-phys.net/19/9181/2019/                                              Atmos. Chem. Phys., 19, 9181–9208, 2019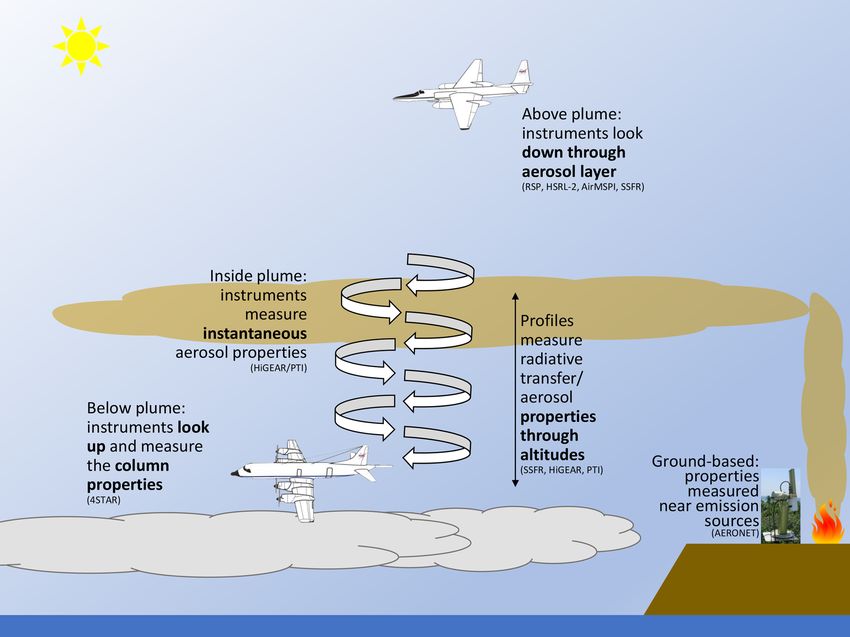
9184                                                                K. Pistone et al.: Biomass burning SSA intercomparison

to SSA440 nm = 0.93 in November (Fig. 1). This same pat-
tern was observed in a study of near-surface in situ SSA
measurements at Ascension Island, showing monthly mean
SSA529 nm increasing from 0.78 in August 2016 to 0.83 in
October 2016 (Zuidema et al., 2018). We note this site is
substantially westward (downwind) of the majority of ORA-
CLES flights and thus may represent more aged aerosol. Eck
et al. (2013) also reported an average September SSA similar
to that reported by Dubovik et al. (2002) for Zambia: 0.88,
0.83, 0.81, and 0.79 at 440, 675, 870, and 1020 nm, respec-
tively. They also showed that within a given month, a south-
to-north increase in SSA388 is observed, as derived from
the satellite-based OMI (Ozone Monitoring Instrument) re-
trievals. This was hypothesized to be due to shifts in fuel type
over the BB season due to both anthropogenic factors (i.e.,         Figure 1. Summary of average SEA/African BB SSA as reported
                                                                    in previous studies as described in the text. The spatial and method-
timing/practices of agricultural burning) and environmental
                                                                    ological variability can be noted from the Haywood et al. (2003)
factors (i.e., relating to moisture variability of potential fuel
                                                                    versus Russell et al. (2010) SAFARI-2000 results, and the seasonal
types throughout the season). Variations in atmospheric hu-         changes in SSA are seen in the Eck et al. (2013) monthly averages
midity have also been shown to affect aerosol optical prop-         from the Zambian AERONET site.
erties, including both aerosol scattering and absorption (e.g.,
Langridge et al., 2011; Lack and Cappa, 2010). Figure 1 sum-
marizes the previous work in this region and indicates that         tion of this magnitude encompasses only half the range be-
the SSA over southern Africa increases through the burning          tween the lowest and highest September SSA values shown
season (monthly averages from Eck et al., 2013), possibly           in Fig. 1. As described above, some of this range may reflect
due to changes in biomass burning fuel composition, and             seasonal variations in SSA, but even for September alone, the
also that SSA may increase with distance from fire, i.e., as        previously measured values of SSA550 nm spanned 0.84–0.90.
the aerosol ages (fresh versus aged plume of Haywood et al.,        An open question is to what degree the range in previous ob-
2003). However, we emphasize that the “aging” timescales            servations represents real variability in the SSA of smoke in
observed in SAFARI-2000 were much shorter (e.g., ∼ 5 h in           this region or whether a significant part of the range is due to
Abel et al. (2003); within a few days in Haywood et al., 2003)      differences in measurement techniques and in measurement
than those seen in ORACLES (∼ 2–15 d, e.g., Dobracki et al.,        conditions; for example, the AERONET and flux radiome-
2019). This may account for the opposite sign (higher SSA           try retrievals are for ambient relative humidity (RH) aerosol,
for younger aerosol) shown in the latter work. Thus, it is clear    whereas the in situ (SAFARI) measurements are of dry/low-
that multiple physical factors may be responsible for variabil-     RH aerosol. We endeavor to explore these questions in the
ity in aerosol optical properties.                                  following sections.
   Further discussion of previous studies of SEA aerosol in
the context of the ORACLES results is found in Sect. 4.             1.3   ORACLES overview

1.2    Impacts of SSA on aerosol radiative effects                  The overarching goal of ORACLES is to make high-quality
                                                                    airborne observations of aerosols and clouds in the SEA to
Accurate representation of scattering versus absorption             gain a better understanding of the complex processes (di-
within biomass burning aerosol scenes has implications in           rect, indirect, and semi-direct) by which BB aerosols, no-
subsequent calculations of aerosol radiative effects over the       table for their strong absorption of solar energy, affect ra-
SEA. The range of SSA values shown in Fig. 1 encompasses            diation both directly and through their impacts on clouds
the possibility of both positive (smaller values of SSA) or         (Zuidema et al., 2016). The project included three field de-
negative (higher values of SSA) net direct radiative effect         ployments of approximately 1 month each: September 2016
when this aerosol is above the partly cloudy skies of the           based out of Walvis Bay, Namibia; August 2017 based out
SEA. The specific value of SSA where the radiative effect           of São Tomé, São Tomé and Príncipe; and October 2018
changes sign will depend on the cloud cover fraction; for ex-       again based out of São Tomé. The ORACLES study area time
ample, in Chand et al. (2009), the aerosol direct effect was        zone spans UTC and UTC+1. In the current paper, we focus
positive for a mid-visible SSA of 0.85 as long as cloud frac-       on the first field deployment of ORACLES in September of
tion was greater than 40 %. Wilcox (2012) found that for a          2016 out of Walvis Bay, Namibia. This deployment included
perturbation to SSA of ±0.03, the local direct aerosol radia-       two NASA aircraft: a P-3 for full atmospheric profiling and
tive effect was changed by 10–20 W m−2 , though this also           low-/mid-level in situ sampling, and a high-altitude ER-2 for
depends on AOD and cloud albedo conditions. A perturba-             remote-sensing observations. The P-3 aircraft was flown with

Atmos. Chem. Phys., 19, 9181–9208, 2019                                                www.atmos-chem-phys.net/19/9181/2019/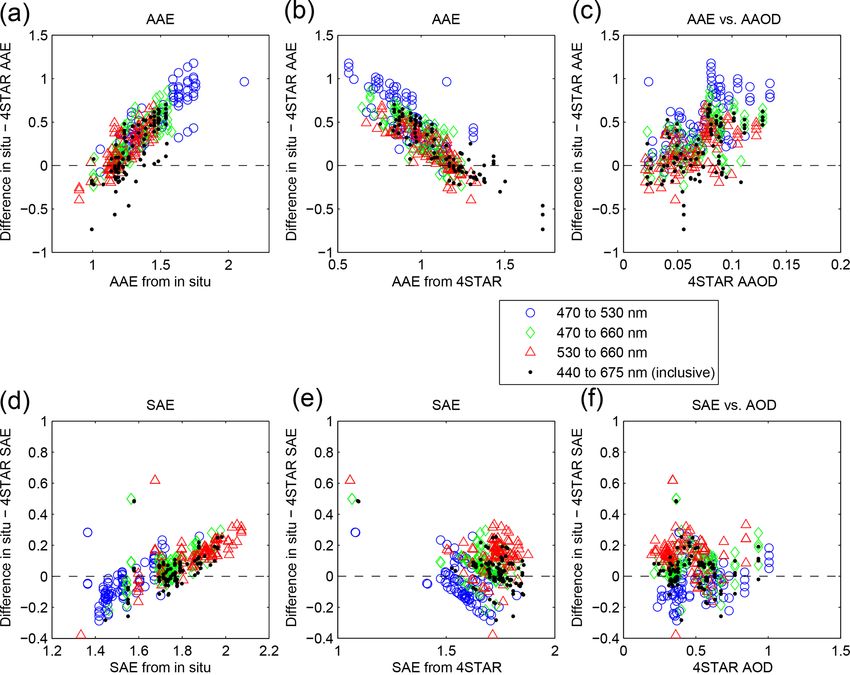
K. Pistone et al.: Biomass burning SSA intercomparison                                                                      9185

a suite of in situ and remote-sensing aerosol, cloud, radiation,   Rosenheimer et al., 2014) or below-cloud measurements
and meteorological instruments, while the ER-2 carried only        of transmittance for derivation of cloud optical properties
remote-sensing instrumentation. Data were collected over 15        (zenith mode). Under certain level-flying conditions, 4STAR
P-3 and 12 ER-2 flights, each 7–9 h in duration. The 2017 and      can also perform AERONET-like sky scans in either the
2018 deployments included the P-3 only. Hence, the simulta-        principal plane or almucantar (sky-scanning mode), which
neous deployment of both the P-3 and the ER-2 in the 2016          provide the data used here. The 4STAR sky scans are pro-
deployment created a unique testbed for evaluating remote-         cessed using a modified version of the version 2 AERONET
sensing retrievals of aerosol and cloud properties from a vari-    retrieval algorithm described in Dubovik and King (2000),
ety of instruments that have potential for future space flight.    which retrieves aerosol size distributions, refractive indices,
   Of the in situ and remote-sensing instruments included          SSA, and AAOD, among other parameters. All scans are run
in ORACLES, eight teams (including the complementary               through the algorithm with the minimum scattering angle set
AERONET sites, several of which were established to co-            to 3◦ to avoid stray light from the Sun entering the 4STAR
ordinate with the ORACLES deployments) observe or de-              optical aperture. Scene (i.e., surface plus atmosphere) albedo
rive aerosol absorption (either locally or as column AAOD)         is provided by SSFR measurements (described below). A no-
and the related SSA parameter (Table 1). All considered            table modification of the 4STAR retrievals compared with
remote-sensing instruments report an AOD product, with the         AERONET retrievals is in the input wavelengths. While
exception of the Solar Spectral Flux Radiometer (SSFR),            AERONET uses radiances measured at specific and discrete
which uses AODs from the Spectrometers for Sky-Scanning            wavelengths (440, 675, 870, and 1020 nm), with the hyper-
Sun-Tracking Atmospheric Research (4STAR) as input (each           spectral 4STAR we are able to use AODs and sky radiances
of these instruments is described below). Remote-sensing           measured at a different (or larger) selection of wavelengths.
SSAs are reported as column-integrated values; for in situ         Due to suspected stray light contamination within the 4STAR
measurements, the SSA presented is the extinction-weighted         spectrometer around 440 nm, a particular sensitivity to the
profile-average value (i.e., SSA calculated at each altitude       440 nm channel was observed, which in some cases resulted
and weighted by the profile of extinction; Sect. 2.1.3). Unless    in an anomalously low SSA (high AAOD) at shorter wave-
otherwise noted, reported Ångström exponents (AEs) are cal-        lengths compared with retrievals run without 440 nm. To
culated using a logarithmic fit of the AOD versus wavelength       avoid this issue, the results presented in this paper use a
using all available wavelengths between 440 and 675 nm (in-        modified set of inputs at wavelengths of 400, 500, 675, 870,
clusive), to have the most comparable quantity between in-         and 995 nm, with 400 and 500 nm replacing 440 nm. Note
struments and to reduce uncertainty compared with a simple         the longest wavelength of 995 nm replaces the AERONET
two-wavelength calculation of the AE. While previous stud-         1020 nm due to the wavelength limits of the 4STAR visible
ies have examined the agreement between the retrievals of a        spectrometer.
few of these instruments at a time (e.g., Sedlacek and Lee,           4STAR executed a total of 174 sky scans in ORACLES-
2007; Leahy et al., 2007; Knobelspiesse et al., 2011), an in-      2016, of which 38 % (66) met the following quality-
tercomparison including so many methods within one cam-            control (QC) criteria (adapted from the AERONET
paign has not previously been performed, due to the logis-         QC available at https://aeronet.gsfc.nasa.gov/new_web/PDF/
tics of assembling such a comprehensive suite of instruments       AERONETcriteria_final1.pdf, last access: 9 July 2019):
including several newly developed algorithms. Specific in-
strument details are given in the following section. A more          – AOD (400 nm) > 0.4;
detailed overview of the campaign design and goals may be
found in Zuidema et al. (2016), and an overview of the results       – altitude variation during scan < 50 m;
will be the focus of a future paper.
                                                                     – total residual sky radiance          error;   (|measured-
                                                                       fit|) < 10 % at all wavelengths;
2     Methods
                                                                     – measured scattering angle from the minimum of 3◦ up
2.1     Instruments and data                                           to a maximum of at least 50◦ (i.e., SZA > 25◦ ) (primar-
                                                                       ily relevant in almucantar scans); and
In this section, we offer descriptions of the instruments and
data included in this paper, as summarized in Table 1.               – manual inspection of the retrieval output for reasonable
                                                                       residual sky radiance error as a function of scattering
2.1.1    4STAR                                                         angle (i.e., uniform aerosol conditions; no cloud con-
                                                                       tamination).
4STAR is an airborne hyperspectral (350–1700 nm) Sun pho-
tometer which can make direct-beam (Sun-tracking mode)                Note that, unlike in the AERONET archive, we consider
measurements for retrieval of column AOD and trace gases           principal plane as well as almucantar scans when the above
(Dunagan et al., 2013; Shinozuka et al., 2013; Segal-              criteria are met. We do this because due to the timing of

www.atmos-chem-phys.net/19/9181/2019/                                               Atmos. Chem. Phys., 19, 9181–9208, 2019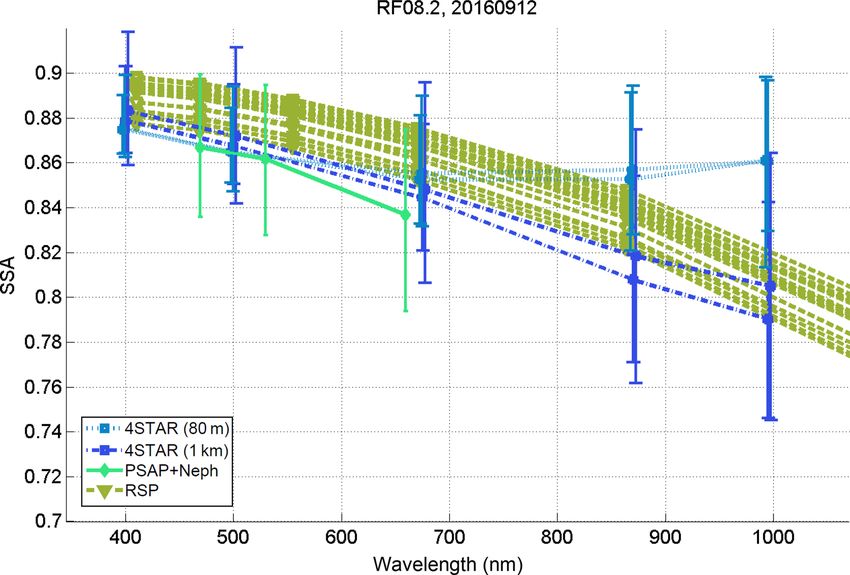
9186                                                                                          K. Pistone et al.: Biomass burning SSA intercomparison

Table 1. Overview of ORACLES instruments, as used to quantify SSA during the ORACLES campaigns, and the method used. Not all
measurement approaches are included in this paper; some are still in process and will be presented in future publications. Instruments/methods
presented in this paper are indicated in bold. Full archival data citations are given at the end of the paper under “Code and data availability”.

  Instrument                Platform        Method (absorption parameter)                          Wavelengths                                 Required conditions
  4STAR (+SSFR)             P-3             AERONET-like sky scans                                 hyperspectral;                              instrument below aerosol;
                                            (AAOD)1,2,13                                           evaluated using AOD                         level flight leg; cloud-free
                                                                                                   and radiances at 400,                       above
                                                                                                   500, 675, 870, 995 nm
  SSFR (+4STAR)             P-3             profiles of spectral                                   moderate spectral resolution;               radiation wall/square
                                            irradiance and AOD used                                evaluated at 355, 380, 452,                 spirals above/below
                                            with a radiative transfer                              470, 501, 520, 530, 532,                    aerosol layer
                                            model (RTM)3,4                                         550, 620, 660 nm
  PSAP + neph               P-3             in situ nephelometer (scattering)                      neph: 450, 550, 700 nm                      inside aerosol layer
                                            +PSAP (absorption)5,6                                  PSAP: 470, 530, 660 nm
  PTI + neph                P-3             in situ nephelometer (scattering)                      neph: 450, 550, 700 nm                      inside aerosol layer;
                                            +PTI (absorption)7                                     PTI: 532 nm                                 30 s averages on PTI
  RSP                       P-3             polarized reflectances input into RTM8                 I , Q, and U                                instrument above aerosol
                            + ER-2                                                                 Stokes components
                                            neural network9                                        in 410∗ , 469∗ , 555∗ ,
                                                                                                   670∗ , 864∗ , 960, 1594∗ ,
                                            MAPP algorithm: optimal estimation                     1880, and 2264∗ nm
                                            method using multi-angle, multi-                       (∗ denotes window channels
                                            channel total & polarized                              used in the retrieval of
                                            reflectances (bimodal column                           aerosol properties)
                                            absorption/AAOD)10
  RSP +                     ER-2            MAPP algorithm adapted to include                      RSP window channels                         instrument above aerosol
  HSRL-2                                    HSRL-2 observed backscatter &                          + HSRL-2 channels at
                                            extinction profiles (vertically                        355, 532, 1064 nm
                                            resolved absorption)11
  AirMSPI                   ER-2            multi-angle, multi-spectral polarized                  Stokes component I in bands                 instrument above aerosol;
                                            radiance fitted by a RTM to derive                     centered at 355, 380, 445, 470,             operated in sweep view
                                            above-cloud aerosol optical and                        555, 660, 865, and 935 nm;                  mode
                                            microphysical properties which are                     Stokes components Q and U
                                            used to calculate AAOD12                               in 470, 660, 865 nm bands
  AERONET                   ground          Sun radiance + multi-angular sky                       440, 675, 870, 1020 nm                      cloud-free above instrument
                                            radiances into RTM (AAOD)13
1 Redemann et al. (2014). 2 4STAR codes (see the acknowledgments). 3 Bergstrom et al. (2010). 4 Cochrane et al. (2019). 5 Anderson and Ogren (1998). 6 Virkkula (2010).
7 Sedlacek and Lee (2007). 8 Knobelspiesse et al. (2011). 9 In development, following Segal-Rosenheimer et al. (2018). 10 Stamnes et al. (2018). 11 Liu et al. (2019, in development).
12 Xu et al. (2018). 13 Dubovik and King (2000).

ORACLES flights, 4STAR sky scans were largely near so-                                       screened sky scans. This is because our current interest is
lar noon, limiting the angular range available in almucantar                                 in retrievals of aerosol properties through the entire aerosol
scans. In addition to the scans meeting the above QC mea-                                    plume, and thus the low-altitude sky scans are most compa-
sures, another 16 (9 % of the scans) were included based on                                  rable to the other instruments presented here. Overall, 49 of
manual QC inspection. This generally involved cases with                                     the QC-passed scans corresponded to valid in situ data and
AOD between 0.2 and 0.4. We retain these lower-AOD, man-                                     are used in the aggregate comparison figures; an additional
ually QC’d scans to explore the reliability of the retrievals                                26 did not correspond in space and time to the other instru-
under conditions of lower aerosol loading. This QC proce-                                    ments but are included in the broader analysis of Sect. 4. The
dure retained 82 sky scans in total (47 % of all scans) which                                available sky scan retrievals and their co-location with other
produced credible retrievals. In the present study, we fo-                                   instruments are summarized in Table 2.
cus on a further subset of 75 lower-altitude (< 3 km), QC-

Atmos. Chem. Phys., 19, 9181–9208, 2019                                                                              www.atmos-chem-phys.net/19/9181/2019/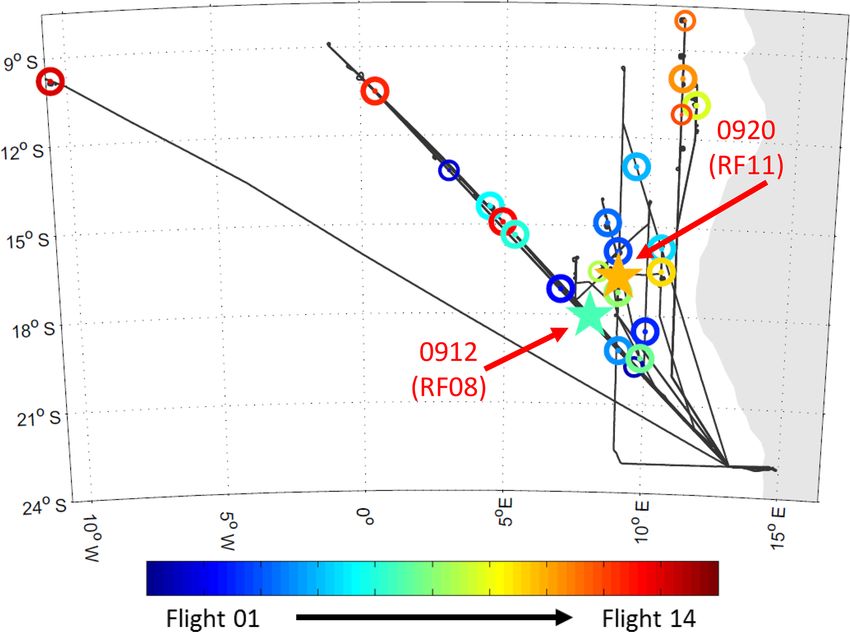
K. Pistone et al.: Biomass burning SSA intercomparison                                                                    9187

   The 4STAR uncertainties presented here are quantified         Mie theory. Retrieval uncertainties are reported at the
by a sensitivity test based on AOD and radiance uncertain-       polarimetric wavelengths and are determined by propagating
ties. AOD uncertainties used are the archived wavelength-        the instrument errors into the retrieval uncertainties. For
dependent uncertainties (LeBlanc et al., 2019), and uncer-       example, to get the retrieval uncertainty for above-cloud
tainties in the sky radiances have been quantified through       AOD and SSA, the fitting residual and instrument bias are
laboratory calibration using a NIST-traceable 12-lamp 36 in      multiplied by the inverse of the Fisher matrix evaluated at
integrating sphere (Brown et al., 2005). AOD uncertainties       the retrieved solution. Then, the chain rule is applied to
are dependent on wavelength, time, and solar zenith angle        propagate the error of the retrieved aerosol properties in the
(geometrical air mass factor), as well as potential window       solution vector to AOD and SSA, which further involves
contamination in some cases. These values were typically be-     the use of a Jacobian matrix containing derivatives of AOD
tween 0.01 and 0.02, ranging from a low of 0.008 to a high of    and SSA with respect to aerosol properties (Xu et al., 2018,
0.037 in an extreme case. Radiance uncertainties are wave-       2019).
length dependent but are constant over the entire campaign,
ranging between 1.0 % and 1.2 % for 470–995 nm. To test the      2.1.3   HiGEAR (PSAP + nephelometer)
impact of these two types of errors, the sky scan inversion
code is run separately for an addition or subtraction case for   The Hawaii Group for Environmental Aerosol Research
each of these two parameters (i.e., four cases), and the re-     (HiGEAR) operated several in situ instruments on the P-
sult is added in quadrature for each of the upper and lower      3. Total and submicrometer aerosol light scattering coef-
bounds. Note that an increase in AOD (without perturbing         ficients (σscat ) were measured onboard the aircraft using
radiances) results in a lower SSA and higher AAOD, while         two TSI model 3563 three-wavelength nephelometers (at
an increase in radiance (without perturbing AOD) results in a    450, 550, and 700 nm) corrected according to Anderson and
higher SSA and lower AAOD. Uncertainties in SSA are dom-         Ogren (1998). In addition to the TSI nephelometers used in
inated by the AOD terms, with smaller contributions from the     the present work, two single-wavelength nephelometers (at
uncertainty in the measured sky radiances. Other sources of      550 nm, Radiance Research, M903) were operated in par-
uncertainty are not explicitly quantified in the present work.   allel to study the increase in light scattering as function of
                                                                 RH. The humidified M903 nephelometer was operated near
2.1.2   AirMSPI                                                  80 % RH, while the dry unit was maintained below 40 %
                                                                 (Howell et al., 2006). Discussion of the impacts of aerosol
The Airborne Multi-angle SpectroPolarimeter Imager               humidification in the context of comparison with remote-
(AirMSPI) is an imaging polarimeter which has been               sensing retrievals at ambient RH is found in Sect. 4.2.
flying on the ER-2 aircraft since October 2010, including           Light absorption coefficients (σabs ) at 470, 530, and
in ORACLES-2016 (Diner et al., 2013). The instrument             660 nm were measured using two Radiance Research PSAPs.
contains a pushbroom camera inside a programmable                The humidity within the PSAP was not explicitly controlled,
gimbal for along-track view angles between ±67◦ , which          but the PSAP optical block was heated to approximately
is typically used for the observation of a 10 × 10 km target     50 ◦ C to reduce artifacts which would result from a chang-
from nine discrete view angles (“step-and-stare mode”; 10 m      ing RH; this had the effect of reducing relative humidity in
resolution), or a 100 km long target under a continuously        this instrument to much lower than the 40 % within the neph-
changing view angle (“sweep mode”; 25 m resolution).             elometers. The PSAP absorption corrections were performed
Further instrument details may be found in Diner et al.          according to an updated algorithm (Virkkula, 2010). Instru-
(2013). The sweep view mode was adopted for cloud and            mental noise levels are 0.5 Mm−1 for a 240–300 s sample
above-cloud aerosol observations during the ORACLES              average, comparable to values reported previously (Ander-
field campaign. The AirMSPI data presented here are from         son et al., 2003; McNaughton et al., 2011). In this paper,
a coupled stratocumulus cloud and above-cloud aerosol            we primarily present results calculated with the wavelength-
retrieval based on an optimization approach (Xu et al.,          averaged (as opposed to the wavelength-specific) correction
2018). The retrieval is run by fitting polarized radiance in a   factors presented in Virkkula (2010). Further discussion of
wide scattering angular range (e.g., from ∼ 90 to 180◦ ) at      this decision and the differences between the two corrections
three spectral bands centered at 470, 660, and 865 nm. The       are shown in Appendix A1.
retrieved above-cloud aerosol properties include refractive         SSA was calculated using the measured PSAP absorption
index, size distributions, and aerosol total volume concen-      combined with dried (RH < 40 %) TSI nephelometer scat-
tration. The retrieved cloud properties include cloud-top        tering interpolated to PSAP wavelengths. In the comparison
droplet size distribution, cloud-top height, and cloud optical   cases (i.e., column values), SSA is the extinction-weighted
thickness (cloud optical thickness is derived by fitting the     (extinction is defined as the sum of scattering and absorption)
radiance in the three polarimetric bands). Non-spherical         profile average according to the following procedure. To re-
particles are not accounted for in the current retrievals.       duce noise, the reported 1 s scattering and absorption data,
The column effective AOD and SSA are calculated using            corrected to ambient temperature and pressure, were first av-

www.atmos-chem-phys.net/19/9181/2019/                                             Atmos. Chem. Phys., 19, 9181–9208, 2019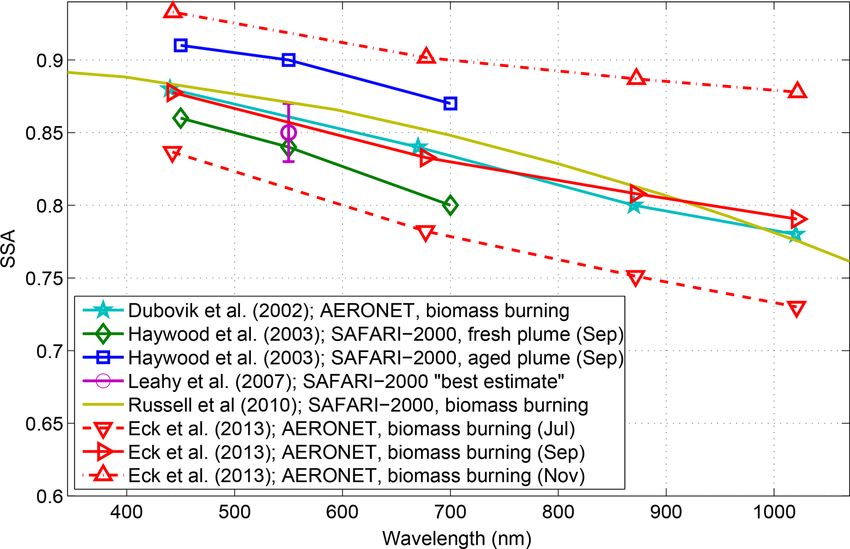
9188                                                               K. Pistone et al.: Biomass burning SSA intercomparison

eraged to 30 s box-car averages. Time-averaged data are then       averages, with an uncertainty of ∼ 4 Mm−1 subjected to the
filtered to reject cases where σscat,530 nm,30 s < 10 Mm−1 to      1 s measurement noise floor, and with data available only for
assure an adequate signal-to-noise ratio. Data are also dis-       some periods and for a subset of P-3 flights. As these data
carded if > 20 % of the archived 1s SSAs are undefined over        are included in the ORACLES 2016 archive, we include a
the averaging period, to account for manual quality flagging       discussion of them in this comparison study, though with the
of SSA due to, e.g., calibration periods. Applying different       above caveats. In the comparison case study which has PTI
averaging times (10–60 s averages) did not result in appre-        data available (Sect. 3.1.2), the extinction-weighted SSA was
ciably different SSA and Ångström exponents for the column         only able to be calculated from the PTI absorption using data
average. SSA is then calculated as SSA = σscat /(σscat + σabs )    within the time period of the P-3 comparison case (profile
and then arithmetically weighted by its extinction in comput-      and in-plume leg), rather than a complete profile as with the
ing a profile average. In the AOD proxy shown in Sect. 3.1,        PSAP + neph SSA. Due to the limitations with these data as
due to the vertical integration involved, scattering and ab-       described above, we do not show the PTI + neph SSA for this
sorption data were instead averaged into equal 100 m ver-          case but discuss it in qualitative terms in Sect. 3.1.2. A direct
tical bins (approximately 15 s of flight time) and integrated      comparison of the absorption as measured by the two in situ
over the full profile; in this specific case, only profiles with   instruments (PTI and PSAP) is shown in Appendix A2.
altitudes spanning at least 1.6 to 5.1 km are considered (Ta-         A redesign of the PTI, based in part upon lessons learned
ble 2).                                                            during the 2016 campaign, saw improved performance for
    Unless otherwise specified, the “in situ” data reported in     the 2018 ORACLES campaign and will be the subject of an-
this paper are from the PSAP + nephelometer combination,           other paper.
with Virkkula wavelength-averaged corrections applied. Due
to the uncertain nature of the impacts of humidification on        2.1.5   RSP
each of the scattering and absorption components individu-
ally and how they affect the resulting SSA, we leave these         The NASA GISS Research Scanning Polarimeter (RSP) is a
in situ data as dried. The basis for and implications of this      multi-angle, multi-spectral polarimeter aboard the ER-2 that
decision are discussed in more detail in Sect. 4.2.                measures the Stokes parameters I , Q, and U at ∼ 150 angles
                                                                   between ± ∼ 60◦ in the along-track direction, in nine spec-
2.1.4   PTI + nephelometer                                         tral channels centered at 410∗ , 469∗ , 555∗ , 670∗ , 864∗ , 960,
                                                                   1594∗ , 1880, and 2264∗ nm (Cairns et al., 1999). The seven
The second in situ measurement of aerosol absorption uses          channels denoted by an asterisk have negligible or weak and
data from the airborne photothermal interferometer (PTI).          correctable water vapor absorption and were used in the mi-
The PTI measures aerosol light absorption by combining             crophysical aerosol properties from polarimetry (MAPP) re-
photothermal spectroscopy and laser interferometry (Sed-           trieval. The RSP MAPP algorithm (Stamnes et al., 2018) was
lacek, 2006; Sedlacek and Lee, 2007). The hallmark of the          adapted for ORACLES observations of aerosols above water
PTI, and other photothermal-based techniques, is a com-            by incorporating into the retrieval an aerosol profile consist-
plete immunity to light scattering. The unit deployed during       ing of two layers (a top layer of fine-mode aerosol located
ORACLES-2016 operated at a wavelength of 532 nm. While             at 2.25–5.5 km, and a base layer of coarse-mode (sea salt)
the baseline noise on the ground was ∼ 1.5 Mm−1 for a 1 s          aerosol located at 0–1 km) as approximately identified by the
integration time, the PTI exhibited pronounced sensitivities       High Spectral Resolution Lidar (HSRL-2), which is also on
to aircraft platform vibrations during the 2016 ORACLES            the ER-2 aircraft. The aerosols are modeled as a bimodal
campaign. These unexpected sensitivities had two immedi-           population of spherical fine- and coarse-mode aerosols, with
ate, and unrecoverable, effects on the performance of this         each mode defined by a lognormal size distribution. The fine-
measurement onboard the P-3. First, the noise floor increased      mode aerosol effective radius, effective variance, and com-
to ∼ 20 Mm−1 at 1s in flight, due to difficulties in maintain-     plex refractive index are then retrieved. The coarse-mode
ing quadrature lock with the active quadrature lock feedback       aerosol is assumed to consist of non-absorbing spherical par-
circuit. Second, platform vibration impacted the laser beam        ticles with complex refractive index equal to that of water,
overlap between the modulated excitation laser operating at        except the real part was multiplied by a factor of 1.01. The
532 nm and the 632 nm interferometer laser beam. Reduc-            maximum allowed wind speed for the one-dimensional Cox–
tion in beam overlap resulted in an underreporting of the ac-      Munk ocean was increased to 12 m s−1 to allow retrieval of
tual aerosol absorption since the probe beam (interferome-         high wind speeds consistent with Modern-Era Retrospective
ter) was not optimally sampling the volume illuminated by          analysis for Research and Applications version 2 (MERRA-
the modulated green beam. Additionally, laser overheating          2) profiles.
further limited the operation of this instrument to in-plume          Since for RSP the fine and coarse modes are retrieved sep-
transects.                                                         arately, the total AOD is thus the sum of the fine- plus coarse-
   Due to these performance impacts, the 2016 PTI data are         mode optical depths. Due to the assumption that coarse-mode
flagged as suspect. As such, the PTI data are archived as 30 s     aerosol is non-absorbing sea salt, the AAOD and Ångström

Atmos. Chem. Phys., 19, 9181–9208, 2019                                             www.atmos-chem-phys.net/19/9181/2019/
K. Pistone et al.: Biomass burning SSA intercomparison                                                                       9189

exponent values are provided for the fine mode only to al-          gorithm that iteratively changes SSA and asymmetry param-
low for more direct comparisons to the smoke properties re-         eter until the modeled irradiance profiles (based on 4STAR
trieved by the remote sensors above clouds.                         AOD and SSFR-derived cloud albedo) match the measure-
                                                                    ments (Schmidt et al., 2010). This SSA retrieval is done in-
2.1.6   SSFR                                                        dependently for each wavelength, without applying spectral
                                                                    smoothness constraints. Uncertainties in SSFR SSA as re-
The SSFR is a moderate resolution radiative flux (irradi-           ported here reflect the 1σ uncertainty as calculated from the
ance) spectrometer covering the wavelength range from 350           probability of the SSA and asymmetry parameter pair within
to 2100 nm (Pilewskie et al., 2003; Schmidt and Pilewskie,          the retrieval. A description of the algorithm and the uncer-
2012). The downwelling (zenith) and upwelling (nadir) solar         tainty analysis may be found in Cochrane et al. (2019).
radiation is collected by light collectors mounted to the skin
of the aircraft. In the past, aerosol absorption, SSA, and the      2.2   Instrument intercomparison conditions
asymmetry parameter were derived from irradiance pairs col-
lected along collocated horizontal legs above and below the         Comparison cases were selected based on the available in-
layer (Schmidt et al., 2010). For ORACLES, this approach            strument data and the flight path for a given day. Identified
was impractical because of the underlying albedo variabil-          cases included at least two of the following conditions to fa-
ity in the presence of clouds. The alternative is to measure        cilitate comparison between instruments:
the irradiances in a vertical profile, realized as a spiral. This    1. operational nephelometer plus PSAP and/or PTI in situ
was not an option for previous experiments where the zenith             data during an aircraft profile (either a ramp or a square
light collector was fix-mounted to the aircraft, introducing            spiral as described in Sect. 2.1.6);
uncertainties due to the changing aircraft attitude that cannot
be corrected for after the fact. Specifically for ORACLES,           2. ≥ 1 sky scan (4STAR) at or below the bottom of the
an active leveling platform (ALP) was built for the zenith              plume (i.e., measuring the total-column aerosol proper-
light collector on the P-3 aircraft. By controlling its angu-           ties);
lar position, SSFR is able to obtain zenith (downwelling) ir-
radiance measurements throughout the vertical profile if the         3. a square spiral profile through the full column (SSFR);
spirals include short (∼ 9–30 s) straight segments (typically           and
offset by 90◦ in heading). This spiral profile maneuver with         4. an ER-2 overpass of the P-3 location (RSP and/or AirM-
short straight legs is referred to as a square spiral. The nadir        SPI).
(upwelling) irradiance measurements are affected by the un-
derlying cloud and its variability, as well as by the aerosol       Due to the different flight patterns necessary for the differ-
between the cloud top and the nadir light collector. To sepa-       ent instruments to measure/retrieve aerosol properties, this
rate the aerosol signal from that of clouds, SSFR uses the up-      yielded 24 potential comparison case studies over 12 (out
welling irradiance at 1.6 µm where the signal is dominated by       of 14) flight days (Fig. 2). Within this set of cases, tempo-
clouds and filters the data such that only points within 1 stan-    ral separation between measurements from different instru-
dard deviation of the mean are included for final process-          ments varies between 10 min and 2 h; the inter-measurement
ing. The impact of the aerosol layer on the downwelling and         spatial spread was within approximately 1◦ in either latitude
upwelling irradiance is then quantified throughout the spiral       or longitude (ideally 100 km or less but up to 130 km in se-
by plotting spectral irradiance profiles with 4STAR-reported        lect cases). Note that not all instruments were available for
above-aircraft AOD at 532 nm as the vertical coordinate. A          each comparison (Table 2). In selecting comparison periods,
linear fit is performed on both upwelling and downwelling ir-       spatial coincidence was given priority over temporal coin-
radiance, using AOD as the vertical coordinate. The absorp-         cidence. All comparison cases included at least one 4STAR
tion is then derived from the difference of the net irradiance      sky scan; this was reduced to 20 cases when we required QC-
at the top and the bottom of the layer (Cochrane et al., 2019).     screened sky scans below 3 km (considered to be below the
Since this approach uses data throughout the vertical profile,      bulk of the aerosol plume), 19 of which were coincident with
it is a more robust and accurate method than obtaining it just      an in situ profile. Of the 24 cases, 14 had full profiles and 9
from the irradiance pairs above and below the layer as in           had partial profiles only, for a total of 23 of the 24 with in
a radiation wall. More importantly for measurements above           situ observations of SSA.
clouds, this method minimizes the impact of cloud variability          Below, we focus in on two specific case studies on 12 and
on the sampling of upwelling irradiances through the filter-        20 September 2016. The case on 12 September (blue star in
ing approach described above. Any deviations from a linear          Fig. 2) was a mostly cloudless scene and included RSP re-
relationship between AOD and irradiances are attributable to        trievals from an ER-2 overpass. For the case on 20 Septem-
changes in the underlying cloud albedo. The filtering tech-         ber (orange star in Fig. 2), valid SSFR retrievals were run us-
nique allows separation of these influences from those orig-        ing data from a P-3 square spiral maneuver through a cloudy
inating from the aerosol layer. SSA is retrieved with an al-        scene overlaid with substantial aerosol loading. Each of the

www.atmos-chem-phys.net/19/9181/2019/                                                Atmos. Chem. Phys., 19, 9181–9208, 2019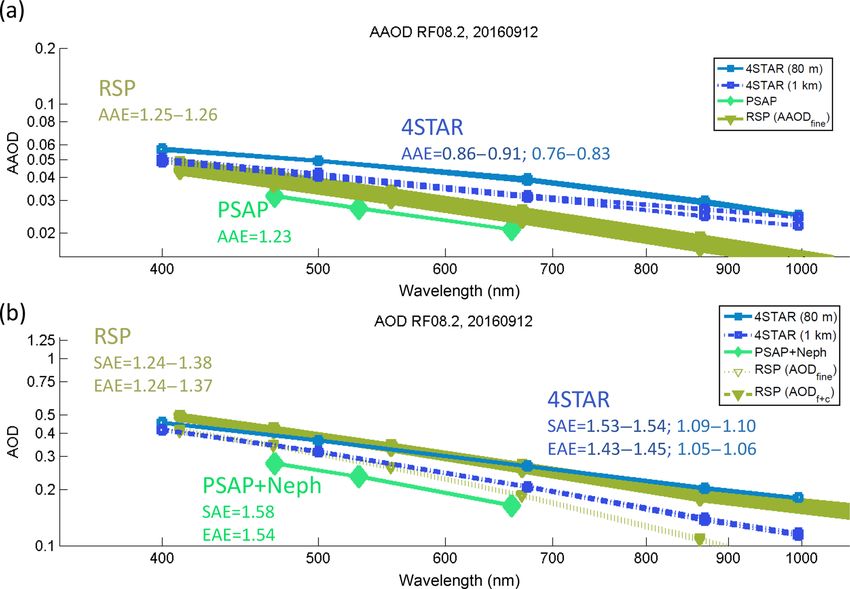
9190                                                                   K. Pistone et al.: Biomass burning SSA intercomparison

                                                                       3     Results

                                                                       3.1     Multi-instrument case studies

                                                                       We next show two specific case studies, from flights on 12
                                                                       and 20 September 2016, where six of the methods can be
                                                                       compared.

                                                                       3.1.1    Case study: 12 September 2016 (broken
                                                                                cloud/clear sky)

                                                                       The P-3 flight on 12 September was a radiation-targeted
                                                                       flight of opportunity, with two potential comparison cases
                                                                       identified. Both cases are included in the analysis in Sect. 3.2,
                                                                       but in this section we focus on the second case, at ap-
                                                                       proximately 18.0◦ S, 8.0◦ E, between 13:44 and 14:34 UTC
Figure 2. ORACLES-2016 P-3 flight paths (all flights; black lines)
                                                                       (Fig. 2). This case starts with two consecutive 4STAR sky
showing the approximate location of all aerosol comparison cases
                                                                       scans at approximately 1 km altitude (above-cloud level; also
(circles). The cases highlighted in this paper (12 and 20 Septem-
ber 2016) are indicated by a star and arrow, and larger circles are    referred to below as “plume only” within this section for rea-
the cases included in the analysis in Sect. 3.2. The color indicates   sons which are explained below) over a broken cloud scene
the timing of an individual case within the September 2016 deploy-     of albedo of 0.1, followed by a short descent and two scans
ment.                                                                  at 80 m, which is below typical cloud level but was, in this
                                                                       case, in a cloudless area (scene albedo approximately 0.05).
                                                                       The P-3 then flew a ramped ascent from 80 m to 5.8 km,
12 ER-2 flights (including transits to/from Namibia) yielded           ending above the top of the aerosol plume. Measured RH
AirMSPI above-cloud aerosol (ACA) retrievals somewhere                 throughout the plume increased from near 0 % below the
over the SEA; nine of the P-3 comparison cases included                plume level (up to ∼ 2.5 km) to a maximum of around 50 %
ER-2 overpasses, and each of these had at least one AirM-              at plume top (5 km), i.e., generally below the RH of 40 %
SPI ACA retrieval co-located with P-3 observations. Three              “dry” threshold for the in situ instrumentation. This cor-
of these cases (including the case from 20 September dis-              responds to a roughly constant water vapor mixing ratio:
cussed in Sect. 3) had retrievals with the highest confidence          around 5000 ppmv (3.1 g kg−1 ) through the plume. The first
(labeled “primary” in Table 2); retrievals were run for an ad-         pair of sky scans (at 1 km altitude) are separated from the sec-
ditional six cases, which are included in Sect. 4 to allow for         ond pair (at 80 m, at the base of the ramp) by approximately
broader comparison. However, these second-tier retrievals              20 min and 130 km. While this is slightly outside our de-
have somewhat increased potential for retrieval biases, due to         sired spatial constraints which may give slightly poorer scene
small scattering angle coverage and/or broken cloud condi-             agreement for this comparison case, we believe it instructive
tions. Successful above-cloud aerosol retrievals for data from         to retain the two above-boundary-layer sky scans in exam-
the RSP have been processed for one of the cases thus far (the         ining this case. First, this facilitates better comparison with
case study on 12 September). While the present work is thus            RSP (which retrieves above-cloud fine-mode aerosol sepa-
limited to a subset of the 24 cases, future comparative analy-         rately) and second, since the bulk of the ORACLES-2016
sis may be able to expand the number of cases to incorporate           data consists of plume-only aerosol without boundary-layer
potential newly available data (Table 1).                              influence, the inclusion of these scans allows for better con-
   It is important to note that due to the different instrument        textualization of this specific case. The ER-2 overpass of the
methodologies, exact spatiotemporally coincident measure-              scene, occurring during the P-3’s ascending ramp, resulted in
ments are not possible, if for no reason other than the dif-           20 RSP retrievals between 14:17 and 14:21 UTC. There were
ferent viewing geometries alone; the comparisons presented             no AirMSPI retrievals during this period.
here are chosen for their potential to obtain measurements of             Figure 4 shows the SSA for each of the available instru-
reasonably similar aerosol properties from different perspec-          ments for this case. The most notable feature is in the 4STAR
tives (e.g., below- versus above-aerosol remote sensing, and           sky scans; while the retrievals agree quite well at short wave-
remotely sensed versus in situ; Fig. 3). In our analysis, we           lengths (within ∼ 0.01 and well within 4STAR’s SSA un-
first present the two individual case studies (Sect. 3.1) be-          certainty range determined by AOD and radiance uncertain-
fore discussing results from the aggregation of all coincident         ties, as described in Sect. 2.1.1), at the longer wavelengths
measurements from three of the instruments (Sect. 3.2).                the two sets of scans diverge markedly. It may be noted
                                                                       that the uncertainty increases as well at these longer wave-
                                                                       lengths, and there is overlap in the two sets of uncertainty

Atmos. Chem. Phys., 19, 9181–9208, 2019                                                  www.atmos-chem-phys.net/19/9181/2019/
K. Pistone et al.: Biomass burning SSA intercomparison 9191
Table 2. Summary of data available for instruments with multiple comparison cases (i.e., from 4STAR, AirMSPI, and in situ instrumentation),
for campaign-wide statistics (top row; Sect. 4) and for comparison with other instruments (lower rows; Sect. 3).
4STAR (P-3) AirMSPI (ER-2) In situ (P-3): In situ:
full profile partial profiles only
No. valid retrievals 75 (below 3 km) of 82 (total) 134 (primary) + 68 (additional) continuous continuous
No. cases total 19 9 14 9
vs. 4STAR – 9 11 14
vs. AirMSPI 9 – 6 3
vs. in situ 19 9 – –
Figure 3. Schematic illustrating the different successive measurement orientations necessary for a comparison of aerosol properties using
different instruments and aircraft in an aerosol-above-cloud environment. The aircraft shown are those used in ORACLES: the high-altitude
(30 km) ER-2 (top) and the propeller P-3B aircraft (bottom) for tropospheric sampling (approximately 0–7 km).
estimates. The two sky scans performed near the surface (at rated by the HSRL-2 retrievals of aerosol type, which iden-
80 m altitude), immediately before the start of the ascending tified marine aerosol below the smoke plume around this
ramp, agree well with one another and give a higher long- time. The AERONET climatology of aerosol from “desert
wavelength SSA than the two scans performed above the dust and oceanic” sites (Bahrain/Persian Gulf, Cabo Verde,
boundary layer (at 1 km altitude). However, the 1 km scans and Lanai, HI, sites) by Dubovik et al. (2002) shows high,
are more representative of the typical SSA spectral shape largely spectrally flat or slightly increasing SSA between 440
observed from 4STAR for the ORACLES-2016 campaign and 1020 nm. Indeed, LeBlanc et al. (2019) also found lower
as a whole (i.e., monotonically decreasing for wavelengths extinction Ångström exponents for “full-column” (i.e., be-
≥ 500 nm). As the majority of the 4STAR sky scans were low cloud level) 4STAR AOD measurements than for those
taken above the boundary layer, the increase in SSA at longer taken above the boundary layer, which is consistent with the
wavelengths as seen in the two 80 m scans likely reflects differences seen in this case (Fig. 5).
contribution from sea salt in the boundary layer, combined In situ measurements show a similar spectral SSA com-
with the overlying biomass burning aerosol. In situ measure- pared with the other two instruments. We note that if
ments report σscat,530 nm of around 30 Mm−1 between 80 and we apply the wavelength-specific, rather than wavelength-
600 m with negligible absorption in these altitudes, suggest- invariant, Virkkula corrections to the PSAP data, the
ing purely scattering sea salt. This is additionally corrobo- PSAP + neph SSA shows a different spectral shape, with a
www.atmos-chem-phys.net/19/9181/2019/ Atmos. Chem. Phys., 19, 9181–9208, 2019You can also read