The Holocene dynamics of Ryder Glacier and ice tongue in north Greenland
←
→
Page content transcription
If your browser does not render page correctly, please read the page content below
The Cryosphere, 15, 4073–4097, 2021
https://doi.org/10.5194/tc-15-4073-2021
© Author(s) 2021. This work is distributed under
the Creative Commons Attribution 4.0 License.

The Holocene dynamics of Ryder Glacier and ice tongue
in north Greenland
Matt O’Regan1,2 , Thomas M. Cronin3 , Brendan Reilly4 , Aage Kristian Olsen Alstrup5 , Laura Gemery3 , Anna Golub3 ,
Larry A. Mayer6 , Mathieu Morlighem7 , Matthias Moros8 , Ole L. Munk5 , Johan Nilsson2,9 , Christof Pearce10 ,
Henrieka Detlef10 , Christian Stranne1,2 , Flor Vermassen1,2 , Gabriel West1,2 , and Martin Jakobsson1,2
1 Department   of Geological Sciences, Stockholm University, 10691, Stockholm, Sweden
2 Bolin Centre for Climate Research, Stockholm University, 10691, Stockholm, Sweden
3 Florence Bascom Geoscience Center, U.S. Geological Survey, Reston, VA, 20192, USA
4 Scripps Institution of Oceanography, University of California San Diego, La Jolla, CA, 92037, USA
5 Department of Clinical Medicine – Nuclear Medicine and PET Centre, Aarhus University Hospital, Aarhus, Denmark
6 Center for Coastal and Ocean Mapping, University of New Hampshire, Durham, NH, 03824, USA
7 Department of Earth System Science, University of California, Irvine, CA, 92697, USA
8 Leibniz Institute for Baltic Sea Research Warnemünde, 18119, Rostock, Germany
9 Department of Meteorology, Stockholm University, 10691, Stockholm, Sweden
10 Department of Geoscience and Arctic Research Centre, Aarhus University, 8000, Aarhus, Denmark

Correspondence: Matt O’Regan (matt.oregan@geo.su.se)

Received: 17 March 2021 – Discussion started: 31 March 2021
Revised: 1 July 2021 – Accepted: 7 July 2021 – Published: 24 August 2021

Abstract. The northern sector of the Greenland Ice Sheet is        Holocene (between 3.6 ± 0.4 and 2.9 ± 0.4 ka cal BP) and
considered to be particularly susceptible to ice mass loss aris-   extended to its maximum historical position near the fjord
ing from increased glacier discharge in the coming decades.        mouth around 0.9 ± 0.3 ka cal BP. Laminated, clast-poor sed-
However, the past extent and dynamics of outlet glaciers in        iments were deposited during the entire retreat and regrowth
this region, and hence their vulnerability to climate change,      phases, suggesting the persistence of an ice tongue that only
are poorly documented. In the summer of 2019, the Swedish          collapsed when the glacier retreated behind a prominent to-
icebreaker Oden entered the previously unchartered waters of       pographic high at the landward end of the fjord. Sherard
Sherard Osborn Fjord, where Ryder Glacier drains approxi-          Osborn Fjord narrows inland, is constrained by steep-sided
mately 2 % of Greenland’s ice sheet into the Lincoln Sea.          cliffs, contains a number of bathymetric pinning points that
Here we reconstruct the Holocene dynamics of Ryder Glacier         also shield the modern ice tongue and grounding zone from
and its ice tongue by combining radiocarbon dating with            warm Atlantic waters, and has a shallowing inland sub-ice
sedimentary facies analyses along a 45 km transect of ma-          topography. These features are conducive to glacier stability
rine sediment cores collected between the modern ice tongue        and can explain the persistence of Ryder’s ice tongue while
margin and the mouth of the fjord. The results illustrate that     the glacier remained marine-based. However, the physiogra-
Ryder Glacier retreated from a grounded position at the fjord      phy of the fjord did not halt the dramatic retreat of Ryder
mouth during the Early Holocene (> 10.7 ± 0.4 ka cal BP)           Glacier under the relatively mild changes in climate forcing
and receded more than 120 km to the end of Sherard Osborn          during the Holocene. Presently, Ryder Glacier is grounded
Fjord by the Middle Holocene (6.3 ± 0.3 ka cal BP), likely         more than 40 km seaward of its inferred position during the
becoming completely land-based. A re-advance of Ryder              Middle Holocene, highlighting the potential for substantial
Glacier occurred in the Late Holocene, becoming marine-            retreat in response to ongoing climate change.
based around 3.9 ± 0.4 ka cal BP. An ice tongue, similar in
extent to its current position was established in the Late

Published by Copernicus Publications on behalf of the European Geosciences Union.
4074 M. O’Regan et al.: The Holocene dynamics of Ryder Glacier and ice tongue
1 Introduction In the summer of 2019, during the Ryder 2019 expedition,
the Swedish icebreaker Oden became the first vessel to en-
ter the unchartered waters of Sherard Osborn Fjord, which
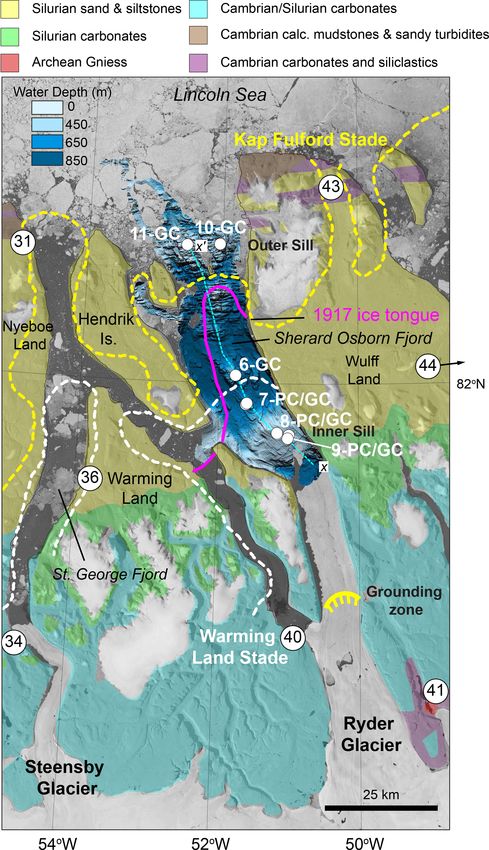
Mass loss from the Greenland Ice Sheet (GrIS) occurs from connects Ryder Glacier with the Lincoln Sea (Fig. 1). Ryder
surface ablation (melting) and through iceberg calving (dis- Glacier drains about 2 % of Greenland’s ice sheet and is one
charge) and subaqueous melt at marine-terminating glaciers. of four major marine-terminating glaciers in this sector of
It has increased six-fold since the 1980s, contributing an the GrIS (Fig. 1). Ryder and Petermann glaciers in the north-
estimated 13.7 mm to global sea level between 1972–2019 west and Nioghalvfjerdsfjorden Glacier in the northeast are
(Mouginot et al., 2019). In north and northeast Greenland the only remaining Greenland outlet glaciers that have large,
(Fig. 1), ice discharge rates from marine-terminating glaciers intact floating ice tongues, which are believed to exert an im-
are lower than those observed in the south and northwest portant buttressing force that slows glacier flow (Mottram et
(Mouginot et al., 2019). With amplified rates of high Arc- al., 2019). Ryder’s ice tongue is 25 km long and has been rel-
tic warming and the continued loss of sea ice and buttressing atively stable during the last 70 years, showing a net advance
ice shelves, accelerated ice discharge from the northern sec- of about 43 m yr−1 between 1948 and 2015 (Hill et al., 2018).
tor of the GrIS has been identified as a particular concern for Here we combine radiocarbon dating with the analysis of
sea-level rise in the coming decades (Moon et al., 2012; Hill lithofacies in six marine sediment cores that form a ∼ 45 km
et al., 2018; Mouginot et al., 2019). long transect extending from the modern ice tongue margin
Marine sediment archives provide unique insights into the of Ryder Glacier to the mouth of Sherard Osborn Fjord. We
past extent and dynamics of Greenland’s marine-based ice integrate these results with established phases of ice reces-
margin, including the sensitivity and environmental controls sion and regrowth in this sector of northern Greenland, pro-
on the stability of outlet glaciers and their floating ice tongues viding the first insights into the dynamic behavior of Ryder
(Jakobsson et al., 2018, 2020; Wangner et al., 2018; Reilly Glacier and its ice tongue during the Holocene.
et al., 2019; Vermassen et al., 2020). Combined with anal-
yses of ice cores (Vinther et al., 2009; Lecavalier et al.,
2017), terrestrial and marine mapping of glacial limits (Fun- 2 Geologic, oceanographic, and glaciologic setting
der et al., 2011b), and other paleoclimate time series (Briner
et al., 2016), marine sediment archives allow us to investi- Sherard Osborn Fjord is ∼ 17 km wide and extends ∼ 81 km
gate the response of the GrIS to natural climate variability from the modern grounding zone of Ryder Glacier out to-
over timescales that exceed the length of direct satellite ob- wards the Lincoln Sea. Ryder Glacier is currently grounded
servations and other historical records. An understanding of below sea level, with an ice tongue that extends ∼ 55 km out
how marine-terminating glaciers responded to past climate from the grounding zone (Fig. 2). Bathymetric mapping dur-
change and ultimately elucidating the geologic and environ- ing the Ryder 2019 expedition revealed two prominent sills
mental controls on their behavior are critical to reduce uncer- crossing the fjord (Jakobsson et al., 2020) (Fig. 2). These sills
tainties in future sea-level predictions (Bamber et al., 2019). bound a basin that has a maximum depth of 890 m. The outer
After the Last Glacial Maximum, the GrIS receded dra- sill has little sedimentary cover and appears to be a bedrock
matically through the Early (11.7–8.2 ka cal BP) and Middle feature, while the inner sill is interpreted as a sedimented for-
Holocene (8.2–4.2 ka cal BP) when Arctic summer air tem- mer glacial grounding zone (Jakobsson et al., 2020), poten-
peratures were ∼ 1–3 ◦ C above 20th century averages (Kauf- tially developed on a pre-existing bedrock high.
man et al., 2004; Miller et al., 2010; Briner et al., 2016). The The sill depths on the outer fjord are 475 m on the east
GrIS reached its minimum extent near the end of the Mid- and 375 m on the west (Fig. 2). The inner sill has a ∼ 6.2 km
dle Holocene or sometime near the beginning of the Late wide central region that ranges in depth from 193 to 300 m,
Holocene (4.2–0 ka cal BP) (Young and Briner, 2015). The with a ∼ 1 km wide channel on the eastern side that extends
Lincoln Sea, which surrounds much of northern Greenland, to a depth of 390 m. The modern ice tongue terminus of Ry-
hosts some of the most persistent and harsh sea-ice condi- der Glacier is located approximately 5 km landward of the
tions in the Arctic today. However, many terrestrial glacial inner sill. Despite these bathymetric barriers, waters of At-
(Kelly and Bennike, 1992; Landvik et al., 2001; Möller et al., lantic origin that circulate through the Lincoln Sea are found
2010; Funder et al, 2011a; Larsen et al., 2019) and lacustrine between the two sills at depths greater than 350 m (Fig. 3;
paleoclimate studies (Olsen et al., 2012) show warmer cli- Jakobsson et al., 2020). These relatively warm (> 0.3 ◦ C)
matic conditions, reduced glacial ice extent, and more open and saline (> 34.7) waters are constrained by the inner sill,
water conditions along the north Greenland coast during with only a small amount of warmer water flowing across the
the Holocene thermal maximum (11.0–5.5 ka cal BP). Due to inner sill through the < 1 km wide and 390 m deep channel
difficulties in accessing the Lincoln Sea, there are no marine to be strongly mixed with glacially derived meltwater.
records documenting glacier dynamics north of Petermann Sherard Osborn Fjord cuts into the Paleozoic Franklinian
Glacier (Reilly et al., 2019) that can be combined with these Basin that extends over 2000 km from the Canadian Arc-
land-based studies. tic to eastern north Greenland (Henriksen and Higgins,
The Cryosphere, 15, 4073–4097, 2021 https://doi.org/10.5194/tc-15-4073-2021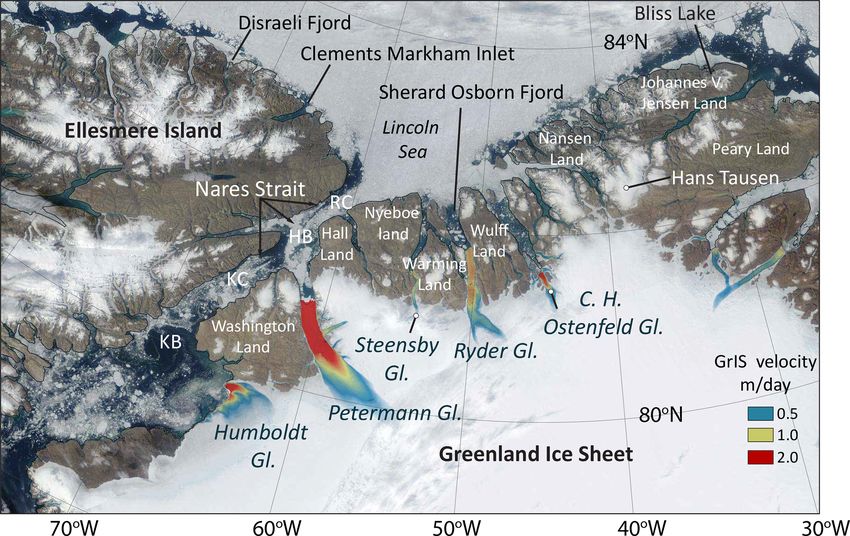
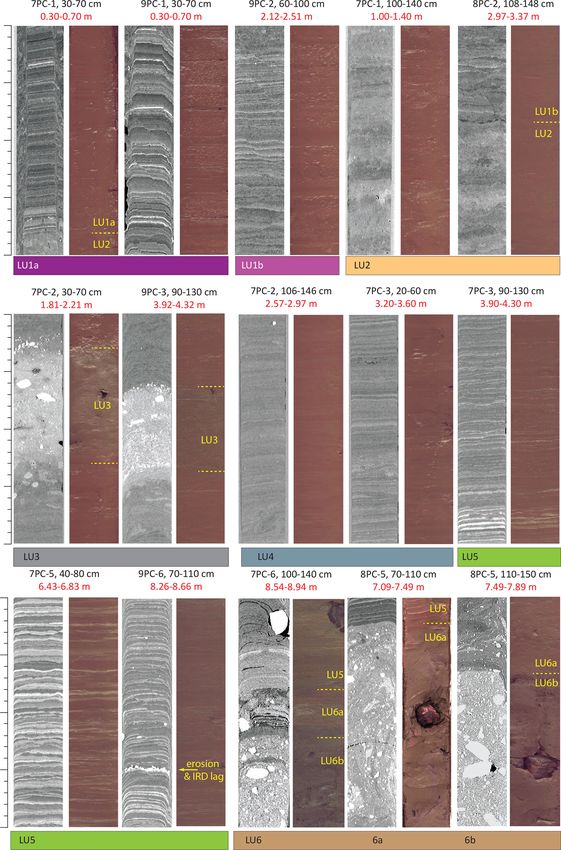
M. O’Regan et al.: The Holocene dynamics of Ryder Glacier and ice tongue                                                               4075

Figure 1. Satellite view of north Greenland and Ellesmere Island from 30 July 2019. Velocities of outlet glaciers are from Sentinel-1, winter
campaign 2019/2020, version 1.3 (Nagler et al., 2015). Robeson Channel (RC), Hall Basin (HB), Kennedy Channel (KC), and Kane Basin
(KB).

2000). Along the north Greenland coast, deposition in the                fjords. Radiocarbon dates from marine macrofossils sampled
Franklinian Basin occurred in a passive margin environment               by Kelly and Bennike (1992) at Kap Fulford (Station 31;
throughout the latest Precambrian to Devonian, with shallow              10 030 ± 175 and 9390 ± 90 14 C BP) and freshwater algae
water carbonate shelf sediments found to the south and sili-             from northern Wulff Land (Station 43; 10 480 ± 90 14 C BP)
ciclastic slope and deep-water sediments in the north (Hen-              provide minimum age estimates for the retreat of glacial ice
riksen et al., 2009). Exposed sedimentary bedrock between                of the Kap Fulford Stade to the latest Pleistocene to Early
the present GrIS margin and the terminus of the floating ice             Holocene (> 10.5 ka cal BP) (Kelly and Bennike, 1992) (Ta-
tongue of Ryder Glacier is composed of Cambrian and Sil-                 ble 1, Fig. 2).
urian carbonate shelf sediments. Further seaward, Silurian                  A second set of ice marginal deposits are found along
sands and siltstones deposited in a deeper water turbiditic              many of the fjords 20–60 km inland from the Kap Fulford
environment are found on the lowlands of Nyeboe Land and                 Stade. These are assigned to the Warming Land Stade, rep-
Wulff Land (Henriksen and Higgins, 2000). Older, deformed                resenting a standstill of outlet glaciers draining the retreat-
Cambrian deep-water calcareous mudstones and sandy tur-                  ing ice front. Regionally, the age of the Warming Land Stade
bidites cap the outer headlands of Nyeboe Land and Wulff                 is bracketed between > 9.5 to 8.0 ka cal BP (Kelly and Ben-
Land and are part of the 600 km long E-W trending north                  nike, 1992). Many glacially dammed lakes formed during
Greenland fold belt that formed near the end of the Devonian             the Warming Land Stade as glaciers continued to occupy
and Ellesmerian Orogeny (Higgins et al., 1998) (Fig. 2).                 the fjord systems while the ice margin retreated on land
   Terrestrial mapping of glacial landforms and marine lim-              (Kelly and Bennike, 1992). For example, an ice-dammed
its across Nyeboe Land, Warming Land, and Wulff Land                     lake formed on Wulff Land in the central lowlands between
has defined three regional glacial events from the end of the            Ryder and C. H. Ostenfeld glaciers (Fig. 1). The most prox-
Pleistocene (late Weichselian) through the Holocene (Kelly               imal minimum age constraints for the Warming Land Stade
and Bennike, 1992). The oldest marginal ice limits that are              in Sherard Osborn Fjord come from western Warming Land,
traced across north Greenland belong to the Kap Fulford                  where marine macrofossils in sediments younger than the ice
Stade (Kelly and Bennike, 1992). During this time, the GrIS              margin deposits provide an age of 8210 ± 120 14 C BP (Sta-
extended across the southern parts of many peninsulas, with              tion 36; Kelly and Bennike, 1992). On southeastern Warm-
outlet glaciers flowing to the outer limits of many of the               ing Land molluscs from a marine silt returned an age of

https://doi.org/10.5194/tc-15-4073-2021                                                         The Cryosphere, 15, 4073–4097, 2021
4076                                                M. O’Regan et al.: The Holocene dynamics of Ryder Glacier and ice tongue

Table 1. Key radiocarbon dates originally used to constrain the ages of glacial stages in the vicinity of Sherard Osborn Fjord. Index numbers
refer to original site numbers given in Kelly and Bennike (1992) with locations shown in Fig. 2. Details of the sampling sites are from Kelly
and Bennike (1985) and Bennike and Kelly (1987). Ages were re-calibrated with IntCal 20 (41, 43) or Marine20 using a 1R 300 ± 300,
which is consistent with the new calibrated radiocarbon dates presented in this article. Calibrated ages are rounded to 10 years.

              No.    Area               Relevance                Lab. ID          14 C age (year)     Mean and 1σ range (cal BP)
              31     Nyeboe Land       Kap Fulford Stade        K-4339          10 030 ± 175          10 830 ± 490
                     Shells of Portlandia arctica from marine silts at an elevation of 87 m
              31     Nyeboe Land        Kap Fulford Stade        HAR-6289         9390 ± 90           9690 ± 400
                     Shells of Hiatella arctica from marine silts at 92–93 m
              34     Nyeboe Land       Steensby Stade          K-4380         4870 ± 80               4560 ± 410
                     Shells of Mya truncata and H. arctica from marine silts at 24 m
              36     Warming Land Warming Land Stade HAR-6290 8210 ± 120                       8210 ± 370
                     Shells of M. truncata and H. arctica from outcropping marine silts at 68–70 m, 12 km behind ice front
              40     Warming Land Warming Land Stade HAR-6287 6480 ± 100                        6420 ± 350
                     Shells of M. truncata from marine silts at 26 m that are younger than ice margin deposits
              41     Wulff Land        Steensby Stade           K-4573         5100 ± 130       5830 ± 170
                     Salix twigs from the base of sandy peat at 275 m; station located 100 m from margin of outlet glacier
              43     Wulff Land       Kap Fulford Stade         GU-2588      10 480 ± 90       12 380 ± 270
                     Filamentous green algae from a silt lens embedded in gravelly diamicton at 72 m
              44     Wulff Land        Warming Land Stade K-4374              8000 ± 115         7990 ± 330
                     Shells of M. truncata and H. arctica from a sand layer overlying folded silt and sand at 62 m

6480 ± 100 14 C BP (Station 40; Kelly and Bennike, 1992),                  major fjords. This is true for Ryder’s ice tongue, which was
implying that ice had retreated further inland than this posi-             positioned near the outer margin of Sherard Osborn Fjord
tion by that time. On the eastern edge of Wulff Land, outlet               in 1917 by the Danish geologist and explorer Lauge Koch
glaciers built a series of deltas in the ice-dammed lake during            (Koch, 1928) (Fig. 2). Between 1917 and 1947, Ryder’s
the Warming Land Stade. Marine macrofossils in the lowest                  ice tongue retreated to near its current position (Davies and
delta are dated to 8000 ± 115 14 C BP (Station 44), indicat-               Krinsley, 1962; Higgins, 1990) and has remained relatively
ing that the retreat of C. H. Ostenfeld Glacier and drainage               stable, even exhibiting a net advance of 43 m yr−1 between
of the glacial lake occurred after this time (Kelly and Ben-               1948–2015 (Hill et al., 2018).
nike, 1992). The ice margin continued to retreat following
the Warming Land Stade. In the vicinity of Ryder Glacier, it
likely reached a position equivalent to its modern one by the              3     Materials and methods
Middle Holocene ∼ 6 ka cal BP before receding even further
                                                                           3.1    Marine sediment cores
inland (Kelly and Bennike, 1992).
   The Steensby Stade marks the most recent re-advance of                  Sediment cores from Sherard Osborn Fjord were col-
the ice margin outlet glaciers and local ice caps to their max-            lected during the 37 d Ryder 2019 expedition (5 August–
imum positions since the Kap Fulford Stade. Its onset is                   10 September 2019). Between 13 and 25 August, unusually
poorly dated and occurred sometime during neoglacial cool-                 light sea-ice conditions allowed Oden to occupy nine coring
ing following the Holocene thermal maximum. At the GrIS                    stations and systematically map the fjord (Fig. 2; Jakobsson
margin to the north of Ryder Glacier, peat deposits over                   et al., 2020). Coring was conducted using a 12 m long pis-
which the ice margin advanced provide an age of 5100 ±                     ton core (PC) and small (1–2 m) trigger weight core (TWC),
130 14 C BP (Station 41), while at Steensby Glacier, reworked              as well as a 6 m long gravity core (GC). Piston and grav-
marine macrofossils in lateral moraines yield an age of                    ity cores were collected in liners with an inner/outer diame-
4870 ± 80 14 C BP (Station 34; Kelly and Bennike, 1992).                   ter of 100/110 mm, while TWCs were collected in narrower
Despite uncertainty surrounding the onset of the Steensby                  (80/88 mm) liners.
Stade and subsequent dynamics of Ryder Glacier through the                    Here we focus on cores obtained from five stations that
Late Holocene, the maximum extent is believed to coincide                  were positioned on topographic highs, with two radiocar-
with historical observations that place the terminus of out-               bon dates coming from a sixth station on the outer sill.
let glaciers and ice tongues near the mouth of many of the                 The five main stations form a 45 km long transect extend-

The Cryosphere, 15, 4073–4097, 2021                                                                 https://doi.org/10.5194/tc-15-4073-2021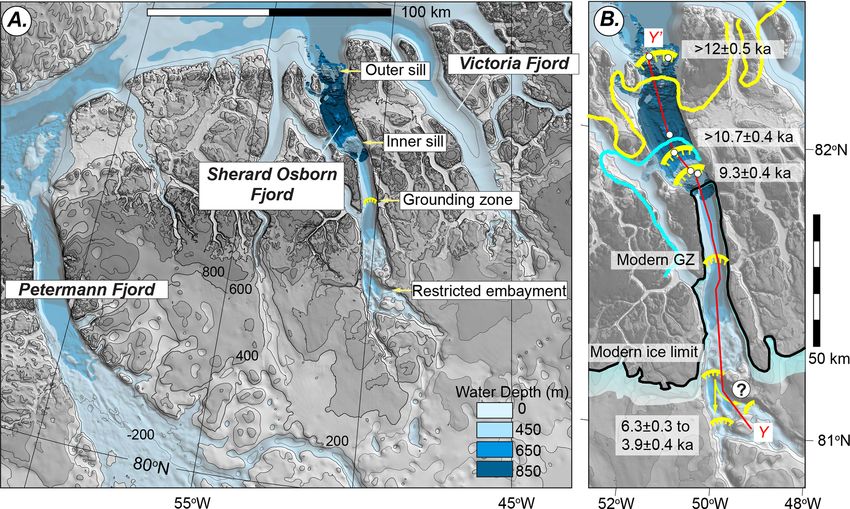
M. O’Regan et al.: The Holocene dynamics of Ryder Glacier and ice tongue                                                             4077

Table 2. Locations, water depths, and lengths of cores used in this study.

                   Station     Core ID            Latitude (◦ N)       Longitude (◦ E)   Water depth (m)   Core length (m)
                   6           Ryder19-6-GC1      82.0095              −51.7408                      633              4.93
                   7           Ryder19-7-GC1      81.9532              −51.5760                      551              5.19
                               Ryder19-7-PC1      81.9518              −51.5878                      559              8.96
                               Ryder19-7-TWC1     81.9518              −51.5878                      559              0.96
                   8           Ryder19-8-GC1      81.8947              −51.1365                      228              4.98
                               Ryder19-8-PC1      81.8928              −51.1315                      238              8.97
                   9           Ryder19-9-GC1      81.8843              −50.9848                      271              5.89
                               Ryder19-9-PC1      81.8908              −50.9682                      274              8.72
                   10          Ryder19-10-GC1     82.2713              −52.0165                      272              2.87
                   11          Ryder19-11-GC1     82.2682              −52.5038                      208              1.34

ing from the edge of the modern ice tongue to the outer                      The mass-specific magnetic susceptibility (χ ) was calculated
sill of Sherard Osborn Fjord (Table 2, Fig. 2). Sub-bottom                   by dividing κ by the bulk density.
profiles were acquired across the coring sites with Oden’s                      After logging, piston and gravity cores were split into
Kongsberg SBP 120 (3◦ × 3◦ ) chirp sonar using a 2.5–7 kHz                   working and archive half sections. Archive halves were de-
pulse. These profiles show that a relatively thin (< 10–15 m)                scribed and imaged using a digital line-scanning camera on
drape of sediments exists on top of the acoustic basement                    the MSCL, while the working half was sampled for shore-
(Fig. 4). This basement surface could be either sedimen-                     based analyses. Split sections were wrapped in plastic film,
tary bedrock or highly consolidated sedimentary units like                   placed in D-tubes and stored in a refrigerated container
till. Hogan et al. (2020) illustrated that in Petermann Fjord,               (4 ◦ C) until they were returned to Stockholm University’s re-
lower-frequency air gun seismic data were required to differ-                frigerated core storage facility. TWCs remained unsplit and
entiate bedrock from more lithified sediments and till.                      placed directly into the refrigerated container.
    The unsplit sediment cores were allowed to equilibrate                      Following the expedition, all archive halves were analyzed
to room temperature (∼ 20 ◦ C) and logged shipboard on                       on an Itrax X-ray fluorescence (XRF) core scanner at the
a Geotek multi-sensor core logger (MSCL). The MSCL                           Department of Geological Sciences, Stockholm University.
provided downcore measurements (1 cm sampling interval)                      Measurements were performed with a Mo tube set to 55 kV
of bulk density (using gamma-ray attenuation) and mag-                       and 50 mA with a downcore measurement resolution of 2 mm
netic susceptibility. Bulk density is controlled by sediment                 and a counting time of 15 s. Here we only present the raw
porosity and grain composition (grain density). In predom-                   counts of calcium (Ca) as a proxy for detrital input from the
inantly lithogenic and normally consolidated marine sedi-                    surrounding Cambrian and Silurian carbonate bedrock ter-
ments, variability in bulk density is a function of grain-size-              rain.
driven changes to porosity (coarser sediments = lower poros-                    Computed tomography (CT) scanning was performed on
ity = higher bulk density). Magnetic susceptibility is a use-                selected archive sections and unsplit TWCs at the Depart-
ful proxy for the input of siliciclastic versus biogenic/organic             ment of Nuclear Medicine and PET Centre of Aarhus Uni-
sediments, and in dominantly lithogenic sediments it can be                  versity Hospital in Denmark using a Siemens Biograph Vi-
used to discriminate between provenance and grain size (Hat-                 sion 600 PET/CT. The CT scan parameters were as follows:
field et al., 2017; Reilly et al., 2019). Gamma-ray attenuation              120 kV, 400 Eff mAs (no CARE Dose4D), 200 mm field of
was measured using a 137 Cs source with a 5 mm collimator                    view, 0.6 mm slice thickness, and filter kernel B60s (sharp).
and a 10 s count time. Magnetic susceptibility was measured                  Images were processed using SedCT MATLAB tools to ob-
with a 125 mm Bartington loop sensor using a 1 s acquisition                 tain a coronal slice through the central region of each core
time. An empirical volume correction was applied to account                  at an effective pixel resolution of 0.5 × 0.5 mm (Reilly et
for the difference between the core diameter (DC ) and the                   al., 2017). Clasts with > 1 mm diameter were automatically
loop diameter (DL ). The volume-specific magnetic suscepti-                  counted from the 3-dimensional CT data, binned into 2 cm
bility (κ, 10−5 SI) is defined as                                            intervals, and normalized by core volume using the algorithm
                                                                             of Reilly et al. (2019) which provides an objective proxy for
κ = κ(uncorrected) /κ(rel) ,                                     (1)
                                                                             ice-rafted debris (IRD) concentration in glaciomarine litho-
where                                                                        facies deposited beyond the limit of grounded ice.
κ(rel) = 4.8566(DC /DL )2 − 3.0163(DC /DL ) − 0.6448. (2)

https://doi.org/10.5194/tc-15-4073-2021                                                           The Cryosphere, 15, 4073–4097, 2021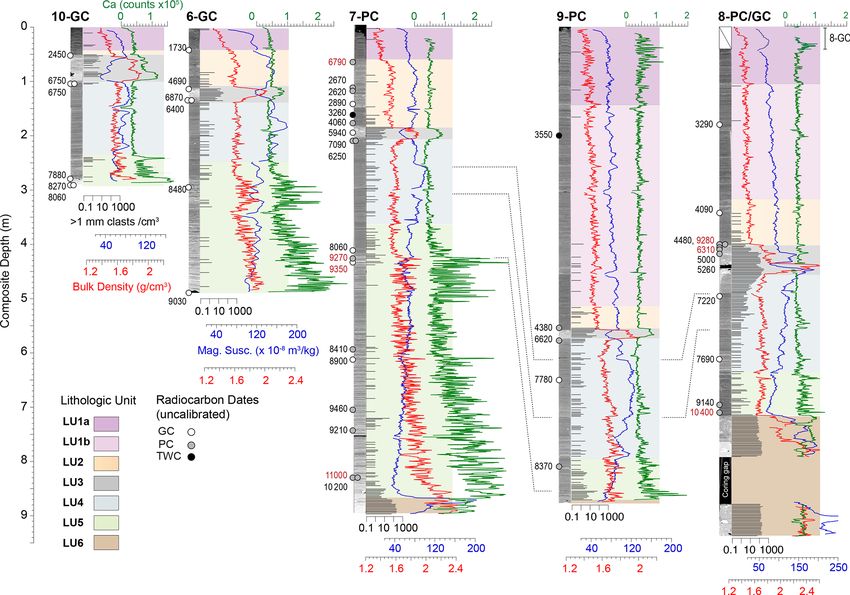
4078                                               M. O’Regan et al.: The Holocene dynamics of Ryder Glacier and ice tongue

                                                                        Figure 3. Potential temperature and salinity profiles illustrating the
                                                                        distribution of Atlantic water in Sherard Osborn Fjord. Vertical
                                                                        black lines are positions of CTD (conductivity, temperature, and
                                                                        depth) casts conducted during Ryder 2019. Yellow circles are the
                                                                        locations of coring sites. The position of site 10 on the outer sill is
                                                                        projected, as this profile does not cross its location (see Fig. S1 in
                                                                        the Supplement for the details on the location of the oceanographic
                                                                        profile).

                                                                        placed in an ultrasonic bath to disaggregate particles before
                                                                        being poured into the Malvern measurement chamber.

                                                                        3.2   Composite depth scales

                                                                        The first attempts at coring in Sherard Osborn Fjord illus-
                                                                        trated that near-surface sediments were very soft. The top of
                                                                        the coring tools were sinking below the seafloor, resulting in
                                                                        poor and variable recovery of near-surface sediments. At sta-
                                                                        tions 7, 8, and 9, multiple coring tools were deployed, and
                                                                        sediments were recovered using all of these devices. A com-
Figure 2. Landsat image of Sherard Osborn Fjord from                    posite depth scale was developed for each station to ensure
30 July 2019 showing locations of cores discussed in this study.        that measurements from the different cores could be inte-
Bedrock geology is from Henriksen et al. (2009). Bathymetry of          grated. The composite depth scales were developed through
Sherard Osborn Fjord was collected during the Ryder 2019 expe-          the correlation of the MSCL bulk density, magnetic suscepti-
dition (Jakobsson et al., 2020). Ice limits for the Kap Fulford (yel-   bility, and XRF-scanning (mainly Ca content) data and addi-
low) and Warming Land (white) stades are redrawn from Kelly and         tionally through visual correlation using the CT images (tie
Bennike (1992). The extent of Ryder’s ice tongue in 1917 (pink)         points for the composite depth scale are provided in Table S1
is re-drawn from Koch (1928). Numbers refer to key locations of         in the Supplement).
radiocarbon dates used by Kelly and Bennike (1992) to constrain
                                                                           The piston core at each station was used as the reference
Holocene ice margin positions (Table 1). The dashed cyan line (x–
                                                                        depth scale. Depths of the gravity and trigger weight cores
x 0 ) marks the location of the oceanographic profile in Fig. 3.
                                                                        were stretched, or compressed, between tie points to the pis-
                                                                        ton cores. At stations 7 and 9, the piston core recovered sedi-
                                                                        ments closer to the seafloor than the gravity or trigger weight
  A total of 29 grain size measurements were made on core               cores. At station 8, the correlation of MSCL and XRF data in-
6-GC to broadly characterize grain size spectra in differ-              dicates that the gravity core recovered 40 cm of near-surface
ent lithologic units. Measurements were performed using                 sediments that were either not recovered or lost from the top
a Malvern Mastersizer 3000 laser diffraction particle size              of the piston core.
analyzer at the Department of Geological Sciences, Stock-
holm University. Wet samples were immersed in a dispers-
ing agent (< 10 % sodium hexametaphosphate solution) and

The Cryosphere, 15, 4073–4097, 2021                                                           https://doi.org/10.5194/tc-15-4073-2021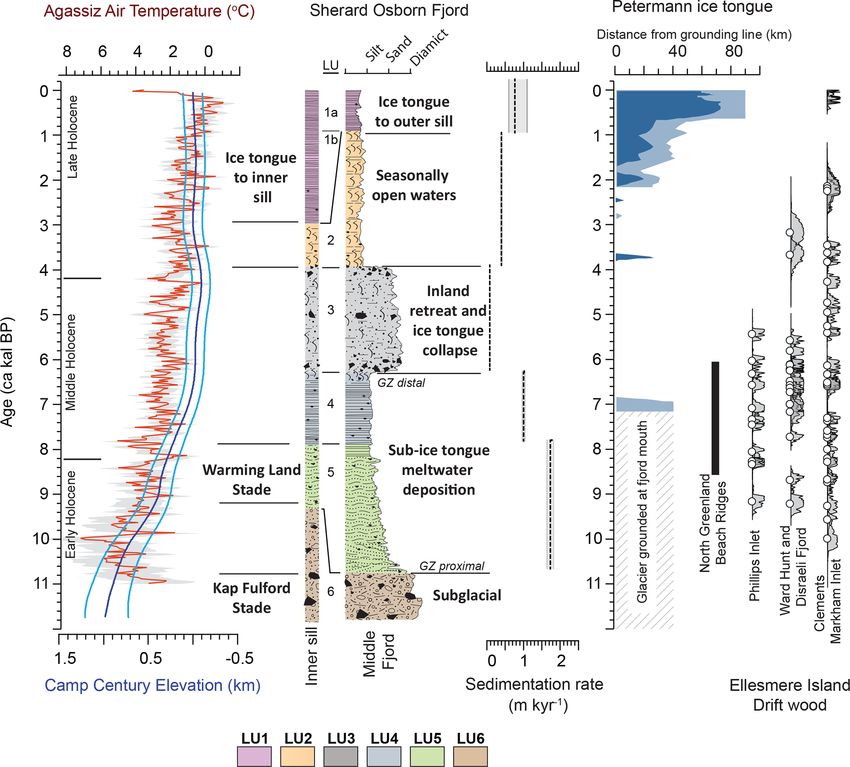
M. O’Regan et al.: The Holocene dynamics of Ryder Glacier and ice tongue                                                         4079

Figure 4. Sub-bottom profiles across coring stations in Sherard Osborn Fjord illustrating the amount of the sedimentary cover on top of
acoustic basement penetrated by each core.

3.3   Radiocarbon dating                                              plied 150-year 1R for marine macrofossils from the region
                                                                      surrounding Ryder Glacier, as suggested for areas of north-
                                                                      ernmost Greenland by Funder (1982). However, Coulthard
Radiocarbon measurements (14 C) were made on 48 sam-                  et al. (2010) found an average 1R of 335 ± 85 years (us-
ples (Table 3). Shipboard and post-cruise sampling focused            ing Marine09; Reimer et al., 2009) based on 24 molluscs
on constraining the ages for lithologic units. Most radiocar-         from the northwestern Canadian Arctic Archipelago, which
bon dates were obtained from 300 specimens of the ben-                includes the northern and western coasts of Ellesmere Is-
thic foraminifera Cassidulina neoteretis (see Cronin et al.,          land. Reilly et al. (2019) argued that a 1R of 770 years
2019; Cage et al., 2021, for discussions of this foraminiferal        (using Marine13; Reimer et al., 2013) provided the best fit
species in the Arctic and Nordic seas respectively). A total          between a stacked paleosecular variation record from Peter-
of 16 dates were obtained from mixed benthic foraminifera             mann Fjord sediments and a North Atlantic reference curve.
(including C. neoteretis, C. reniforme, O. tener, E. exca-            This large 1R was also consistent with offsets between ra-
vatum clavata) and one date from Cibicides lobatulus (Ta-             diocarbon dates on planktic and benthic foraminifera and
ble 3). Additionally, four dates were made from speci-                210 Pb-derived chronologies for the past 100 years. In sum-
mens of the planktic foraminifera Neogloboquadrina pachy-             mary, estimates used in the literature range from 0–770 years.
derma. All radiocarbon measurements were performed at                 In this study we have applied the new Marine20 calibration
the National Ocean Sciences Accelerator Mass Spectrome-               curve (Heaton et al., 2020), which results in ages that are
try (NOSAMS) facility at Woods Hole Oceanographic In-                 ∼ 150 years younger than equivalent Holocene 14 C ages cal-
stitution, Massachusetts, USA. Calibration of the radiocar-           ibrated using Marine09 or Marine13. Taking this into con-
bon dates was performed using OxCal v. 4.4 (Bronk Ram-                sideration we have applied a 1R of 300 ± 300 years. This
sey, 2009) and the Marine20 calibration curve (Heaton et al.,         broad range provides a large uncertainty envelope. The up-
2020).                                                                per bound approaches the older offset found by Reilly et
   There is no a priori information on the local marine reser-        al. (2019) for Petermann Fjord (770 years using Marine13,
voir correction (1R) for Sherard Osborn Fjord or the Lin-             which equates to ∼ 620 years using Marine20), and the lower
coln Sea. Estimates of 1R for nearby regions vary widely              bound approaches the 150 years (which equates to ∼ 0 years
and have been derived using different marine calibration              using Marine20) commonly used to reconstruct terrestrial ice
curves. Results from three pre-bomb living molluscs col-              margins in the area (Kelly and Bennike, 1992; Young and
lected in the vicinity of Thule suggest a 1R of 5 ± 50 years          Briner, 2015). The mean calibrated ages obtained using a
(Mörner and Funder, 1990). Kelly and Bennike (1992) ap-

https://doi.org/10.5194/tc-15-4073-2021                                                     The Cryosphere, 15, 4073–4097, 2021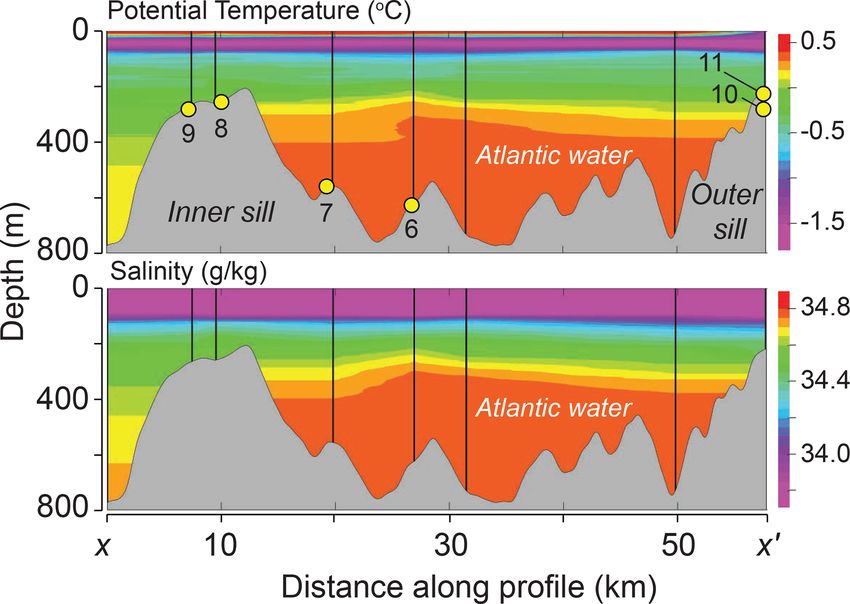
4080 M. O’Regan et al.: The Holocene dynamics of Ryder Glacier and ice tongue
1R of 300 ± 300 years (equivalent to ∼ 450 years using Ma- tion till) or proximal to the grounding line (gravity flow de-
rine13) provide a suitable estimate for sites that are influ- posits), both options imply deposition close to the grounding
enced by Atlantic waters. This dependency on water mass is zone.
one of the underlying problems in determining an applicable LU5. The defining characteristics of LU5 are pronounced
local reservoir correction. For example, the paired benthic millimeter- to centimeter-scale laminations and the absence
and planktic foraminifera samples we ran revealed offsets of of bioturbation. Laminae are sometimes visible in the split
470–570 years in 6-GC and 7-PC which are currently bathed core sections as alternating reddish-brown and lighter tan-
in Atlantic waters, and 0 to 200 years in 10-GC which lies colored layers (Fig. 6). The laminations are best defined
closer to the mixed surface layer (Fig. 3; Table 3). Additional by variations in Ca and bulk density. Where visible to the
work is needed to resolve the issue of local marine reservoir naked eye, the lighter tan-colored laminations are enriched
offsets in the region, their dependency on water mass, and in Ca and denser (lighter in CT-scanning images) (Fig. 6).
how they may have changed through time. Ca-enriched layers are skewed towards medium and coarse
silts, while laminae with lower Ca abundance are skewed to-
wards fine silt and clay (Fig. 8). The higher bulk density of
4 Results the light-colored laminae is likely caused by the coarser grain
size and higher detrital carbonate content, which has a higher
4.1 Lithostratigraphic units grain density compared to quartz and clay minerals. LU5 has
a low abundance of irregularly spaced clasts > 1 mm that are
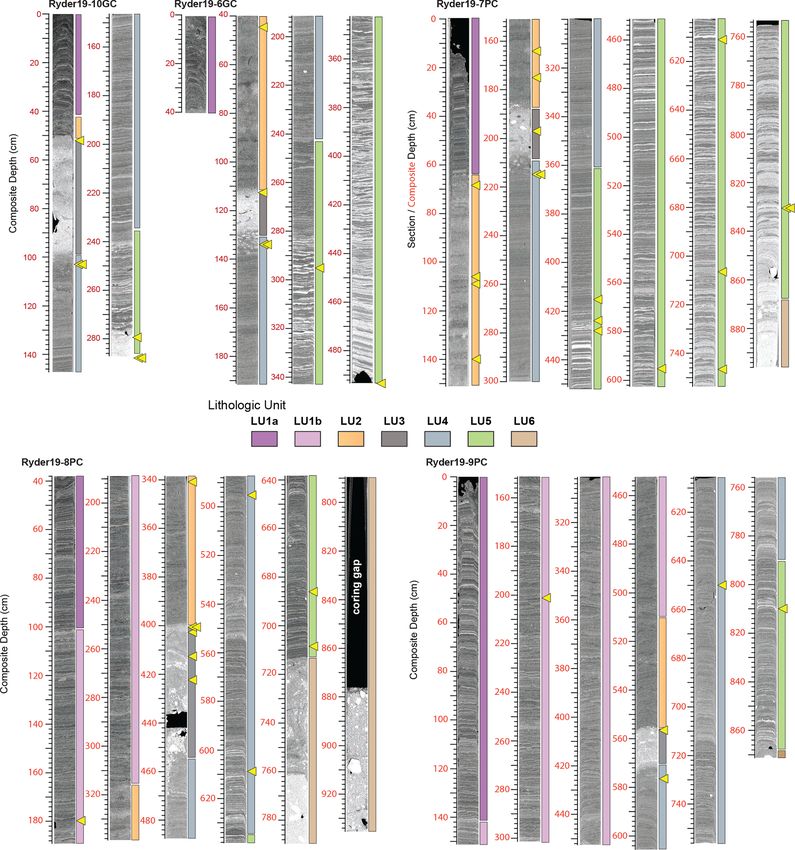
Data from the MSCL, XRF-scanning data, and CT imaging more prevalent near the base of the unit (Fig. 5). In cores 10-
are used to identify six major lithologic units that are corre- GC, 7-PC, and 6-GC, there is a notable up-core decrease in
lated from the fjord mouth (10-GC) to the inner bathymetric the bulk density, Ca-content, and lamina thickness of LU5.
sill lying seaward of the modern ice tongue (cores 8-PC and Mass-specific magnetic susceptibility also increases up-core,
9-PC) (Figs. 5 and 6). A sixth core, 11-GC, located on the as the relative Ca-abundance decreases, consistent with a
outer sill in the shallowest water depth (208 m b.s.l., below larger contribution from siliciclastic sediments. In 6-GC and
sea level), did not contain the same lithostratigraphic units, 7-PC, these long-term trends are interrupted by a 0.50–1.0 m
and only the basal radiocarbon date is used as a constraint for thick interval with elevated Ca contents and thicker laminae
Early Holocene ice retreat. Composite depths for the base of found near the top of the unit.
the lithostratigraphic units are found in Table S2. At the two stations from the inner sill, 8-PC (238 m b.s.l.)
LU6. The lowermost lithologic unit (LU6) was recovered and 9-PC (274 m b.s.l.), LU5 is considerably thinner than in
in 7-PC, 8-PC, and 9-PC. It has moderately high but variable 6-GC (633 m b.s.l.) and 7-PC (559 m b.s.l.), which lie further
Ca contents and is a coarse-grained, poorly sorted diamic- seaward and in deeper water depths (Fig. 5). CT images il-
ton containing abundant gravel (2–64 mm) and cobble-sized lustrate that laminations in much of LU5 are wavy to lentic-
(64–256 mm) clasts with a high bulk density (> 2 g/cm3 ) ular in nature (Figs. 6 and 7). Throughout LU5, the lami-
(Figs. 5 and 7). The mass-specific magnetic susceptibility is nations are disrupted by numerous small-scale normal faults
considerably higher in LU6 compared to the overlying LU5, with occasional evidence of truncation suggesting erosion.
generally exceeding 80–100 × 10−8 m3 /kg. Less than 5 cm This is common throughout LU5 in 8-PC and 9-PC and very
of this unit was recovered in 9-PC, with greater recovery common in the lowermost 1–2 m of 7-PC (see example from
in 7-PC (54 cm) and 8-PC (> 135 cm). The upper boundary 9-PC-6 in Fig. 7 and the Supplement for additional exam-
with LU5 is abrupt in 8-PC and gradual in 7-PC. In 9-PC, ples). In 6-GC and 7-PC, faulting in LU5 is more pronounced
the thin LU6 and lowermost LU5 sediments are laminated, than in the overlying laminated sequence of LU4 (Figs. 6
deformed, and contain two large dropstones, making it diffi- and 7). Laminations become less convoluted and more pla-
cult to determine the nature of the boundary. The LU6–LU5 nar towards the top of LU5. On the outer sill (10-GC), LU5
boundary is marked by a pronounced up-core decrease in is also comparatively thin, containing highly fractured and
bulk density and mass-specific magnetic susceptibility. Two wispy laminations that are truncated or eroded in some inter-
subunits (LU6a and LU6b) are recognized in the longer se- vals. The base of LU5 in 10-GC is dominantly composed of
quences from 7-PC and 8-PC. These subunits are separated sand- and gravel-sized material.
by a sharp boundary (Figs. 6 and 7). Sediments from LU6a The wavy and lenticular nature of laminations in much of
have a lower bulk density (2.0–2.2 g/cm3 ) compared to LU6b LU5 is interpreted as evidence for traction processes under
(2.2–2.5 g/cm3 ) and lower clast abundance. LU6b is a mas- the influence of bottom water currents. We interpret this unit
sive clast-supported diamicton, while LU6a contains lenses as a meltwater-generated laminated facies that transitions
or intervals of visibly deformed fine-grained layers. Given from a grounding line proximal deposit at the base to distal
the succession from a massive to a deformed diamicton, we at the top. The Ca enrichment arises from increased inputs
interpret these units as being deposited beneath grounded ice of detrital carbonate eroded from the surrounding Cambrian
(Figs. 6 and 7). Although we recognize that deformed di- and Silurian bedrock and is more common in the grounding
amictons can be deposited beneath grounded ice (deforma- zone proximal base of the sequence. Evidence for truncation
The Cryosphere, 15, 4073–4097, 2021 https://doi.org/10.5194/tc-15-4073-2021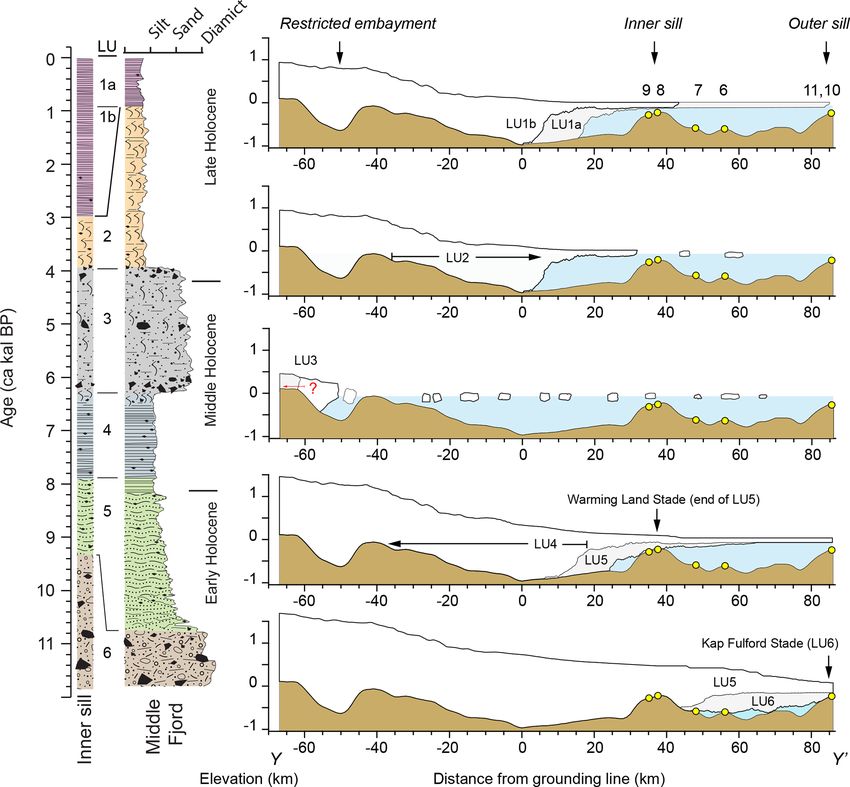
M. O’Regan et al.: The Holocene dynamics of Ryder Glacier and ice tongue                                                             4081

Table 3. Raw and calibrated radiocarbon dates and the type of material analyzed. All data were calibrated using a 1R 300 ± 300 years.
Asterisks highlight ages deemed outliers. All the outliers came from samples with low microfossil abundance on which mixed benthic
assemblages were dated.

 No.    Lab ID   Sample ID              Depth   Comp. depth        14 C age      δ 13 C     Mean               1σ    Material
                 (cm)                    (cm)        (year)           (‰)     (cal BP)    (cal BP)                   dated
 1      152168   6-GC-2, 3–6             44.5          44.5      1730 ± 75      −0.3          850       540–1150     C. neoteretis
 2      156282   6-GC-2, 70–75          112.5         112.5      4690 ± 20      0.98         4330      3970–4770     Mixed benthic
 3      156283   6-GC-2, 93–95, A         134           134      6870 ± 30     −0.13         6830      6510–7190     Mixed benthic
 4      156284   6-GC-2, 93–95, B         134           134      6400 ± 25       0.2         6330      5990–6680     N. pachyderma
 5      152196   6-GC-3, 101–105          295           295      8480 ± 40     −0.83         8550      8180–8920     C. neoteretis
 6      152197   6-GC-CC                  494           494      9030 ± 35     −0.43         9180      8760–9550     C. neoteretis
 7*     156272   7-PC-1, 65–72           68.5          68.5      6790 ± 35     −0.67        6750        6440–7120    Mixed benthic
 8      152208   7-PC-1, 103–109         106           106       2670 ± 20      0.33        1850        1470–2210    Mixed benthic
 9      156294   7-PC-1, 103–115         109           109       2620 ± 45     −0.12        1790        1410–2130    Mixed benthic
 10     152169   7-GC-2, 32–34           101           140       2890 ± 50     −0.62        2100        1720–2480    C. neoteretis
 11     152198   7-TWC-CC                  97          164       3260 ± 25     −0.73        2540        2160–2930    C. neoteretis
 12     156309   7-PC-2, 23–25           175           175       4060 ± 30     −0.54        3540        3150–3940    Mixed benthic
 13     152207   7-GC-2, 85–87           154           197       5940 ± 25       1.2        5820        5520–6190    Cibicides lobatulus
 14     152171   7-PC-2, 63–65, A        215           215       7090 ± 70      −0.7        7050        6750–7420    C. neoteretis
 15     153807   7-PC-2 63–65, B         215           215       6520 ± 35     −0.54        6470        6140–6830    N. pachyderma
 16     156293   7-GC-3, 114–118          335           415      8060 ± 85     −1.62        8070        7710–8380    Mixed benthic
 17*    156310   7-PC-3, 122–126          424           424      9270 ± 45       −1         9500        9100–9920    Mixed benthic
 18*    156308   7-GC-3, 125–127          345           428      9350 ± 45     −1.16        9610      9250–10 050    Mixed benthic
 19     152172   7-PC-4, 143–145        595.5         595.5    8410 ± 100      −0.91        8470        8070–8850    C. neoteretis
 20     152170   7-GC-CC                 520           611     8900 ± 100      −1.06        9020        8630–9430    C. neoteretis
 21     152209   7-PC-5, 103–105        706.5         706.5      9460 ± 45     −0.72        9750      9390–10 170    C. neoteretis
 22     152173   7-PC-5, 143–145        746.5         746.5      9210 ± 95     −0.72        9420        9010–9850    C. neoteretis
 23*    156295   7-PC-6, 76–78, A       830.5         830.5   11 000 ± 160     −0.96       11850     11 410–12 380   Mixed benthic
 24     152210   7-PC-6, 76–78, B       830.5         830.5    10 200 ± 40     −0.28       10 730    10 330–11 160   C. neoteretis
 25     154575   8-GC-2, 102–104          149           180     3290 ± 25       1.46        2580        2200–2970    C. neoteretis
 26     152211   8-GC-3, 102–104         301            341     4090 ± 20       N/A         3580        3190–3980    C. neoteretis
 27     156285   8-PC-3, 61–63, B       362.5         400.5     4480 ± 20      −0.04        4070        3680–4480    C. neoteretis
 28*    156311   8-PC-3, 61–63, A       362.5         400.5     9280 ± 35      −0.31        9520        9120–9930    Mixed benthic
 29*    156312   8-PC-3, 63–65          364.5         402.5     6310 ± 30       0.32        6230        5900–6580    Mixed benthic
 30     156288   8-PC-3, 73–75          374.5         412.5     5000 ± 20      −1.03        4720        4370–5170    Mixed benthic
 31     152213   8-PC-3, 83–85          384.5         422.5     5260 ± 30      −0.27        5040        4710–5460    C. neoteretis
 32     152212   8-GC-4, 62–64          411.5           495     7220 ± 40      −0.37        7190        6900–7540    C. neoteretis
 33     152174   8-GC-CC                 499           609      7690 ± 65      −0.85        7680        7380–8000    C. neoteretis
 34     152298   8-PC-5, 46–49           648           686      9140 ± 40      −0.75        9330        8940–9750    C. neoteretis
 35     156313   8-PC-5, 68–72          670.5         708.5    10 400 ± 70     −0.62       11 010    10 550–11 450   Mixed benthic
 36     152279   9-TWC-CC                101           201       3550 ± 55     −0.31         2900      2550–3320     Mixed benthic
 37     152300   9-PC-4, 103–105        556.5         556.5      4380 ± 25     −0.33         3940      3560–4350     C. neoteretis
 38     152280   9-PC-4, 123–125        576.5         576.5      6620 ± 65     −0.47         6570      6250–6940     C. neoteretis
 39     152299   9-GC-CC                 590           650       7780 ± 40      −0.5         7770      7460–8080     C. neoteretis
 40     152281   9-PC-6, 53–55            810          810      8370 ± 110     −0.79         8420      8010–8780     C. neoteretis
 41     156287   10-GC-1, 50–54           50            50       2450 ± 20     −0.05         1600      1250–1950     Mixed benthic
 42     152301   10-GC-1, 102–104, A     103           103       6750 ± 35      −0.6         6710      6380–7070     C. neoteretis
 43     153806   10-GC-1, 102–104, B     103           103       6750 ± 30      0.15         6710      6390–7070     N. pachyderma
 44     152302   10-GC-2, 132–134       279.5         279.5      7880 ± 45     −0.34         7880      7560–8190     C. neoteretis
 45     152282   10-GC-CC, A             288           288       8270 ± 90     −0.59         8310      7910–8640     C. neoteretis
 46     153808   10-GC-CC, B             288           288       8060 ± 35     −1.61         8060      7720–8370     N. pachyderma
 47     152303   11-GC-1, 12–14            13            13      7540 ± 30      −0.3        7520        7240–7860    C. neoteretis
 48     152283   11-GC-1, 102–104         103           103   11 150 ± 250     −0.24       12 010    11 580–12 610   C. neoteretis

https://doi.org/10.5194/tc-15-4073-2021                                                       The Cryosphere, 15, 4073–4097, 2021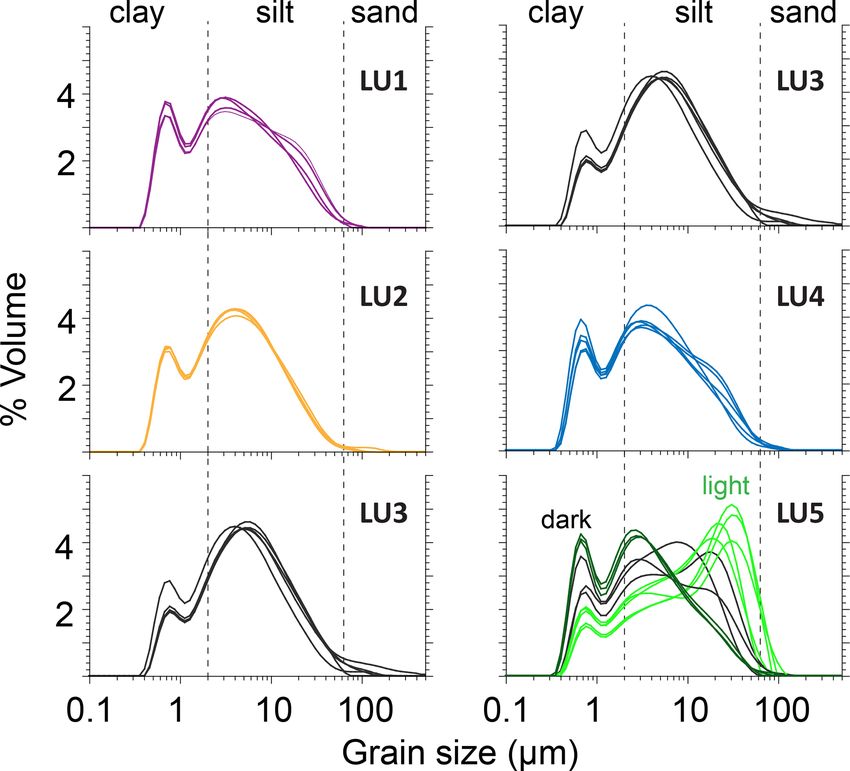
4082                                            M. O’Regan et al.: The Holocene dynamics of Ryder Glacier and ice tongue

of laminations indicates somewhat discontinuous deposition          a generally coarser mean grain size compared to LU4 and a
with more frequent episodes of erosion near the base of LU5         larger sand-sized contribution (up to 4.5 %) (Fig. 8). The only
when deposition occurred closer to the grounding zone. The          indication of deformation is seen in 8-PC surrounding the re-
thinner nature of LU5 at on the shallow inner sill (8-PC, 9-        gion where large dropstones were recovered. The absence of
PC), and lack of relatively coarse, Ca-enriched laminae like        deformation at the other sites suggests that this is an artifact
those found near the base of LU5 in 6-GC and 7-PC, indi-            of coring and not a primary depositional feature. We inter-
cates a later onset for continuous sedimentation. On the outer      pret LU3 as a glaciomarine diamicton, primarily composed
sill, the more condensed LU5 in 10-GC also indicates a more         of ice-rafted material deposited by icebergs and sea ice.
dynamic depositional environment likely influenced by cur-              LU2. A sharp but bioturbated boundary separates LU3
rent activity or ice scouring.                                      from LU2 at all sites except 10-GC on the outer sill. The
   LU4. Faint, planar millimeter-scale laminations that lack        defining characteristic of LU2 is the presence of bioturbation
notable evidence for bioturbation define LU4. The transi-           and lack of preserved laminations. This unit exhibits very
tion between LU5 and LU4 is gradual, with the base of LU4           little variation in the bulk density or Ca content (Fig. 5), is
being identified by a notable and correlative decline in Ca-        composed primarily of fine silt and clay, and contains very
abundance that is identified at all the coring stations (Fig. 5).   few scattered ice-rafted clasts (Fig. 7). The thickness of LU2
Laminations in LU4 are only weakly visible with the naked           varies considerably across the fjord, with the thickest occur-
eye but are evident in the CT scanning data (Fig. 7). In 7-         rences in 6-GC and 7-PC. LU2 is nearly absent in sediments
PC and 6-GC, laminations appear to transition from wavy to          from the outer sill (10-GC) where there is an abrupt and non-
lenticular with frequent faulting in LU5 to planar in LU4.          bioturbated contact between LU3 and LU2 (Fig. 5).
With the exception of 10-GC on the outer sill, coarse ice-              LU1. A return to a laminated facies lacking coarse ice-
rafted clasts remain dispersed in low numbers through LU4.          rafted clasts and bioturbation defines LU1. The grain size
LU4 is a silty clay containing very minor amounts of sand           spectra of LU1 closely resemble those from LU4 (Fig. 8).
(< 1 %), with some samples showing a slight elevation of            The laminations in LU1 are also highly fractured and dis-
medium to coarse silt (Fig. 8). The bulk density remains rel-       torted along the sides of the core. This is attributed to coring
atively constant (1.6–1.8 g/cm3 ) with mass-specific magnetic       disturbance and the soft nature of these near-surface sedi-
susceptibility higher than in LU5 and increasing up-core to-        ments. LU1 is divided into two subunits. LU1b is only found
wards the top of the unit, consistent with a continued up-core      at stations 8 and 9 on the inner sill. It is a faintly laminated
decrease in detrital carbonate concentrations. Occasional mi-       unit with some discrete intervals where the laminations are
nor pulses of Ca are seen throughout the unit. The LU5 to           disturbed, sometimes by bioturbation. LU1b has low abun-
LU4 transition appears correlative across the fjord, and many       dances of Ca, similar to what is found in LU2 and LU4
small-scale features in the Ca, bulk density, and magnetic          (Fig. 5). LU1a is marked by the emergence of more pro-
susceptibility logs can be traced between the sites (Fig. 5).       nounced millimeter- to centimeter-scale laminations that are
   We interpret LU4 as laminated-meltwater-influenced sed-          only seen clearly in the CT images (Fig. 7). LU1a is marked
iments dominated by suspension settling in an ice distal en-        by increased Ca concentrations which are most apparent in
vironment. This is consistent with the gradual transition seen      9-PC and 7-PC (Fig. 4). At stations 10, 6, and 7, LU1a sits
between LU5 and LU4. The apparent correlative nature of             abruptly on top of LU2 (Fig. 5), while at stations 8 and 9,
LU4 across the fjord suggests uniform and continuous depo-          there is a gradual transition between LU1b and LU1a.
sition.
   LU3. Throughout Sherard Osborn Fjord, LU4 is capped by           4.2   Ages of unit boundaries
LU3, a second diamicton containing large gravel to cobble-
sized clasts (Figs. 6 and 7). LU3 is recognized by its high         Radiocarbon dating is used to constrain the ages of lithos-
bulk density (1.8–2.0 g/cm3 ), elevated Ca-content, and abun-       tratigraphic unit and subunit boundaries. In most cases sam-
dant clast content (Fig. 5). LU3 has a low-mass-specific mag-       ples were collected from within a few centimeters of these
netic susceptibility except at 8-PC from which cobble and           boundaries in one or more cores (Fig. 5). The youngest age
bolder sized clasts of felsic rocks were recovered, which pre-      underlying a unit or subunit boundary is used to provide a
sumably led to the high susceptibility measurements. CT im-         maximum age for the boundary (Fig. 9). However, this is not
ages from 6-GC and 7-PC show that the lower boundary is             possible for the LU5–LU6 and LU1b–LU2 boundaries. For
heavily bioturbated, while at 8-PC and 9-PC it is marked by         LU6 the oldest age from the overlying unit is adopted as the
a higher concentration of coarse clasts that tend to fine up-       minimum boundary age. A younger than and older than age
wards (Fig. 7). At 8-PC the coarse clasts appear to have been       is provided for LU1b, based upon dates obtained from two
smeared down the inside of the core liner, artificially increas-    different cores (Table 4). Of the 48 radiocarbon dates, 7 were
ing the clast content of the underlying LU4. In all cores, the      identified as outliers because the underlying ages are younger
lower boundary of LU3 and uppermost 5–10 cm of LU4 are              and fell outside the 1σ calibrated age range. The lowermost
bioturbated. The upper boundary of LU3 is relatively sharp          sample in 8-PC (Sample #35, Table 3) is also considered an
at all sites. The matrix material of LU3 is clayey silt with        outlier due to the substantially younger age returned in a sam-

The Cryosphere, 15, 4073–4097, 2021                                                    https://doi.org/10.5194/tc-15-4073-2021
M. O’Regan et al.: The Holocene dynamics of Ryder Glacier and ice tongue                                                       4083

Figure 5. Summary of stratigraphy and correlation of lithologic units between coring stations in Sherard Osborn Fjord. Locations and
uncalibrated ages of radiocarbon dates are shown. Key horizons in LU5 and LU4 that can be correlated between 7-PC, 8-PC, and 9-PC are
illustrated by thin black lines. Depths for lithologic unit boundaries are provided for each coring station in the Supplement.

ple 22.5 cm up-core (Sample #34, Table 3), and the fact that         rely on the numerous other older dates obtained from the base
it was obtained on a mixed benthic assemblage. On the other          of LU2 to date this boundary (Fig. 9). Similarly, based on the
hand, LU5 sediments from this site were not deposited con-           occurrence of truncated laminae seen clearly in the CT im-
tinuously, implying periods of erosion or non-deposition that        ages, frequent intervals of erosion are indicated during depo-
could account for the large difference in ages between the           sition of LU5 (Fig. 9). Examples of this in 7-PC, 8-PC, and
lowermost dates in 8-PC (Fig. 9). In any case, due to the gen-       9-PC are provided in Fig. S9.
eral uncertainty about the accuracy of this date, we have de-
cided to treat it as an outlier.
   The lithologic sequence from Sherard Osborn Fjord sedi-           5     Discussion
ments spans nearly the entire Holocene (Table 4), with the
oldest boundary (LU5/LU6) dated in 7-PC (Sample #24)                 5.1    Overview of the Holocene lithostratigraphic
to 10 200 ± 40 14 C years (10 330–11 160 cal BP), while the                 succession
youngest boundary (LU1a/2) is dated in 6-GC (Sample #1)
to 1730 ± 40 14 C years (540–1150 cal BP). The oldest age            The succession of stratigraphic units recovered in Sherard
comes from 11-GC (Sample #48, 11 150±250 14 C years) and             Osborn Fjord mirrors the classic deglacial facies transitions
provides a constraint on the timing for ice retreat from the         described from ice-shelf settings of Antarctica (Smith et al.,
outer sill.                                                          2019) and high-latitude Northern Hemisphere fjords occu-
   The transition between LU3 and LU2 in 10-GC is more               pied by marine-terminating outlet glaciers and floating ice
abrupt than in other cores and is not bioturbated (Fig. S8). We      tongues (O’Cofaigh and Dowdeswell, 2001; Reilly et al.,
infer a hiatus across this transition and do not use the younger     2019) (Fig. 10). The interpretations of the stratigraphic units
age (Sample #41, Table 3) to date this boundary. Instead we          are here used to reconstruct Ryder Glacier’s dynamical his-

https://doi.org/10.5194/tc-15-4073-2021                                                    The Cryosphere, 15, 4073–4097, 2021
4084                                             M. O’Regan et al.: The Holocene dynamics of Ryder Glacier and ice tongue

Figure 6. CT images and associated lithologic units for each core. White in CT images corresponds to higher density zones and black to
lower density zones. Yellow triangles represent levels of radiocarbon dates. Larger images showing section depths and composite depths are
provided in Figs. S2–S6.

tory (Fig. 11). The Sherard Osborn Fjord sequence involves             ing zone distal facies deposited by suspension settling (LU4)
a basal subglacial to glaciomarine diamicton (LU6) overlain            beneath a floating ice tongue (Fig. 9).
by a laminated meltwater-dominated facies. The laminated                  The laminated grounding zone distal facies (LU4) is
facies fines upwards from a grounding zone proximal deposit            abruptly terminated by a clast-rich diamicton (LU3). Similar
with evidence for traction current activity (LU5) to a ground-         facies transitions have been described as a response to migra-
                                                                       tion of the ice shelf calving front, glacier surging or advance,

The Cryosphere, 15, 4073–4097, 2021                                                         https://doi.org/10.5194/tc-15-4073-2021
M. O’Regan et al.: The Holocene dynamics of Ryder Glacier and ice tongue 4085 Figure 7. Examples of CT images and color photographs representative of the six lithologic units. The vertical scale for each image is a constant 50 cm. The structures seen on the CT images and the color photographs are not identical because the imaging planes are slightly different. The CT images are representative 2-dimensional slices of the core interior, whereas the photos show the surface of split cores. White in CT images corresponds to higher density zones and black to lower density zones. Composite depths for each interval are given in red. https://doi.org/10.5194/tc-15-4073-2021 The Cryosphere, 15, 4073–4097, 2021
4086                                                M. O’Regan et al.: The Holocene dynamics of Ryder Glacier and ice tongue

Table 4. Key radiocarbon dates and calibrated ranges defining basal ages of lithologic (sub-)unit boundaries. Calibrated ages and uncertainty
are rounded to 100 years, with the mean age from the calibrated age range reported. The first column refers to the radiocarbon date index
number from Table 3.

                             No.    Sample                     Unit              14 C age (year)    Age (cal ka BP)
                             1      06-GC-2, 3–6 cm            1a                1730 ± 75          0.9 ± 0.3
                             36     9-TWC-CC                   1b                > 3550 ± 55        2.9 ± 0.4
                             26     8-GC-3, 102–104            1b                < 4090 ± 20        3.6 ± 0.4
                             37     9-PC-4, 103–105 cm         2                 4380 ± 25          3.9 ± 0.4
                             4      06-GC-2, 93–95 cm, B       3                 6400 ± 25          6.3 ± 0.3
                             44     10-GC-2, 132–134 cm        4                 7880 ± 45          7.9 ± 0.3
                             24     7-PC-6, 76–78 cm, B        5 (mid-fjord)     10 200 ± 40        10.7 ± 0.4
                             34     8-PC-5, 46–49 cm           5 (inner sill)    9140 ± 40          9.3 ± 0.4

                                                                           tions of Lauge Koch, who mapped the ice-tongue limit in
                                                                           proximity to the outer sill in 1917 (Koch, 1928) (Fig. 2).

                                                                           5.2    Early Holocene glacier and ice tongue dynamics

                                                                           The oldest recovered sediments come from 11-GC on the
                                                                           outer sill where a sample of the benthic foraminifera Cas-
                                                                           sidulina neoteretis returned a date of 12 ± 0.5 ka cal BP. Due
                                                                           to the limited amount of sediment that has accumulated
                                                                           above the bedrock/till at 6-GC, 10-GC and 11-GC (Fig. 4),
                                                                           we interpret this as a minimum age for the retreat of Ry-
                                                                           der Glacier from the outer sill, where it was grounded 80–
                                                                           90 km seaward from its current position (Fig. 11). Deposi-
                                                                           tion of the grounding zone proximal meltwater sediments
                                                                           (LU5) above a likely subglacial diamicton in 7-PC com-
                                                                           menced at 10.7 ± 0.4 ka cal BP, indicating that the glacier
                                                                           had retreated further inland by this time (Fig. 10). The cal-
                                                                           ibrated ranges of radiocarbon dates from the base of 7-PC
                                                                           (10.3–11.1 ka cal BP) conform to the reported age for the Kap
Figure 8. Grain-sized spectra of lithologic units 1–5 illustrating the
                                                                           Fulford Stade (> 10.5 ka cal BP) (Kelly and Bennike, 1992)
similar grain size distributions of sediments in LU1 and LU4, as
                                                                           (Fig. 11). It is less certain if the older age from 11-GC on the
well as the difference between the dark (less dense) and light (more
dense) laminations in LU5.                                                 outer sill (11.6–12.6 ka cal BP) (Fig. 9, Table 3) implies that
                                                                           grounded ice was here during the Kap Fulford Stade or an
                                                                           earlier stage of deglaciation.
                                                                              Following the retreat of Kap Fulford glacial ice, the sed-
or ice shelf collapse (Smith et al., 2019). In Sherard Osborn              imentary sequence is dominated by the Ca-rich laminated
Fjord, the overlying sediments (LU2) are clast poor with ex-               meltwater facies (LU5). The coarser-grained Ca-enriched
tensive bioturbation suggesting deposition under more pro-                 laminae are associated with increased meltwater input from
ductive surface waters indicative of less extensive surface ice            glacial erosion of the surrounding Cambrian and Silurian car-
cover. As such, the facies succession, with LU3 separating                 bonate shelf bedrock (Fig. 2). The strong meltwater signal
the grounding zone distal (LU4) and more open-water biotur-                captured in LU5 coincides with the rapid Early Holocene re-
bated sediments (LU2), is consistent with a collapse of Ry-                duction in the height of the GrIS (Lecavalier et al., 2017)
der’s ice tongue. The removal of an ice tongue marking the                 (Fig. 10).
onset of LU3 allowed enhanced input of poorly sorted ice-                     Sediments from LU5 are comparatively thin at the inner
rafted material as debris-laden icebergs calved directly from              sill coring sites and difficult to directly correlate with the
the grounding zone and were able to traverse the fjord. A re-              records from 6-GC and 7-PC. Erosional events identified in
turn to a laminated facies (LU1), similar in character to LU4,             LU5 sediments from the inner sill suggest discontinuous sed-
indicates the successive re-establishment of an ice tongue                 imentation (see 9PC-6, Figs. 7 and S9). Sitting in much shal-
that eventually extended to the outer sill in Sherard Osborn               lower water depths (228–271 m b.s.l.; Table 1), glacial ice
Fjord. This interpretation is supported by historical observa-             likely remained grounded here after it retreated from sta-

The Cryosphere, 15, 4073–4097, 2021                                                                https://doi.org/10.5194/tc-15-4073-2021
M. O’Regan et al.: The Holocene dynamics of Ryder Glacier and ice tongue 4087 Figure 9. Likelihood distributions of calibrated radiocarbon dates illustrating the mean and 1σ age ranges. Color-coding is used to identify the lithologic unit that each date was acquired from. Dates from each core are presented in their stratigraphic order. White indicates ages that are deemed to be outliers. Yellow stars indicate dates used to define the ages of unit boundaries (Table 4). On the inner sill, the age range for the LU2–LU1b transition is bracketed by an “older than” and “less than” age from 9-PC and 8-PC respectively. Index numbers correspond to those in Tables 3 and 4. Date #47 from 11-GC is not shown as it could not be definitively placed within a lithologic unit. Np indicates date obtained on N. pachyderma. tions 6 and 7. Deposition on the inner sill would also have 8.0 ka cal BP by Kelly and Bennike (1992). The shallow in- been influenced by bottom scouring currents and debris flows ner sill, first identified through bathymetric mapping during while the glacier was grounded (or near flotation) on shallow the Ryder 2019 expedition (Jakobsson et al., 2020), is very regions of the sill that rise to depths of 193 m. Therefore, close to the previously inferred grounding zone location for we suggest that Ryder Glacier remained grounded on or near the Warming Land Stade and provides a natural pinning point the inner sill until sometime after 9.3 ± 0.4 ka cal BP, which for the marine-based glacier during this standstill (Fig. 2). marks the onset of continuous sedimentation of LU5 at this In 6-GC and 7-PC there is a broad period of elevated de- location (Fig. 11; Table 4). This is consistent with the age trital carbonate delivery (high Ca-content) that occurs near of the Warming Land Stade, bracketed between > 9.5 and the top of LU5 (Fig. 5). This likely reflects enhanced melt- https://doi.org/10.5194/tc-15-4073-2021 The Cryosphere, 15, 4073–4097, 2021
You can also read