Benthic foraminifera as tracers of brine production in the Storfjorden "sea ice factory"
←
→
Page content transcription
If your browser does not render page correctly, please read the page content below
Biogeosciences, 17, 1933–1953, 2020
https://doi.org/10.5194/bg-17-1933-2020
© Author(s) 2020. This work is distributed under
the Creative Commons Attribution 4.0 License.

Benthic foraminifera as tracers of brine production in
the Storfjorden “sea ice factory”
Eleonora Fossile1 , Maria Pia Nardelli1 , Arbia Jouini1 , Bruno Lansard2 , Antonio Pusceddu3 , Davide Moccia3 ,
Elisabeth Michel2 , Olivier Péron4 , Hélène Howa1 , and Meryem Mojtahid1
1 LPG-BIAF  UMR-CNRS 6112, UNIV Angers, CNRS, UFR Sciences, 2 bd Lavoisier 49045, Angers CEDEX 01, France
2 LSCE, UMR 8212, IPSL-CEA-CNRS-UVSQ-Université Paris Saclay, 91198 Gif-sur-Yvette, France
3 Department of Life and Environmental Sciences, University of Cagliari, 09126 Cagliari, Italy
4 SUBATECH, UMR 6457, CNRS-Université de Nantes, 4 rue A. Kastler, 44307 Nantes, France

Correspondence: Eleonora Fossile (eleonora.fossile@etud.univ-angers.fr)

Received: 4 October 2019 – Discussion started: 15 November 2019
Revised: 10 February 2020 – Accepted: 2 March 2020 – Published: 9 April 2020

Abstract. The rapid response of benthic foraminifera to en-        the potential use of the A/C ratio as a proxy for brine persis-
vironmental factors (e.g. organic matter quality and quan-         tence and overflow in Storfjorden.
tity, salinity, pH) and their high fossilisation potential make
them promising bio-indicators for the intensity and recur-
rence of brine formation in Arctic seas. Such an approach,
however, requires a thorough knowledge of their modern             1   Introduction
ecology in such extreme settings. To this aim, seven sta-
tions along a north–south transect across the Storfjorden          The polar regions are particularly sensitive to climate change,
(Svalbard archipelago) have been sampled using an inter-           as evidenced from the several dramatic alterations in recent
face multicorer. This fjord is an area of intense sea ice for-     decades (Peings, 2018). For instance, Arctic surface tem-
mation characterised by the production of brine-enriched           peratures have increased at twice the global rate (i.e. Arc-
shelf waters (BSW) as a result of a recurrent latent-heat          tic amplification; Holland and Bitz, 2003; Dai et al., 2019),
polynya. Living (rose bengal-stained) foraminiferal assem-         while sea ice cover has been steadily decreasing over recent
blages were analysed together with geochemical and sed-            decades both in extent and volume (IPCC, 2013; Labe et al.,
imentological parameters in the top 5 cm of the sediment.          2018). With less ice present, the ocean surface absorbs con-
Three major biozones were distinguished. (i) The “inner            siderably more sunlight energy. This leads to further warm-
fjord” zone, dominated by typical glacier proximal calcare-        ing of the atmosphere and the ocean, therefore enhancing sea
ous species, which opportunistically respond to fresh organic      ice melting, which, in turn, affects marine and continental
matter inputs. (ii) The “deep basins and sill” zone, charac-       ecosystems (Perovich and Richter-Menge, 2009).
terised by glacier distal agglutinated fauna; these are either        A recent review study compiling several high-resolution
dominant because of the mostly refractory nature of organic        terrestrial proxies show that the modern decline in Arctic sea
matter and/or the brine persistence that hampers the growth        ice is unprecedented compared to at least the last few thou-
of calcareous species and/or causes their dissolution. (iii) The   sand years and is unexplainable by known natural variability
“outer fjord” zone, characterised by typical North Atlantic        (e.g. Kinnard et al., 2011). To better understand how and how
species due to the intrusion of the North Atlantic water in the    much natural and anthropogenic forcing factors control sea
Storfjordrenna. The stressful conditions present in the deep       ice dynamics, there is a need for more high-resolution ma-
basins and sill (i.e. acidic waters and low food quality) result   rine time series covering the historical period (i.e. hundreds
in a high agglutinated / calcareous ratio (A/C). This supports     of years) and for robust biological proxies in key areas from
                                                                   the circum-Arctic. Storfjorden, a semi-enclosed bay located
                                                                   in the Svalbard archipelago (Fig. 1a), is one of the Arctic re-

Published by Copernicus Publications on behalf of the European Geosciences Union.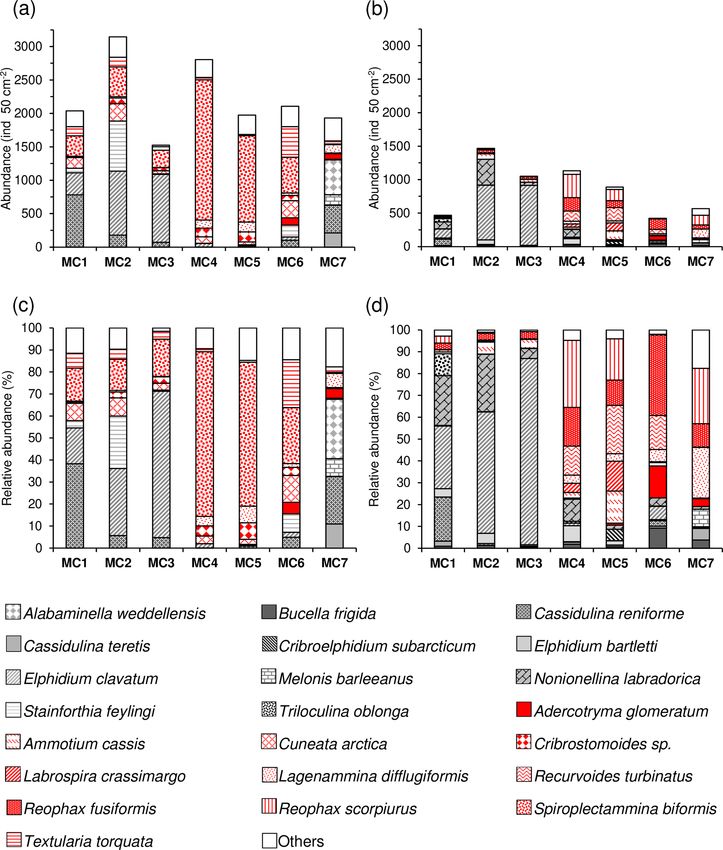
1934            E. Fossile et al.: Benthic foraminifera as tracers of brine production in the Storfjorden “sea ice factory”

gions particularly suitable for studying first-year sea ice dy-     sen, 1995; Korsun et al., 1995; Hald and Korsun, 1997; Ko-
namics. Indeed, Skogseth et al. (2004) defined Storfjorden as       rsun and Hald, 2000; Sabbatini et al., 2007; Ivanova et al.,
an “ice factory” because of the presence of a recurrent coastal     2008; Forwick et al., 2010; Zaja̧czkowski et al., 2010; Łacka
                                                                                                                                ˛
polynya that contributes to about 5 %–10 % to the total brine       and Zaja̧czkowski, 2016; Jernas et al., 2018). To our knowl-
waters produced on Arctic shelves (Smedsrud et al., 2006).          edge, none of these studies targeted the influence of brine-
Brine are salty and CO2 -rich waters (i.e. low pH) (Rysgaard        enriched shelf waters (BSW).
et al., 2011) that are produced when sea ice forms in inner            To develop a robust biological marine proxy of environ-
fjords, and for this reason they can be used as proxies for sea     mental variation based on communities of benthic fossil
ice production. Because of their high density, they cascade         foraminifera, it is crucial to understand their modern ecol-
after mixing with shelf waters (Skogseth et al., 2005a) and         ogy well in this specific environment beforehand. To pro-
ventilate the deep sea (Rumohr et al., 2001). During cascad-        vide new insights on this issue, here we investigate living
ing, brine may cause sedimentary disturbance as they can re-        (rose bengal-stained) benthic foraminiferal fauna from Stor-
lease downslope turbidity flows (Rumohr et al., 2001) and, in       fjorden and their response to various measured environmen-
the meantime, export particulate and dissolved inorganic and        tal variables (e.g. sediment characteristics, organic matter
organic carbon from the productive surface waters down to           quantity and composition, sediment oxygen and pH micro-
the seafloor (Anderson et al., 2004). The brine’s contribution      profiles) that are further linked with BSW. Furthermore, the
to maintaining the halocline of the Arctic Ocean (Aagaard           interpretation of our results integrates the extended literature
et al., 1985; Cavalieri and Martin, 1994) and its influence         of the physical oceanography in this specific semi-enclosed
on the ocean circulation further underline the need to study        bay (e.g. Haarpaintner et al., 2001a, b, c; Omar et al., 2005;
brine evolution in recent times in relation to global warm-         Skogseth et al., 2004, 2005a, b, 2008; Geyer et al., 2009; Jar-
ing. In fact, the current Arctic amplification will determine       don et al., 2014).
a decrease in the production of sea ice in several polynyas
from the Arctic region (Tamura and Ohshima, 2011) and,
in the future scenario of an ice-free Arctic Ocean during           2   Oceanographic and environmental settings
summer (IPCC, 2013), sea ice factories will gradually dis-
appear. However, these predictions are largely based on di-         The Svalbard archipelago, located north of the Arctic cir-
rect observations on a short timescale (i.e. satellite data since   cle, extends from 74 to 81◦ N and 10 to 35◦ E (Fig. 1a). It
1979), which only opens a narrow window on the natural              is surrounded by the Arctic Ocean to the north, the Barents
variability of sea ice dynamics. The scientific community is        Sea to the south and east, and the Norwegian and Greenland
now focusing on longer time series to place the recent trends       seas to the west. Storfjorden, the biggest fjord in the Sval-
in a longer-term perspective (i.e. multi-centennial timescale)      bard archipelago, is approximately 190 km long with a maxi-
(Nicolle et al., 2018) and validate these scenarios.                mum water depth of ∼ 190 m present in a central deep glacial
   Benthic foraminifera are among the most abundant pro-            trough (referred to as deep basins in Fig. 1b). The north-
tists living in marine ecosystems, from brackish waters to          ern part of Storfjorden (i.e. inner fjord; Fig. 1b) is connected
abyssal plains (e.g. Murray, 2006). Due to their short life         with the northwestern Barents Sea by two sounds (Heleysun-
cycle, high diversity and specific ecological requirements,         det and Freemansundet) through where relatively energetic
they respond quickly to the physicochemical environmen-             tidal exchanges occur (McPhee et al., 2013). To the south,
tal conditions (e.g. organic inputs, oxygenation, pH) by in-        a sill (77◦ N–19◦ E) about 120 m deep separates the inner
creasing their density (e.g. Kitazato et al., 2000), chang-         Storfjorden and the deep basins from the outer Storfjorden
ing the faunal composition or modifying their microhabi-            trough (Storfjordrenna) (Fig. 1a), a 200–300 m deep glacial
tat (Jorissen et al., 1995; Ohga and Kitazato, 1997). There-        paleo-valley that incised the western Barents Sea continental
fore, benthic foraminifera are potentially good proxies for         margin during previous sea level low stands (Pedrosa et al.,
brine waters that bathe the deep-sea Arctic environments            2011).
directly and for sea ice production indirectly. The exist-             The Svalbard archipelago is influenced by two major wa-
ing benthic foraminiferal-based studies in Storfjorden used         ter masses. Along the eastern and southern margin of Sval-
fossil fauna to interpret late Quaternary paleoenvironmen-          bard, cold and relatively low saline Arctic waters flow out
tal changes (Rasmussen and Thomsen, 2009, 2014, 2015).              from the Barents Sea via the East Spitsbergen Current (ESC)
Although highlighting major difficulties in the interpreta-         (Fig. 1a). In the eastern Norwegian and Greenland seas, the
tion of most of these paleo-records without modern proxy            main stream of Atlantic Water, which is the most impor-
calibrations, those studies further suggested the ratio of ag-      tant source of heat and salty water into the Arctic Ocean,
glutinated to calcareous benthic foraminifera as a potential        is carried northwards by the Norwegian Atlantic Current
proxy for brine changes. Living foraminiferal distributions         (NAC) (Fig. 1a). North of Norway, the NAC splits into
have been, however, studied in several Svalbard fjords, in          two branches: (i) the Norwegian Current (NC, or Norwe-
particular in relation to the distance from tidewater glaciers      gian Coastal Current), which enters the Barents Sea east-
and the associated sedimentary supply (Hansen and Knud-             ward around 70◦ N (not shown in Fig. 1a) along the north-

Biogeosciences, 17, 1933–1953, 2020                                                      www.biogeosciences.net/17/1933/2020/
E. Fossile et al.: Benthic foraminifera as tracers of brine production in the Storfjorden “sea ice factory”                       1935

Figure 1. (a) Bathymetric map showing the main current circulations around the Svalbard archipelago (currents from Skogseth et al.,
2005b and Misund et al., 2016) and locations of the sampling stations. The red lines represent the warm North Atlantic waters carried
by the Norwegian Atlantic Current (NAC) and West Spitsbergen Current (WSC). The blue lines represent the cold Arctic waters carried
by the East Spitsbergen Current (ESC). The dotted yellow line represents the polar front (PF). Bathymetry was obtained from EMODnet
(http://portal.emodnet-bathymetry.eu, last access: 24 January 2019), and the map was elaborated with QGIS (made with Natural Earth).
(b) Longitudinal bathymetric profile sketches showing seasonal formation and flow of brine in inner and outer Storfjorden (modified from
Skogseth et al., 2005a and Rasmussen and Thomsen, 2015) and the indicative location of the sampling stations (red dots).

ern coast of Norway, and (ii) the West Spitsbergen Current            ing a cyclonic circulation (Nielsen and Rasmussen, 2018;
(WSC), which flows northwards along the western Svalbard              Piechura and Walczowski, 2009). The cold Arctic waters de-
coast towards the Fram Strait (Schauer, 1995). Recent stud-           rived from the ESC enter Storfjorden from the east through
ies report fluctuations in heat transport to the Arctic Ocean         narrow topographic gateways (Heleysundet and Freeman-
by the WSC in particular that are linked with global climate          sundet sounds) and the topographic depression north of Stor-
change (e.g. Holliday et al., 2008; Piechura and Walczowski           fjordbanken (Fig. 1a). This Arctic water circulates cycloni-
2009; Beszczynska-Moller et al., 2012). This current is play-         cally through the fjord, flowing southwards along the west-
ing a significant role in the process of recent Arctic warm-          ern Storfjorden coast and continuing northwards as a coastal
ing by influencing sea ice distribution and cover in Svalbard         current along the west Spitsbergen coast (Nielsen and Ras-
(Polyakov et al., 2012).                                              mussen, 2018; Rasmussen and Thomsen, 2015). Vertically,
   The water masses in Storfjorden have two main origins:             water masses are usually arranged in three main layers within
warm Atlantic waters and cold Arctic waters. These are                an Arctic fjord with a sill (Farmer and Freeland, 1983): a rel-
mostly separated by the location of the polar front, which            atively fresh surface layer, a deep and saline layer below the
shifts seasonally and therefore influences the northward or           sill depth, and an intermediate layer in between (Fig. 1b).
southward position of these water masses (Loeng, 1991)                Profiles from late summer in Storfjorden show a well-mixed
(Fig. 1a). The warm Atlantic surface waters carried by the            fresh surface layer extending down to 40 m depth separated
NAC enter the Storfjordrenna from the southwest (Wek-                 from the intermediate layer (comprising advected Atlantic
erle et al., 2016) (Fig. 1a). During spring–summer, this lat-         Water) by a steep halocline. The deepest layer, which sits
ter flows into Storfjorden along its eastern margin follow-           below the sill depth, is a cold and saline water mass derived

www.biogeosciences.net/17/1933/2020/                                                          Biogeosciences, 17, 1933–1953, 2020
1936            E. Fossile et al.: Benthic foraminifera as tracers of brine production in the Storfjorden “sea ice factory”

from trapped brine (e.g. Skogseth et al., 2005a; Cottier et al.,      Spitsbergen is characterised by the presence of several
2010; Rasmussen and Thomsen, 2015).                                tidewater glaciers influencing the head of the Storfjorden (see
   The shelf sea in the Storfjorden is characterised by an ex-     Fig. 9 in Lydersen et al., 2014). Ongoing climate warming
tended winter first-year sea ice cover due to the presence of      has been causing the retreat of several glaciers present on
a recurrent winter coastal latent-heat polynya mostly located      Svalbard over the last 100 years, increasing sediment supply
in the northeastern part (Skogseth et al., 2004). Polynyas are     and accumulation (Zaja̧czkowski et al., 2004). In this con-
ice-free areas formed and maintained by advection of ice           text, Winkelmann and Knies (2005) classified the inner Stor-
by offshore winds and tidal and ocean currents. The pres-          fjorden as a low-energy environment characterised by high
ence of northerly winds allows for the development of the          sedimentation rates and organic-rich sediments (total organic
polynya, while southerly winds cause the polynya to shrink,        carbon content (TOC) > 2 %) with a high proportion of ter-
which makes the extension and the position of the polynya          restrial components.
highly variable (Haarpaintner et al., 2001b). The opening of
a latent-heat polynya determines an intensive heat loss to the
atmosphere that can lead to a persistent ice formation (Fer        3     Material and methods
et al., 2004; Skogseth et al., 2005a). Polynya particularly oc-
                                                                   3.1    Interface sediment sampling and CTD profiles
curs when northeasterly winds intensify in winter (Skogseth
et al., 2004). The continuous production of thin, first-year       In July 2016, seven stations were sampled along a north–
sea ice, which generally starts in December (Smedsrud et al.,      south transect in Storfjorden (Fig. 1a, Table 1) during the
2006), leads to a subsequent formation of brine waters in          STeP (Storfjorden Polynya Multidisciplinary Study) cruise
Storfjorden. Brines are cold, dense and well-oxygenated wa-        on board the R/V L’Atalante (IFREMER). Stations MC1 to
ters, enriched in salt and total dissolved inorganic carbon        MC3 are positioned on the continental shelf at the head of
(DIC) (i.e. low pH), that are rejected in undersea ice wa-         the fjord, stations MC4 and MC5 are located in the deep cen-
ters when sea ice is formed (Rysgaard et al., 2011; Ander-         tral basins, station MC6 is located on the sill, and station
son et al., 2004). The shelf convection promotes the mixing        MC7 is located in the Storfjordrenna (Fig. 1a, Table 1). At
of brine with shelf waters, leading to the formation of brine-     each station, 10 to 40 cm long sediment cores were sampled
enriched shelf waters (BSW). In the early winter freezing pe-      using a multi-corer (10 cm inner diameter) in order to get
riod, the extremely dense BSW sink, filling the deeper basins      undisturbed sediment–water interfaces. Three replicate cores
and pushing the less dense waters above the sill level, caus-      were sampled at each station (except for station MC3 where
ing a weak overflow (Skogseth et al., 2005a) (Fig. 1b). Dur-       only two cores were collected): the first core for geochemical
ing winter the low temperature causes a brine volume con-          analysis (oxygen, pH and porosity profiles); the second for
traction and a decrease in the sea ice permeability that pre-      210 Pb dating, grain size, phytopigment, and organic matter
                                                                          xs
vents the air–sea ice gas exchange; brine volume contraction       analyses; and the third for foraminiferal analysis.
causes a further increase in brine salinity and CO2(aq) (Rys-         In order to determine the main environmental character-
gaard et al., 2011). The continuous freezing in spring causes      istics of each site, hydrographic casts were performed with
the accumulation of BSW in the deep basins and a strong            a conductivity–temperature–depth sensor (Seabird 911 plus
steady overflow period over the sill. Although weaker, the         CTD) equipped with a fluorometer. A rosette sampler sup-
overflow continues even in summer after the end of the freez-      plied with 22×12 L Niskin bottles was used for water column
ing period. In the meantime, the fresh melting surface wa-         sampling. Bottles were fired at standard depths to measure
ter is warmed by surface heating (Skogseth et al., 2005a).         oxygen, nutrients and Chlorophyll a.
During spring and summer, the ice melting reduces CO2(aq)
(Rysgaard et al., 2011) and the increase in light availabil-       3.2    Geochemical analyses
ity (Horner and Schrader, 1982) triggers ice algae photosyn-
thetic activity, which further reduces DIC concentrations of       Immediately after the recovery of sediment cores, oxy-
surface waters (Gleitz et al.,1995). In autumn, surface wa-        gen and pH microprofiles were measured at the sediment–
ters lose heat and become colder. At this time, the old BSW        water interface. We used a micromanipulator that can drive
are trapped in the deep basins, but strong wind events cause       O2 and pH microelectrodes (Unisense® ) at the same time
occasional discharges over the sill (Skogseth et al., 2005a)       with a 200 µm vertical resolution. Oxygen profiles were
(Fig. 1b). All Arctic coastal polynyas together produce about      performed using Clark-type microelectrodes with a 100 µm
0.7–1.2 Sv (1 Sv = 106 m3 s−1 ) of BSW (Cavalieri and Mar-         thick tip (Revsbech 1989), while pH profiles were measured
tin, 1994), providing about 10 % of the deep water formed          using a glass microelectrode with a 200 µm thick tip. The O2
in the Arctic Ocean and Barents Sea today (Smethie et al.,         concentration of bottom water was analysed by Winkler titra-
1986; Quadfasel et al., 1988; Rudels and Quadfasel, 1991).         tion (Grasshoff et al., 1983). At each station, triplicate sam-
Storfjorden is a major supplier of BSW, alone producing 5–         ples were analysed with a reproducibility of ±2 µmol L−1 .
10 % of the dense water in the Arctic Ocean (Quadfasel et          The pH microelectrodes were calibrated using National Bu-
al., 1988; Smedsrud et al., 2006).                                 reau of Standards (NBS) buffer solutions (pH 4, 7 and 10).

Biogeosciences, 17, 1933–1953, 2020                                                    www.biogeosciences.net/17/1933/2020/
E. Fossile et al.: Benthic foraminifera as tracers of brine production in the Storfjorden “sea ice factory” 1937
Table 1. Geographic coordinates, depths of the seven studied stations and bottom water parameters (temperature and salinity are measured
in situ by the CTD, O2 (dissolved oxygen) and pHT are measured from Niskin bottles).
Sampling Station Latitude Longitude Depth Temperature Salinity Density pHT O2
date (N) (E) (m) (◦ C) (kg m−3 ) (µmol L−1 )
13 July 2016 MC1 78◦ 15.0 19◦ 30.0 108.0 −1.74 34.89 1028.59 8.00 341
14 July 2016 MC2 77◦ 50.0 18◦ 48.0 117.0 −1.59 34.79 1028.52 7.95 317
14 July 2016 MC3 77◦ 58.6 20◦ 14.6 99.0 1.10 34.74 1028.29 8.12 350
15 July 2016 MC4 77◦ 29.2 19◦ 10.6 191.5 −1.78 34.92 1029.01 7.92 319
17 July 2016 MC5 77◦ 13.2 19◦ 17.9 171.0 −1.78 34.93 1028.91 7.91 317
18 July 2016 MC6 76◦ 53.9 19◦ 30.3 157.0 −1.13 34.80 1028.72 7.97 317
19 July 2016 MC7 76◦ 00.9 17◦ 03.4 321.0 3.53 35.05 1029.33 8.04 305
The pH of bottom water was also determined by spectropho- the total measured 210 Pb activity (supported + excess) at
tometry using m-Cresol Purple as dye (Dickson et al., 2007). 46.54 keV and 214 Pb at 351.93 keV.
All pH measurements were recalculated at in situ tempera-
ture, salinity and depth using CO2SYS (Pierrot et al., 2006) 3.4 Organic matter quantity and biochemical
and were reported on the total proton scale (pHT ). The mea- composition
surements for both O2 and pH profiles, were repeated many
times in order to assess the reproducibility of the measure- To assess the quantity and biochemical composition of the or-
ments and the natural heterogeneity of these parameters in ganic matter, the top 0.5 cm of the sediment cores was sliced
the sediment. on board and immediately stored at −20 ◦ C until analysis. As
the redox fronts and foraminiferal microhabitats in the sed-
iment are strictly driven by the organic matter supply at the
3.3 Grain size analysis and 210 Pb dating
sediment–water interface (e.g. Jorissen et al., 1995), only the
organic matter data for the upper 0.5 cm were used to inter-
At each station (except for the MC3), one core was sliced pret the faunal distribution.
on board, collecting five sediment layers (0–0.5, 0.5–1, 1–2, In the laboratory, chlorophyll a (Chl a), phaeopigment,
2–5 and 5–10 cm), then stored at −20 ◦ C. In the land-based lipid (LIP), carbohydrate (CHO) and protein (PRT) contents
laboratory, an aliquot of sediment was sampled for grain size were determined on three pseudo-replicates (ca. 1 g wet sed-
analyses and the rest was lyophilised for the 210 Pbxs anal- iment). Chlorophyll a and phaeopigment analyses were car-
yses. Grain size analyses were performed using the laser ried out according to Lorenzen and Jeffrey (1980). Briefly,
diffraction particle size analyser Malvern Mastersizer 3000. pigments were extracted with 90 % acetone (12 h in the dark
The particle size distributions were analysed with GRADIS- at 4 ◦ C). After the extraction, the pigments were fluoromet-
TAT 8.0 software program (Blott and Pye, 2001). Replicated rically analysed to estimate the quantity of Chl a and, af-
analyses were run for each sample aliquot and the most repre- ter acidification (20 s) with 0.1 N HCl (Plante-Cuny, 1974),
sentative was selected. For the analysis of fauna in response to estimate the amount of phaeopigments. Chloroplastic pig-
to environmental parameters, the grain size of the superfi- ment equivalents (CPE) were calculated as sum of Chl a and
cial sediment layer (0.0–0.5 cm depth) was considered repre- phaeopigment contents, and carbon associated with CPE (C-
sentative of the sediment–water interface characteristics. An- CPE) was calculated by converting CPE contents into car-
other aliquot of sediment was freeze-dried for gamma spec- bon equivalents using a factor of 30 µg C per µg of phy-
trometry measurements in order to determine the apparent topigment (de Jonge, 1980). Protein, carbohydrate and lipid
sedimentation rate by the 210 Pbxs method (Appleby and Old- sedimentary contents were determined by spectrophotome-
field, 1978). The 210 Pb dating was conducted using a gamma try (Danovaro, 2009) and concentrations reported as bovine
spectrometer Canberrar HPGe GX4520 coaxial photon de- serum albumin, glucose and tripalmitin equivalents (mg per
tector. The homogenised samples were weighed and sealed gram of dry weight sediment), respectively. Protein, carbo-
in a defined geometry for at least 3 weeks to ensure 222 Rn– hydrate and lipid concentrations were converted into car-
226 Ra–214 Pb equilibration. Sedimentation rate was based bon equivalents using the conversion factors 0.49, 0.40 and
on the determination of the excess or unsupported activ- 0.75 g C g−1 , respectively (Fabiano et al., 1995). The sum
ity 210 Pb (210 Pbxs ) and performed through constant flux– of protein, carbohydrate and lipid carbon was referred to as
constant sedimentation (CFCS) model (Sanchez-Cabeza and biopolymeric carbon (BPC; Tselepides et al., 2000) that rep-
Ruiz-Fernández, 2012). The 210 Pbxs , incorporated rapidly resents the semi-labile fraction of the total organic carbon
into the sediment from atmospheric fallout and water col- (Pusceddu et al., 2009; Van Oevelen et al., 2011). The algal
umn scavenging, was calculated as the difference between fraction of biopolymeric C, a proxy for the most labile frac-
www.biogeosciences.net/17/1933/2020/ Biogeosciences, 17, 1933–1953, 20201938 E. Fossile et al.: Benthic foraminifera as tracers of brine production in the Storfjorden “sea ice factory”
tion of sedimentary organic matter (Pusceddu et al., 2003, ent environmental variables and different orders of magni-
2010) was calculated as the percentage ratio of C-CPE in tude were homogenised using the following standardisation:
BPC. (x − mean x)/SD, in which x is the value of the variable at
one station, mean x is the mean of the same variable among
3.5 Living foraminiferal fauna sampling and analyses the stations and SD is the corresponding standard deviation.
Non-metric multidimensional scaling (nMDS) bi-plot and
Immediately after sampling, interface cores were sliced hor- cluster analyses (Bray–Curtis similarity) were used to visu-
izontally every 0.5 cm between 0 and 2 cm, every 1 cm from alise the differences among stations and size fractions. The
2 down to 6 cm, and every 2 cm from 6 to 10 cm depth. Each analyses were conducted on the foraminiferal assemblages
slice was stored in a 500 cm3 plastic bottle filled with 95 % of the topmost centimetre of sediment separately consider-
ethanol containing 2 g L−1 of rose bengal stain (in order to ing the smaller fraction 63–150 µm, the > 150 µm fraction
label living foraminifera) following the FOBIMO directive and the total assemblage (> 63 µm fraction). The densities of
(Schönfeld et al., 2012). In the laboratory, sediment samples the foraminiferal fauna were normalised using the following
were sieved through 63, 125 and 150 µm meshes, and the re- transformation: log10 (x+1), where x is the density expressed
sulting fractions were stored in 95 % ethanol. All living (rose in ind. 50 cm−2 (considering the 0–5 cm sediment interval for
bengal-stained) specimens from the > 150 µm fraction were the CCA and the 0–1 cm interval for the nMDS and cluster
hand-picked in water from the surface layer down to 5 cm analysis). All analyses were performed using the PAST soft-
depth. Additionally, the living foraminifera of the 63–150 µm ware (version 2.17c; Hammer et al., 2001).
fraction were picked only for the first centimetre of sediment,
in order to investigate the potential use of this size fraction 3.7 Visual characterisation of test dissolution
for ecological consideration. We counted only the specimens
with bright rose staining (assessing the colouration intensity Using high-resolution scanning electron microscope (SEM)
of living specimens for every individual species, as recom- images of specimens from the > 150 µm size fraction
mended by Schönfeld et al., 2012) as living foraminifera. (Fig. S2 in the Supplement), we qualitatively distinguish four
Samples of the smallest size fraction, showing very high dissolution stages from weak to severe, following the classi-
benthic foraminiferal abundance, were dried at 50 ◦ C and fication of Gonzales et al. (2017): (I) no sign of dissolution,
split with an Otto Microsplitter. Then foraminifera were transparent tests and smooth surfaces; (II) whitish tests with
hand-sorted from an entire split containing a minimum of visible pores, where frequently the last chamber is lost in ad-
300 individuals and the counts were extrapolated for the dition to the first calcite layers; (III) several chambers are
total sample. Foraminiferal biodiversity was estimated us- dissolved and the remaining ones present opaque wall tests;
ing different diversity indices: species richness measured and (IV) nearly complete dissolution of the tests, and only
as the number of species, species diversity measure using the organic material remains. The percentage of specimens
the Shannon–Wiener Index (H 0 ) and species equitability (J ) belonging to each of the four stages in all samples was not
measured using the “Pielou Index (1975)”. All indices were quantified because of the potential loss of information due to
calculated using the Paleontological Statistics Data Analy- the bad preservation characterising the two most severe dis-
sis (PAST) software (version 2.17c; Hammer et al., 2001). solution stages.
Foraminiferal densities are expressed per 50 cm2 (when con-
sidering total densities) and per 50 cm3 (when considering 4 Results
layers of different thickness). The agglutinated species Spiro-
plectammina earlandi and Spiroplectammina biformis were 4.1 Bottom water properties
not distinguished because these are morphotypes of the same
species according to Korsun and Hald (2000). In July 2016, bottom waters at the inner fjord stations
MC1 and MC2 are cold (below −1.5 ◦ C) and relatively
3.6 Multivariate analyses salty (34.89 and 34.79, respectively), while station MC3
presents a positive bottom water temperature (1.10 ◦ C), the
A canonical correspondence analysis (CCA) was used to in- lowest salinity (34.74), and the highest pHT (8.12) and O2
vestigate the relationships between the environmental param- (350 µmol L−1 ) of the fjord transect (Table 1). The two deep
eters (depth, bottom water temperature, salinity, oxygen pen- basin stations (MC4 and MC5) display the lowest bottom wa-
etration depth or OPD, sediment porewater pH, sediment ter temperature (both −1.78 ◦ C), the lowest pHT (7.92 and
grain size, and organic matter) and the fauna (> 150 µm, 7.91, respectively) and the highest salinity (34.92 and 34.93,
0–5 cm) of all stations considering only the absolute densi- respectively) (Table 1). The sill station MC6 shows the same
ties (ind. 50 cm−2 ) of the species which contribute with > range of salinity than in the inner fjord (34.80) with a slightly
5 % to the assemblage. We used the grain size character- higher temperature (−1.13 ◦ C). The outer fjord station MC7
istics and the organic matter contents and composition of records the highest temperature (3.53 ◦ C) and salinity (35.05)
the uppermost sediment layer (0.0–0.5 cm). Values of differ- of the sampled transect. The shallowest stations (MC1 and
Biogeosciences, 17, 1933–1953, 2020 www.biogeosciences.net/17/1933/2020/E. Fossile et al.: Benthic foraminifera as tracers of brine production in the Storfjorden “sea ice factory” 1939
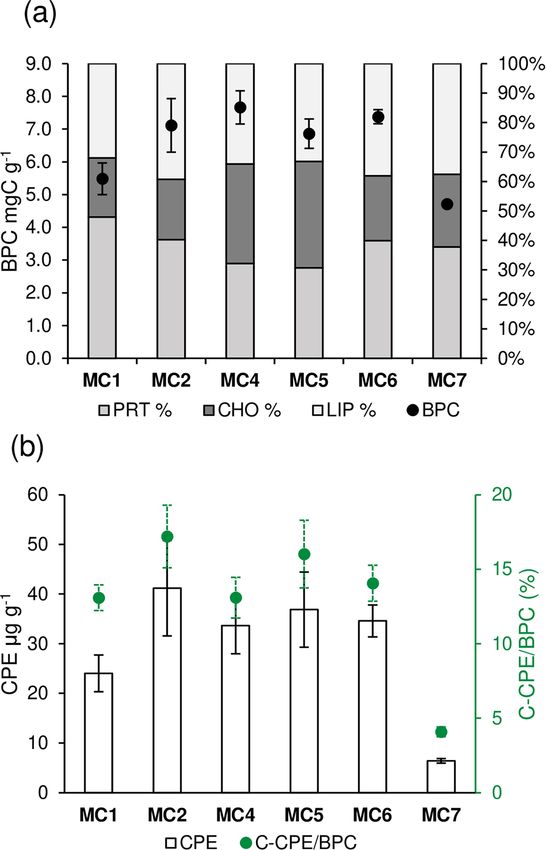
MC3) are well ventilated, with O2 concentrations higher than In the latter, the average BPC varies between 6.86 ± 0.45
340 µmol L−1 . Stations MC2, MC4, MC5 and MC6 show the and 7.38 ± 0.21 mg C g−1 . The PRT contents (%) (Fig. 2a)
same bottom water O2 concentration (318±2 µmol L−1 ). The of the BPC varies significantly among the stations (one-way
deepest station (MC7), located outside Storfjorden, shows ANOVA, F = 6.94, p < 0.01). In particular, the deep basins
a lower O2 concentration (305 µmol L−1 ). present significantly lower percentages of PRT compared to
all the other stations (32.12 ± 4.42 % at MC4 and 30.75 ±
4.2 Grain size analysis and sedimentation rate 4.58 at MC5; Tukey’s HSD p < 0.01). The CHO contents
(%) (Fig. 2a) change significantly among the stations (one-
The 210 Pb age models show a relatively high sedimentation way ANOVA; F = 46.6; p < 0.001), displaying the highest
rate at all stations, with an average of 3.6 ± 0.4 mm yr−1 (see scores in the deep basins (33.79±1.71 % and 36.08±2.52 %
Supplement, Table S1 for more details), except at the outer at MC4 and MC5, respectively). The CPE (Fig. 2b) varies
fjord station MC7 where sedimentation rate is much lower significantly among the stations (one-way ANOVA, F =
(1.3 ± 0.6 mm yr−1 ; Table S1). 52.03, p < 0.001). CPE content is considerably lower in the
Grain size analyses of the topmost 0.5 cm of the sedi- outer fjord station MC7 (6.43 ± 0.45 µg g−1 ) compared to
ment indicate the dominance of silt sediments at all sta- all other stations (p < 0.001). Inside the fjord, station MC1
tions (around 84 % to 89 %, Table S1). Slight differences differs from MC2, with values of 24.04 ± 3.69 and 41.19 ±
are, however, noted in terms of the mode: in the fjord fine 9.62 µg g−1 , respectively (Tukey’s HSD p = 0.02), whereas
silt (∼ 10 µm) is dominant, while in the outer station MC7 all other CPE contents present intermediate values. The C-
the mode corresponds to medium silt (∼ 20 µm). Moreover, CPE / BPC (Fig. 2b) in the uppermost 0.5 cm varies signif-
the percentage of sand increases from approximately 4.0 % icantly among the stations (one-way ANOVA, F = 76.82,
at MC1 to 10.4 % at station MC6 and declines to 6.8 % at p < 0.001). In particular, the algal fraction is significantly
MC7. lower in the outer fjord station MC7 (4.09 ± 0.33 %) com-
pared to all other stations (Tukey’s HSD p < 0.001). On the
4.3 Biogeochemical analyses of the sediment contrary, all the stations inside the fjord do not differ signifi-
cantly and have values between 13 % and 17 %.
The sediment oxygen profiles (Fig. S1a) at the inner fjord sta-
tions (MC1 to MC3) display an average oxygen penetration 4.4 Foraminiferal assemblages of the 0–5 cm sediment
depth (OPD) of 7.7 ± 1.0 mm (n = 3), 4.9 ± 0.4 mm (n = 4) layer (> 150 µm fraction)
and 4.8 ± 1.9 mm (n = 6), respectively. The OPD at the deep
basin stations (MC4 and MC5) and at the sill station (MC6), 4.4.1 Abundances and diversity
are 5.7 ± 1.1 mm (n = 3), 6.2 ± 0.9 (n = 10) and 8.6 ± 3.8
Considering the total foraminiferal fauna in the 0–5 cm sed-
(n = 6), respectively. The outer fjord station (MC7) shows
iment interval (Table 2), the highest absolute abundance is
the highest OPD of the sampled transect (15.6 ± 1.0 mm,
displayed at the inner fjord station MC2 (2249 ind. 50 cm−2 ),
n = 6).
whereas it is reduced by about half at the other two inner
The porewater pHT at the sediment–water interface (pH
fjord stations (1104 and 1353 ind. 50 cm−2 at MC1 and MC3,
profiles in Fig. S1b) is significantly different among the sta-
respectively). The absolute abundance increases at the deep
tions (one-way ANOVA, F = 128.8, p < 0.001). The inner
basin stations (1861 and 1439 ind. 50 cm−2 at MC4 and
fjord stations (MC1 to MC3), the sill (MC6) and outer fjord
MC5, respectively) and drastically declines at the sill station
(MC7) have pHT values generally above 7.95, significantly
MC6, reaching the lowest abundance detected in the transect
different (Tukey’s HSD post hoc test, p < 0.001) from the
(940 ind. 50 cm−2 ). At the outer fjord station MC7, the total
deep basin stations which have pHT values less than or equal
absolute abundance is 1238 ind. 50 cm−2 .
to 7.90. When considering the entirety of the profiles, pH
The inner fjord stations MC1 and MC2 present the same
strongly decreases in the topmost part of the sediment (0–
number of species (27) (Table 2) and similar Shannon–
5 mm) at all stations but with different slopes. The gradients
Wiener index (H 0 = 1.61 and 1.48) and equitability (J =
of the two extremes are −0.2 pH unit per millimetre at station
0.49 and 0.45). The third inner fjord station MC3 is char-
MC3 and −0.1 pH unit mm−1 at MC7 (see Fig. S1b).
acterised by the lowest diversity (19 species and H 0 = 0.92)
Concerning the organic matter, the results for BPC, PRT,
and the lowest equitability (J = 0.31), whereas the deep
CHO, LIP, and CPE content and algal fraction of BPC (C-
basin stations MC4 and MC5 show relative high H 0 (2.25
CPE / BPC are presented in Fig. 2. The complete dataset
and 2.35, respectively) and J values (0.62 and 0.70, respec-
is reported as average ± standard deviation (n = 3) in Ta-
tively). The sill station MC6 shows similar H 0 and J values
ble S2 of the Supplement. The BPC (Fig. 2a) varies sig-
compared to the deep basin stations (2.18 and 0.65, respec-
nificantly among the stations (one-way ANOVA, F = 21.72,
tively). The outer fjord station MC7 shows the highest num-
p < 0.001). Stations MC1 and MC7 have values of BPC sig-
ber of species (44) and H 0 index (2.40).
nificantly lower (5.49 ± 0.49 and 4.71 ± 0.07 mg C g−1 , re-
spectively, Tukey’s HSD p < 0.05) than at all other stations.
www.biogeosciences.net/17/1933/2020/ Biogeosciences, 17, 1933–1953, 20201940 E. Fossile et al.: Benthic foraminifera as tracers of brine production in the Storfjorden “sea ice factory”
tively. Cassidulina reniforme is a secondary species at sta-
tion MC1 (10 %), and Elphidium bartletti is a secondary
species at station MC2 (8 %). The deep basin stations (MC4
and MC5) are dominated by various agglutinated species
that contribute differently to the total assemblages. The most
abundant are Recurvoides turbinatus (12 % and 18 %, re-
spectively, at MC4 and MC5), Reophax fusiformis (13 % and
10 %) and Reophax scorpiurus (27 % and 17 %). Ammotium
cassis and Labrospira crassimargo are less abundant at MC4
compared to MC5 (2 % and 11 % for A. cassis and 6 % and
11 % for L. crassimargo, respectively). Additionally, the cal-
careous N. labradorica is still quite abundant (20 % at MC4
and 8 % at MC5). The sill station MC6 shows similarity with
the deep basin stations because of the presence of the ag-
glutinated R. turbinatus (10 %) and R. fusiformis (24 %) but
it differs by the presence of the agglutinated Adercotryma
glomeratum (29 %). The outer fjord station (MC7) can be
distinguished from all other stations by the exclusive pres-
ence of the two calcareous species Globobulimina auriculata
and Melonis barleeanus (9 % and 12 %, respectively) and by
the major contribution of the agglutinated species Lagenam-
mina difflugiformis (14 %). Nevertheless, some species that
are abundant inside the fjord are also present at station MC7
(e.g. N. labradorica 25 %, R. fusiformis 6 % and R. scorpiu-
rus 15 %).
4.4.2 Agglutinated vs. calcareous foraminifera
(0–5 cm, > 150 µm)
Figure 2. For each sampling station the following information The comparison between the relative abundances of calcare-
is shown (data are not available at station MC3): (a) content
ous and agglutinated species, considering the total living
of biopolymeric carbon (BPC, black dots) and percentage of pro-
tein, carbohydrate, and lipid content (cumulative bars) and (b) the
fauna in the 0–5 cm sediment interval (Fig. 3b) shows the
content of chloroplastic pigment equivalents (CPE, white bars) and strong dominance of calcareous species (between 91 and
algal fraction of BPC (C-CPE / BPC, green dots). 94 %) at the inner fjord stations (MC1, MC2 and MC3). The
opposite is observed at the two deep basin stations (MC4 and
MC5) and at the sill station (MC6), where the relative abun-
Table 2. Foraminiferal total abundances (in number of individuals dances of agglutinated foraminifera vary from 65 % to 77 %.
per 50 cm2 ) and diversity indexes, considering the total living fauna At the outer fjord station, MC7, calcareous species have
(> 150 µm size fraction) in the 0 to 5 cm core top sediment.
higher proportions (60 %), although they are not as dominant
as at the inner fjord stations.
Stations MC1 MC2 MC3 MC4 MC5 MC6 MC7
Abundance 1104 2249 1353 1861 1439 940 1238
(ind. 50 cm−2 )
4.4.3 Vertical distribution
Species 27 27 19 37 29 29 44
richness
The foraminiferal absolute density displays an overall de-
creasing trend from the surface sediment down to 5 cm
Shannon–Wiener 1.61 1.48 0.92 2.25 2.35 2.18 2.40
(H 0 )
depth at all stations (Fig. 4). The superficial layers (0–
1 cm) of the inner fjord stations (MC1, MC2, MC3; Fig. 4a)
Equitability (J ) 0.49 0.45 0.31 0.62 0.70 0.65 0.64
are mostly represented by Elphidium clavatum, Cassidulina
reniforme (especially at MC1), Nonionellina labradorica and
other accessory species (e.g. Triloculina oblonga, Elphid-
In terms of species composition (Fig. 3a), the inner fjord ium bartletti, Ammotium cassis). The deeper layers (down
stations are mainly dominated by two calcareous species: to 5 cm) show much lower abundances and are increasingly
Elphidium clavatum, contributing 22 %, 47 %, and 75 % of occupied by Nonionellina labradorica.
the total fauna, and Nonionellina labradorica, contributing In the two deep basins (MC4 and MC5; Fig. 4b), four ag-
51 %, 31 %, and 13 % at MC1, MC2, and MC3, respec- glutinated species are dominant in the first centimetre of sedi-
Biogeosciences, 17, 1933–1953, 2020 www.biogeosciences.net/17/1933/2020/E. Fossile et al.: Benthic foraminifera as tracers of brine production in the Storfjorden “sea ice factory” 1941
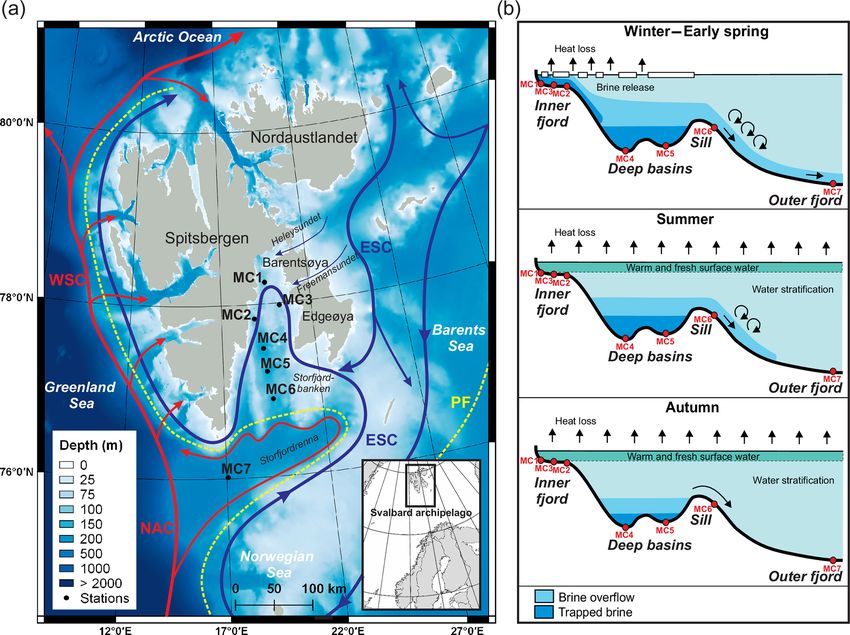
Figure 3. (a) Species relative abundances of the total living fauna (> 150 µm fraction) in the 0 to 5 cm core top sediment at each station and
(b) the agglutinated species (in red) vs. calcareous species (in grey) ratio.
ment: Reophax scorpiurus, Reophax fusiformis, Recurvoides divides the other six stations into two groups: the inner fjord
turbinatus and Labrospira crassimargo. At both stations, the group (composed of stations MC1, MC2 and MC3) and the
infaunal species N. labradorica is present in high relative deep basins and sill group (stations MC4 and MC5 and sta-
abundance in the 1–3 cm sediment intervals, together with tion MC6). This separation is mainly based on the organic
Nonionella digitata. In the deepest sediment layers (3–5 cm), matter composition of the sediment. The inner fjord group of
L. crassimargo, R. scorpiurus and R. turbinatus are domi- stations is positively correlated with the percentage of pro-
nant. At the sill station MC6, the dominant species present teins, whereas the deep basins and sill group is mainly corre-
in the uppermost centimetre are R. fusiformis, R. turbinatus lated with the percentage of carbohydrates and the biopoly-
and Adercotryma glomeratum (Fig. 4b). These species are meric carbon content. This group of stations MC4 to MC6
also present with important abundances in the deeper lay- is also positively correlated with the CPE content and the al-
ers where they are accompanied by N. labradorica at the gal fraction of BPC. These three groups are characterised by
1–3 cm depth intervals. At the outer fjord station MC7, the different foraminiferal assemblages. The calcareous species
0–1 cm sediment intervals show a dominance of R. scorpiu- Cassidulina reniforme, Elphidium clavatum, Nonionellina
rus, R. fusiformis and L. difflugiformis (Fig. 4c). In the deeper labradorica, and Elphidium bartletti characterise the inner
layers, these species are accompanied and gradually replaced fjord, whereas three agglutinated species, Labrospira crassi-
by significant abundances of the calcareous species Melonis margo, Adercotryma glomeratum, and Recurvoides turbina-
barleeanus and Globobulimina auriculata. tus, and one calcareous species, Nonionella digitata, define
the deep basins and sill group. Finally, the exclusive presence
4.4.4 Multivariate analysis of the two species, Melonis barleeanus and Globobulimina
auriculata, characterise the outer fjord station MC7.
The CCA analysis based on the foraminiferal data (0– 4.5 Comparison between the 63–150 and > 150 µm size
5 cm, > 150 µm, total absolute densities of 15 species, with fractions (0–1 cm)
a relative abundance > 5 %) and 15 measured environmental
variables is presented in Fig. 5. Axes 1 and 2 explain nearly 4.5.1 Abundances and diversity
90 % of the total variance. This multivariate analysis clearly
divides the stations into three groups based on the differences Foraminiferal abundances considering the entire > 63 µm
determined by the foraminiferal assemblages and the envi- fraction (63–150 + > 150 µm fractions) in the topmost cen-
ronmental variables. Axis 1 strongly separates station MC7 timetre of the sediment are maximal at MC2 and MC4 (4610
from the rest of the stations. This difference is mainly deter- and 3936 ind. 50 cm−2 , respectively), while all other sta-
mined by bottom water parameters (T, S, pH), OPD, percent- tions present lower values (< 3000 ind. 50 cm−2 ) (Fig. 6a).
age of silt and water depth. The negative correlation between When considering only the largest fraction (> 150 µm) at the
the outer fjord station MC7 and the CPE content and algal first centimetre, MC2 (1467 ind. 50 cm−2 ) and MC4 (1132
fraction distinguishes it from all other stations. Axis 2 clearly ind. 50 cm−2 ) still shows the highest abundances followed
www.biogeosciences.net/17/1933/2020/ Biogeosciences, 17, 1933–1953, 20201942 E. Fossile et al.: Benthic foraminifera as tracers of brine production in the Storfjorden “sea ice factory” Figure 4. Foraminiferal vertical distribution from 0 to 5 cm sediment depth (> 150 µm fraction) for (a) the inner fjord (stations MC1 to MC3) (b) deep basins (stations MC4 and MC5) and sill (station MC6), and (c) outer fjord (station MC7). Calcareous species are shown using different grey textures, whereas agglutinated species are shown using different red textures. The dashed black line represents the average oxygen penetration depth (OPD) at each station. by MC3 and MC5 (1050 and 889 ind. 50 cm−2 ). For the rest, In terms of species composition (Fig. 7), the higher diver- values are lower than 600 ind. 50 cm−2 . The small fraction sity of the 63–150 µm fraction at stations MC2 and MC3 is (63–150 µm) is dominant at all stations, contributing with due to the additional presence of Stainforthia feylingi, Spiro- values between 59 % (at MC2) and 83 % (at MC6) to the plectammina biformis and Textularia torquata. However, at total abundances. this size fraction, as in the > 150 µm fraction, the fauna at the Regarding diversity values, at MC1 and MC7 no signifi- three inner fjord stations (MC1, MC2, MC3) is also largely cant differences in the H 0 and J indices are found between represented by Elphidium clavatum (juveniles) (16 %, 30 % the two size fractions (Fig. 6b, c). At stations MC2, MC3 and and 66 %, respectively). Similarly, juveniles of Cassidulina MC6, H 0 and J values are lower for the > 150 µm fraction, reniforme are observed in the small fraction at station MC1 whereas the opposite is observed for stations MC4 and MC5, (38 %). At stations MC4 and MC5, the lower diversity of where small size fractions show lower diversity. the 63–150 µm fraction is due to the strong dominance of Biogeosciences, 17, 1933–1953, 2020 www.biogeosciences.net/17/1933/2020/
E. Fossile et al.: Benthic foraminifera as tracers of brine production in the Storfjorden “sea ice factory”                    1943

Figure 5. Canonical correspondence analysis based on real abundances (ind. 50 cm−2 ) of the living fauna in the 0–5 cm sediment layer
(> 150 µm size fraction) considering the major species (> 5 %) vs. environmental variables described in Tables 1, S1 and S2.

                                                                     S. biformis (75 % and 65 %, respectively), which is nearly
                                                                     absent in the large size fraction. At station MC7, the small
                                                                     size fraction is characterised by the presence of juveniles
                                                                     of Cassidulina teretis (11 %) and Melonis barleeanus (8 %),
                                                                     species that are also present in the > 150 µm fraction (5 %
                                                                     and 8 %, respectively). These species are accompanied by C.
                                                                     reniforme (21 %) and Alabaminella weddellensis (27 %) that
                                                                     are only present in the small size fraction at this site.

                                                                     4.5.2   Agglutinated vs. calcareous foraminifera

                                                                     The percentage of agglutinated forms is systematically
                                                                     higher in the entire fraction > 63 µm compared to the >
                                                                     150 µm at stations MC1 to MC6 (Fig. 8). This is explained by
                                                                     the presence of the small-sized agglutinated species Spiro-
                                                                     plectammina biformis and other minor agglutinated species
                                                                     (Cuneata arctica, Textularia torquata, Cribrostomoides sp.).
                                                                     Conversely, the outer fjord station MC7 shows the opposite
                                                                     pattern, mainly because of the presence in the small fraction
                                                                     of calcareous species that are absent in the > 150 µm size
                                                                     fraction (i.e. Cassidulina teretis, Cassidulina reniforme, Al-
                                                                     abaminella weddellensis).

                                                                     4.5.3   Multivariate analyses

                                                                     Coordinate 2 of the nMDS analysis separates the > 150 µm
Figure 6. (a) Foraminiferal cumulative abundances (ind. 50 cm−2 )
                                                                     fraction from the 63 to 150 and > 63 µm fractions (Fig. 9a),
for two size fractions (63–150 µm, grey, and > 150 µm, white) of     and the cluster (Bray–Curtis similarity) analysis shows less
the 0–1 cm sediment layer. (b) Shannon–Wiener (H 0 ) and (c) equi-   than 50 % similarity between the two groups (Fig. 9b). How-
tability (J ) indexes comparison among the 63–150 µm, > 150 µm       ever, nMDS coordinate 1 groups all fractions into the same
and > 63 µm (black) fractions.                                       three stations’ groups (Fig. 9a) as those previously deter-
                                                                     mined by the CCA analysis based on the > 150 µm fraction
                                                                     (Fig. 5).

www.biogeosciences.net/17/1933/2020/                                                        Biogeosciences, 17, 1933–1953, 2020
1944 E. Fossile et al.: Benthic foraminifera as tracers of brine production in the Storfjorden “sea ice factory”
Figure 7. Total abundances (ind. 50 cm−2 ) and correspondent relative abundances (%) of the dominant species (> 5 % for at least one station)
of the 0–1 cm sediment layer for the 63–150 µm fraction (a, c) and the > 150 µm fraction (b, d). The calcareous species are shown using
different grey textures, whereas agglutinated species are shown using different red textures.
4.6 Visual characterisation of test dissolution
At all stations inside the fjord (from MC1 to MC6) most of
the calcareous species display different degrees of dissolu-
tion, including for small sized specimens. As visualised in
Fig. S2 of the Supplement, the species Elphidium clavatum,
Elphidium bartletti, Triloculina oblonga and Robertinoides
sp. show the most severe degree of dissolution, whereas Non-
ionellina labradorica seems to be less sensitive to dissolution
(individuals classified at stage I or II of dissolution). Interest-
ingly, the highest degree of dissolution (stage IV) is exclu-
Figure 8. Relative abundances of calcareous foraminifera (in grey) sively observed in the deep basin and the sill stations.
and agglutinated foraminifera (in red) considering the > 150 µm
size fraction (a) and the > 63 µm size fraction (b).
Biogeosciences, 17, 1933–1953, 2020 www.biogeosciences.net/17/1933/2020/E. Fossile et al.: Benthic foraminifera as tracers of brine production in the Storfjorden “sea ice factory” 1945
sill (i.e. station MC6) and the outer fjord Storfjordrenna (i.e.
station MC7) (Fig. 1b).
In July 2016, the inner fjord sea surface water tempera-
tures and salinities (Fig. S3 of the Supplement) are indica-
tive of a mixture between meltwaters and Storfjorden surface
water, as previously indicated by Skogseth et al. (2005b).
On the contrary, the recorded inner fjord bottom water pa-
rameters are not homogeneous (Table 1). In fact, stations
MC1 and MC2, on the western side of the fjord, are charac-
terised by salinity and temperature within the range of BSW
(Skogseth et al., 2005b). The location of these stations in
small topographic depressions on the shelf may explain the
presence of these cold and salty waters. The shallowest sta-
tion MC3 (99 m depth), located on the eastern side of the
inner fjord, seems influenced by modified Atlantic water (as
defined Skogseth et al., 2005b).
The bottom water values of salinity and temperature mea-
sured in July 2016 in the deep basins, still allow us to iden-
tify the presence of trapped residual BSW a long time after
the season of sea ice formation, as previously hypothesised
by Skogseth et al. (2005b). The bottom water properties at
the sill fall into the range of Arctic water (Skogseth et al.,
2005b). In contrast to the inner fjord and the deep basins, the
outer fjord water column displays typical values of North At-
lantic Water (NAW) from the surface to the bottom (Skogseth
et al., 2005b).
The summer melting of tidewater glaciers flowing in Stor-
fjorden produces an important supply of terrigenous materi-
als to the head of the fjord (Winkelmann and Knies, 2005).
This sedimentary dynamic results in relatively high sedi-
mentation rates of about 3.6 ± 0.4 mm yr−1 recorded in the
fjord (stations MC1 to MC6, Table S1), which is lower than
in other Svalbard fjords (e.g. Kongsfjorden 5–10 mm yr−1 ;
Zaborska et al., 2006). Associated with this terrigenous flux,
organic matter supply is high in the internal fjord. In con-
trast, low sedimentation rate (1.3 ± 0.6 mm yr−1 , Table S1)
and low organic matter supply are recorded in the outer fjord.
Figure 9. (a) Non-metric multidimensional scaling analysis and (b) This clearly indicates a lower influence of tidewater glacier
cluster analysis (Bray–Curtis similarity measure) considering the inputs in Storfjordrenna (station MC7) compared to the in-
densities (ind. 50 cm−2 ) of the major foraminiferal species (relative ternal fjord (stations MC1 to MC6).
abundance > 5 % in at least one station in one size fraction) for the Regarding the organic supply, the high concentrations of
63–150 µm fraction, the > 150 µm fraction and the > 63 µm total organic matter at all our stations, and particularly in the deep
fraction. basins, confirm the sedimentary organic-rich character of
Storfjorden, as previously reported in the literature (Winkel-
mann and Knies, 2005; Mackensen et al., 2017). The higher
CHO (%) associated with lower PRT (%) in the deep basins
5 Discussion
(station MC4 and MC5) compared to the other stations is in-
dicative of the presence of older and more refractory organic
5.1 Environmental characteristics of the study area matter (Pusceddu et al., 2000). This could either be related to
higher continental supplies of more refractory organic matter,
According to the topography of the fjord, distribution of the higher heterotrophic consumption, or the presence of long-
main water masses and physicochemical characteristics of residence water masses, influenced by BSW and isolated by
the sediments, we can separate the fjord into three main ar- a strong chemocline during periods of sea ice melting (Rys-
eas: the inner fjord (i.e. stations MC1 to MC3), the central gaard et al., 2011). In contrast, the higher contents of PRT
deep basins (i.e. stations MC4 and MC5) constrained by the (%) and CPE in the inner fjord (stations MC1 to MC3) and
www.biogeosciences.net/17/1933/2020/ Biogeosciences, 17, 1933–1953, 20201946 E. Fossile et al.: Benthic foraminifera as tracers of brine production in the Storfjorden “sea ice factory”
at the sill (MC6) could be the result of a recent (summer) tion, suggesting recent reproductive events, probably in re-
phytoplankton bloom. Compared to the inner fjord, the CPE sponse to fresh organic matter inputs to the seafloor. This
contents in the Storfjordrenna are much lower (Fig. 2b), in- hypothesis also matches with the dominance of Nonionellina
dicating a less fresh algal input to the bottom, which is con- labradorica in the intermediate microhabitats. In fact, this
sistent with the greater water depth (> 300 m) at this outer species is often reported in highly productive areas (Lloyd,
fjord site. 2006) because of its preference for feeding on fresh phytode-
The oxygen profiles and the OPD in particular (Fig. S1a) tritus and on diatoms in particular (Cedhagen, 1991). Korsun
reflect the quantity of organic matter supplies. Indeed, the and Hald (2000) suggest that this species may start repro-
organic carbon accumulation depends on its reactivity with ducing during spring in glaciomarine environments, possi-
available oxygen (Dauwe et al., 2001) and vice versa, the bly following the diatom bloom starting in March under the
oxygen consumption is proportional to the organic matter sea ice (Rysgaard et al., 2011). Therefore, we instead inter-
mineralisation rate. Except for the outer fjord, all stations pret its presence as a response to meltwater discharge and
(MC1 to MC6) present shallow OPD values (< 10 mm) con- consequent phytoplanktonic bloom. Additionally, Elphidium
sistent with the high contents of available organic matter (i.e. bartletti that occurs as an accessory species (especially at sta-
BPC) (Fig. 2). Organic matter aerobic respiration is also the tion MC2) was previously reported in river-affected habitats
reason for the rapid pH decrease in the first millimetre of the of the southern Kara Sea, characterised by highly variable
sediment column at these stations (Fig. S1b). At the outer environmental conditions (Polyak et al., 2002), further sup-
fjord, the slower pH decrease and the higher OPD (> 15 mm) porting our interpretations.
would therefore be attributed to lower BCP content at this The CCA analysis (Fig. 6) shows a negative correlation
station. of the deep basins and sill fauna with proteins and a posi-
tive correlation with carbohydrates, highlighting a response
5.2 Distribution of foraminiferal species in response to of the fauna to old (refractory) organic matter. The assem-
environmental conditions blages in the two deep basin stations (MC4 and MC5) dis-
play similar diversities, which are in both cases higher than
According to the topography and physical characteristics of in the inner fjord. Agglutinated species dominate the topmost
the fjord, the foraminiferal distribution and the measured en- centimetre of the sediment, in particular Reophax scorpiurus,
vironmental parameters also define three biozones: (i) the in- Reophax fusiformis, and Recurvoides turbinatus, occasion-
ner fjord, (ii) the deep basins and sill, and (iii) the outer fjord. ally accompanied by Labrospira crassimargo and Ammotium
The CCA analysis (Fig. 5) shows that the inner fjord fauna cassis. These species are often found in the distal part of
are positively correlated to PRT (%) and negatively corre- other Svalbard fjords (e.g. Hald and Korsun, 1997; Murray
lated to CHO (%), meaning that they favourably respond to and Alve, 2011; Jernas et al., 2018) and widely distributed in
the availability of fresh and labile organic matter. areas covered with seasonal sea ice in the Arctic Ocean (e.g.
Elphidium clavatum dominates the innermost fjord sta- Wollenburg and Kuhnt, 2000; Wollenburg and Mackensen,
tions, where it preferentially occupies the superficial micro- 1998). They are considered as tolerating low food quality;
habitats. The high dominance of this species in the inner high sedimentation rates; and a wide range of salinities, tem-
fjord is consistent with previous findings from other glacier- peratures, and organic matter fluxes (Hald and Korsun, 1997;
proximal inner Svalbard fjords (Hald and Korsun, 1997; Ko- Murray, 2006; Jernas et al., 2018). This capacity for adap-
rsun and Hald, 2000) and Arctic domains (e.g. Iceland; Jen- tation may explain the abundance of all these agglutinated
nings et al., 2004). Elphidium clavatum is also often de- species in the deep basins where residual BSW (with high S,
scribed as being able to adapt to harsh environments, such as low T and pH) and high concentrations of refractory carbo-
near tidewater–glacier fronts and riverine estuaries (e.g. Hald hydrates are recorded in the top sediment. At station MC4,
and Korsun 1997; Korsun and Hald, 1998; Forwick et al., N. labradorica also lives in a subsurface microhabitat (from
2010). The presence of this species therefore suggests quite 1 down to 3 cm depth), probably profiting from the phytode-
stressful conditions. tritus supply, as testified by the high CPE contents.
The station MC1, at the fjord head, is additionally char- The assemblage composition at the sill (station MC6) is
acterised by the presence of Cassidulina reniforme. This close to those found in the deep basins, except for the dom-
species tolerates high concentrations of suspended partic- inant presence of Adercotryma glomeratum. The similarities
ulate organic matter (Schäfer and Cole, 1986) and prefers with the deep basin’s assemblages are interpreted as the re-
cold water environments (Jernas et al., 2018). Korsun and sult of intermittent pulses of BSW outflowing the fjord and
Hald (1998) hypothesised that C. reniforme becomes domi- bypassing the sill during some periods of the year and there-
nant when glacier-driven turbidity is lower and phytoplank- fore influencing this station. The opportunist A. glomeratum
ton production is higher. According to our findings, fauna (e.g. Gooday and Rathburn, 1999; Heinz et al., 2002) has
at stations MC2 and MC3 potentially reflect a more stress- been reported as being positively related to increasing dis-
ful environment than station MC1. The strong dominance tance from glaciers and from the fjord head (Hald and Kor-
of these two species is also visible in the small size frac- sun, 1997). Its dominance at this station suggests a positive
Biogeosciences, 17, 1933–1953, 2020 www.biogeosciences.net/17/1933/2020/You can also read