Characterizing the Invasive Tumor Front of Aggressive Uterine Adenocarcinoma and Leiomyosarcoma
←
→
Page content transcription
If your browser does not render page correctly, please read the page content below
ORIGINAL RESEARCH
                                                                                                                                                  published: 03 June 2021
                                                                                                                                           doi: 10.3389/fcell.2021.670185

                                            Characterizing the Invasive Tumor
                                            Front of Aggressive Uterine
                                            Adenocarcinoma and
                                            Leiomyosarcoma
                                            Sabina Sanegre 1,2 , Núria Eritja 1,3 , Carlos de Andrea 1,4 , Juan Diaz-Martin 1,5 ,
                                            Ángel Diaz-Lagares 1,6 , María Amalia Jácome 7 , Carmen Salguero-Aranda 1,5 ,
                                            David García Ros 4 , Ben Davidson 8,9 , Rafel Lopez 1,10,11 , Ignacio Melero 1,4 ,
                                            Samuel Navarro 1,2 , Santiago Ramon y Cajal 1,12 , Enrique de Alava 1,5 ,
                                            Xavier Matias-Guiu 1,3* † and Rosa Noguera 1,2* †
                                            1
                                              Cancer CIBER (CIBERONC), Madrid, Spain, 2 Department of Pathology, School of Medical, University of Valencia-INCLIVA,
                          Edited by:        Valencia, Spain, 3 Institut de Recerca Biomèdica de LLeida (IRBLLEIDA), Institut d’Investigació Biomèdica de Bellvitge
                          Dong Han,         (IDIBELL), Department of Pathology, Hospital U Arnau de Vilanova and Hospital U de Bellvitge, University of Lleida -
     National Center for Nanoscience        University of Barcelona, Barcelona, Spain, 4 Clínica Universidad de Navarra, University of Navarra, Pamplona, Spain,
       and Technology (CAS), China          5
                                              Institute of Biomedicine of Sevilla, Virgen del Rocio University Hospital/CSIC/University of Sevilla/CIBERONC, Seville, Spain,
                                            6
                      Reviewed by:            Cancer Epigenomics, Translational Medical Oncology Group (Oncomet), Health Research Institute of Santiago (IDIS),
                 Hisham F. Bahmad,          University Clinical Hospital of Santiago (CHUS/SERGAS), Santiago de Compostela, Spain, 7 Department of Mathematics,
          Mount Sinai Medical Center,       MODES Group, CITIC, Faculty of Science, Universidade da Coruña, A Coruña, Spain, 8 Institute of Clinical Medicine, Faculty
                        United States       of Medicine, University of Oslo, Oslo, Norway, 9 Department of Pathology, Norwegian Radium Hospital, Oslo University
             Orest William Blaschuk,        Hospital, Oslo, Norway, 10 Translational Medical Oncology Group (Oncomet), Health Research Institute of Santiago (IDIS),
            McGill University, Canada       University Clinical Hospital of Santiago (CHUS/SERGAS), Santiago de Compostela, Spain, 11 Roche-Chus Joint Unit,
                                            Translational Medical Oncology Group (Oncomet), Health Research Institute of Santiago (IDIS), Santiago de Compostela,
                   *Correspondence:
                                            Spain, 12 Department of Pathology, Vall d’Hebron University Hospital, Autonomous University of Barcelona, Barcelona, Spain
                     Xavier Matias-Guiu
     jmatiasguiu.lleida.ics@gencat.cat
                         Rosa Noguera       The invasive tumor front (the tumor–host interface) is vitally important in malignant
                   rosa.noguera@uv.es
     † These
                                            cell progression and metastasis. Tumor cell interactions with resident and infiltrating
               authors have contributed
                    equally to this work    host cells and with the surrounding extracellular matrix and secreted factors ultimately
                                            determine the fate of the tumor. Herein we focus on the invasive tumor front,
                    Specialty section:
                                            making an in-depth characterization of reticular fiber scaffolding, infiltrating immune
         This article was submitted to
         Cell Adhesion and Migration,       cells, gene expression, and epigenetic profiles of classified aggressive primary uterine
                a section of the journal    adenocarcinomas (24 patients) and leiomyosarcomas (11 patients). Sections of formalin-
  Frontiers in Cell and Developmental
                                Biology
                                            fixed samples before and after microdissection were scanned and studied. Reticular
        Received: 20 February 2021
                                            fiber architecture and immune cell infiltration were analyzed by automatized algorithms
           Accepted: 12 April 2021          in colocalized regions of interest. Despite morphometric resemblance between reticular
          Published: 03 June 2021
                                            fibers and high presence of macrophages, we found some variance in other immune
                              Citation:
                                            cell populations and distinctive gene expression and cell adhesion-related methylation
    Sanegre S, Eritja N, de Andrea C,
       Diaz-Martin J, Diaz-Lagares Á,       signatures. Although no evident overall differences in immune response were detected
    Jácome MA, Salguero-Aranda C,           at the gene expression and methylation level, impaired antimicrobial humoral response
 García Ros D, Davidson B, Lopez R,
Melero I, Navarro S, Ramon y Cajal S,
                                            might be involved in uterine leiomyosarcoma spread. Similarities found at the invasive
       de Alava E, Matias-Guiu X and        tumor front of uterine adenocarcinomas and leiomyosarcomas could facilitate the
     Noguera R (2021) Characterizing
                                            use of common biomarkers and therapies. Furthermore, molecular and architectural
             the Invasive Tumor Front
                 of Aggressive Uterine      characterization of the invasive front of uterine malignancies may provide additional
                     Adenocarcinoma         prognostic information beyond established prognostic factors.
                and Leiomyosarcoma.
      Front. Cell Dev. Biol. 9:670185.      Keywords: tumor-host interface, tumor microenvironment, extracellular matrix, reticular fibers, immune cells,
      doi: 10.3389/fcell.2021.670185        gene expression, epigenetic profiles

Frontiers in Cell and Developmental Biology | www.frontiersin.org                   1                                               June 2021 | Volume 9 | Article 670185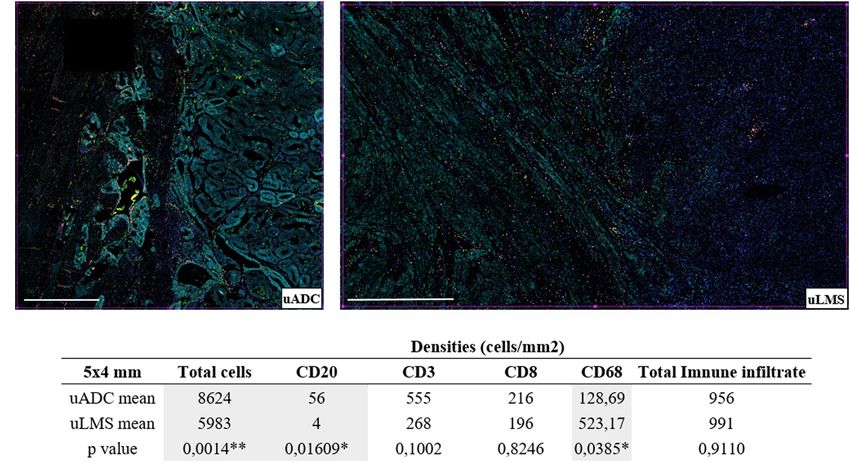
Sanegre et al.                                                                                                   Uterine-Myometrial Tumor Interface

INTRODUCTION                                                              (Horrée et al., 2007). Structures surrounding tumors such as
                                                                          mature collagen and smooth or striated muscle can act as a
Uterine endometrial adenocarcinoma (uADC) is the fourth most              barrier to tumor invasion, as shown by collagen organization
common cancer among women in the Western world, with an                   at the ITF of oral squamous cell carcinomas (Devendra et al.,
estimated incidence of 10–20 per 100,000 women. Although                  2018). However, tumor cells can disrupt the continuity of such
prognosis is favorable for patients identified with low-grade             structures by remodeling the immediate stroma of the tumor
tumors and early-stage disease, outcomes for patients with high-          to carve out paths for invasion. Indeed, invasive tumor growth
grade and metastatic/recurrent tumors remain poor (Ferlay                 in pancreatic ductal adenocarcinoma is mediated via matrix
et al., 2010) and represent a therapeutic challenge. The World            remodeling metalloproteinases (Croft et al., 2004; Rath et al.,
Health Organization (WHO) tumor classification distinguishes              2017). Changes in the fibrillar pattern of adjacent stroma of
several histopathological types of uADC, particularly based on            tumor tissues have been also observed in skin tumor (Stenbäck
microscopic appearance (Cree et al., 2020): (1) endometrioid              et al., 1999), oral squamous cell carcinoma, and lymph nodes
carcinoma, low grade (grades I–II) or high grade (grade III),             with metastasis, among others (Yinti et al., 2015; Kardam et al.,
(2) serous carcinoma, (3) clear cell carcinoma, (4) mixed                 2016). In fact, the tumor-derived extracellular matrix (ECM)
carcinoma, (5) undifferentiated carcinoma, (6) carcinosarcoma,            is biochemically distinct in its composition and is stiffer than
(7) neuroendocrine carcinomas, and (8) other unusual types.               normal ECM. This new associated ECM compartment, rich in
These types have different histological and molecular features,           cross-linked collagen III (reticular fibers), has been proposed as a
precursor lesions, and natural history (Matias-guiu et al., 2001;         prospective marker of early stromal invasion in incipient tumors
Yeramian et al., 2013). They are also stratified by Tumor Cancer          such as breast cancer (Sivridis et al., 2004; Acerbi et al., 2015).
Genome Atlas (TCGA)-based molecular classification into four              In addition, not only the ECM collagen composition but also
risk groups combining gene encoding DNA polymerase ε (POLE)               the orientation of the fibers have been proposed as a prognostic
mutational analysis with IHC analysis of p53 and mismatch                 signature for survival in breast cancer (Conklin et al., 2011;
repair (MMR) proteins (PMS-2 and MSH-6) (Getz et al., 2013).              Xi et al., 2021).
This provides additional prognostic information to complement                The complex interaction between heterogenic immune cell
the microscopic features.                                                 subpopulations and tumor cells may drive tumor progression,
    Uterine leiomyosarcoma (uLMS) accounts for 1% of all                  metastasis, and resistance to therapy (Galli et al., 2020). The
uterine malignancies, with an annual incidence rate of 0.4–0.9            intensifying development of immunotherapeutic strategies calls
per 100,000 women. Like other forms of sarcoma, uLMS spreads              for a better understanding of tumor-immune subpopulation
to other parts of the body via the bloodstream rather than the            interactions and spatial distribution at the ITF (Blomberg et al.,
lymphatic system. Although rare, this cancer can be extremely             2018; König et al., 2019). In this context, the use of a multiplex
aggressive and is known to be generally unresponsive to                   immunolabeling panel is essential as it enables different cell
radiation or chemotherapy. Patient survival is highly dependent           subpopulations to be identified in one tissue section (Gorris et al.,
on speed of diagnosis and treatment, falling to 14% at                    2018). Multiplexed analysis can also simultaneously measure
5 years post-diagnosis for metastatic uLMS. From a molecular              the expression of distinct markers in a single cell as well
viewpoint, uLMS contains complex karyotypes, with numerous                as spatial associations between immune cell subpopulations.
chromosomal aberrations and frequent deletions affecting                  We applied this technology to evaluate the complex immune
chromosomal arms 2p, 2q, 10q, and 13q, as well as amplifications          environment of the ITF of uADC and uLMS. A previously
on 1p, 5q, and 8q, and precise alterations in TP53, RB1, PTEN,            developed and validated multiplex immunolabeling panel was
MED12, YWHAE, and VIPR2 (Cuppens et al., 2018).                           used to simultaneously assess the phagocytic cell marker CD68
    There is growing interest in understanding the molecular              of macrophages, CD3 + and CD8 + T cells, and CD20 + B
features involved in myometrial invasion, a highly valuable               lymphocytes in a single FFPE tissue (Abengozar-Muela et al.,
parameter due to its direct association with poor prognosis               2020; Salas-Benito et al., 2021).
and limited therapeutic response in uADC and uLMS. From                      Changes in activated-leukocyte cell adhesion molecule
a histopathological perspective, a variety of invasion patterns           (ALCAM) expression at the endometrial tumoral cell surface
frequently coexist in different areas of the same tumor (Euscher          (Devis et al., 2018) and increased expression of cytoplasmic
et al., 2013). Moreover, several tumor types show specific invasion       Cyclin D1 (Fusté et al., 2016) have been reported to allow
patterns not seen in other types of cancer. These differences can         dissemination and invasion of endometrial neoplastic cells.
be explained by the fact that cancer cell invasion is currently           Epigenetic mechanisms play an important role in regulating
viewed as an adaptive and heterogeneous process (Friedl and               gene expression during many biological processes (Sharma et al.,
Alexander, 2011) involving key processes such as cytoskeleton             2009). DNA methylation is the most widely studied epigenetic
dynamics, cell adhesion plasticity, and mechanotransduction of            modification, produced by adding a methyl group (CH3) to
external stimuli.                                                         the 5’ carbon of cytosines in cytosine–phosphate–guanine
    Type-specific new stroma generated at the site of active              (CpG) dinucleotides to generate 5-methylcytosine (5mC)
tumor invasion, the invasive tumor front (ITF), is crucial in             (Bao-Caamano et al., 2020). Deregulation of this epigenetic
tumor growth and invasion processes (Provenzano et al., 2006;             mechanism has major implications for cancer development and
Giatromanolaki et al., 2007). In fact, high proliferation rates           progression (Diaz-Lagares et al., 2016). In this context, recent
and cell cycle derailment have been shown at the ITF in uADC              genome-wide analyses have revealed striking alterations in the

Frontiers in Cell and Developmental Biology | www.frontiersin.org     2                                       June 2021 | Volume 9 | Article 670185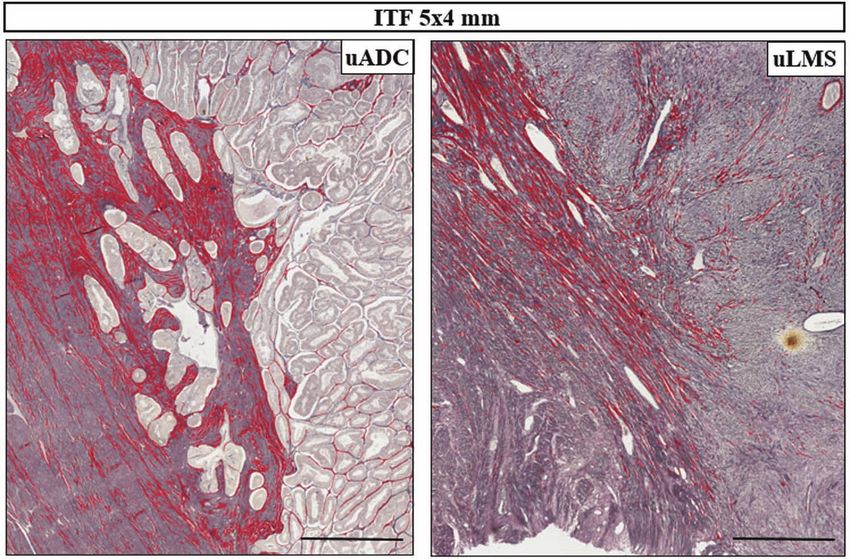
Sanegre et al.                                                                                                 Uterine-Myometrial Tumor Interface

methylation profile of uterine uADC and uLMS (Zhang et al.,               mismatch repair-deficient tumors, and 12.5% p53 abnormal). All
2014; Kommoss et al., 2020; Vargas et al., 2021).                         uLMS were conventional-type high-grade tumors.
   Cancers show a clear coevolution between tumor cells
and the tumor microenvironment. Specific differences in the               Selection of Regions of Interest
tumor microenvironment at different locations may play a                  Sections of FFPE tissue samples were scanned before and
role in tumor growth, metastatic progression, and therapy                 after microdissection. Whole sections including the interface
responses (Oliver et al., 2018; Zhang and Yu, 2019). In fact,             between tumor tissue and adjacent myometrium areas (the
tumor invasion is a dynamic process facilitated by bidirectional          ITF) were used for morphometric analysis. ITF microdissected
interactions between tumor cells and the microenvironment,                tissue was employed for transcriptomic and epigenomic studies
being particularly intense at the ITF. Unlike tumor cells,                (Supplementary Figure 1A). The amount of ITF microdissected
tumor microenvironment elements are genetically stable and                tissue varied from case to case, but the median width was 5 mm
thus represent an attractive therapeutic target. Uterine uLMS             (±1.66 mm) and median length 15 mm (±4.91 mm). The amount
and uADC are different tumor types occurring in the same                  of tumor vs. myometrium is shown in Supplementary Table 1.
organ, both of which infiltrate the myometrium during local                   Serial uADC and uLMS whole slides were used for
progression. The main objective of the present study is to                histomorphometric analysis of reticular fibers and multiplex
analyze several aspects of microenvironment response at the               immunofluorescence-based immune profiling. ITF regions
ITF in these two tumor types, looking for similarities and                were identified in stained tissue (Gomori and multiplex
differences that could provide insight into potential new common          immunofluorescence) by extrapolation of previous H&E-
therapeutic approaches, an aim that to our best knowledge has             selected regions. A region of interest (ROI) of 5 × 4 mm for
not previously been addressed.                                            each sample was identified within the ITF-stained area. These
                                                                          5 × 4-mm regions were used to correlate the results between
MATERIALS AND METHODS                                                     genomic, epigenetic, and morphometric studies (Supplementary
                                                                          Figure 1A). To achieve in-depth characterization of the reticular
Patients, Sample Description, and Case                                    fibers and immune infiltrate of the ITF, we further broke
                                                                          down the 5 × 4-mm ROIs into 1-mm2 ROIs representing
Selection                                                                 the following categories: (a) tumor (uADC or uLMS with
A search for uADC and uLMS cases was conducted in the                     absence of myometrium), (b) myometrium (excluding infiltrated
study institutions. Selection criteria included available pathology       myometrium from the analysis), and (c) balanced representation
reports, representative sections of the ITF, histologically proven        of the invasion front (containing 50% tumor and 50%
distant metastasis, and acceptable pre-analytical conditions.             myometrium). Supplementary Figure 1 shows a schematic
Cases were reviewed by a panel of expert gynecological                    representation of the procedure. Cases and ROIs where the
pathologists from the institutions involved. In total, 24 uADC            algorithm failed because of poor or excessive staining were
and 11 uLMS fulfilled all criteria and were included in the study.        excluded from the analysis, as were samples with unsatisfactory
    The study used formalin-fixed and paraffin-embedded (FFPE)            segmentation. The number of 5 × 4-mm and 1-mm2 ROIs of
tissue samples from 24 uADC and 11 uLMS obtained from                     each case in Gomori and multiplex immunofluorescence stained
five Spanish hospitals (Hospital Clínico de Valencia; Hospital            tissue are shown in Supplementary Table 1.
Virgen del Rocio, Seville; Hospital Universitari Vall d’Hebron
and Hospital Universitari de Bellvitge, Barcelona; Hospital
Universitari Arnau de Vilanova, Lleida) and the Norwegian                 Histomorphometric Analysis of Reticular
Radium Hospital, Oslo University Hospital, Oslo, Norway.                  Fibers
Tumors were classified following the most recent WHO criteria             The architecture of uADC and uLMS reticular fibers stained
and were surgically staged and graded according to the                    using Gomori’s method was uncovered. All samples were
FIGO (International Federation of Gynecology and Obstetrics)              digitized with the whole-slide scanner Ventana iScan HT (Roche)
staging and grading systems. The study was approved by                    at 20 × with a resolution of 0.46 µm/pixel. We used the open-
the local research ethics committee, and specific informed                source digital pathology software QuPath for sample visualization
consent was obtained.                                                     and identification of ROIs (Bankhead et al., 2017). 5 × 4-mm and
    Whole slide FFPE tissue sections of 5 µm of selected uADC             1-mm2 ROIs were exported to ImageJ (Schneider et al., 2012),
and uLMS were stained with H&E (hematoxylin and eosin)                    and these were saved as TIFF for image analysis.
and examined by the centralized expert group of pathologists                 In this study, we employed an advanced morphometric
to select the representative areas to include in the study. The           methodology based on a probabilistic method for the automatic
interface between tumor tissue and adjacent myometrium was                segmentation of reticular fibers. We used Gomoripath, a
microdissected under the microscope. Microscopic images were              morphometric tool for easy segmentation of reticular fibers
obtained using a digital slide scanner [Pannoramic 250 FLASH II           developed by researchers from Incliva Biomedical Research
2.0 (3D Histec)].                                                         Institute/University of Valencia, University of Castilla La
    All uADC were of endometrioid type and were classified                Mancha, and the Andalucía Public Health System (Espinosa-
according to the Cancer Genome Atlas (TCGA) surrogate                     Aranda et al., 2016). Briefly, the algorithm is based on
(0% POLE mutated, 58.5% non-specific molecular profile, 29%               nominal logistic regression applied to the optical density of

Frontiers in Cell and Developmental Biology | www.frontiersin.org     3                                     June 2021 | Volume 9 | Article 670185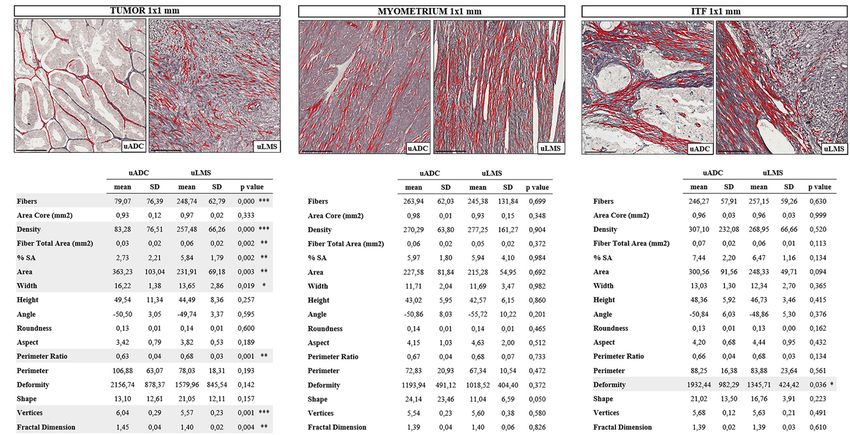
Sanegre et al.                                                                                                       Uterine-Myometrial Tumor Interface

the histopathological images. The optical density is calculated            were performed using InForm software (version 2.4.8, Akoya
iteratively, allowing reticular fibers to be enhanced. Subsequently,       Biosciences), as previously described (Abengozar-Muela et al.,
a logit model is used to calculate the probability of each pixel           2020; Salas-Benito et al., 2021). Image analysis was performed
belonging to the structure of reticular fibers depending on their          on 5 × 4-mm and 1-mm2 ROIs using the open-source digital
topology, thus creating a probability map for the entire image.            pathology software QuPath version 0.2.3, as previously described
The ROC (Receiver Operating Characteristic) curve generated by             (Abengozar-Muela et al., 2020). In short, cell segmentation
the model finally obtained an AUC (area under the ROC curve)               based on nuclear detection was performed on QuPath using
of 0.9563 in reticular fiber detection.                                    the StarDist 2D algorithm, a method that localizes nuclei
    Fifteen morphometric parameters defining the histological              via star-convex polygons, incorporated into QuPath software
organization of reticular fibers were calculated for each fiber            by scripting. A random-tree algorithm classifier was trained
detected and the mean for each sample calculated. Morphometric             separately for each cell marker by an experienced pathologist
parameters were extracted to characterize the size and shape of            annotating the tumor regions. Interactive feedback on cell
the morphometric variables at the ITF. In addition, the algorithm          classification performance is provided during training in the
measured the stained area of the tissue analyzed (excluding holes          form of mark-up image, significantly improving the accuracy
and damaged tissue), allowing us to determine the number of                of machine learning-based phenotyping (Bankhead et al., 2017;
fibers per mm2 (density) and the percentage of fiber-stained area          Abengozar-Muela et al., 2020). All phenotyping and subsequent
(%SA) (taking into account the sum of the areas of all fibers).            quantifications were performed blinded to the sample identity.
Morphometric parameters defining the histological organization             Cells close to the border of the images were removed to reduce
of the reticular fiber networks have been explained elsewhere              the risk of artifacts. Based on the fluorescence panels, cells were
(Tadeo et al., 2016). The mean of each parameter of similar uADC           further subclassified as CD68+, CD3+, CD8+, and CD20+.
and uLMS ROIs was calculated for comparison (Figures 1–3).                 Cells negative for these markers were defined as other cell types.
                                                                           The mean of the frequency of each cell marker of similar uADC
                                                                           and uLMS ROIs was calculated for comparison (Figures 3, 4).
Multiplex Immunofluorescence Cell
Phenotype                                                                  Transcriptomic Profiling
We next sought to investigate the uADC and uLMS myeloid                    Total RNA for gene expression assays was prepared from 5-µm
and lymphocytic contexture in the FFPE tissue samples.                     FFPE tissue sections of microdissected ITF using the Agencourt
A multiplex immunofluorescence panel was used to enable                    FormaPure kit (A33341; Beckman Coulter, Indianapolis, IN,
simultaneous examination of several cellular markers, including            United States) and following the manufacturer’s instructions. The
the phagocytic cell marker CD68 of macrophages, CD3 + and                  RNA concentration was determined with Qubit 4 Fluorometer
CD8 + T cells, and CD20 + B lymphocytes. Multiplex                         and Qubit RNA HS Reagent (Thermo Fisher Scientific,
                                                                                        R

immunofluorescence development and validation workflow and                 Waltham, MA, United States). RNA samples passing the quality
protocols were implemented as previously described (Schalper               control evaluation (uADC n = 19, uLMS n = 11) were selected.
et al., 2019; Abengozar-Muela et al., 2020; Salas-Benito et al.,               Transcriptomic profiling was performed with HTG EdgeSeq
2021). Briefly, 5-µm sections of FFPE tissue were deparaffinized           Precision Immuno-Oncology Panel, which interrogates 1,392
and antigen retrieval was performed using DAKO PT-Link                     genes involved in tumor/immune interaction1 . HTG EdgeSeq
heat-induced antigen retrieval with low pH (pH 6) or high                  Chemistry was employed to synthetize the RNA-Seq library.
pH (pH 9) target retrieval solution (DAKO). Each tissue                    Briefly, target capture was performed by hybridizing the mRNA
section was subjected to five successive rounds of antibody                with Nuclease Protection Probes (NPPs). The S1 nuclease was
staining, each round consisting of protein blocking with antibody          added to the mix, producing a stoichiometric amount of target
diluent/block (Akoya Biosciences ARD1001EA) and incubation                 mRNA/NPP duplexes. This reaction was blocked by enzyme
with a primary antibody, Opal Polymer anti-mouse/rabbit HRP                heat denaturation of S1. The samples were randomized before
(Akoya Biosciences ARH1001EA), followed by tyramide signal                 inclusion in the HTG EdgeSeq system to reduce potential biases
amplification (TSA) with Opal fluorophores (Akoya Biosciences)             in the run. Each hybridized sample was used as template to
diluted 1:100 in 1 × plus amplification diluent (Akoya                     set up PCR reactions with specially designed tags, sharing
Biosciences FP1498). The myeloid and lymphoid cell panel                   common sequences that are complementary to both 50 -end and
included CD68 (Mouse monoclonal, clone PG-M1, ready-to-                    30 -sequences of the probes, and common adaptors required
use, Agilent IR613), CD3 (Rabbit polyclonal, IgG, ready-to-use,            for cluster generation on an Illumina sequencing platform. In
Agilent IR503), CD8 (Mouse monoclonal, clone C8/144B, ready-               addition, each tag contains a unique barcode used for sample
to-use, Agilent IR623), CD20 (Mouse monoclonal, IgG2α, clone               identification and multiplexing. After PCR amplification, a
L26, ready-to-use, Roche 760-2531), and cytokeratin (Mouse                 cleanup procedure was performed using Agencourt AMPure XP
monoclonal, clone AE1/AE3, diluted 1:100, Agilent M3515).                  (Beckman Coulter). The library was quantified by quantitative
Finally, in the last round, nuclei were counterstained with spectral       PCR, using KAPA Library Quantification (Roche), according
DAPI (Akoya Biosciences FP1490) and sections mounted with                  to the manufacturer’s instructions. All samples and controls
Faramount Aqueous Mounting Medium (Dako S3025).                            were quantified in triplicate, and no template control was
   Each whole-tissue section was scanned on a Vectra-
Polaris Automated Quantitative Pathology Imaging System                    1
                                                                            https://www.htgmolecular.com/assets/htg/publications/GL-HTG-EdgeSeq-
(Akoya Biosciences). Tissue imaging and spectral unmixing                  Precision-Immuno-Oncology-Panel-GeneListAnnotated_01.pdf

Frontiers in Cell and Developmental Biology | www.frontiersin.org      4                                          June 2021 | Volume 9 | Article 670185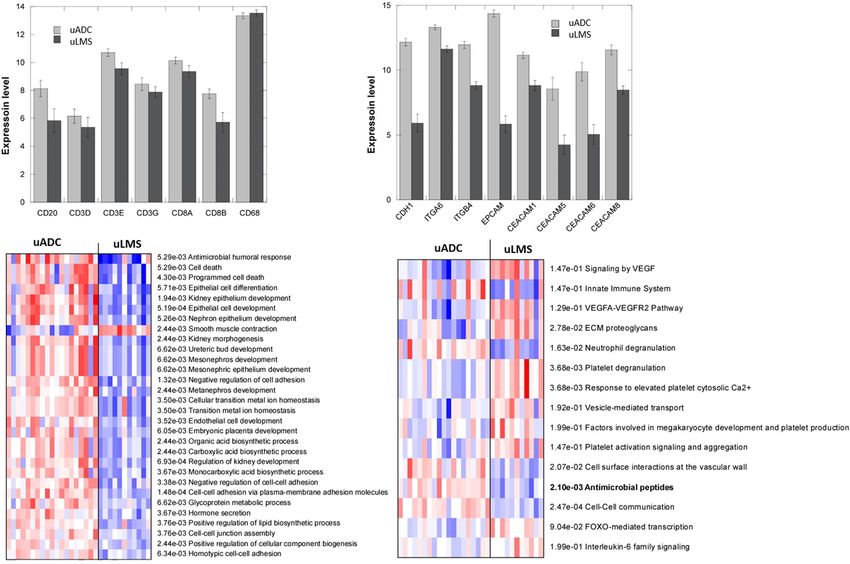
Sanegre et al.                                                                                                                   Uterine-Myometrial Tumor Interface

          A

          B                                                                          C

  FIGURE 1 | Histomorphometric features of reticular fibers in uterine adenocarcinomas (uADC) and leiomyosarcomas (uLMS) in the 5 × 4-mm region of interest (ROI)
  are very similar at the invasive tumor front (ITF). (A) Representative image of fiber segmentation in 5 × 4-mm ITF ROIs in uADC and uLMS. Reticular fibers are
  highlighted in red. Scale bar represents 1 mm. (B) Comparison of morphometric parameters obtained after reticular fiber segmentation between uADC and uLMS
  5 × 4-mm ITF ROIs. Fisher–Snedecor test and Student T-test were applied for statistical comparison. Mean, standard deviation (SD), p-Values, and significance
  (∗ < 0.05) are shown. Total fibers, area of the core, and sum of the total area of the fibers were measured to calculate the density (number of fibers/mm2 ) and
  percentage of the stained area (% SA). Area in µm2 . Length and width in µm. (C) The same comparison as in B with more restrictive criteria for case selection.

included in any run. Library denaturation was performed                              pM). Normalized libraries were sequenced by NGS. Four
by first adding 2N NaOH, followed by addition of 2N                                  demultiplexed FASTQ file per sample was retrieved from the
HCl. The PhiX was spiked in at 5% (concentration of 12.5                             sequencer for data processing. HTG EdgeSeq host software

Frontiers in Cell and Developmental Biology | www.frontiersin.org                5                                            June 2021 | Volume 9 | Article 670185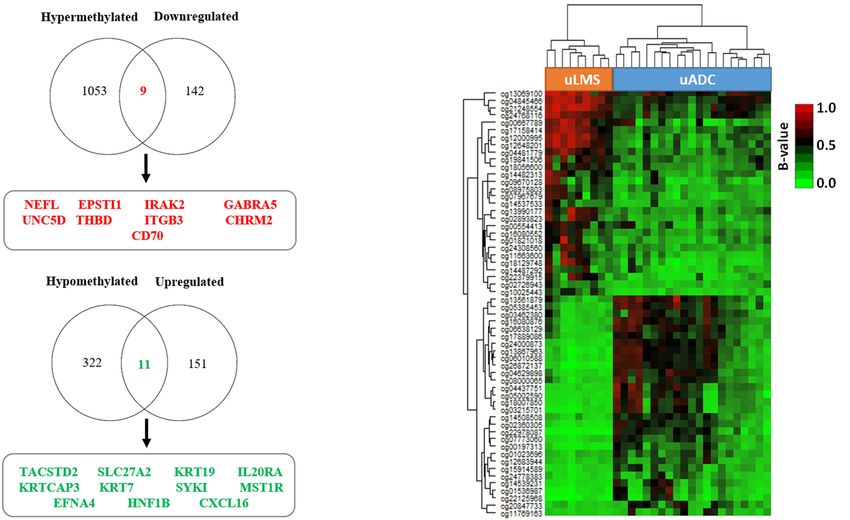
Sanegre et al.                                                                                                                       Uterine-Myometrial Tumor Interface

  FIGURE 2 | In-depth invasive tumor front (ITF) histomorphometric characterization of reticular fibers in uterine adenocarcinomas (uADC) and leiomyosarcomas
  (uLMS) reveals a high degree of architectural similarity. Representative image of fiber segmentation in 1 × 1-mm tumor ROIs in uADC and uLMS. Comparison of
  morphometric parameters obtained after reticular fiber segmentation between uADC and uLMS in panels (A) Intratumor 1 × 1-mm ROIs. (B) 1 × 1-mm myometrium
  ROIs, and (C) 1 × 1-mm invasive tumor front (ITF) ROIs in uADC and uLMS. Reticular fibers are highlighted in red. Fisher–Snedecor test and Student T-test were
  applied for statistical comparison. Mean, standard deviation (SD), p-Values, and significance (∗ < 0.05, ∗∗ < 0.01, ∗∗∗ < 0.001) are shown. Total fibers, area of the
  core, and sum of the total area of fibers were measured to calculate the density (number of fibers/mm2 ) and percentage of stained area (% SA). Area in µm2 . Length
  and width in µm. Scale bars represent 250 µm.

  FIGURE 3 | Distinct immune infiltrate distribution at the invasive tumor front (ITF) of uterine adenocarcinomas (uADC) and leiomyosarcomas (uLMS).
  (A) Representative multiplex immunofluorescence images of approximately 5 × 4-mm regions of interest (ROIs) of an adenocarcinoma (uADC) (4 × 4) and a
  leiomyosarcoma (uLMS) (5 × 3 mm). Color code as follows: DAPI (blue), CD20 (yellow), CD68 (green), CD8 (red), CD3 (orange), cytokeratin (cyan). (B) The mean of
  the densities (number of cells/mm2 ) for each cell marker is shown for uADC and uLMS as well as the mean for the total cells and the total immune infiltrate.
  Fisher–Snedecor test and Student T-test were applied for statistical comparison. P-values and significance (∗ < 0.05, ∗∗ < 0.01) for statistical comparison between
  the means of uADC and uLMS are displayed. Scale bars represent 1 mm.

performed the alignment of the FASTQ files to the probe                                  Raw count normalization and differential expression analysis
list, then results were parsed, and the output obtained as a                           were calculated using DESeq2 R package (1.30.0). Sample outliers
read count matrix.                                                                     were identified through variance stabilizing transformation.

Frontiers in Cell and Developmental Biology | www.frontiersin.org                  6                                              June 2021 | Volume 9 | Article 670185
Sanegre et al. Uterine-Myometrial Tumor Interface
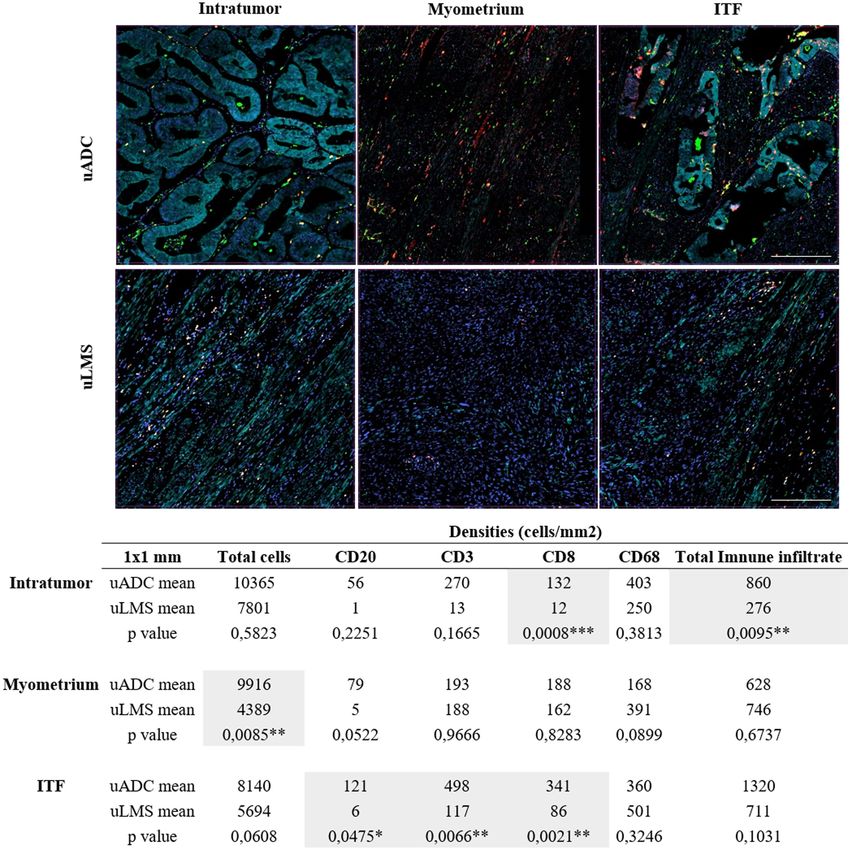
FIGURE 4 | Immune infiltrate characterization in 1 × 1-mm regions of interest (ROIs) in uterine adenocarcinomas (uADC) and leiomyosarcomas (uLMS).
(A) Representative multiplex images of 1 × 1-mm ROIs of intratumor, myometrium, and invasive tumor front (ITF) in uADC and uLMS. Color code as follows: DAPI
(blue), CD20 (yellow), CD68 (green), CD8 (red), CD3 (orange), cytokeratin (cyan). (B) The mean of the densities (number of cells/mm2 ) for each cell marker in each
region is shown for uADC and uLMS as well as the mean for the total cells and the total immune infiltrate. Fisher–Snedecor test and Student T-Test were applied for
statistical comparison. P-values and significance (∗ < 0.05, ∗∗ < 0.01, ∗∗∗ < 0.001) for statistical comparison between the means of intratumor, myometrium, and
ITF in uADC and uLMS are displayed. Scale bars represent 250 µm.
iDEP v0.922 was used for pathway analysis of normalized using the EZ DNA Methylation kit (Zymo Research) and were
expression values from RNA-Seq data (Ge et al., 2018). moved on to the FFPE Restore protocol (Illumina). The restoring
step was followed by Infinium HD FFPE methylation assay for
Genome-Wide DNA Methylation Analysis hybridization with Infinium MethylationEPIC BeadChips, which
Total genomic DNA from 10-µm FFPE tissue sections of cover over 850,000 CpG sites along the human genome (Moran
microdissected ITF (uADC n = 24, uLMS n = 11) was et al., 2016). Whole-genome amplification and hybridization
isolated using the AllPrep DNA/RNA FFPE Kit (Qiagen) and were performed on the BeadChips followed by single-base
following the manufacturer’s instructions. All DNA samples extension and analysis on a HiScan (Illumina) to assess the
were quantified by the fluorometric method using the Qubit cytosine methylation states. Image intensities were extracted
1 × dsDNA HS (High-Sensitivity) Assay Kit (Thermo Fisher) and using GenomeStudio (V2011.1) Methylation module (1.9.0)
were also checked for suitability for FFPE restoration following software from Illumina. Data quality control was assessed with
the Infinium HD FFPE QC Assay (Illumina). DNA samples GenomeStudio and BeadArray Controls Reporter, based on the
(100–250 ng) that passed this quality control evaluation (uADC internal control probes present on the array. The methylation
n = 22, uLMS n = 9) were selected for bisulfite conversion score of each CpG from samples that passed this quality control
(uADC n = 21, uLMS n = 9) was represented as β-value and
2
http://ge-lab.org/idep/ previously normalized for color bias adjustment, background
Frontiers in Cell and Developmental Biology | www.frontiersin.org 7 June 2021 | Volume 9 | Article 670185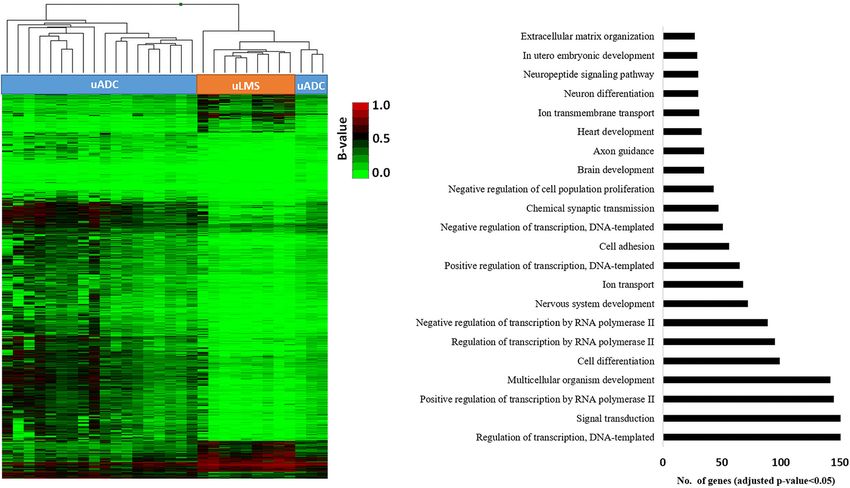
Sanegre et al.                                                                                                  Uterine-Myometrial Tumor Interface

level adjustment, and quantile normalization across arrays.               branching in uADC. Finally, the fractal dimension revealed that
Probes and sample filtering involved a two-step process for               reticular fibers are more haphazardly arranged in uADC than in
removing SNPs and unreliable β-values with a high detection               uLMS (1.44 vs. 1.40). On the other hand, the myometrium of
P-value > 0.01. After this filtering step, the remaining CpGs             uADC and uLMS displayed no significant differences in any of
were considered valid for the study. Non-parametric Wilcoxon              the parameters studied (Figure 2B). Interestingly, only one shape
tests were applied to determine differentially methylated                 parameter (deformity) was significantly different between uADC
CpGs (DMCpGs), which were considered significant with a                   vs. uLMS (1932.4 vs. 1345.7) (Figure 2C). This observation is a
false discovery rate (FDR) below 5%. All statistical analyses             more reliable indication than the 5 × 4-mm ROI results of a high
were performed in the R statistical environment (v.3.6.1).                degree of similarity between the reticular fiber scaffolding at the
The enrichment analysis of biological pathways for the                    ITF of uADC and uLMS.
methylation profiles were evaluated by gene ontology (GO) using               To further characterize uLMS and uADC, the tumor,
GENECODIS (Tabas-Madrid et al., 2012).                                    myometrium, and selected ITF were compared against each other
                                                                          for each tumor type. In contrast to the great similarity between
                                                                          1-mm2 ROIs of different tissue areas in uLMS, we found that
RESULTS                                                                   uADC exhibited multiple differences when ITF was compared
                                                                          against the tumor or myometrium (Table 1). There was higher
Reticulin Fiber Scaffolding in uLMS and                                   deposition of fibers, indicated by increased fiber density, in ITF
uADC Is Similar                                                           compared to tumor (307.10 vs. 83.28), leading to an increased
Several parameters of reticular fibers were assessed in 83.3%             %SA (7.44 vs. 2.73). Reticular fibers at the uADC also appeared
of uADC and 81.8% of uLMS (20 of 24 uADC and 9 of 11                      thinner at ITF than in tumor (width = 13.03 vs. 16.22), were
uLMS) (Supplementary Table 1). Interestingly, we found a high             linearized (aspect = 4.20 vs. 3.42), and presented less branching
degree of similarity between the 5 × 4 mm ROIs of uADC                    (vertices = 5.68 vs. 6.04). Finally, when comparing 1-mm2 ROIs
and uLMS ITFs (Figures 1A,B); in fact, the only significant               of uADC ITF vs. myometrium, the fibers appeared bigger at the
differences observed in the cases studied were in area size and           ITF (area = 300.56 vs. 270.29), were thicker (width = 13.03 vs.
deformity of the individual or meshwork fibers. However, we               11.71) and longer (height = 48.36 vs. 43.02), and therefore had
next performed a more restrictive analysis, excluding one case of         a larger perimeter (88.25 vs. 72.83). In addition, the fibers at the
each group based not only on algorithm quality control but on             uADC ITF appeared less linearized (aspect = 4.20 vs. 4.15) and
subjective assessment by two independent scientists (Figure 1C).          branched (vertices = 5.68 vs. 5.54) (Table 1A). Interestingly, in
In this case, we analyzed a more homogeneous sample group and             uLMS the only significant difference when comparing both ITF
observed no significant size or shape-related differences between         and tumor vs. myometrium was fiber shape (shape ITF = 16.76
the two tumor types. Large uADC ROIs with reticular fibers                and tumor 21.05 vs. myometrium 11.04) (Table 1B).
occupying a higher proportion of stained area (higher %SA) than
uLMS were detected.
   To test the robustness of the algorithm and assess the                 Heterogeneous Immune Environment at
representativeness of the 1-mm2 ROIs, we compared four ROIs               the ITF
of 1 mm2 inside the 5 × 4 mm against four ROIs of 1 mm2                   In order to characterize immune infiltrate at the ITF, we used
along the ITF for both uADC and uLMS. We found no significant             six-color multiplex immunostaining (CD20, CD3, CD8, CD68,
differences between ROIs (data not shown) and therefore                   CK, and DAPI) to estimate four different immune infiltrate
accepted the 1 × 1-mm areas as representative of the tumor,               subpopulations in the same 5 × 4 mm ROIs of uADCs and
myometrium, and selected field of ITF. Only regions meeting the           uLMS, used for reticular fiber analysis in sequential cuts in large
quality control parameters were included in the analysis. In total,       areas of uADCs and uLMS. The immune infiltrate was assessed
we compared n = 21 vs. n = 34 tumor ROIs, n = 39 vs. n = 24               in 95.8% of uADC and in 81% of uLMS (23 out of 24 and
myometrium ROIs, and n = 79 vs. n = 35 selected ITF ROIs                  9 out of 11, respectively) (Supplementary Table 1). Overall,
of uADC and uLMS, respectively (Supplementary Table 1). We                approximately 1,595,232 cells were counted and evaluated by
employed the same morphometric feature extraction procedure               digital pathology. Although the uLMS had a lower number of
as above, also performing the statistical Student test to compare         total cells, the two tumor types displayed the same amount of total
the mean of each acquired parameter by patient sample. In                 immune infiltrate (956 for uADC and 991 for uLMS) (Figure 3).
the 1-mm2 ITF ROIs, the two tumor types presented a high                  However, we observed diverse immune cellular compositions
number of significantly different parameters (7/15) (Figure 2A).          at the ITF, finding a clearly heterogeneous distribution of B
uADC fibers appeared larger (area = 363.2 µm2 vs. 231.9 µm2 )             and T lymphocytes and macrophages in the different tumors
and thicker (width = 16.21 µm vs. 13.6 µm) than in uLMS.                  analyzed. Comparing the two tumors, B lymphocytes (CD20+ )
However, because uADC has significantly lower density of fibers           appeared in lowest numbers out of the total immune population,
per µm2 (83.2 vs. 257.48 fibers/µm2 ) when compared to uLMS,              being statistically smaller in uLMS, while there was a significant
a smaller%SA of the tissue (2.73% vs. 5.84%) was shown.                   increase in macrophages, which represented the highest immune
Furthermore, uADC reticular fibers appeared smoother than the             population in uLMS. Conversely, T lymphocytes (CD3+ )
wavy ones in uLMS, as indicated by the perimeter ratio (0.62              emerged as the predominant immune infiltrate in uADC. The
vs. 0.68). The higher values for vertices in uADC compared to             relative frequency of CD20, CD3, CD8, and CD68-positive cells
uLMS (6.04 vs. 5.56) suggest that reticular fibers have greater           within each tumor reflected that uADCs and uLMS exhibited

Frontiers in Cell and Developmental Biology | www.frontiersin.org     8                                       June 2021 | Volume 9 | Article 670185
Sanegre et al. Uterine-Myometrial Tumor Interface
TABLE 1 | Heterogeneous architecture of reticular fibers between 1 × 1-mm regions of interest (ROIs) of tumor, myometrium, and invasive tumor front (ITF) within uterine
adenocarcinomas (uADC).
A B
Myometrium ITF Myometrium ITF
Mean p value Mean p value
Fibers 263,94 246,26 0,397 Fibers 245,38 257,15 0,809
Area core (mm2 ) 0,97 0,96 0,020 * Area core (mm2 ) 0,92 0,96 0,531
Density 270,29 307,10 0,526 Density 277,25 268,95 0,888
Fiber total area (mm2 ) 0,05 0,07 0,060 Fiber total area (mm2 ) 0,05 0,06 0,180
% SA 5,97 7,44 0,042 * % SA 5,94 6,47 0,714
Area 227,58 300,55 0,021 * Area 215,28 248,33 0,175
Width 11,71 13,02 0,030 * Width 11,69 12,34 0,640
Height 43,02 48,35 0,013 * Height 42,57 46,73 0,072
Angle −50,86 −50,84 0,994 Angle −55,72 −48,86 0,094
Roundness 0,13 0,13 0,010 * Roundness 0,14 0,13 0,064
Aspect 4,15 4,20 0,858 Aspect 4,63 4,44 0,798
Perimeter ratio 0,67 0,66 0,336 Perimeter ratio 0,68 0,68 0,979
Perimeter 72,83 88,24 0,022 * Perimeter 67,34 83,88 0,056
Deformity 1193,94 1932,43 0,009 ** Deformity 1018,52 1345,71 0,096
Shape 24,14 21,02 0,645 Shape 11,04 16,76 0,027 *
Vertices 5,54 5,67 0,042 * Vertices 5,60 5,63 0,839
Fractal dimension 1,39 1,39 0,838 Fractal dimension 1,40 1,39 0,742
Tumor ITF Tumor ITF
Mean p value Mean p value
Fibers 79,07 246,27 0,000 *** Fibers 248,74 257,15 0,750
Area core (mm2 ) 0,93 0,96 0,468 Area core (mm2 ) 0,97 0,96 0,396
Density 83,28 307,1 0,007 * Density 257,48 268,95 0,690
Fiber total area (mm2 ) 0,02 0,07 0,000 *** Fiber total area (mm2 ) 0,05 0,06 0,357
% SA 2,73 7,44 0,000 *** % SA 5,84 6,47 0,339
Area 363,23 300,56 0,109 Area 231,91 248,33 0,530
Width 16,21 13,03 0,000 *** Width 13,65 12,34 0,283
Height 49,54 48,36 0,718 Height 44,49 46,73 0,426
Angle −50,50 −50,84 0,867 Angle −49,74 −48,86 0,647
Roundness 0,13 0,13 0,228 Roundness 0,14 0,13 0,343
Aspect 3,42 4,2 0,011 * Aspect 3,82 4,44 0,072
Perimeter ratio 0,63 0,66 0,078 Perimeter ratio 0,68 0,68 0,651
Perimeter 106,88 88,25 0,241 Perimeter 78,03 83,88 0,524
Deformity 2156,74 1932,44 0,554 Deformity 1579,96 1345,71 0,425
Shape 13,10 21,02 0,140 Shape 21,05 16,76 0,285
Vertices 6,041 5,68 0,000 *** Vertices 5,57 5,63 0,482
Fractal dimension 1,45 1,39 0,000 *** Fractal dimension 1,40 1,39 0,306
Myometrium Tumor Myometrium Tumor
Mean p value Mean p value
Fibers 263,94 79,07 0,000 *** Fibers 245,38 248,74 0,941
Area core (mm2 ) 0,97 0,93 0,258 Area core (mm2 ) 0,92 0,97 0,414
Density 270,28 83,28 0,000 *** Density 277,25 257,48 0,714
Fiber total area (mm2 ) 0,05 0,02 0,000 *** Fiber total area (mm2 ) 0,05 0,05 0,541
% SA 5,97 2,73 0,001 ** % SA 5,94 5,84 0,944
Area 227,58 363,23 0,001 ** Area 215,28 231,91 0,566
Width 11,71 16,21 0,000 *** Width 11,69 13,65 0,182
Height 43,02 49,53 0,066 Height 42,57 44,49 0,574
(Continued)
Frontiers in Cell and Developmental Biology | www.frontiersin.org 9 June 2021 | Volume 9 | Article 670185Sanegre et al. Uterine-Myometrial Tumor Interface
TABLE 1 | Continued
A B
Myometrium Tumor Myometrium Tumor
Mean p value Mean p value
Angle −50,86 −50,50 0,872 Angle −55,72 −49,74 0,083
Roundness 0,14 0,13 0,458 Roundness 0,14 0,14 0,441
Aspect 4,15 3,42 0,054 Aspect 4,63 3,82 0,207
Perimeter ratio 0,66 0,63 0,020 * Perimeter ratio 0,68 0,68 0,825
Perimeter 72,83 106,88 0,056 Perimeter 67,34 78,03 0,139
Deformity 1193,94 2156,73 0,008 ** Deformity 1018,52 1579,96 0,085
Shape 24,14 13,10 0,186 Shape 11,04 21,05 0,040 *
Vertices 5,54 6,04 0,000 *** Vertices 5,60 5,57 0,784
Fractal dimension 1,39 1,44 0,003 ** Fractal dimension 1,40 1,40 0,777
(A) Comparison of morphometric parameters obtained after reticular fiber segmentation between myometrium and ITF, tumor and ITF, and myometrium and tumor in
1 × 1-mm uADC ROIs. (B) Comparison of morphometric parameters obtained after reticular fiber segmentation between myometrium and ITF, tumor and ITF, and
myometrium and tumor in 1 × 1-mm leiomyosarcoma (uLMS) ROIs. Fisher–Snedecor test and Student T-test were applied for statistical comparison. Mean, standard
deviation (SD), p values, and significance (* < 0.05, ** < 0.01, and *** < 0.001) are shown. Total fibers, area of the core, and sum of the total area of the fibers were
measured to calculate the density (number of fibers/mm2 ) and percentage of stained area (% SA). Area in µm2 . Length and width in µm.
cellular heterogeneity regarding immune distribution, whereas genes when comparing uADC (n = 19) vs. uLMS ITF (n = 11)
the total amount of infiltrate remained the same in 5 × 4-mm (Supplementary Table 1). A slight upregulation of T cell and
ITF (Figure 3). B cell markers was observed in uADC ITF, but no differences
Aiming for a more thorough characterization of the immune were detected in myeloid expression markers (Figure 5A) in
infiltrate, and given the heterogeneity observed, we proceeded accordance with the multiplex immunofluorescence findings.
to analyze the 1 × 1-mm ROIs, dividing the regions between Parametric analysis of gene-set enrichment using GO showed
tumor, myometrium, and ITF, choosing the same regions the activation of several biological processes related to cell
used for reticular fiber analysis (Supplementary Figure 1). adhesion, epithelial cell development, and kidney morphogenesis
After statistical comparison, we observed that uLMS had less in uADC ITF, likely resulting from their intrinsic tumor
total immune infiltrate than uADC (860 cells/mm2 vs. 276 morphology (Figure 5B). Indeed, uADC ITF showed increased
cells/mm2 ) in the tumor areas, and in fact, fewer overall cells expression of E-cadherin, EPCAM, and several keratins and
with markers were identified in uLMS (Figure 4); however, integrins (Figure 5C).
only CD8 became statistically smaller (132 cells/mm2 vs. 12 Interestingly, antimicrobial humoral response appeared to
cells/mm2 ). This observation suggests that uLMS tumor areas be activated in uADC ITF. By querying the curated reactome
are colder, or less abundant in terms of immune infiltrate, than database, upregulation of antimicrobial peptides was also
uADC (Figure 4). Regarding uADC and uLMS myometrium, observed, along with innate immune response and neutrophil
no significant differences in distribution of CD20-, CD3-, CD8-, degranulation (Figure 5D). ECM proteoglycans seemed to
and CD68-positive cells were found between the two tumor be upregulated in the uLMS ITF, as expected given their
types, as expected, with a low number of total cells in the mesenchymal phenotype.
myometrium near uLMS (Figure 4). However, the 1 × 1-mm
ITF regions displayed significant differences between CD20-,
Genome-Wide DNA Methylation Analysis
CD3-, and CD8-positive cells per mm2 , being higher in uADC.
The macrophage remained the most abundant existing cells in Identifies an Epigenetic Signature of ITF
both ITF tumors (Figure 4). Interestingly, the 1-mm2 ITF ROIs Related to Cell Adhesion and
results were more accurate than 5 × 4-mm ITF. The CD20 Extracellular Matrix
population still remained the lowest of all in both tumors, being The DNA methylation profile of the primary ITF was compared
significantly smaller in uLMS. While CD68-positive cells were the in uADC (n = 21) and uLMS (n = 9) using the Infinium
predominant population in uLMS, CD3 was the highest in uADC MethylationEPIC array (850 K) (Figure 6A). The scatter plot
and again significantly different compared to uLMS. of this epigenomic comparison revealed that the ITFs of both
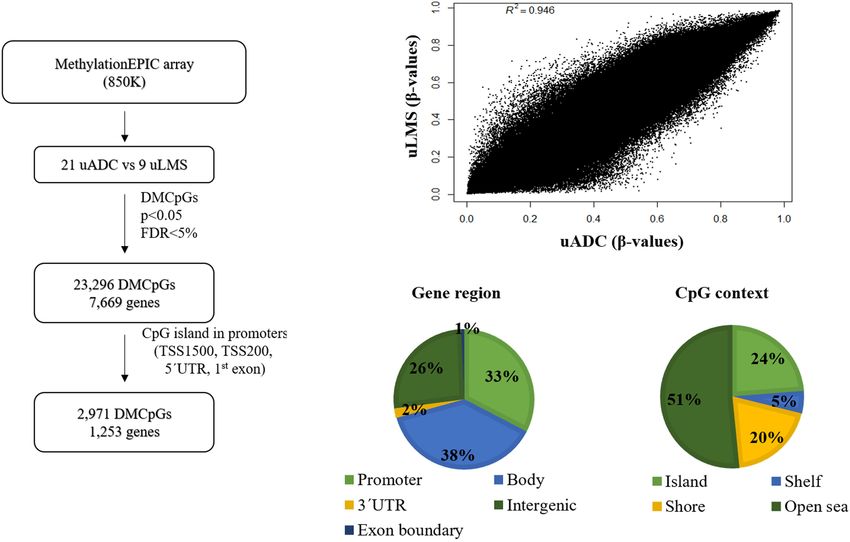
tumor types share a similar general DNA methylation pattern
(R2 = 0.946) (Figure 6B). In this sense, most of the 665,840
Transcriptional Profiling Reveals a valid CpGs analyzed had similar DNA methylation levels, while
Possible Role for Antimicrobial Peptides a small proportion of CpGs (3.5%, 23,296 CpGs) showed
in Immune Response at the ITF of uADC significant differences (p < 0.05; FDR < 5%) between uADC
Differential gene expression analyses revealed statistically and uLMS. These differentially methylated CpGs (DMCpGs)
significant upregulation of 142 genes and downregulation of 97 were distributed in several regions of the genome (Figure 6C),
Frontiers in Cell and Developmental Biology | www.frontiersin.org 10 June 2021 | Volume 9 | Article 670185Sanegre et al. Uterine-Myometrial Tumor Interface
including CpG islands (CGIs) and promoters. We found an type I collagen, reticulin distribution is increased in many cancers
epigenetic signature of 2,971 DMCpGs (corresponding to 1,253 such as head and neck squamous cell cancer, breast, pancreas, and
genes) located in CGIs of promoters, which were able to colorectal cancer (Nissen et al., 2019) and increases proliferation,
differentiate the ITF of uADC and uLMS (Figure 7A). Of note, migration, and metastasis in pancreatic and glioblastoma cancer
the GO analysis of this epigenetic signature revealed enrichment cells as well as in invasive prostate cancer (Chintala et al., 1996;
of differentially methylated genes between uADC and uLMS Menke et al., 2001; Kanematsu et al., 2004). Thus, in-depth
related to cell adhesion and ECM organization pathways, among characterization of morphometric features of reticular fibers
others. However, no evident enrichment of immune response (collagen type III) in invasive tumors could provide advanced
pathways was detected (Figure 7B). insight into mechanisms underlying the invasion and galvanize
targeted strategies for precision medicine (Kanner et al., 2013;
Gene Expression Profiling and DNA Walke and Bhagat, 2017).
Although several aspects of the ITF have been characterized
Methylation Identify a 20-Gene
in other types of tumors, comparison between them is
Epigenetic Signature Characteristic of very complicated due to differing quantification methods.
ITF Furthermore, the exact size of the true invasion front is also
As hypermethylation of promoters has been demonstrated under debate (Horrée et al., 2007) and little is known about the
to induce gene silencing in several tumor types, including histomorphometry of the fibers at the ITF of uADC and uLMS.
uterine neoplasms (Zhang et al., 2018), we decided to When analyzing the 5 × 4-mm ITF areas of uADC and uLMS,
evaluate the association between the gene expression and we found very few significant differences between morphometric
methylation profiling of promoter CGIs previously found in parameters, indicating a striking similarity between the ITF of
the TIF of primary uterine uADC and uLMS. We found the two tumor types. In a restrictive analysis, choosing a uADC
20 genes whose methylation status correlated with significant sample group with a more homogeneous architecture (based on
changes in gene expression (Figure 8A and Supplementary subjective criteria), all the significant differences disappeared,
Table 3); specifically, nine hypermethylated genes showed suggesting that an inclusive analysis reflects the architectural
downregulated gene expression, while 11 hypomethylated genes heterogeneity of the uADC tumors. We also circumvented the
were overexpressed. Of note, these 20 genes (corresponding to 58 issue of variable tissue amounts when analyzing 5 × 4-mm ITF
CpGs) represent a signature able to clearly differentiate the ITF ROIs by increasing the magnification of the ROIs to 1 mm2
of primary uterine uADC and uLMS (Figure 8B). Importantly, within the previously studied 5 × 4-mm ROIs in which we
some of the genes of this signature are related to immune system, ensured 50% each of the tumor and myometrium. After the
cell adhesion, and tumor stroma. necessary controls, we found that the area of the fibers in the
1-mm2 ITF was no longer significantly different between uADC
and uLMS, but the differences in deformity remained, indicating
DISCUSSION the potential value of this parameter as a differential characteristic
between the two types of tumors. We hypothesized that the area
In the uterus, uADC and uLMS account for a significant of the fibers in the 5 × 4-mm areas could vary due to an uneven
proportion of malignant tumors associated with distant contribution of the tumor to the analysis, given that the area
metastasis. These tumors possess distinct morphological was no longer different in the 1-mm2 ITF ROIs. The algorithm
and molecular features, and also a differing cell of origin. showed notably high sensitivity when measuring morphometric
However, both occur in the uterus, and each of them invades parameters, since in the 1-mm2 areas of myometrium we did
the myometrium as the initial step for tumor progression. not observe any significant differences between the two tumors,
Although dissimilar in many aspects, it is feasible that they share as expected. However, the large number of differences observed
some adaptive responses while invading the myometrium, or between 1-mm2 areas of pure tumor tissue reflects the ability to
alternatively, they could produce a similar response to tumor detect differences between negligible reticular fiber features of the
invasion in the myometrium. tumors under subjective criteria.
The process of stromatogenesis refers to the formation of new At a microscopic level, ROIs of 1 mm2 were sufficient
stroma in the active sites of tumor invasion and metastasis. It is for comparison of reticular fiber morphometric parameters
proposed that the formation of this new stroma is generated and between the tumor, myometrium, and ITF of uADC and
governed by the interplay between tumor cells and the complicity uLMS. Furthermore, 1-mm2 ROIs allowed us to characterize the
of adjacent activated fibroblasts. This new stroma disrupts the microarchitecture of the reticular fibers within the same type of
normal structures of the ECM and its continuity and favors tumor. Interestingly, comparisons between tumor, myometrium,
easy penetration by tumor cells, thus helping their migration and ITF in uLMS revealed a high degree of similarity and
and immune cell infiltration among other cells (Giatromanolaki little disruption of tissue architecture. Conversely, in uADC
et al., 2007; Horrée et al., 2007; Bremnes et al., 2011). The ECM we observed a very high number of significantly different
composition and spatial organization of collagen fibers in the morphometric features comparing the abovementioned ROIs
newly formed stroma is decisive not only for development of (Table 1), suggesting that continuity of ECM architecture is
several neoplasia but for tumor prognosis (Kondo, 2011; Acerbi much more disrupted in uADC than uLMS tumors. Regardless
et al., 2015; Devendra et al., 2018; Xu et al., 2019). In fact, like of statistical difference, observing the mean of morphometric
Frontiers in Cell and Developmental Biology | www.frontiersin.org 11 June 2021 | Volume 9 | Article 670185Sanegre et al. Uterine-Myometrial Tumor Interface FIGURE 5 | Transcriptomic profiling of invasive tumor front (ITF) in uterine adenocarcinomas (uADC) and leiomyosarcomas (uLMS). (A) RNA-seq expression levels (as counts per million, log2 scale) of cellular markers for macrophages (CD68), T cells (CD3 and CD8), and B lymphocytes (CD20). Slight upregulation of B and T cell markers is observed. (B) Parametric analysis of gene-set enrichment using the Gene Ontology biological process dataset. Red and blue indicate activated and suppressed pathways, respectively. (C) RNA-seq expression levels (as counts per million, log2 scale) of genes related to cell adhesion and epithelial cell development. Increased gene expression in uADC vs. uLMS was significant in all the markers. (D) Parametric analysis of gene-set enrichment using the curated reactome dataset reveals a possible role for antimicrobial peptides in immune response of uADC. Red and blue indicate activated and suppressed pathways, respectively. parameters at the ITF of uADC, we found that almost all values cell proliferation, differentiation, gene expression, migration, fell within the range of myometrium and tumor means, except invasion, metastasis, and survival, all hallmarks of cancer (Pickup for density (along with increased%SA) and aspect (linearization) et al., 2014), and which correlate with worse patient outcomes of fibers (Table 1). Since the areas were carefully chosen to patient (Leeming et al., 2011; Kehlet et al., 2016). Nevertheless, represent 50% each of myometrium and tumor components, there are still several features of the fiber topology to take we hypothesized that most changes observed at the uADC ITF into account for future studies that would require smaller could be attributable to the contribution of adjacent tissue. regions, such as analysis of fiber orientation with respect to the However, we cannot exclude the possibility of orchestrated ECM tumor–myometrium boundary, which would provide additional remodeling by tumor and non-tumoral cells to favor tumor value for prognosis (Acerbi et al., 2015; Conklin et al., 2011; cell migration (Giatromanolaki et al., 2007; Horrée et al., 2007; Xu et al., 2019). Bremnes et al., 2011). In fact, during tumor progression, cancer- Through multiplex cellular analyses, we could demonstrate associated fibroblasts are key players in dysregulated collagen that the uADC ITF contains a heterogeneous immune turnover, leading to tumor fibrosis as evidenced by increased environment compared to the one in LSM. We found variance collagen depositions in the immediate periphery of the tumor between different CD8 + T cell and macrophage subpopulations (Pankova et al., 2016). Consistent with our results, we observed of different ITF in uADC and LSM. This suggests diverse myeloid an increase of fiber density at the uADC ITF compared to and lymphocyte compositions of ITF immune environments, tumor. In addition, the collagens are often cross-linked and with CD8 + T cell and macrophage density possibly influenced linearized leading to stiffening of the tissue in several tumors by the presence of certain ECM components, such as collagens (Nissen et al., 2019), which we also observed in uADC ITF as fibers, which could prevent interactions with other immune cells. displayed by a significantly longer appearance (linearization) of It has been shown that the reciprocal interaction between the the reticular fibers at the uADC ITF. ECM stiffening could in turn ECM and tumor and non-tumor cells such as myofibroblasts elicit behavioral effects on surrounding tumor cells regarding determines recruitment, activation, and reprogramming of Frontiers in Cell and Developmental Biology | www.frontiersin.org 12 June 2021 | Volume 9 | Article 670185
Sanegre et al.                                                                                                                     Uterine-Myometrial Tumor Interface

  FIGURE 6 | Genome-wide DNA methylation analysis in invasive tumor front (ITF) of primary uterine adenocarcinomas (uADC) and leiomyosarcomas (uLMS) shows a
  small proportion of CpGs with differential methylation pattern. (A) Schematic flowchart used to identify differentially methylated CpGs (DMCpGs) in primary ITF
  between uADC and uLMS. (B) Scatter plot representing mean normalized levels of DNA methylation (β-values) in primary ITF of uADC and uLMS. (C) Genomic
  distribution of 23,296 differentially methylated CpGs (DMCpGs) in primary ITF of uADC and uLMS, in relation to their respective location regarding CpG context and
  gene region.

stromal, inflammatory, and immune cells (Sanegre et al., 2020).                       dimension of the fibers (although fewer fibers can be counted).
Despite the great similarity of reticulin scaffolding at the ITF of                   Stiffer tumors could lead to a physical barrier, thus increasing the
uADC and uLMS, we observed a differential immune infiltrate                           leukocyte concentration at the ITF. In addition, ECM stiffness
pattern, as informed by CD20, CD3, and CD8 markers. We                                can induce chromosomal rearrangements and transcriptional
thus cannot attribute a direct effect of reticulin architecture on                    changes in several diseases (Simi et al., 2018; López-Carrasco
the immune infiltrate composition right at the ITF. However,                          et al., 2020) and many stiffness-sensitive genes may respond to
there could be a relationship between the morphometry of                              stiffness in non-linear ways (Darnell et al., 2018).
reticular fibers and the total amount of infiltrate, since the                            Transcriptomic profiling of the ITF of uADC and uLMS
immune population is the same in both tumor types. A dense                            suggests that activated neutrophils secreting antimicrobial
architectural barrier can be imposed not only by reticular fibers                     peptides (AMP) may play a role in the immune response
but also by ECM elements such as other collagens, hyaluronic                          to oncogenesis in the context of endometrial tumors. Indeed,
acid, and laminins. Whereas high molecular weight hyaluronic                          antimicrobial humoral response seems to be inactivated in uLMS,
acid provides structural integrity and suppresses the immune                          in stark contrast to uADC, in which there is an upregulation
response by increasing regulatory T cell activity, laminins prevent                   of this signature. AMPs have been described as important
transmigration and polarize leukocytes (Bollyky et al., 2009;                         actors in angiogenesis and modulation of the immune response,
Chanmee et al., 2016; Simon and Bromberg, 2017). ECM                                  via stimulation of chemokines and chemotaxis of leukocytes,
remodeling enzymes such as metalloproteinases, matrikines,                            and may also exert cytotoxic activity against tumor cells (Al-
and versicans act as cytokines and chemokines promoting IL                            Rayahi and Sanyi, 2015; Jin and Weinberg, 2019). In fact,
expression and T cell chemoattractants, polarizing and activating                     LCN2, one of the top upregulated genes in the ITF of uADCs
the immune cells (Thomas et al., 2007; Hope et al., 2016). In                         (Supplementary Table 2), codes for neutrophil gelatinase-
fact, although an upregulation of collagen genes in uLMS tumors                       associated lipocalin, which has been reported to be associated
can be observed, it is still not clear whether these genes are                        with aggressive features of endometrial uADC (Mannelqvist et al.,
responsible for immune density distribution. Another plausible                        2012; Cymbaluk-PA Oska et al., 2019) but is also described
explanation for leukocyte accumulation at the ITF of uADC                             as an invasiveness and metastasis suppressor in other contexts
could be that reticulin morphometric description suggests that                        (Lee et al., 2006; Lim et al., 2007; Tong et al., 2008; Santiago-
uADC tumor areas seem stiffer than uLMS tumors, as indicated                          Sánchez et al., 2020). Another highly upregulated antimicrobial
by the larger area and width and greater branching and fractal                        peptide, DEFB1 (Supplementary Table 2), belongs to a family

Frontiers in Cell and Developmental Biology | www.frontiersin.org                13                                             June 2021 | Volume 9 | Article 670185
You can also read