A protein network map of head and neck cancer reveals PIK3CA mutant drug sensitivity
←
→
Page content transcription
If your browser does not render page correctly, please read the page content below
RES EARCH

                                                             ◥                                                      The data reveal a previously unidentified as-
 RESEARCH ARTICLE SUMMARY                                                                                        sociation of the fibroblast growth factor receptor
                                                                                                                 (FGFR) tyrosine kinase 3 with Daple, a guanine-
SYSTEMS BIOLOGY                                                                                                  nucleotide exchange factor, resulting in activation
                                                                                                                 of Gai and PAK1/2 to promote cancer cell migra-
A protein network map of head and neck cancer                                                                    tion. This signaling pathway and cell migration
                                                                                                                 can be effectively inhibited by FGFR inhibitors.
reveals PIK3CA mutant drug sensitivity                                                                              Furthermore, AP-MS analysis for 16 PIK3CA
                                                                                                                 mutations revealed differences in PPIs. PIK3CA
Danielle L. Swaney, Dana J. Ramms, Zhiyong Wang, Jisoo Park, Yusuke Goto, Margaret Soucheray,                    helical domain mutants, the most common in
Neil Bhola, Kyumin Kim, Fan Zheng, Yan Zeng, Michael McGregor, Kari A. Herrington, Rachel O’Keefe,               HNSCC, preferentially interact with the HER3
Nan Jin, Nathan K. VanLandingham, Helene Foussard, John Von Dollen, Mehdi Bouhaddou,                             receptor tyrosine kinase. Analysis of isogenic
David Jimenez-Morales, Kirsten Obernier, Jason F. Kreisberg, Minkyu Kim, Daniel E. Johnson,                      xenografts in mice revealed that PIK3CA mu-
Natalia Jura, Jennifer R. Grandis, J. Silvio Gutkind, Trey Ideker*, Nevan J. Krogan*                             tant interaction specificity can determine the
                                                                                                                 in vivo response to HER3 inhibitors, with
                                                                                                                 PIK3CA helical domain mutations conferring
INTRODUCTION: Genome-sequencing efforts                     To characterize the protein-protein inter-           sensitivity to HER3 inhibitor treatment with
over the past decade have profiled the genetic           action (PPI) landscape of HNSCC, we selected            CDX3379 and the H1047R kinase domain mu-
landscape of thousands of tumors and solidi-             proteins based on altered molecular path-               tation conferring resistance.

                                                                                                                                                                                            Downloaded from https://www.science.org at University of California San Diego on October 04, 2021
fied the concept of cancer as a highly hetero-           ways identified from The Cancer Genome Atlas
geneous disease. Evidence from these efforts             analysis of HNSCC tumors. Additional pro-               CONCLUSION: We outline a framework for elu-
has revealed that thousands of genes are al-             teins were added based on genes with recur-             cidating tumor genetic complexity through
tered in cancer, presenting a high degree of             rent point mutations or a previously published          multidimensional PPI maps. This framework
complexity that can be challenging to translate          association with HNSCC. PIK3CA (the gene                is applied to enhance our understanding of
into a molecular or clinical understanding. For          encoding the alpha catalytic subunit of phos-           HNSCC and also breast cancer (see Kim et al.,
example, head and neck squamous cell carci-              phoinositide 3-kinase) is the most commonly             this issue). These works also suggest that a
noma (HNSCC) is the sixth most common                    mutated oncogene in HNSCC, and although                 vast network of PPIs are left to be discovered.
malignancy worldwide and, despite a wealth               a few canonical mutations are well studied,             Such interactions, especially when combined
of data detailing the genetic alterations in this        there are many noncanonical mutations that              with datatypes in a hierarchical model (see
tumor type, few targeted therapies are availa-           are less well understood. We conducted af-              Zheng et al., this issue), can reveal new mech-
ble. Therefore, HNSCC presents an opportunity            finity purification–mass spectrometry (AP-MS)           anisms of cancer pathogenesis, instruct the se-
to apply network biology approaches to iden-             analysis across three cell lines for 31 genes           lection of therapeutic targets, and inform which
tify new therapeutic targets and further our             frequently altered in HNSCC, as well as 16              point mutations in the tumor are most likely
understanding of existing ones.                          PIK3CA mutations. Two of the lines were                 to respond to treatment. We anticipate that the
                                                         HNSCC cell lines with RNA profiles repre-               application of this framework will be valuable
RATIONALE: Network biology approaches have               sentative of HNSCC patients, and one was an             to translating genetic alterations into a molec-
been successfully applied to bridge the gap be-          esophageal, non-tumerogenic cell line.                  ular and clinical understanding of the under-
tween genetic alterations and clinical outcomes;
however, such approaches rely heavily upon               RESULTS: This network analysis uncovered
                                                                                                                 lying biology of many diseases.
                                                                                                                                                                 ▪
existing public databases of molecular inter-            771 interactions from cancer and noncancer-             The list of author affiliations is available in the full article online.
actions. With the growing recognition that               ous cell states including wild-type and mu-             *Corresponding author. Email: tideker@ucsd.edu (T.I.); nevan.
                                                                                                                 krogan@ucsf.edu (N.J.K.)
molecular interactions can vary substantially            tant protein isoforms. We found that 84% of             Cite this article as D. L. Swaney et al., Science 374, eabf2911
across cellular contexts, the generation of net-         these interactions had not been previously              (2021). DOI: 10.1126/science.abf2911
works in a cancer context represents a critical          reported in public databases, providing a
approach to interpreting and predicting cancer           rich resource of new interactions with can-                        READ THE FULL ARTICLE AT
biology and its clinical outcomes.                       cer relevance.                                                     https://doi.org/10.1126/science.abf2911

Head and                                      Comparative interaction mapping                                            Therapeutic targeting of
neck cancer                                                                                                              cancer-enriched interactions
                                                                                                          Tumor growth

                                                                                                                              No drug
                                                                                                                              Drug added

                                                                                                                                                Time
HNSCC interactome analysis. PPI analysis of genes commonly altered in HNSCC reveals interactions that can be therapeutically targeted to inhibit tumor growth.

Swaney et al., Science 374, 49 (2021)   1 October 2021                                                                                                                          1 of 1
RES EARCH

                                                     ◥                                                                      approaches to both identify new therapeutic
    RESEARCH ARTICLE                                                                                                        targets and to further our understanding of
                                                                                                                            existing targets such as PIK3CA. PIK3CA is the
SYSTEMS BIOLOGY                                                                                                             most commonly mutated oncogene in HNSCC
                                                                                                                            and encodes p110alpha (p110a), the catalytic
A protein network map of head and neck cancer                                                                               subunit of phosphatidylinositol 3-kinase (PI3K).
                                                                                                                            A hallmark of numerous tumor types, hyper-
reveals PIK3CA mutant drug sensitivity                                                                                      activation of PI3K can be directly attributed
                                                                                                                            to either amplification or mutation of PIK3CA
Danielle L. Swaney1,2,3,4, Dana J. Ramms4,5,6, Zhiyong Wang4,6, Jisoo Park4,7, Yusuke Goto4,6,                              and results in activation of the Akt/mammalian
Margaret Soucheray1,2,3,4, Neil Bhola4,8, Kyumin Kim1,2,3,4, Fan Zheng4,7, Yan Zeng4,8,                                     target of rapamycin (mTOR) pathway. Although
Michael McGregor1,2,3,4, Kari A. Herrington9, Rachel O’Keefe4,8, Nan Jin4,8,                                                the function of canonical PIK3CA mutations
Nathan K. VanLandingham4,8, Helene Foussard1,2,3,4, John Von Dollen1,2,3,4, Mehdi Bouhaddou1,2,3,4,                         (e.g., E542K, E545K, and H1047R) is well studied,
David Jimenez-Morales1,2,3,4†, Kirsten Obernier1,2,3,4, Jason F. Kreisberg4,7, Minkyu Kim1,2,3,4,                           much remains to be learned about how the
Daniel E. Johnson8, Natalia Jura3,4,10, Jennifer R. Grandis4,8, J. Silvio Gutkind4,5,6,                                     numerous noncanonical mutations regulate
Trey Ideker4,7,11,12*, Nevan J. Krogan1,2,3,4*                                                                              PIK3CA interactions and function (28–30).
                                                                                                                            Here, we present a comparative AP-MS anal-
We outline a framework for elucidating tumor genetic complexity through multidimensional protein-                           ysis across three cell lines for 31 genes fre-
protein interaction maps and apply it to enhancing our understanding of head and neck squamous cell                         quently altered in HNSCC, including 16 PIK3CA

                                                                                                                                                                                 Downloaded from https://www.science.org at University of California San Diego on October 04, 2021
carcinoma. This network uncovers 771 interactions from cancer and noncancerous cell states, including                       mutations.
WT and mutant protein isoforms. Prioritization of cancer-enriched interactions reveals a previously
unidentified association of the fibroblast growth factor receptor tyrosine kinase 3 with Daple, a guanine-                  Mapping of the HNSCC interactome
nucleotide exchange factor, resulting in activation of Gai- and p21-activated protein kinase 1/2 to                         To characterize the PPI landscape of HNSCC,
promote cancer cell migration. Additionally, we observe mutation-enriched interactions between the                          we selected proteins on the basis of altered
human epidermal growth factor receptor 3 (HER3) receptor tyrosine kinase and PIK3CA (the alpha                              molecular pathways identified from the TCGA
catalytic subunit of phosphatidylinositol 3-kinase) that can inform the response to HER3 inhibition in                      analysis of HNSCC tumors (Fig. 1A) (7). Ad-
vivo. We anticipate that the application of this framework will be valuable for translating genetic                         ditional proteins were added based on genes
alterations into a molecular and clinical understanding of the underlying biology of many disease areas.                    with recurrent point mutations or a previously
                                                                                                                            published association with HNSCC (31–34).

G
                                                                                                                            In total, we selected 33 protein baits, of which
       enome-sequencing efforts over the past                          networks, to predict patient survival and re-        31 were experimentally tractable (see the mate-
       decade have profiled the genetic land-                          sponse to therapy (9–19). Such network-based         rials and methods and table S1). Ninety-nine
       scape of thousands of patient tumors                            approaches rely strongly on existing databases       percent of HNSCC patients harbor an altera-
       and solidified the concept of cancer as                         of molecular interactions. To date, publicly         tion in one or more of these proteins (Fig. 1A).
       a highly heterogeneous disease (1–8).                           available human protein-protein interaction             For those baits with recurrent point muta-
Evidence from these efforts has also revealed                          (PPI) networks have been populated primarily         tions, both the wild-type (WT) and mutant
that thousands of genes are altered in can-                            by systematic efforts either without human           forms of the protein were tagged, purified,
cer, presenting an overwhelming degree of                              cellular context (yeast two-hybrid) (20, 21) or      and analyzed. Each bait was expressed as a
complexity that has limited the power of con-                          by affinity purification–mass spectrometry           3xFLAG-tagged protein under the control of
necting individual alterations with cancer pa-                         (AP-MS) (22–24) in workhorse cell lines that         a doxycycline-inducible promoter in biological
tient phenotypes. To facilitate interpretation,                        lack cancer context, such as human embryonic         triplicate in three separate cell lines (Fig. 1B).
powerful network biology approaches have                               kidney (HEK) 293T cells. With the growing            We selected two human papillomavirus (HPV)–
been developed in which protein network                                recognition that such PPIs can vary highly           negative HNSCC cell lines (SCC-25 and CAL-33)
knowledge is used to aggregate individual                              across cellular contexts (25), the generation        that harbor many genetic alterations present
tumor mutations and, on the basis of altered                           and incorporation of physical and functional         in the HNSCC patient population (Fig. 1A) and
1                                                                      networks in a cancer context likely repre-           that have previously been shown to have RNA
 Quantitative Biosciences Institute (QBI), University of
California San Francisco, San Francisco, CA, USA. 2J. David            sents a critical component to interpreting           profiles highly correlated with those of HNSCC
Gladstone Institutes, San Francisco, CA, USA. 3Department              and predicting cancer biology and its clinical       patients (Spearman correlation = 0.66 and
of Cellular and Molecular Pharmacology, University of                  outcomes (26).                                       0.69 for CAL-33 and SCC-25, respectively)
California San Francisco, San Francisco, CA, USA. 4The
Cancer Cell Map Initiative, San Francisco and La Jolla, CA.               To explore the utility of PPI maps generated      (7, 32, 34, 35). Additionally, an immortalized
5
  Department of Pharmacology, University of California San             in a cancer context, we conducted AP-MS ex-          nontumorigenic cell line, HET-1A, was used
Diego, La Jolla, CA. 6Moores Cancer Center, University of              periments to map protein networks in the             from a similar anatomical location (esophagus)
California San Diego, La Jolla, CA. 7Division of Genetics,
Department of Medicine, University of California San Diego,
                                                                       context of head and neck squamous cell car-          for comparison. A previously described AP-MS
La Jolla, CA. 8Helen Diller Family Comprehensive Cancer                cinoma (HNSCC) guided by analyses such as            workflow was then used to identify PPIs from
Center, University of California San Francisco, San Francisco,         that from The Cancer Genome Atlas (TCGA).            these three cell lines (Fig. 1B) (36). We elected
CA, USA. 9Department of Biochemistry and Biophysics
Center for Advanced Light Microscopy at UCSF, University of
                                                                       HNSCC is a cancer affecting squamous muco-           to report a conservative and high-confidence
California San Francisco, San Francisco, CA, USA.                      sal epithelial cells in the oral cavity, pharynx,    PPI (HC-PPI) map by requiring PPIs to pass
10
   Cardiovascular Research Institute, University of California         and larynx, and is estimated to be the sixth         stringent criteria by two complementary
San Francisco, San Francisco, CA, USA. 11Department of
                                                                       most common malignancy worldwide (27).               PPI scoring algorithms: SAINTexpress and
Bioengineering, University of California San Diego, La Jolla,
CA, USA. 12Department of Computer Science, University of               Despite a wealth of data detailing the genetic       CompPASS (see the materials and methods)
California San Diego, La Jolla, CA, USA.                               alterations in this tumor type (7), only two types   (22, 37, 38). Using this workflow, a total of 771
*Corresponding author. Email: tideker@ucsd.edu (T.I.);                 of targeted therapies are presently available        HC-PPIs were identified involving 654 proteins
nevan.krogan@ucsf.edu (N.J.K.)
†Present address: Department of Medicine, Division of Cardiovascular   (27). Therefore, HNSCC presents an opportu-          (Fig. 1B; fig. S1, A and B; and data S2 and S3),
Medicine, Stanford University, Stanford, CA, USA.                      nity to apply emerging quantitative systems          for an average of 25 PPIs per bait gene.

Swaney et al., Science 374, eabf2911 (2021)               1 October 2021                                                                                              1 of 13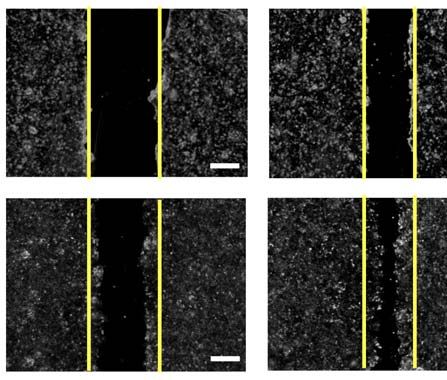
RES EARCH | R E S E A R C H A R T I C L E
A B Head & neck cancer cell lines
Non-tumor
esophageal
Patients with alteration
CAL-33 SCC-25 HET-1A
Profiled in mutations
Profiled in protein expression
SCC-25
CAL-33
Profiled in putative CNA
Profiled in mRNA expression Protein-protein interaction analysis workflow
TP53 72% Biological triplicate per gene
CDKN2A 54%
PIK3CA 48%
TP63 36%
FADD 33% 54 baits: 3xFLAG-tagged HNSCC associated genes
SOX2 32% (31 WT, 23 mutants)
RHOA 31% 3xFLAG
CCND1 26% Bait
EGFR 21%
CASP8 17% Affinity purification-mass spectrometry
NFE2L2 18%
MAPK1 15%
MYC 14% PPI scoring with CompPASS and SAINTexpress
PTEN 13%
KEAP1 12% Label-free quantification between WT and mutant PPIs
CUL3 12%
E2F1 12%
FBXW7 11% 771 HC-PPIs encompassing 654 prey proteins
PTPRT 11%
FGFR1 10% C D E
CNV (p = 3.9e-1) mutation (p = 1.0e-4)
Downloaded from https://www.science.org at University of California San Diego on October 04, 2021
RB1 10% mRNA (p = 5.1e-2)
Alteration frequency per prey in cohort
Alteration frequency per prey in cohort
IGF1R 10% 2.1
Alteration frequency per prey in cohort
7.2 0.95
HRAS 9%
2.0
TRAF3 9% 0.90
7.0
TGFBR2 9% 1.9 0.85
ERBB2 8% 6.8
1.8 0.80
FGFR3 7%
HLA-A 5% 1.7 6.6 0.75
NRAS 5%
1.6 0.70
STAT3 5% 6.4
XPC 4% 1.5 0.65
6.2
Mutation (putative driver) Amplification mRNA upregulation Protein upregulation No alterations 1.4 0.60
Genetic
alteration type Mutation (unknown Mutant protein
Deep deletion mRNA downregulation Protein downregulation
significance) AP-MS profiled 654 prey proteins from this study
654 random proteins
F G H
16% in public CAL-33
databases (HNSCC)
339
CAL-33
84% novel 10
interactions HET-1A 15 24
20 268
95
SCC-25 HET-1A
SCC-25
(non-tumor
(HNSCC)
Not detected 0.0 1.0 esophageal)
PPI Score
Fig. 1. Experimental design and workflow. (A) Alteration frequencies from the TCGA data. The white circle indicates the median of the random sampling, and
HNSCC TCGA provisional dataset (n = 530 patients) for the 31 experimentally the gray bar represents ±1 SD. The frequency of alterations found in the prey
tractable genes selected as AP-MS baits in this study. Proteins analyzed in this retrieved in this PPI dataset is indicated by the black circle. (F) Percentage of
study are listed, along with the percentage of patients with an alteration in HC-PPIs identified in a panel of public PPI databases [CORUM, BioPlex 2.0,
that gene/protein. Each patient is represented by a gray box colored based on or BioGRID low-throughput and multivalidated, and IMEX (23, 85–87)].
the occurrence and type of alteration(s) observed in that patient. Both the WT (G) Clustering analysis of all HC-PPIs (n = 771) based on their PPI score,
and mutant protein sequence(s) were analyzed for the genes highlighted in which is an average of the confidence scores reported from SAINTexpress
yellow. The genetic alteration types in the two cancer cell lines CAL-33 and and CompPASS (see the materials and methods for details). A PPI score of
SCC-25 are also displayed. (B) Experimental workflow in which each bait was 1.0 represents the highest confidence in a PPI. (H) Venn diagram illustrating the
expressed in biological triplicate in three cell lines and subjected to AP-MS overlap in HC-PPIs among the three cell lines. For this analysis, only those
analysis. (C to E) Permutation test illustrating the frequency of CNVs (C), mRNA PPIs passing the HC-PPI filtering criteria by both SAINTexpress and CompPASS
alterations (D), and mutations (E) from randomly selected genes in the HNSCC were classified as an HC-PPI within an individual cell line.
We and others have shown that alteration types of alterations measured in the HNSCC lack of enrichment for generic mRNA alter-
profiles in cancer are organized into molecular TCGA cohort (see the materials and methods). ations, we did find that PPIs from each cell
networks in which the interaction partners of Our dataset was indeed highly enriched for line were significantly enriched in proteins with
frequently altered proteins incur a higher rate preys with point mutations; however, this en- mRNA expression profiles that were prognostic
of alteration than a random selection of genes richment was not observed for alterations in in TCGA for HNSCC (fig. S1C).
(9, 10, 39, 40). Thus, we tested whether our mRNA expression or for chromosomal rear- Of the 771 HC-PPIs detected, the majority
HNSCC HC-PPI set was enriched for different rangements (Fig. 1, C to E). Despite the overall (84%) had not been previously reported in
Swaney et al., Science 374, eabf2911 (2021) 1 October 2021 2 of 13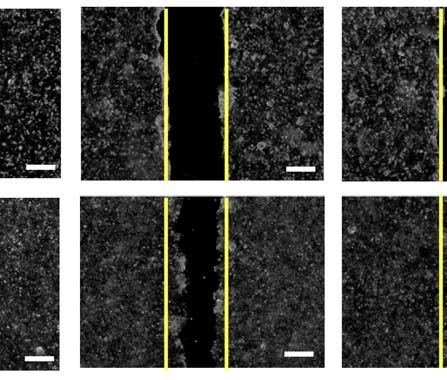
RES EARCH | R E S E A R C H A R T I C L E

public PPI databases (Fig. 1F). This high per-           the two cancer cell lines or the noncancer-         kinase (RTK) that recognizes FGF and medi-
centage of new interactions likely reflects the          ous cells.                                          ates cellular proliferation, survival, and differ-
fact that there are differences across cellular             Application of the DIS method to our HC-         entiation. CCDC88C, also known as Daple, is a
contexts for PPIs and that nearly all systematic         PPIs identified interactions enriched in HNSCC      228-kDa scaffolding protein with roles in me-
PPI analyses to date have been performed in              cells as well as those enriched in the HET-1A       diating both canonical and noncanonical Wnt
only HEK293T or HeLa cell lines (22–24). This            nontumorigenic background (Fig. 2, A and            signaling (51–54). Daple regulates Wnt through
large number of new interactions, presumably             B, and data S4). For example, the interaction       its interaction with the protein Disheveled (Dvl)
due to cell-type specificity, is also supported by       profile for cyclin D1 was substantially re-         (51) and it can also interact with RTKs, includ-
the observation that significant differences in          wired between HNSCC and HET-1A (Fig. 2C).           ing enhanced growth factor receptor (EGFR)
PPIs are observed even across the cell lines in          Cyclin D1, encoded by the CCND1 gene, is one        and ERBB2 [also known as human epidermal
this study (Fig. 1G), with only 24 HC-PPIs being         of the most commonly altered oncogenes in           growth factor receptor 2 (HER2)] (52), leading
conserved across all cell lines analyzed (Fig.           HNSCC, being amplified in 31% of HPV-negative       to its phosphorylation and dissociation from
1H and fig. S1D). Many well-studied cancer               HNSCC tumors (7). Cyclin D1 interacted with         Dvl (52). Upon this dissociation, Daple trans-
proteins are included in the new interactions.           the cyclin-dependent kinase inhibitors CDKN1A       locates from the cytoplasm to the plasma mem-
For example, in SCC-25 cells, we observed phys-          (p21) and CDKN1B (p27) in all three cell lines,     brane, where it functions as a GEF to activate
ical interactions between the proto-oncoprotein          but preferentially interacted with multiple         G proteins (Gai) and promote Akt signaling,
MYC and each of two DNA repair proteins,                 cyclin-dependent kinases (CDKs) only in             cell migration, and invasion (Fig. 3B) (55). We
PARP1 and TOP1. MYC has previously been                  HNSCC cells. This interaction preference was        detected the previously characterized ERBB2:
shown to regulate PARP1 activity (41). The               not unexpected because CCND1:CDK4/6 in-             Daple interaction (52) in CAL-33 cells, in ad-

                                                                                                                                                                  Downloaded from https://www.science.org at University of California San Diego on October 04, 2021
MYC:PARP1 interaction is supported by pre-               teractions are known to be essential for cell       dition to the FGFR3:Daple interaction which
vious studies reporting MYC:TOP1 (42) and                proliferation and thus can contribute to un-        we hypothesized may function to promote Gai
PARP1:TOP1 interactions (43).                            controlled cell cycle progression in cancer cells   activation in an FGFR3-dependent manner.
   Similarly, purification of tagged KEAP1 in            (49). Consistent with these findings, we ob-           To test this idea, we used a split luciferase
SCC-25 cells revealed an interaction with                served that the HNSCC cell lines had increased      assay (Gai NanoBiT) in which signal is lost
AJUBA, a scaffolding protein involved in the             growth rates compared with HET-1A (fig. S2A).       upon activation of Gai and dissociation from
regulation of numerous cellular processes, in-              We also found a previously uncharacterized       Gbg (Fig. 3C). As a control, we first transfected
cluding negative regulation of Wnt/b-catenin             interaction of cyclin D1 with components of         an engineered Designer Receptor Exclusive-
signaling (44). Until recently, AJUBA was not            the PI3K complex (PIK3CA and PIK3R1/2) ex-          ly Activated by Designer Drugs (DREADD)
associated with HNSCC; however, tumor ge-                clusively detected by AP-MS in HET-1A cells,        receptor and stimulated the resulting cell
nome analysis revealed that it is inactivated            an interaction that was further validated by a      population with the DREADD ligand clozapine-
in 7% of HPV-negative tumors (7). The KEAP1:             proximity ligation assay in HET-1A cells ex-        N-oxide (CNO). We observed robust Gai activa-
AJUBA interaction was further supported by               pressing FLAG-tagged CCND1 (fig. S2, B to D).       tion and corresponding loss of luciferase signal
our identification of a physical connection in           Finally, we evaluated the cellular localization     in both the CAL-33 and HET-1A cell lines (fig.
HET-1A cells between KEAP1 and SQSTM1, a                 of the interaction because cyclin D1 is usually     S4A). Next, we observed that in the CAL-33
known AJUBA interactor (45–48).                          associated with the nucleus, whereas PI3K is        cells, where we had detected the interaction
                                                         primarily associated with the cytoplasm and         between FGFR3 and Daple, FGF stimulation
A statistical approach to evaluate cell-type             plasma membrane. We observed the interac-           similarly induced Gai activation; however, no
specificity of interactions                              tion to be 80% cytoplasmic in localization (fig.    such activation occurred in HET-1A cells (Fig.
To identify interactions with relevance to can-          S2E), indicating a noncanonical localization of     3D). Using small interfering RNA (siRNA)
cer biology, we sought to compare PPIs across            cyclin D1, which has been observed previously       knockdowns, we found that Gai activation in
cell lines and prioritize those that are seem-           in certain cell types (50). The cell-type enrich-   CAL-33 cells was dependent on both FGFR3
ingly cancer enriched; i.e., those that exist in         ment of this particular interaction, along with     and Daple (Fig. 3, D and E, and fig. S4B). FGF
both CAL-33 and SCC-25, the two HNSCC can-               several others, is further supported by targeted    also rapidly induced ERK phosphorylation in
cer cell lines, but are absent in the HET-1A             proteomic analysis (fig. S3A).We also eval-         both CAL-33 and HET-1A cells, consistent
nontumorigenic cell line. However, a simple              uated the relationship between cell-type PPI        with canonical RTK signaling (fig. S4C). FGF-
overlap analysis of the sets of HC-PPIs iden-            enrichment and both bait and prey expression        mediated Gai activation in CAL-33 cells results
tified by each cell line does not faithfully rep-        levels (fig. S3, B to D). In general, we found      in downstream phosphorylation of p21-activated
resent whether a PPI is shared. For example, a           virtually no correlation between these factors,     protein kinase 1/2 (PAK1/2), an event not ob-
PPI might erroneously appear to be specific for          suggesting that a diversity of factors likely in-   served in HET-1A (Fig. 3F), and this increased
a single cell line when it passes the threshold          fluences PPI cell-type specificity.                 phosphorylation was dependent upon both
for HC-PPIs in that cell line (i.e., a true posi-                                                            FGFR3 and Daple (fig. S4, D and E). PAK1/2
tive) while falling slightly below the threshold         Identification of a new FGFR3:Daple                 activity is known to promote cell migration
(i.e., false negative) in a second. Accordingly,         interaction that regulates Gai-mediated             and invasion and is associated with aggressive
we developed a method for calculating dif-               migratory signaling                                 tumor behavior and poor patient prognosis in
ferential interaction scores (DISs) for each             To uncover cancer-enriched interactions, we         HNSCC (56). Thus, we also evaluated whether
PPI, with associated Bayesian false discov-              ranked PPIs by their DIS (Fig. 2D), focusing on     FGF stimulation promoted cell migration, and,
ery rates (BFDRs). This method is based on               those PPIs with greatest enrichment (DIS >          indeed, a statistically significant increase was
the SAINTexpress score (37), which reports               0.5) or depletion (DIS < –0.5) in the HNSCC         observed (fig. S4, F and G). The FGF-induced
on the probability of a PPI in a single cell             cell lines (Fig. 2E). This analysis prioritized a   migration was not blocked by mitomycin C
line given the AP-MS data. Here, quantitative            previously unknown interaction between fi-          treatment, suggesting that the effects of FGF
SAINTexpress probabilities were combined                 broblast growth factor receptor 3 (FGFR3)           promoted cell migration and were independent
across the three cell lines to generate the DIS          and CCDC88C, which was observed in both             of growth factor–stimulated proliferation.
(see the materials and methods), allowing for            CAL-33 and SCC-25 cells but not in HET-1A              Next, we evaluated whether this pathway
the stratification of PPIs that are enriched in          cells (Fig. 3A). FGFR3 is a receptor tyrosine       could be inhibited by the FGFR inhibitor

Swaney et al., Science 374, eabf2911 (2021)   1 October 2021                                                                                           3 of 13
RES EARCH | R E S E A R C H A R T I C L E
A From this study B
HNSCC HNSCC
depleted enriched
TP63
High IAS score 0.75
Differential interaction score
CDKN2A 1.0
Fraction of interactions
29 167 HNSCC
Bait Number of enriched
patients with 0.50 0.5
5 187
alterations
Prey IGF1R 0.0
KEAP1
0.25
E2F1 -0.5
HNSCC
CASP8 FGFR3 -1.0
depleted
0
NFE2L2
MAPK1
RHOA
CCND1
FBXW7
NFE2L2
TP53
E2F1
KEAP1
TRAF3
CUL3
CDKN2A
CASP8
FGFR3
TGFBR2
EGFR
NRAS
HRAS
PIK3CA
XPC
STAT3
IGF1R
RB1
TP53
STAT3
PIK3CA
PTEN NRAS CDK5 CDK6
RB1 C
HRAS
CDK4 BRCA2
CCND1
RHOA XPC
SOX2 EGFR
CDK2
ERBB2 PIK3CA
TGFBR2 FBXW7
FGFR1 CCND1
MAPK1 CDKN1C
PIK3R1
MYC HLA-A
Downloaded from https://www.science.org at University of California San Diego on October 04, 2021
CUL3
FADD CDKN1A
PIK3R2
CDKN1B
SAINTexpress score
TRAF3 CAL-33 SCC-25
From this study
0 1 0 1
HNSCC HNSCC
depleted enriched HET-1A
ND
High IAS score 0 1
RPS6KA2
D E MAPK1
LAMC2 ANKRD40
1.0 BRAF LAMB3 UHRF1BP1 FBXW7
MAP2K2 PNN
RIN2
n = 29 RRM1 SAP18
FAM111A
ARAF
Differential interaction score
0.5 NRAS PITPNB NDN
PXN SMC6
RGL2 HRAS
EIF5B
SOAT1 RGL3 TP53BP1 TP53 NUCKS1 MIER1
MTOR METTL3
0.0
ANXA11 AFDN SMTN RBL2
ANXA7 RBL1
FAM53C AKAP11
Differential SAMHD1 RB1 METTL14
interaction score
HNSCC TFG
-0.5 HNSCC CDKN2A E2F1 E2F4
depleted enriched KIAA0232 WDR55
-1.0 -0.5 0.0 0.5 1.0 PEBP1
RNH1
TRAF3 IDH2
ATIC FARP1 TMEM43
CYB5R3
-1.0 n = 73 WDR62
NFE2L2
DCAF7 ANXA6 REST STAT3 PEX19
0 200 400 600 800 KEAP1 SOS1
PPIs TBC1D2B
RBM12
FAM83B
SNRNP70 TSR1 NRDC
SEC16A ERBB3 EGFR
RANBP3 PACSIN2 (HER3) GRB2
XPC PDIA4 HEATR3
CCDC88C FGFR3 RBM5 UTP14A
MAP1B
RNF41 INSR (Daple) RHOA
THOC5 PIK3CA
IGF1R UBASH3B
GORASP2 PIK3R2 ERRFI1
DSG2 TGFBR2 RBX1 KLHL42 CHORDC1 CASP8 COL17A1 PIK3R1
CUL3 ACP1 CHERP
CDK5
IK MYO1C CALD1
SPOUT1 WDR1
From this study
Bait
21 89
CCND1
HNSCC HNSCC Number of
depleted enriched 5 119 patients with CDK4
Prey alterations
High IAS score
CDKN1C
CDK6
Fig. 2. DIS analysis of the HNSCC-enriched and -depleted interactome. and methods). (B) For baits with |DIS| > 0.5, the fraction of PPIs for that bait having
(A) Interactome of the union of all HC-PPIs detected across all cell lines. Edges are HNSCC-enriched PPIs with DIS > 0.5, or HNSCC-depleted DIS < –0.5. (C) CCND1
colored based on their DIS, with pink edges representing PPIs that are enriched in interactome. Here, the SAINTexpress score, used for calculation of the DIS, is
HNSCC (both SCC-25 and CAL-33) compared with HET-1A cells and teal lines displayed for each cell line within the prey node. ND, not detected. (D) DIS for the
representing PPIs that are depleted from HNSCC cell lines. IAS connections represent entire interactome represented in (A) ranked by DIS. (E) Subnetwork of the
physical protein-protein association derived from prior studies (76) (see the materials interactome of the HNSCC-enriched and -depleted interactions.
infigratinib. We found that infigratinib pre- observations may be more broadly applicable detected the FGFR3:Daple interaction had
vented PAK1/2 phosphorylation upon FGF in more cell types, we first looked at FGFR3 above average Daple expression (Fig. 3J).
stimulation (Fig. 3G and fig. S4H) and also and Daple expression in all upper airway and Stratification of cell lines by high and low Daple
prevented cell migration (Fig. 3, H and I) esophageal cell lines using DepMap (57). We expression revealed that cell lines with high
in CAL-33 cells. To determine whether these found that both cancer cell lines in which we Daple expression were more sensitive to a pan
Swaney et al., Science 374, eabf2911 (2021) 1 October 2021 4 of 13RES EARCH | R E S E A R C H A R T I C L E
A U2SURP
B RTKs C CNO
FGFR3 (EGF/EGFR) FGF
GPATCH11 Gi-DREADD
TRIP6
WIZ GOLGA3 SAMHD1 Plasma membrane FGFR3
RBMX
CCDC88C P P P P P P
SCYL2 EEA1 (Daple) Da G i G i
?? ple
GTP GDP Da
GTP
ple
GDP
ERBB2 G i
PFKFB2 Da
ple LgBiT
Dvl
Rac
FARP2 Dvl G i
FGFR3 TPR Split-luc
DHX15 PP Migration SmBiT
ZBED5 PAK
and invasion
JAK1 PFKFB3 RPL17
E siRNA siRNA
EPRS
EPB41
G H
FGFR3
Control
Control
ATG13
Daple
KIF11 AIMP2 ** *
2.0 * 60 ns
Percent scratch closure
From this study 37 41 Daple FGFR3
pPAK1/2 fold change
HNSCC HNSCC Bait 1.5 ns
Number of GAPDH GAPDH
depleted enriched patients with 40
31 77
Prey alterations
High IAS score 1.0
20
0.5
D CAL-33 HET-1A
0 0
G i1
Downloaded from https://www.science.org at University of California San Diego on October 04, 2021
G i1 Vehicle FGF FGFRi FGF and Vehicle FGF FGFRi FGF and
Vehicle FGF (10ng/mL) Vehicle FGF (10ng/mL) FGFRi FGFRi
Luminescence (fold/basal)
1.6
Luminescence (fold/basal)
1.6
I
siControl
1.4
siControl
1.4
Vehicle FGF FGFRi FGF and FGFRi
1.2 1.2
1.0 * 1.0
0 hr
ns
0.8 0.8
0 10 20 30 40 50 60 0 10 20 30 40 50 60
Time (min) Time (min)
CAL-33 CAL-33
G i1 G i1
Luminescence (fold/basal)
Luminescence (fold/basal)
1.6 Vehicle FGF (10ng/mL) 1.6
24 hr
Vehicle FGF (10ng/mL)
siFGFR3
1.4 1.4
siDAPLE
1.2 1.2
ns
ns
1.0 1.0
0.8
0 10 20 30 40 50 60
0.8 J K
0 10 20 30 40 50 60
Time (min) Time (min) 6 Low Daple expression
Daple expression (log2 TPM+1)
CAL-33 High Daple expression
F FGF stimulation (min) SCC-25
1.05
ns *
FGF stimulation (min) 4 Drug sensitivity (AUC)
0 5 10 30 60 0 5 10 30 60 1.00
pPAK1/2 pPAK1/2
HET-1A
0.95
CAL-33
2
PAK1 PAK1 Slope = 0.245
p-value = 0.005 0.90
PAK2 PAK2 0
0 2 4 6 8 0.85
FGFR3 expression (log2 TPM+1) FGFR1i FGFR1/2/3i
Fig. 3. An HNSCC-enriched FGFR3:Daple interaction mediates activation CAL-33 and HET-1A cells. (G) PAK1/2 autophosphorylation measured by
of cell migratory proteins. (A) Differential scoring analysis of the FGFR3 immunoblot analysis in CAL-33 cells stimulated with FGF (10 ng/ml) and/or
interactome highlighting CCDC88C (Daple) as an HNSCC-enriched interaction treated with a 0.5 mM concentration of the pan FGFR inhibitor infigratinib
partner to both FGFR3 and ERBB2 (HER2). (B) Activation of RTKs can disrupt (*P < 0.05 compared with the vehicle-treated group). (H and I) A vertical scratch
the interaction between Dvl and Daple, allowing Daple to function as a GEF for was introduced to fibronectin-plated CAL-33 cells and cells were stimulated
Gai. GTP binding causes dissociation of the G protein, leaving Gbg subunits with FGF (10 ng/ml) and/or treated with 0.5 mM infigratinib. Replicate scratch
free to activate migratory signaling through Rac and PAK. (C) NanoBiT closures were quantified [*P < 0.05, **P < 0.01 compared with the vehicle-
biosensor measures Gai activation through dissociation of the luciferase split treated group; (H)] and images were taken 0 and 24 hours after FGF stimulation
between Ga and Gbg. CNO mediates canonical GPCR signaling through the (I). Scale bar, 250 mm. (J) Daple and FGFR3 expression plotted for all upper
synthetic Gai-coupled DREADD receptor. FGF mediates HNSCC-specific airway and esophageal cell lines in DepMap (57), with the two cancer cell lines
signaling through FGFR3 and Daple. (D) Luminescence measured in CAL-33 used in this study highlighted in red. (K) Sensitivity of cell lines with high or
and HET-1A cells transfected with Gai NanoBiT and siRNA (control, FGFR3, or low Daple expression to either a FGFR1 inhibitor (sorafinib) or a FGFR1/2/3
Daple) and stimulated with FGF (10 ng/ml) (*P < 0.05 compared with the inhibitor (AZD4547) as quantified by area under the curve (AUC) (*P < 0.05).
vehicle-treated group). (E) Immunoblot analysis of CAL-33 cells subject to Cell lines were selected from (J), and for those with corresponding drug
siRNA knockdown. (F) PAK1/2 autophosphorylation measured by immunoblot sensitivity data, the top five Daple-expressing cells (High Daple) or the bottom
analysis over a time course of FGF stimulation (0, 5, 10, 30, and 60 min) in five Daple-expressing cells (Low Daple) were used.
Swaney et al., Science 374, eabf2911 (2021) 1 October 2021 5 of 13RES EARCH | R E S E A R C H A R T I C L E
A RTKs B C p100 ABD RBD C2 helical kinase domain
(e.g. EGFR, HER2/3)
p85 SH3 BH nSH2 iSH2 cSH2
R88Q * Domain
PTEN
E110Del * ABD
90 0
iSH2
PIP3
PIP2 K111N * C2
iSH2
K111E Helical ABD
P V344G Kinase
K111 G1007 K111
Mutants analyzed
p85 G363A Inter-domain
R88 G363 E726 V344
Akt PIK3CA E453K * * Oncogenic
E542K * E726
C2
E545K *
mTORC1
E545G
* H1074
E726K
C971R
G1007R RBD
helical
C971
S6K M1043V * kinase
E545
H1047L
* C971
nSH2 nSH2
H1047R
* H1047 M1043
Cell growth and 0 10 20 30 E542
protein synthesis Number of mutations in HNSCC tumors
ERBB3 (HER3)
D PIK3CA interaction partners
PIK3CA (Bait)
DYNC1LI1
PPP2R1B
SH3GLB1
PLEKHA5
DNAJB14
PPP1R10
AFAP1L2
MAGED1
PIP5K1C
POLR2G
ARL6IP4
UBE2G2
Domain
MRPL38
PPP6R1
SEC16A
RAB11B
Downloaded from https://www.science.org at University of California San Diego on October 04, 2021
ZNF326
ELAVL1
ERLIN2
IL1RAP
DOCK7
PIK3R2
PIK3R1
PIK3R3
MAP1B
ELMO1
CCNT1
UNC50
CDC23
STRN4
ITPRIP
HCLS1
STUB1
IFITM3
RPAP3
SEPT6
UTP11
COG4
YIPF3
RND3
UBR4
GAB1
CAP2
PLAU
SLTM
FUT8
EXT2
COIL
IRS1
IRF7
SON
DAP
NF2
YY1
F10
Mutants
H1047R
C971R
H1047L
G363A
G1007R
E726K
E545K
E542K
E545G
E110DEL
V344G
K111E
M1043V
E453K
K111N
R88Q
Not quantified
-5.00 0.00 5.00
Change in prey abundance
log2 (Mutant/WT)
E F G HER2 HER3
E81 C2 NRG1
iSH2 plasma membrane
Ras Ras
I459 GTP GTP
YP YP
P YxxM
P YxxM Grb2 PYxxM
C604 G1007 P YxxM SOS
P YxxM
P YxxM
PYxxM
Active PI3K
P YxxM
F1016 PI3K mutation enables
Active PI3K
HER3-independent
Y641 HER3 membrane localization
interaction (e.g. H1047R)
L1006 p85
Inactive
ABD p110a
PI3K auto- PI3K
inhibition is
nSH2
inter-domain helical kinase compromised by cSH2
PIK3CA mutation
K111
Fig. 4. PIK3CA mutant interactome. (A) Overview of the PIK3CA-signaling structure of PI3K [Protein Data Bank (PDB) identifier: 4L23] (89) by
pathway, which is often stimulated by RTKs that interact with PIK3CA to highlighting the mutated residues as red spheres. (D) Quantification of PPIs
stimulate RAS/Raf– or Akt/mTORC1–mediated downstream signaling. for all PIK3CA HC-PPIs detected in the SCC-25 cell line (all cell lines are
(B) Analyzed PIK3CA mutants and their frequency in HNSCC tumors from displayed in fig. S5). (E) Diagram of a magnified view of PI3K illustrating a
TCGA. Asterisk (*) denotes mutations annotated as oncogenic in OncoKB salt bridge formed between K11 and E81 (PDB: 4L23). (F) Magnified view
(88). Graph bars corresponding to each mutation are color coded to indicate depicting interactions made by G1007 in PI3K (PDB: 4L23). (G) Diagram
their localization within the p110a domain (as indicated in the legend in the of different mutation-induced PI3K activation mechanisms and their
top right corner). (C) Selected PIK3CA mutations were mapped on the respective HER3-binding preferences.
Swaney et al., Science 374, eabf2911 (2021) 1 October 2021 6 of 13RES EARCH | R E S E A R C H A R T I C L E
A C D
NRG1 mRNA expression (RSEM)
15 400
CAL-27 xenograft with inducible PIK3CA over-expression:
PIK3CA mutation frequency
WT, E542K, E545K, H1047R H1047R
(helical domain / kinase)
control
300
10 H1047R
CDX3379
200 Control HER3 inhibitor
(PBS) (CDX3379) WT
5 control
100 Control CDX3379
WT
CDX3379
600 600
0 0 H1047R WT
E542K
Tumor volume (mm3)
Tumor volume (mm3)
CESC BLCA LUSC HNSC COAD ESCA UCEC STAD BRCA control
TCGA PanCancer Atlas studies ns ****
400 400 E542K
B CDX3379
SCC-25 Cells r: 0.75
24
E545K
E545K 200 200 control
HER3 (AP-MS: Log2 HER3 abundance)
Association of PIK3CA mutants with
E542K E545K
22
CDX3379
0 0
K111E 0 5 10 15 0 5 10 15
Days
20
Days E
G1007R 600 600 2.0
Tumor volume (mm3)
E542K E545K **** ns
pT308-Akt / Akt
Tumor volume (mm3)
G363A 1.5
E543K
18 E726K
400 400
* *
Downloaded from https://www.science.org at University of California San Diego on October 04, 2021
R88Q C971R ****
1.0
M1043V H1047R
16
200 200 0.5
WT
14 0.0
6.0 7.5 9.0 10.5 12.0
0 0 CDX3379 - + - + - +
0 5 10 15 0 5 10 15 WT E545K H1047R
Days Days
Fig. 5. In vivo targeting of HER3 in the context of different PIK3CA induce PIK3CA expression. When tumor volumes reached ~100 mm3, mice
mutants. (A) Bar chart representing the ratio of helical domain (E545 and were treated with vehicle (PBS) or CDX3379 (10 mg/kg, twice a week) for
E542) mutations compared with kinase domain mutations (H1047) across ~15 days, as indicated. Shown are tumor growth curves (C) and representative
TCGA PanCancer Altas studies represented in cBioPortal (90). Line graph tumor images (D), (****P < 0.0001 compared with the control-treated
shows the mRNA expression (RSEM) for NRG1 across the same studies. group). (E) Quantification of immunoblot analysis of signaling events in
(B) Correlation of Log2 HER3 interaction levels from AP-MS experiments the same CAL-27 cells in vitro. PIK3CA variant expression was induced by
and Log2 HER3 Y1197 phosphorylation levels from immunoblot analysis. doxycycline (1 mg/ml in culture medium), cells were treated with CDX3379
All values are normalized by FLAG-PIK3CA levels in their respective (1mg/ml for 1 hour), and lysates were analyzed by immunoblotting as
experiments. Mutations marked in red were selected for in vivo experiments. indicated. Densitometry analysis of Western blots was performed using
(C and D) CAL-27 cells expressing inducible PIK3CA variants were ImageJ. Data are represented as mean ± SEM, with n = 3 in each group.
transplanted into athymic nude mice. Mice were fed with doxycycline to (*P < 0.05 compared with the control-treated group).
FGFR inhibitor (FGFR1/2/3) than those with intracellular small GTPases (e.g., RAS pro- plasma membrane to enable PIP2 phospho-
low Daple expression (Fig. 3K). There was no teins) as well as receptor kinases (e.g., EGFR) rylation. The helical domain mutants (E545K,
difference in sensitivity to inhibition of FGFR1 to regulate downstream signaling primarily E545G, and E542K) are poised to disrupt the
among cells with high and low Daple expres- through the Akt/mTOR pathway (Fig. 4A). interaction of p110a with its autoinhibitory
sion, suggesting that the inhibition of FGFR3 We selected 16 different PIK3CA mutations p85 subunits, making the p85 nSH2 domain
may be particularly important for cells with observed in HNSCC patients and quantitatively more readily available for interaction with
high Daple expression. In total, these results assessed their effects on p110a interaction part- phosphorylated YxxM motifs. Outside of this
support a mechanism for regulating Gai activ- ners (Fig. 4B, fig. S5, and data S5). These muta- primary cluster of mutations, we also observed
ity through FGFR3 and Daple, resulting in tions were distributed across multiple domains other mutation sites (e.g., K111E and G1007R)
increased PAK1/2 activation and cell migra- within the p110a protein (Fig. 4C). with a strong increase in HER3 binding. In
tion signaling that can be effectively inhibited Examining the PPI profiles of WT PIK3CA these cases also, mutations are expected to
using FGFR inhibitors. and the corresponding mutants in SCC-25 cells compromise the p85-imposed inhibition of the
revealed a high similarity in interaction pat- p110a catalytic module, either by disruption
Quantitative analysis of the mutant terns for five of the PIK3CA mutants, E110DEL, of the ABD domain relative to the inhibitory
PIK3CA interactome V344G, E542K, E545G, and E545K (Fig. 4D), iSH2 module of p85 (K111E; Fig. 4E) or by dis-
PI3K is a multiprotein kinase complex con- driven by a strong increase in interaction of ruption of a hydrophobic cluster coordinat-
sisting of a p110alpha (p110a) catalytic subunit these mutants with three proteins, ERBB3 ing amino acids from multiple p110a domains
that is encoded by the PIK3CA gene and a (HER3), GAB1, and IRS1. All of these prey (G1007R; Fig. 4F).
p85-regulatory subunit. Engagement of the proteins contain multiple YxxM motifs, repre- HNSCC tumors display a high preference
SH2 domains of p85 with phosphorylated YxxM senting consensus binding sites for the two for PIK3CA helical mutations compared with
motifs is essential for PI3K signaling by releas- SH2 domains (nSH2 and cSH2) located in the kinase domain mutations (Fig. 5A). Our results
ing p110a autoinhibition and mediating recruit- PI3K p85-regulatory subunit (59). The inter- suggest that PIK3CA mutations that disrupt
ment of PI3K to the plasma membrane (58). action between phosphorylated tyrosine YxxM the autoinhibition of PI3K (e.g., helical domain
Upon activation, PI3K becomes a potent medi- motif and the SH2 domain serves to release mutations) may rely on upstream signals that
ator of cellular signaling, interacting with both the PIK3CA autoinhibition and recruit it to the present multiple phosphorylated YxxM sites for
Swaney et al., Science 374, eabf2911 (2021) 1 October 2021 7 of 13RES EARCH | R E S E A R C H A R T I C L E
signaling (Fig. 4G). In HNSCC, this signal is hibited tumor growth in vivo, in vitro treat- by demonstrating that FGF stimulation can ac-
likely to be an activated HER3 receptor. In ment resulted in significant down-regulation tivate Gai in a Daple- and FGFR3-dependent
support of this synergy, HNSCC tumors of phosphorylated Akt levels, whereas no manner, which results in activation of PAK1/2
have the highest mRNA levels for the HER3- such decrease was observed for the CDX3379- kinases and cell motility. PAK1 expression is
activating ligand neuregulin-1 (NRG1) across resistant H1047R-expressing cells (Fig. 5E and highly correlated with aggressive tumor behav-
TCGA PanCancer studies with PIK3CA muta- fig. S6F). ior and poor patient prognosis in HNSCC
tions (Fig. 5A). In vitro analysis of the SCC-25 (56, 68). Our work becomes increasingly im-
mutant PIK3CA cell lines also demonstrated a Discussion portant as FGFR inhibitors progress toward
strong positive correlation between the inter- To truly understand the complexities of the the clinical setting. Phase II clinical trials with
action of individual PIK3CA mutants with cell, it has been hypothesized that one would rogaratinib, an FGFR inhibitor, are under-
HER3, as measured by AP-MS, and HER3 need a list of the protein machines, or com- way for HNSCC patients with FGFR1/2/3
activation, as measured by immunoblotting plexes, that perform all of its functions (61). mRNA overexpression (
of Y1197 phosphorylation (r = 0.75; Fig. 5B Obtaining such a map would be instrumental, www.clinicaltrials.gov NCT03088059) after
and fig. S6A). Furthermore, the increased not only for understanding how a healthy phase I trials demonstrated a 67% objective
interaction between helical domain PIK3CA cell functions, but also for understanding how response rate for solid tumors with FGFR
mutants and HER3 was conserved across mutations affect these machines and the path- mRNA overexpression (69). Additionally, a
several additional cell lines tested (fig. S6, B to ways in which they function (62) in disease complete response was observed in a meta-
D). By contrast, kinase domain mutations are states such as cancer. Using this premise as a static HNSCC tumor with multiple FGFR
known to innately associate with the mem- motivation, in this study, we examined the amplifications, including FGFR3, when
Downloaded from https://www.science.org at University of California San Diego on October 04, 2021
brane and therefore to be less dependent on physical landscape of PPIs targeting genes treated with a pan-FGFR inhibitor (70). Fur-
other proteins for membrane recruitment genetically linked to HNSCC, revealing hundreds ther work may determine whether the FGFR3:
(60). Indeed, we observed low levels of HER3 of new PPIs. We observed that these inter- Daple interaction results in frequent coupling of
interaction and phosphorylation (Figs. 4D and actions were highly specific to the cell line of FGFR and PAK1/2 activity in HNSCC patients
5B and fig. S6, B to D) with the H1047R mutant, study and that mutations in key cancer genes and if other cancer types also exploit this
suggesting that it might drive oncogenesis in affected PPI interactions in ways that can signaling mechanism. More direct studies are
a HER3-independent fashion. We therefore provide important mechanistic insight and necessary to determine the extent to which
hypothesized that HNSCC tumors harboring inform response to targeted treatments. In FGFR and PAK1/2 activity contribute to clin-
PIK3CA helical domain mutations may be support of previous observations (25) and ical outcomes, and PAK1/2 activity could serve
selectively sensitive to HER3 inhibitor treat- our accompanying manuscript (63), these as an additional biomarker of patients ben-
ment, whereas the kinase domain mutation results suggest the exciting premise that there efiting from FGFR-targeted therapy.
(H1047R) may confer resistance to HER3 in- remains a vast network of PPIs left to discover Our results pertaining to PIK3CA also high-
hibition in vivo. beyond the thousands annotated from HEK293T light that oncogenic mechanisms of individual
To test this hypothesis, we generated iso- and HeLa cells (22–24). We anticipate that mutations in cancer genes can be reflected
genic CAL-27 cell lines overexpressing WT, developments in high-throughput protein in their differences in the corresponding PPIs
E542K, E545K, or H1047R mutant isoforms complex determination, such as coelution (64), and that these differences can be exploited
of PIK3CA. CAL-27 cells were used because proximity labeling (65, 66), and cross-linking for therapeutic benefit. We postulate that
they are diploid for WT PIK3CA. We injected MS (67), will enable the rapid advancement of the mechanism for the selectivity that we
these engineered lines into the flanks of athymic systematic PPI mapping in a diverse array of uncovered using PIK3CA mutants lies in the
nude mice (see the materials and methods) and cancer cell contexts. dependence on HER3 signaling that the
then treated the mice with either saline (control) An important goal of cancer therapy is to helical domain mutations maintain. These
or the HER3 monoclonal inhibitor CDX3379 identify drug targets that are applicable across features of PI3K mutants seemingly contra-
over the course of 15 days. Tumor size was many patients and that achieve high speci- dict previous studies showing that addition
monitored, and, as expected, tumors harboring ficity for cancer cells among a heterogeneous of the phosphorylated YxxM motif–containing
the H1047R mutant were resistant to CDX3379. tumor cell population. In the context of PPIs, peptides increases the in vitro catalytic activity
Unexpectedly, both the helical domain mutants this goal requires moving beyond simply of the H1047R mutant but not that of the
E542K and E545K and WT PIK3CA were sen- cataloging PPIs toward robust comparative helical domain mutants (71). However, we
sitive to CDX3379 treatment, resulting in almost analysis of PPIs across cellular contexts. For hypothesize that phosphorylated RTK tails are
complete inhibition of tumor growth (Fig. 5, this purpose, we have created and demon- necessary, not for activation of the helical
C and D, and fig. S6E). From these results, we strated the value of a DIS to statistically com- domain PI3K mutants, but for their recruitment
hypothesize that even in the presence of WT pare PPIs across contexts, which will aid in to the plasma membrane, where they need to
PIK3CA, low levels of HER3 binding and HER3 understanding the underlying biology behind, interact with RasGTP for full activation (60).
phosphorylation are sufficient and represent not just HNSCC but also that of other cancers This strong dependence renders cells with such
an essential mechanism for the recruitment and disease in general, as evidenced by our mutations sensitive to HER3 inhibition. We also
of PIK3CA to the membrane and subsequent application of this approach for breast cancer identified a number of other PI3K mutants
PI3K activation. These results underscore that (63). Although the DIS revealed a subset of that share HER3-binding features with the
only HNSCC patients carrying PIK3CA variants interactions to be cancer enriched in the three helical domain mutants, and we predict that
that are still dependent on association with cell lines used in our study, future analysis in their oncogenic potential will also be HER3
HER3 (WT and helical domain mutants) will additional cell lines would be beneficial to dependent (Fig. 4G). Our data also indicate
likely benefit from HER3-targeted therapeutics. further support these observations. that upstream PI3K activators with a high den-
To further investigate the mechanisms re- One interaction uncovered by our DIS ap- sity of tyrosine phosphorylation sites, represented
gulating these in vivo phenotypes, we assessed proach was a connection between the FGFR3 by the YxxM consensus motifs, such as HER3 and
the levels of phosphorylated Akt, a downstream receptor tyrosine kinase and the GEF Daple, IRS1/2, will be particularly efficient in synergizing
mediator of PI3K signaling, in CAL-27 cells. which was seen exclusively in the cancer cell with the PI3K helical domain mutants.
For mutants in which CDX3379 treatment in- lines. Our findings build upon previous work
Swaney et al., Science 374, eabf2911 (2021) 1 October 2021 8 of 13RES EARCH | R E S E A R C H A R T I C L E
Clinical inhibition of HER3 in HNSCC Cell culture, lentivirus production, and stable clarified by centrifugation at 13,000g for 15 min
patients is currently being pursued in phase II cell line generation at 4°C. A 30-ml lysate aliquot was saved for future
clinical trials with the monoclonal antibody HEK293T (ATCC, CRL-3216) and CAL-33 were bicinchoninic acid assay and Western blot.
CDX3379 ( maintained in Dulbecco’s modified Eagle’s For FLAG purification, 25 ml of bead slurry
www.clinicaltrials.gov identifier medium (DMEM; Corning) supplemented with (Anti-Flag M2 Magnetic Beads; Sigma-Aldrich)
NCT03254927) (72). This drug locks the 10% fetal bovine serum (FBS; Invitrogen) and was washed twice with 1 ml of ice-cold wash
HER3 extracellular domain in an inactive 1% penicillin-streptomycin (Corning). HET-1A buffer (50 mM Tris, pH 7.4, 150 mM NaCl,
configuration (73) and prevents not only was maintained in broncho-epithelial cell 1 mM EDTA), and all of the remaining lysate
dimerization with coactivating RTKs (e.g., grown medium (Lonza), consisting of broncho- was incubated with the anti-FLAG beads at
HER2) but also activation of HER3 by epithelial basal medium with the additives 4°C with rotation for 2 hours. After incuba-
neuregulins (e.g., NRG1). These properties of the Bullet kit except GA-1000 (gentamycin- tion, flow-through was removed and beads
make HER3 a particularly promising target amphotericin B mix). SCC-25 was maintained were washed once with 500 ml of wash buffer
because NRG1 is expressed at higher levels in DMEM/F12 (Corning) with 10% FBS (Invi- with 0.05% NP40 and twice with 1 ml of wash
in HNSCC than in any other tumor type (74). trogen), 1% penicillin-streptomycin (Corning), buffer (no NP40). Bound proteins were eluted
The results presented here further suggest and 400 ng/ml hydrocortisone (Sigma-Aldrich). by incubating beads with 15 ml of 100 ug/ml
that HER3 inhibitors present an opportunity HET-1A cells were obtained from American 3xFLAG peptide in 0.05% RapiGest in wash
to potently target specific PIK3CA mutant Type Culture Collection and SCC-25 was ob- buffer for 15 min at room temperature with
tumors, a utility that has not been evaluated tained from Thomas Carey (University of shaking. Supernatants were removed and elu-
previously. This is important because PIK3CA Michigan). CAL-33 cells were provided by tion was repeated. Eluates were combined and
10 ml of 8 M urea, 250 mM Tris, 5 mM DTT
Downloaded from https://www.science.org at University of California San Diego on October 04, 2021
is one of the most commonly mutated G. Milano (University of Nice, Nice, France).
oncogenes in HNSCC (7), but direct targeting All cells were maintained in a humidified 37°C (final concentration ~1.7 M urea, 50 mM Tris,
of PIK3CA in the clinical setting has been incubator with 5% CO2. Stably transduced and 1 mM DTT) was added to give a final total
limited by toxicity (75), likely because of its HET-1A, SCC-25, and CAL-33 cell lines were volume of ~45 ml. Samples were incubated at
pleiotropic roles in cancer and maintenance of maintained in puromycin (2, 2.5, and 0.7 mg/ml, 60°C for 15 min and allowed to cool to room
normal cell states. In light of our findings, respectively). Bait expression was induced temperature. IODO was added to a final con-
patient preselection, such as exclusion of PIK3CA by 1 mg/ml doxycycline for 40 hours. All cell centration of 3 mM and the mixture was in-
H1047R mutation carriers and inclusion of those lines were authenticated by the University of cubated at room temperature for 45 min in the
harboring helical domain mutants, may be a California–Berkeley Cell Culture Facility. dark. DTT was added to a final concentration
valuable consideration as future phases of Lentivirus was produced for each bait by of 3 mM before adding 1 mg of sequencing-
clinical trials proceed. packaging 5 mg bait vector, 3.33 mg of Gag- grade trypsin (Promega) and incubating at
In summary, this study and the accom- Pol-Tat-Rev packaging vector (pJH045 from 37°C overnight. Samples were acidified to 0.5%
panying papers in this issue (63, 76) outline a J. Hultquist), 1.66 mg of VSV-G packaging trifluoroacetic acid (TFA, pH < 2) with 10% TFA
framework for elucidating genetic complexity vector (pJH046 from J. Hultquist) with 30 ml stock and incubated for 30 min before desalting
through multidimensional maps of cancer cell of PolyJet (SignaGen). After incubating at room on C18 stage tip (Rainin).
biology. They also demonstrate that such maps temperature for 25 min, DNA complexes were
can reveal mechanisms of cancer pathogenesis, MS data acquisition and analysis
added dropwise to HEK293T cells (15-cm plate,
instruct the selection of therapeutic targets, ~80% confluency). Lentivirus-containing super- For AP-MS experiments, samples were resus-
and inform which point mutations in the natant was collected after 72 hours and filtered pended in 15 ml of MS loading buffer (4%
tumor are most likely to respond to treatment through a 0.45-mm polyvinylidene difluoride formic acid, 2% acetonitrile) and 2 ml was
(26, 77). Therefore, we anticipate that the gen- (PVDF) filter. Lentivirus particles were pre- separated by a reversed-phase gradient over
eration and incorporation of cancer-specific cipitated with PEG-6000 (8.5% final) and NaCl a nanoflow 75-mm internal diameter × 25-cm
physical and functional networks may rep- (0.3 M final) at 4°C for 4 to 8 hours. Particles long picotip column packed with 1.9 mM C18
resent a critical component to interpret and were pelleted by centrifugation at 2851g for particles (Dr. Maisch). Peptides were directly
predict cancer biology and its clinical outcomes. 20 min at 4°C and resuspended in Dulbecco’s injected over the course of a 75-min acquisi-
Finally, the framework described here applies PBS for a final volume of ~800 to 1000 ml. tion into a Q-Exactive Plus mass spectrometer
not only to cancer but also to many other Stable cell lines were generated by trans- (ThermoFisher Scientific) or over the course
genetically defined disease areas as well. ducing a 10-cm plate (~80% confluency) with of a 90-min acquisition into an Orbitrap Elite
200 ml of precipitated lentivirus for 24 hours mass spectrometer. Raw MS data were searched
Materials and Methods against the Uniprot canonical isoforms of the
before selecting with puromycin for a mini-
Reagents and resources human proteome (downloaded 21 March 2018)
mum of 2 days.
Catalog numbers for all key reagents and re- using the default settings in MaxQuant (version
sources are listed in table S8. Affinity purification 1.6.2.10), with a match-between-runs enabled
One 10-cm plate of cells (~80% confluency) (78). Peptides and proteins were filtered to 1%
Bait cloning FDR in MaxQuant, and identified proteins
was washed with ice-cold Dulbecco’s PBS and
Baits were cloned using the Gateway Cloning lysed with 300 ml of ice-cold lysis buffer con- were then subjected to PPI scoring. To quantify
System (Life Technologies) into a doxycycline- taining 50 mM Tris, pH 7.4, 150 mM NaCl, changes in interactions between WT and mutant
inducible N-term or C-term 3xFLAG-Tagged 1 mM EDTA, 0.5% NP40, 1 mM dithiothreitol baits, we used a label-free quantification ap-
vector modified to be Gateway compatible from (DTT), 1× protease inhibitor cocktail (Roche, proach in which statistical analysis was per-
the pLVX-Puro vector (Clontech) by the Krogan complete mini-EDTA free), and 125 U of formed using MSstats (79) from within the
laboratory (see data S6). Point mutant baits benzonase/ml. Lysates were flash-frozen artMS Bioconductor R package. All raw data
were cloned through site-directed mutagenesis. on dry ice for 5 to 10 min, followed by a 30 to files and search results are available from the
All expression vectors were sequence validated 45 s thaw in 37°C water bath with agitation Pride partner ProteomeXchange repository
(Genewiz). and rotation at 4°C for 15 min. Lysate was under the PXD019469 identifier (80, 81).
Swaney et al., Science 374, eabf2911 (2021) 1 October 2021 9 of 13You can also read