On the tuning of plateaus in atmospheric and oceanic 14C records to derive calendar chronologies of deep-sea cores and records of 14C marine ...
←
→
Page content transcription
If your browser does not render page correctly, please read the page content below
Clim. Past, 17, 1701–1725, 2021
https://doi.org/10.5194/cp-17-1701-2021
© Author(s) 2021. This work is distributed under
the Creative Commons Attribution 4.0 License.

On the tuning of plateaus in atmospheric and oceanic 14 C
records to derive calendar chronologies of deep-sea cores and
records of 14 C marine reservoir age changes
Edouard Bard1 and Timothy J. Heaton2
1 CEREGE,   Aix-Marseille University, CNRS, IRD, INRAE, Collège de France,
Technopôle de l’Arbois, Aix-en-Provence, France
2 School of Mathematics and Statistics, University of Sheffield, Sheffield S3 7RH, UK

Correspondence: Edouard Bard (bard@cerege.fr)

Received: 23 December 2020 – Discussion started: 8 January 2021
Revised: 16 June 2021 – Accepted: 8 July 2021 – Published: 16 August 2021

Abstract. We assess the methodology of the so-called 14 C         1   Introduction
plateau tuning (PT) technique used to date marine sediment
records and determine 14 C marine reservoir ages (MRAs) as
recently reviewed by Sarnthein et al. (2020).                     Sarnthein et al. (2020) review the results of a technique based
   The main identified problems are linked to the assump-         on tuning hypothesized 14 C age plateaus that they inferred in
tion of constant MRA during 14 C age plateaus; the lack of        deep-sea sediment cores with those that they have proposed
consideration of foraminifera abundance changes coupled to        as existing in atmospheric radiocarbon archives, notably us-
bioturbation that can create spurious plateaus in marine sedi-    ing the Lake Suigetsu record (Bronk Ramsey et al., 2012,
ments; the assumption that plateaus have the same shapes and      2020). The proposed outcomes of the so-called “plateau tun-
durations in atmospheric and oceanic records; the implica-        ing” (PT) are to establish accurate and precise calendar age
tion that atmospheric 14 C / 12 C peaked instantaneously from     scales of the marine sediments and, at the same time, to de-
one plateau to the next; that the 14 C plateaus represent 82 %    termine the 14 C marine reservoir ages (MRAs) at the sea sur-
of the total time spent between 14 000 and 29 000 cal yr BP,      face (for 14 C measured on planktonic foraminifera) and ven-
whereas during the remaining 18 % of the time, the radio-         tilation ages of deeper water masses (using 14 C measured on
carbon clock was running almost 5 times faster than the ra-       benthic foraminifera).
dioactive decay; that the sparsity, combined with the level of       Sarnthein et al. (2020) review the results obtained by PT
analytical uncertainties and additional noise, in both atmo-      published over the last 13 years by the Kiel group (Sarnthein
spheric and marine data do not currently allow one to reli-       et al., 2007, 2011, 2013, 2015; Balmer et al., 2016; Sarnthein
ably or robustly identify plateaus (should they exist) beyond     and Werner, 2017; Balmer and Sarnthein, 2018; Küssner et
15 000 cal yr BP; and that the determination and identifica-      al., 2018). By comparing the records from many locations,
tion of plateaus in the deep-sea cores is reliant upon signifi-   the authors conclude in Sect. 2.2 that the 14 C age plateaus
cant changes in sedimentation rate within those marine sedi-      beyond 15 000 cal yr BP “show little coherence” with inde-
ments which are, a priori, unknown and are not verified with      pendent 10 Be records based on polar ice cores and therefore
an independent method.                                            that the cause of these 14 C anomalies may not be linked to
   The concerns we raise are supported and strengthened with      cosmogenic production changes.
carbon cycle box model experiments and statistical simula-           The authors thus propose that extremely large and variable
tions of pseudo-atmospheric and pseudo-marine records, al-        ventilation ages may be the causes of these 14 C age plateaus,
lowing us to question the ability to identify and tune 14 C age   constituting the fingerprint of abrupt reversals of deep ocean
plateaus in the context of noisy and sparse data.                 circulation and abrupt release or drawdown of CO2 into or
                                                                  from the atmosphere. Nevertheless, the authors admit that

Published by Copernicus Publications on behalf of the European Geosciences Union.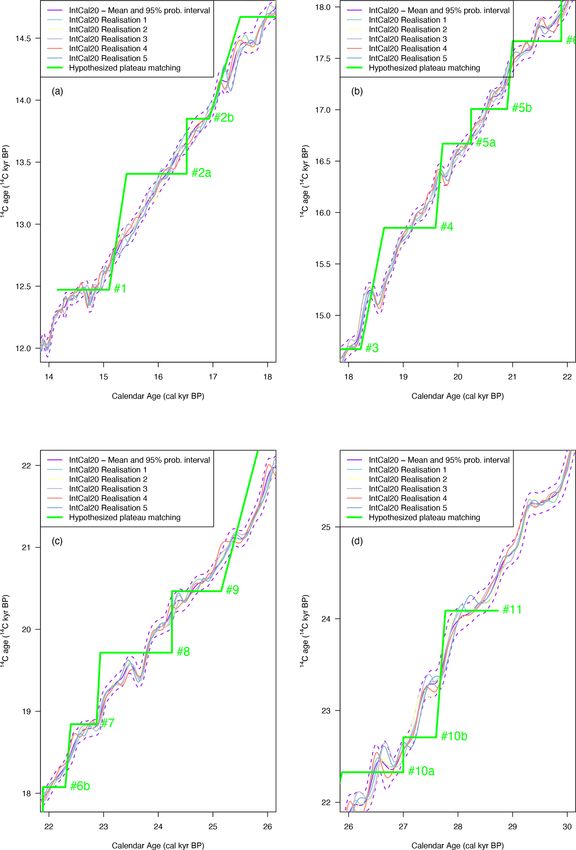
1702                                             E. Bard and T. J. Heaton: Plateaus in atmospheric and oceanic 14 C records

“ocean models still poorly reproduce” their reconstruction of      one cannot reliably PT if one cannot reliably identify and de-
deep ocean circulation and carbon cycle changes. They claim        fine an individual 14 C plateau. A suite of plateaus does not
that this mismatch is due to model deficiencies in spatial res-    necessarily add strength – in fact it potentially makes it more
olution and tuning with reference data.                            challenging should one miss or simply mismatch plateaus in
   We have strong reservations about the appropriateness of        either the atmospheric target or the sediment record. More-
the PT technique and consequently also the reliability of the      over, the possible existence of spurious plateaus further com-
results obtained in Sarnthein et al. (2020). The PT technique,     plicates PT (see more below).
proposed and used by the same authors from Kiel for more
than 13 years, has not been checked and replicated indepen-        2.2   PT and marine reservoir ages
dently by other groups. Outside the Kiel group, only Um-
ling and Thunell (2017) have used the PT technique, but they       In addition to determining the calendar chronology of ocean
found rather puzzling results (see more in Sect. 2.4). PT has      sediments, PT is also used to calculate, at the same time,
been presented on several occasions during International Ra-       a variable offset with the atmospheric 14 C curve. The off-
diocarbon Conferences and workshops of the IntCal group,           set for planktonic foraminifera is often very large (1000–
but it has never been adopted as a viable technique to recon-      2000 14 C yr) and is interpreted as being due to 14 C reservoir
struct past 14 C variations (Reimer et al., 2020; Heaton et al.,   age changes at the sea surface. However, in order to per-
2020a; and previous IntCal iterations by Reimer et al., 2009,      form PT the authors are required to assume that the marine
2013).                                                             14 C reservoir age (MRA) is strictly constant during the age

   The review paper by Sarnthein et al. (2020) only compiles       plateaus, which represent 82 % of the total time spent be-
previous papers by the same group. The risk is to mislead          tween 14 000 and 29 000 cal yr BP. This assumption of reser-
readers into thinking that the PT technique is now firmly es-      voir age stability during 14 C age plateaus is antithetical with
tablished. Indeed, the compiled records based on PT lead           the conclusion that these plateaus are linked to carbon cycle
to perplexing outcomes (no coherence with either produc-           changes. Such significant carbon cycle changes would have
tion changes or with ocean modeling results). This failure         left their imprint in 14 C records (Bard, 1988), maybe even as
is linked to the inherent pitfalls listed below, which are not     14 C age plateaus solely recorded in marine sediments. Hence,

treated adequately in Sarnthein et al. (2020) or in former pa-     the 14 C structures identified by Sarnthein et al. (2020) in
pers by the same group.                                            pelagic sediments are severely under-constrained in 14 C and
   With this extended comment, our objective is to expose          calendar ages.
and discuss openly some of the inherent problems linked to            Indeed, changes in marine 14 C reservoir age may either
PT. We split our discussion into two sections. Firstly, we         mask (or create false) 14 C age plateaus in the marine core,
present our concerns from a geoscientific perspective. Sec-        causing issues with tuning to the atmospheric plateaus. On
ondly, we provide our statistical concerns with the proposed       the one hand, a decrease in MRA coinciding with an at-
PT method and provide illustrative examples that highlight         mospheric 14 C age plateau (i.e., a decrease in atmospheric
its intrinsic difficulties.                                        114 C) may create a set of marine 14 C observations lacking
                                                                   any plateau. On the other hand, an increase in MRA may
                                                                   make a period where the atmospheric 14 C record does not
2     Paleoclimatic and paleoceanographic perspective
                                                                   plateau (e.g., constant atmospheric 114 C) appear as a plateau
2.1    PT and 14 C wiggle matching
                                                                   in marine 14 C observations. In both of these instances, PT
                                                                   will fail. Unless MRAs only change at the boundary times of
The PT principle is reminiscent of the “14 C wiggle match-         their chosen plateau, identifying whether a potential plateau
ing technique” used to refine the dating of large pieces           in a set of marine observations should be tuned to an atmo-
of wood with multiple 14 C analyses over a tree-ring se-           spheric plateau is potentially confounded by the very changes
quence of at least a few decades (Bronk Ramsey et al.,             to MRA the authors report.
2001). However, Sarnthein et al. (2020) propose to do this
with ocean sediments, which are not annually laminated, and        2.3   Plateaus in Suigetsu and IntCal20 records
to obtain calendar chronologies accurate and precise at the
“decadal-to-centennial” level mentioned in their Sect. 1.1.        Sarnthein et al. (2020) refer to their hypothesized Lake
However, there is no independent constraint on the sedi-           Suigetsu-based 14 C calibration curve as a “rung ladder” that
mentation rate variations in these ocean cores (without an-        provides the basis of PT. Actually, the series of 14 C age
nual varves). Indeed, sedimentation rate changes linked to         plateaus hypothesized by Sarnthein et al. (2020) resembles a
climatic–oceanographic events (e.g., Dansgaard–Oeschger            “staircase” more than a “rung ladder”. In Fig. 1, we have cre-
and Heinrich events) or more local sedimentological causes         ated a Lake Suigetsu-only calibration curve using the same
could also create 14 C age plateaus.                               Bayesian statistical method used for IntCal20 (Heaton et al.,
   PT is not always restricted to the tuning of a single plateau   2020b; Reimer et al., 2020) but constructed based only upon
but is often used to tune a suite of 14 C age plateaus. However,   the observations from Lake Suigetsu with its updated cal-

Clim. Past, 17, 1701–1725, 2021                                                       https://doi.org/10.5194/cp-17-1701-2021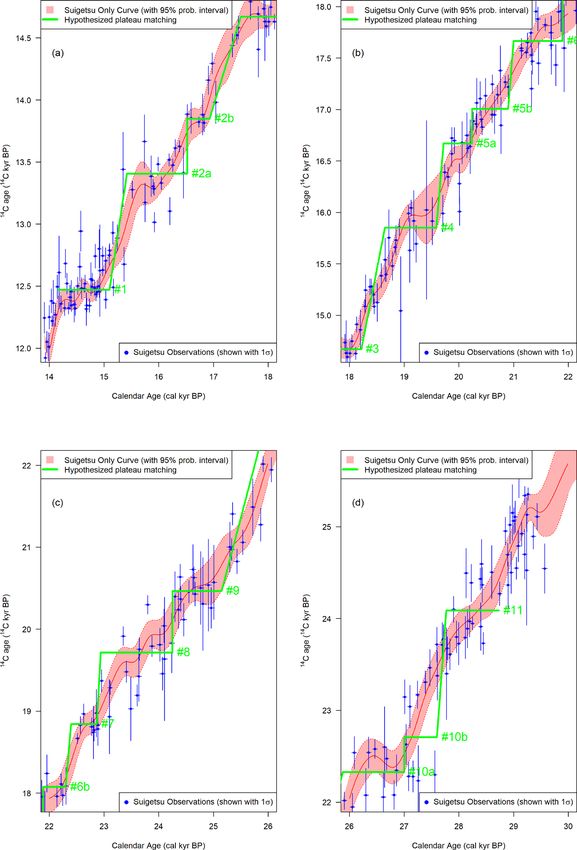
E. Bard and T. J. Heaton: Plateaus in atmospheric and oceanic 14 C records                                                      1703

endar age timescale (Bronk Ramsey et al., 2020). Figure 1             nitude smaller in terms of 114 C than that required to ex-
shows the Lake Suigetsu 14 C data and the resulting Suigetsu-         plain the jumps between the hypothesized 14 C age plateaus of
only radiocarbon calibration curve for the period beyond              Sarnthein et al. (2020). Furthermore, there is no evidence of
the last 14 000 cal yr BP (14 cal kyr BP), i.e., where continu-       huge corresponding spikes in the ice core 10 Be record (Adol-
ous high-precision data on tree-rings are not currently avail-        phi et al., 2018). In addition, the impacts of abrupt changes
able. Superimposed horizontal lines indicate the 15 hypothe-          of the geomagnetic field were found to be negligible on the
sized atmospheric 14 C age plateaus of Sarnthein et al. (2020),       production of 14 C (Fournier et al., 2015). Finally, it is un-
with their numbering as listed in their Table 1. Figure 2             likely that abrupt changes of the carbon cycle are responsi-
is equivalent to Fig. 1 but compares the Sarnthein 14 C age           ble for such large, frequent, and very abrupt 114 C spikes.
plateaus directly with the IntCal20 calibration curve (Reimer         For example, switching down the deep ocean circulation in-
et al., 2020). In addition to Lake Suigetsu, the IntCal20             stantaneously in a carbon cycle box model leads to a rather
curve uses (atmosphere-adjusted) 14 C determinations from             slow and limited 114 C rise in the atmosphere over several
speleothems, lacustrine and marine sediments, and corals, as          centuries (see, e.g., Fig. 4b by Goslar et al., 1995, or Fig. 5
well as some 14 C determinations obtained from floating tree-         by Hughen et al., 1998; see also simulations performed with
ring sequences. Besides the well-known plateau no. 1 cor-             more complex models by Marchal et al., 2001; Delaygue et
responding to the beginning of the Bölling period, evidence           al., 2003; Ritz et al., 2008; Singarayer et al., 2008). Conse-
for many of the older plateaus hypothesized by Sarnthein at           quently, the assumption which is required to underpin PT,
al. (2020) is dubious. They are not replicated in either our          i.e., that the radiocarbon calibration curve has the shape of a
statistically robust Lake Suigetsu-only curve (Fig. 1) or the         staircase, is in conflict with our basic understanding of 14 C
IntCal20 curve (Fig. 2). The weak evidence for many of these          as a tracer.
hypothesized 14 C age plateaus is further detailed in Sect. 3.2.
   By focusing only on the plateaus, Sarnthein et al. (2020)          2.4   Marine datasets used for PT
overlook the implication that in their model 14 C ages must
jump, often instantaneously, from one plateau to the next             Unfortunately, the Sarnthein et al. (2020) review paper fails
(i.e., like in a staircase as shown in Figs. 1 and 2). This is par-   to show a single figure illustrating oceanic 14 C records with
ticularly true for five steps between 10 plateaus (10b to 10a,        their plateaus compared and tuned with the proposed at-
9 to 8, 6b to 6a, 5b to 5a, and 2b to 2a) for which the calen-        mospheric calibration 14 C curve. It is thus necessary to
dar gaps correspond to 0 cal yr, but the atmospheric 14 C ages        dig into the literature to see the marine core records:
drops by between 340 and 750 14 C yr. Five other steps (be-           Figs. 3 and 4 in Sarnthein et al. (2007) for cores SO17940,
tween 10 plateaus: 11 to 10b, 8 to 7, 7 to 6b, 6a to 5b, and 5a       MD01-2416, ODP893A, and PS2644; Fig. 2 in Sarnthein et
to 4) also have minimal calendar durations (70 to 170 cal yr)         al. (2011) for core MD01-2378; Figs. 3 to 13 in Sarnthein
but show large 14 C drops ranging from 660 to 1380 14 C yr.           et al. (2015) for cores GIK23074, PS2644, MD08-3180,
Consequently, the total duration of 14 C plateaus represent           ODP1002, MD01-2378, GIK17940, SO50-37, MD01-2416,
82 % of the time spent between 14 and 29 cal kyr BP, whereas          MD02-2489, ODP893A, and MD02-2503; Fig. S1a, b, c, d
during the remaining 18 % of the time, the radiocarbon clock          in Balmer et al. (2016) for cores GeoB1711-4, GeoB3910-
(i.e., the pace at which the 14 C age changes compared with           1, KNR-159-5-36GGC, and MD07-3076; Fig. 4 in Sarn-
true calendar time) was running almost 5 times faster than ra-        thein and Werner (2017) for cores GIK23258, MSM5/5-712,
dioactive decay. The implication of the hypothetical staircase        and T88-2; Fig. 2 in Balmer and Sarnthein (2018) for core
shape of Sarnthein et al. (2020)’s proposed atmospheric cal-          MD08-3180; and Fig. 4 in Küssner et al. (2018) for core
ibration curve is that radiocarbon would have never behaved           PS75-104-1.
as a geochronometer driven by regular radioactive decay.                 Looking at these graphs is absolutely crucial to assess the
   It is useful to convert Figs. 1 and 2 from 14 C age into 114 C     poor quality of the determination of 14 C age plateaus in these
in order to assess the implications of these vertical steps. This     ocean cores and their tuning to the atmospheric 14 C calibra-
is done in Fig. 3, which shows that 14 C age plateaus are trans-      tion curve. This is particularly important as the PT implies
formed into triangular 114 C wiggles. The consequence of              sedimentation rates that vary by up to a factor of 5 to 8 within
abrupt 14 C age drops between 14 C age plateaus is that most          a single core (e.g., cores PS2644 and MD08-3180 in Sarn-
of these 114 C wiggles exhibit instantaneous rises ranging in         thein et al., 2015; PS75/104-1 in Küssner et al., 2018) and
size from 50 ‰ to 250 ‰.                                              even much more, by orders of magnitude, in other cores from
   There is no known mechanism that could be responsi-                the Nordic Seas (Sarnthein and Werner, 2017).
ble for such abrupt and large asymmetric wiggles of the at-              The proposed PT criterion, which considers only the
mospheric 114 C. Instantaneous 14 C production increases,             average sedimentation rate over a complete core (e.g.,
which result in about 4 times the average production in               > 10 cm kyr−1 ) is not sufficient to ensure reliability in the
a year, were discovered recently (Miyake et al., 2012;                PT approach. Rather it is the profile and range of sedimenta-
Mekhaldi et al., 2015). However, the size of these spikes at-         tion rate within a sediment core that is most critical, as these
tributed to extreme solar particle events is an order of mag-         internal relative changes determine the identification of the

https://doi.org/10.5194/cp-17-1701-2021                                                          Clim. Past, 17, 1701–1725, 2021
1704                                               E. Bard and T. J. Heaton: Plateaus in atmospheric and oceanic 14 C records

Figure 1. Blue dots show the Lake Suigetsu 14 C data with their 1σ analytical uncertainties in both radiocarbon and calendar age (Bronk
Ramsey et al., 2020). The thin solid red line shows the pointwise posterior mean of a radiocarbon calibration curve constructed using the
same Bayesian statistical method as IntCal20 (Heaton et al., 2020b; Reimer et al., 2020) but based only on the Suigetsu 14 C data. The
accompanying shaded interval represents the 95 % posterior predictive probability interval. Superimposed thick green lines indicate the 15
atmospheric plateaus with their numbering as listed in Table 1 of Sarnthein et al. (2020).

Clim. Past, 17, 1701–1725, 2021                                                            https://doi.org/10.5194/cp-17-1701-2021
E. Bard and T. J. Heaton: Plateaus in atmospheric and oceanic 14 C records                                                          1705

Figure 2. The thin solid purple line shows the pointwise posterior mean of the IntCal20 curve, with the shaded interval representing the
95 % posterior predictive probability interval (Reimer et al., 2020; Heaton et al., 2020b). Superimposed thick green lines indicate the 15
atmospheric plateaus with their numbering as listed in Table 1 of Sarnthein et al. (2020).

https://doi.org/10.5194/cp-17-1701-2021                                                             Clim. Past, 17, 1701–1725, 2021
1706                                               E. Bard and T. J. Heaton: Plateaus in atmospheric and oceanic 14 C records

Figure 3. The two panels represent the same data shown in Figs. 1 and 2 but converted into 114 C with units in ‰. Short (or zero) gaps
between plateaus are transformed into abrupt rises. Age plateaus correspond to the second parts of these atmospheric 114 C wiggles, during
which the 114 C decrease compensates the radioactive decay.

plateaus in the absence of calendar age information. This also         tuses are inferred by PT in the 18 sediment cores presented in
applies to the impact of bioturbation since the smoothing and          their claim that the “plateau-based high-resolution chronol-
phasing effects are directly related to the ratio between the          ogy has led to the detection of numerous millennial-scale
bioturbation depth and the sedimentation rate (this ratio be-          hiatuses overlooked by conventional methods of stratigraphic
ing the average residence time of foraminifera in the biotur-          correlation. In turn, the hiatuses give intriguing new insights
bation zone, e.g., Bard et al., 1987).                                 into past changes of bottom current dynamics linked to dif-
   In their Supplement, Sarnthein et al. (2020) provide sum-           ferent millennial-scale geometries of overturning circulation
mary figures for 18 individual deep-sea cores, showing the             and climate change”). No independent sedimentological ev-
final reconstructions of surface and deep reservoir ages ver-          idence is presented to verify these previously unnoticed hia-
sus time for each core. However, these graphs are not partic-          tuses, which occur surprisingly at the 14 C plateau boundaries
ularly useful to assess PT tuning because they do not show             for no obvious reason. These discontinuities may just be arti-
the raw 14 C data versus depth compared to the Suigetsu 14 C           facts of the PT method. Sarnthein and Grootes (2021) further
record.                                                                claim that there should be a positive correlation between hia-
   In fact, the changes of sedimentation rates implied by PT           tus frequency and sedimentation rate. This counterintuitive
are even larger than those mentioned above because remain-             hypothesis remains speculative in the absence of evidence
ing conflicts between atmospheric and marine 14 C records              independent of PT.
are resolved by introducing ad hoc discontinuities into the               Surprisingly, the summary Fig. S2c for three cores
core stratigraphies. These periods, forced to have a sedimen-          (MD07/3088, SO213-76, and PS97/137-1) has been changed
tation rate dropping down to zero, are assumed to be pre-              between the submitted version (available in Climate of the
viously unnoticed sedimentological hiatuses (e.g., nine hia-           Past Discussions) and the final published paper by Sarnthein

Clim. Past, 17, 1701–1725, 2021                                                            https://doi.org/10.5194/cp-17-1701-2021
E. Bard and T. J. Heaton: Plateaus in atmospheric and oceanic 14 C records                                                     1707

et al. (2020). The changes are particularly important for the       and Thunell (2017) highlighting the subjectivity of the PT
last two cores: for example, the Last Glacial Maximum sur-          approach.
face reservoir age around 20 cal kyr BP has now doubled for
core PS97/137-1 (more than 2000 14 C yr in the final pub-           2.5   Plateau boundaries and MRA changes
lication instead of 1000 14 C yr in the initial submitted ver-
sion). Benthic reservoir ages have also changed by more than        The PT technique is focused on the detection and use of
1000 14 C yr (up or down) in the last two cores. In addition,       14 C age plateaus. This implies that a large part of the 14 C

both records now exhibit two hiatuses in the final publication      record is left unused in the matching process. This is ac-
as opposed to the single hiatus presented in the initial submis-    tually surprising because plateaus are used in the frame of
sion. In the submitted and published versions of Sarnthein          PT to define the absolute chronology of the marine sediment
et al. (2020), these new results were referred to a submitted       core, while plateaus in the 14 C calibration curve are gener-
paper by Küssner et al. (2021), which is still unpublished.         ally viewed as poor periods for obtaining precise calibrated
Hence, no explanation is available to the reader to assess the      ages in contrast to “high-slope” parts of the calibration curve
reason for the drastic change of MRA reconstructions be-            (e.g., Svetlik et al., 2019). The only potential justification we
tween the two versions.                                             can identify for such an approach would be if one believed
   Lamy and Arz (2021), who studied cores from the same             that changes to MRA could only occur at plateau boundaries
area (e.g., Lamy et al., 2015), confirm the serious problem         (and remained otherwise constant). However, there is no spe-
linked to the application of PT to core PS97/137-1. They            cial significance in the plateaus of the 14 C calibration curve.
raise doubts about the highly variable sedimentation rates          After transformation to atmospheric 114 C (Fig. 3), a 14 C age
within this core, which make the identification of any 14 C         plateau is only the second part of a wiggle, during which the
plateaus highly uncertain. They further note that the sta-          114 C decrease compensates for the radioactive decay. If any-
tus of the laminations in these sediments is still debated,         thing, the entire 114 C wiggle is the feature that should be
which implies that a rough count cannot be used to support          matched (equivalent to a high-slope–low-slope sequence in
the chronology based on PT. Michel and Siani (2021) also            the plot of 14 C age versus calendar age).
express caution about PT results presented by Sarnthein et             Without a clear justification for why plateau boundaries
al. (2020) on a Southeast Pacific core (MD07-3088) stud-            would coincide with all MRA changes, there is thus no rea-
ied previously by Siani et al. (2013). Their concern is about       son to match the 14 C age plateaus only and discard the other
the reconstructed variability of sedimentation rate based on        parts of the 14 C sequence. Matching the entire 14 C record
PT (up to a factor of 25 for that core), and Michel and             with the target curve would provide a stronger analogy with
Siani (2021) also underline that the MRA cannot be pre-             the wiggle matching technique used for tree sequences (but
cisely defined for the glacial part of the core. In addition        without resolving the remaining pitfalls of having no inde-
to South Pacific cores, Lamy and Arz (2021) extend their            pendent calendar dating for most ocean sediments and that no
doubts to PT tuning applied to other cores studied by Sarn-         matching could be done unless one already knew the MRA).
thein et al. (2020) (e.g., GeoB3910 off Brazil in a zone stud-      Matching the entire 14 C sequence is also the method used to
ied previously by Arz et al., 1999).                                synchronize floating tree-ring sequences to a master chronol-
   Outside the 18 records obtained by the Kiel group and            ogy (e.g., Capano et al., 2020, used for the IntCal20 curve by
compiled by Sarnthein et al. (2020), there is one further pa-       Reimer et al., 2020).
per by other authors who have used PT for stratigraphical              Indeed, even if MRA changes were to occur only at plateau
purposes and for reconstructing 14 C reservoir ages. Umling         boundaries, the marine and atmospheric 14 C age records
and Thunell (2017) used eyeball PT to derive their chronol-         should show entirely the same shape, just with piecewise
ogy for a sediment core located at 2.7 km depth in the east-        constant offsets during and between each plateau. This would
ern equatorial Pacific. Their tuning of the 14 C record of core     provide an even stronger argument that the whole 14 C record
TRI163-23 onto the Suigetsu 14 C record implies the unex-           should be matched. Plateau tuning would then reduce to find-
pected presence of hiatuses in this core at boundaries be-          ing the change points in the piecewise constant MRA offset
tween 14 C plateaus (i.e., gaps between plateaus 1a and YD,         between atmospheric and marine 14 C ages.
between plateaus 1 and 1a, and between plateaus 2a and 1;
see Fig. 3c of Umling and Thunell, 2017). The first hiatus is       2.6   Spurious plateaus in marine sediments
particularly long (1200 cal yr), but no independent data are
presented to confirm the presence of such a large unconfor-         In contrast to the atmospheric 14 C calibration curve, there is
mity in this core. In addition, the deglacial 14 C reservoir ages   indeed a special significance in a 14 C age plateau observed
reconstructed for core TRI163-23 exhibit discrepancies with         in ocean sediments. As mentioned above, within a sediment
the record obtained by de la Fuente et al. (2015) on another        core a 14 C age plateau could be a simple consequence of
core from the eastern equatorial Pacific collected at a simi-       an abrupt sedimentation rate increase or even a slump that
lar depth (2.9 km). Grootes and Sarnthein (2021) even dis-          mixes sediments of the same age. Another potential source
agree on specific aspects of the PT performed by Umling             of 14 C age plateaus has been completely overlooked by Sarn-

https://doi.org/10.5194/cp-17-1701-2021                                                        Clim. Past, 17, 1701–1725, 2021
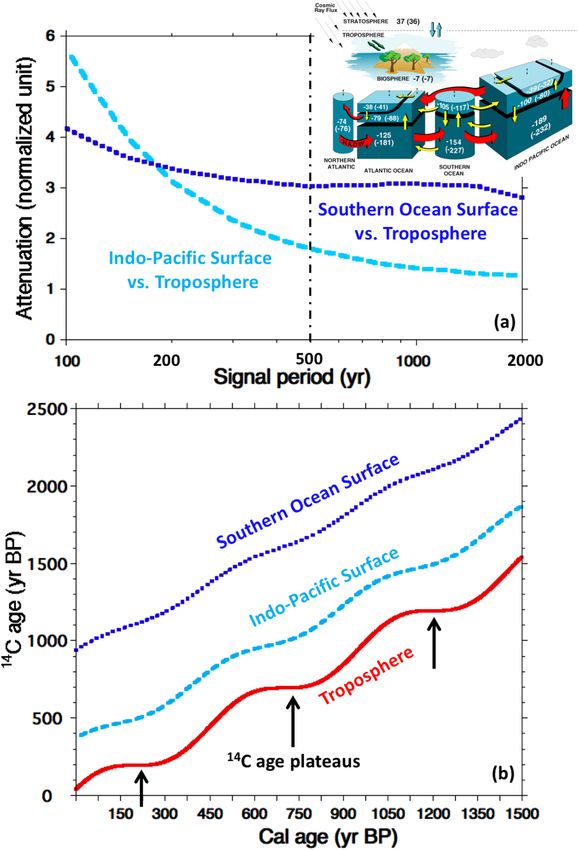
1708                                            E. Bard and T. J. Heaton: Plateaus in atmospheric and oceanic 14 C records

thein et al. (2020): the coupling of continuous bioturbation      2.7   Attenuation and phase lag in the ocean
with changes in the abundance of the 14 C signal carrier. In-
deed, the assemblages of foraminifera used for 14 C analy-        Let us now assume that 14 C age plateaus in marine records do
ses often varied in the past due to global or regional paleo-     match those identified in the atmospheric record (i.e., the ba-
ceanographic conditions (these large and systematic faunal        sic assumption of the PT technique). What remains problem-
changes are the basis for the use of planktonic foraminifera      atic, if we are intending to use PT to create a precise calendar
in paleothermometry, e.g., Imbrie and Kipp, 1971; Kucera et       age time scale for the marine record, is that marine 14 C age
al., 2005).                                                       plateaus are assumed to be as sharp and as long as their corre-
   In particular, an abrupt decrease or an abrupt increase of     sponding atmospheric plateaus, even in the case of very large
the foraminifera abundance will inevitably create a 14 C age      surface reservoir ages reconstructed by the method. The sec-
plateau, as theorized by Broecker et al. (1984). The first        tions below show that this conflicts with our understanding
demonstration was provided by Bard et al. (1987), who             of the carbon cycle.
showed that 14 C age plateaus and ∂ 18 O phase lags measured         For the past 14 kyr, high-resolution 14 C data on tree-ring
on two planktonic species in a deep-sea core from the North       and 10 Be on polar ice cores have shown that most centennial
Atlantic could be explained quantitatively by bioturbation        114 C wiggles in the atmosphere are due to cosmogenic pro-
modeling forced with the abundance records of both species.       duction changes (Beer et al., 1988; Adolphi and Muscheler,
Since 1987 many other groups have made similar observa-           2016; Adolphi et al., 2017, 2018), mainly linked to the solar
tions of 14 C age plateaus and discrepancies explained by         variability as illustrated by studies covering the last millen-
bioturbation coupled with foraminifera abundance changes          nium (e.g., Bard et al., 1997; Muscheler et al., 2007; De-
(e.g., Costa et al., 2018; Ausin et al., 2019).                   laygue and Bard, 2011). This 14 C production signal is trans-
   In order to interpret 14 C age plateaus in ocean sediments,    ferred from the atmosphere to the ocean surface before be-
it is thus indisputably necessary to show the absolute abun-      ing slowly transported to the deep ocean. The atmospheric
dance records of the different foraminifera used for 14 C dat-    14 C wiggle inevitably gets damped in the other reservoirs of

ing (counts expressed in number per gram of sediment). This       the carbon cycle, notably the surface ocean. In addition, the
has never been the case for any of the PT papers by the           oceanic wiggle is not strictly in phase with the atmospheric
Kiel group used for this new compilation (Sarnthein et al.,       one. Both damping and phasing effects conflict with the main
2007, 2011, 2013, 2015; Balmer et al., 2016; Sarnthein and        assumption of the PT technique, namely that marine 14 C age
Werner, 2017; Balmer and Sarnthein, 2018; Küssner et al.,         plateaus can be matched directly to atmospheric ones.
2018; Sarnthein et al., 2020). It is possible that several ma-       Using numerical models, it is possible to quantify the
rine 14 C age plateaus could be mere sedimentary artifacts.       damping and phasing effects, which depend directly on the
   Sarnthein and Grootes (2021) cite another paper by Ausin       duration of the 114 C wiggle and on the carbon residence
et al. (2021) published after the submission of our paper. This   time in the considered carbon cycle reservoir (or chain of
recent work is based on a sediment core from the Iberian mar-     reservoirs). A convenient way is to consider a sinusoidal 14 C
gin for which Sarnthein and Grootes (2021) provide a graph        production leading to attenuated and shifted 14 C signals in
representing the foraminifera abundance counts, showing no        the atmosphere and the ocean surface (see Fig. 4). The Indo-
obvious correlation between 14 C plateaus and drops in abun-      Pacific low-latitude surface box of the 12-box model by Bard
dances. This information is indeed useful, and it is unfortu-     et al. (1997) has a 14 C reservoir age of 320 14 C yr at steady
nate that these data are neither shown nor provided in the        state. The relative attenuation (i.e., the amplitude in the tro-
paper by Ausin et al. (2021).                                     posphere divided by the amplitude in the surface ocean) is a
   Nevertheless, caution should be taken with the work by         factor of 1.8 for 500 cal yr long 14 C wiggles and a factor of
Ausin et al. (2021), who obtain low MRA and benthic 14 C          3.1 for 200 cal yr long wiggles. The phase lag between atmo-
values in this Iberian Margin core, notably during Heinrich       spheric and oceanic response also varies with the duration of
stadial 1 (HS1) and the Last Glacial Maximum (LGM), in            the 14 C production signal: about 60 and 45 cal yr for 500 and
stark contrast with records obtained on nearby cores (Skinner     200 cal yr long wiggles, respectively.
et al., 2014, 2021). The MRA drop (down to 300 years) dur-           To illustrate the relative attenuation increase with a larger
ing HS1 based on PT is also in conflict with modeling results     reservoir age it is useful to consider the simulation for
(Delaygue et al., 2003; Ritz et al., 2008; Franke et al., 2008;   the Southern Ocean surface box which has a reservoir age
Butzin et al., 2017). Although Sarnthein and Grootes (2021)       of 890 14 C yr in the 12-box model. For the same 500 and
present the new paper by Ausin et al. (2021) as a “nice test      200 cal yr long 114 C wiggles, the relative attenuation fac-
case” of PT, the strong disagreement with the literature is       tors are 3.0 and 3.4, respectively. Figure 4a shows the results
not reassuring. Furthermore, it also remains to be seen if the    of these calculations for signal periods ranging from 2000
bioturbation–abundance coupling could not be an adequate          to 100 calendar years. The period is equivalent to the du-
explanation for some 14 C age plateaus in the 20 other pub-       ration of the 114 C wiggle and to twice the duration of the
lished records based on PT and for which the foraminifera         14 C age plateau, which corresponds to the descending part of

counts are not available.                                         the 114 C wiggle.

Clim. Past, 17, 1701–1725, 2021                                                      https://doi.org/10.5194/cp-17-1701-2021
E. Bard and T. J. Heaton: Plateaus in atmospheric and oceanic 14 C records                                                               1709

Figure 4. (a) Amplitude ratio of 114 C wiggles in the atmosphere and the surface ocean created by sinusoidal changes of the 14 C production
as an input to the 12-box model shown in the upper insert (Bard et al., 1997). This normalized attenuation factor is plotted versus the signal
period of production variations (on a log scale). The greater the attenuation, the more the amplitude of the sinusoid in the surface ocean
is reduced. The factor would be equal to 1 if atmospheric and oceanic amplitudes were the same. The dashed light blue curve shows the
calculation results for the Indo-Pacific surface box, while the dotted dark blue line stands for the Southern Ocean surface box. These two
boxes differ by their surface 14 C reservoir age at steady state (320 and 890 years for the Indo-Pacific and Southern Ocean surface boxes,
respectively). The vertical dash-dotted black line underlines the 500-year period wiggle used to construct panel (b). The inset graph shows the
geometry of the model by Bard et al. (1997) with numbers on boxes indicating their steady-state 114 C (‰), numbers in parenthesis stand for
halving the meridional overturning circulation (MOC). Note that the main goal of the simulations in Fig. 4 is to demonstrate that age plateaus
almost disappear and are delayed in the surface ocean due to the smoothing effect of the carbon cycle, even if it stays strictly constant. These
simulations are not intended to simulate 14 C and MRA changes due to variations of the ocean circulation. On this subject, it should be noted
that part of the simulations presented by Goslar et al. (1995) and mentioned in Sect. 2.3 and 2.8 were obtained with the very same box model
used for our simulations but with a variable MOC. (b) 14 C age versus calendar age plot computed for sinusoidal 14 C production wiggles with
a period of 500 years and an amplitude change of ±15 % around the mean value (in order to produce oscillations around the 1 : 1 line, 14 C
ages are calculated with the true half-life of 5730 years). The solid red curve shows the evolution for the tropospheric box, exhibiting 14 C
plateaus (marked with black arrows) when the slope of the relationship goes down to zero. The age plateau corresponds to the second part
of the atmospheric 114 C wiggle, during which the 114 C decrease compensates the radioactive decay. The dashed light blue curve shows
the calculation results for the Indo-Pacific surface box, while the dotted dark blue line stands for the Southern Ocean surface box. The blue
curves are offset with respect to the atmospheric curve by their respective marine reservoir ages. In both cases, the slope of the relationship
does not decrease to zero, implying the absence of true 14 C age plateaus in the surface ocean.

https://doi.org/10.5194/cp-17-1701-2021                                                                 Clim. Past, 17, 1701–1725, 2021
1710                                              E. Bard and T. J. Heaton: Plateaus in atmospheric and oceanic 14 C records

   As illustrated in Fig. 4b, a 500 cal yr long wiggle of cosmo-    gional differences. The surface ocean regions responsible for
genic production varying by ±15 % around its mean value is          uptake or outgassing of CO2 exhibit large effects with no de-
sufficient to produce an atmospheric 14 C age plateau. How-         lay, whereas other regions are only affected in a passive way
ever, in the surface ocean boxes, the slope of the 14 C age         through the atmosphere. For those widespread passive re-
versus calendar age curves does not drop to zero, i.e., there       gions, we must refer back to the calculations shown in Fig. 4a
is an absence of a 14 C age plateau in the modeled surface          and b, which lead to large attenuations in the ocean.
ocean environment despite the atmospheric plateau. This is             The study of atmosphere and surface ocean 14 C wiggles
a direct consequence of the damping of 14 C signals by the          linked to spatially variable ocean–atmosphere exchange is in-
carbon cycle.                                                       herently more complex as it requires spatial resolution with
   The 14 C bomb spike of the early 1960s provides further ev-      2D and 3D models and consideration of regional 14 C data to
idence of the smoothing and phasing effects. The main 14 C          identify active and passive regions. However, regional gra-
injection lasted only a few years and the bomb spike can be         dient changes of surface 14 C simulated by models are gen-
viewed as the impulse response function of the carbon cycle.        erally on the order of a few centuries (Stocker and Wright,
In detail, the bomb pulse is complicated because the 114 C          1998; Delaygue et al., 2003; Butzin et al., 2005; Franke et
decrease observed in the atmosphere over the last 50 years          al., 2008; Singarayer et al., 2008; Ritz et al., 2008), rather
is also partially due to the Suess effect linked to the input       than the millennia advocated by Sarnthein et al. (2020).
of anthropogenic CO2 devoid of 14 C (Levin and Hesshaimer,
2000). In any case, the ocean surface 114 C increased in the        2.9    The tephra method to reconstruct MRA
1970s by 150 ‰–200 ‰ above pre-bomb values, which is
about 5 times less than the maximum anomaly in the atmo-            In Sect. 1.2 of their paper, Sarnthein et al. (2020) mention
spheric pool. This large damping effect remains true even for       a completely different method to reconstruct MRA based on
the shallowest lagoons (Grottoli and Eakin, 2007), which il-        14 C datings of the same volcanic ash layer (tephra) in land

lustrates the efficacy of ocean mixing to counterbalance air–       and marine sediments. This is indeed a precise and accurate
sea gas exchange.                                                   method used in many studies, including those cited by Sarn-
   Today the ocean surface 114 C is still above these pre-          thein et al. (2020). However, they should have also cited the
bomb values (e.g., Andrews et al., 2016) and this anomaly           two seminal papers on the subject: Bard (1988) was the first
will remain with us for many decades to come as the present         to specifically propose the use of volcanic ash layers to re-
level in the ocean surface is only about halfway through its        construct past MRA variations, and Bard et al. (1994) were
long-term asymptotic decrease. The calculation of an average        the first to reconstruct past MRA changes with this powerful
phase lag between atmosphere and ocean is difficult because         method.
the impulse response functions are completely asymmetric               The further advantage of the MRA method based on tephra
(i.e., the delay for the signal rise is totally different to that   is that the downcore profile of volcanic shard counts provides
observed for the signal decrease). To sum up, the bomb spike        a useful constraint on the bioturbation depth and intensity,
in the surface ocean is also a century-scale event, with an at-     which also affect 14 C ages measured on foraminifera. Indeed,
tenuation compatible with that calculated by considering si-        this shard profile is the impulse response function of the bio-
nusoidal signals (Fig. 4a), which remains the traditional way       turbation filter and hence provides information that can be
used in signal analysis (i.e., so-called Bode plots).               used to correct 14 C ages used for the MRA calculation (Bard
                                                                    et al., 1994). Another route to detect and constrain biotur-
2.8    Plateaus and carbon cycle changes
                                                                    bation is to study the total scatter of 14 C ages measured on
                                                                    single specimens of foraminifera and to compare it with the
The considerations above apply to 114 C wiggles linked to           smaller dispersion linked to analytical errors only (Fagault et
14 C production changes, but it has likewise been suggested         al., 2019; Dolman et al., 2021).
that 14 C age plateaus may also correspond to carbon cy-
cle changes, notably at the end of the Younger Dryas (YD)
                                                                    3     Statistical perspective
climatic event (Oeschger et al., 1980; Goslar et al., 1995;
Hughen et al., 1998). This YD 14 C age plateau may have             3.1    Reliable plateau identification
been caused by an abrupt resumption of the meridional over-
turning circulation as simulated by numerical models (Goslar        Fundamental to the accuracy, robustness, and reliability in
et al., 1995; Stocker and Wright, 1996, 1998; Hughen et al.,        the estimates of the timescales and MRAs obtained by PT,
1998; see Fig. 17 by Bard, 1998, comparing the 14 C age             is whether true atmospheric 14 C age plateaus can be consis-
plateau simulated by the 12-box model and the Bern 2.5D             tently identified and also matched between sparsely sampled
physical model).                                                    and noisy records. These plateaus must be reliably identified
   In such a case, the 14 C perturbation originates from the        both in the atmospheric master target record, Lake Suigetsu
ocean, and the relative attenuation and phase relationships         in the case of Sarnthein et al. (2020), and in the marine sedi-
with the atmospheric pool are more complex, exhibiting re-          ment cores for which one wishes to infer a calendar chronol-

Clim. Past, 17, 1701–1725, 2021                                                        https://doi.org/10.5194/cp-17-1701-2021
E. Bard and T. J. Heaton: Plateaus in atmospheric and oceanic 14 C records 1711
ogy. In the case of marine sediment cores, identification of and to ensure that the speleothem record does not generate
these atmospheric 14 C age plateaus is further confounded by additional spurious, DCF-driven, 14 C age plateaus between
potential MRA changes, bioturbation, and the lack of an in- the genuine atmospheric ones. As already underlined in our
dependent timescale. One needs to have confidence that the Sect. 2.2, the opposite hypothesis is made by Sarnthein et
plateaus identified in both the marine and atmospheric 14 C al. (2020) for MRA, which is assumed to remain constant
records are not only genuine atmospheric features but have during the atmospheric 14 C age plateaus, changing only at
also been correctly paired together. boundary times between plateaus.
Sarnthein et al. (2020) do not appear to address this is- Based on the comparison with the precise IntCal13 record
sue – instead concentrating on an argument as to whether the over the past 14 cal kyr BP, the DCF for Hulu is on the order
true underlying atmospheric 14 C record contains plateaus. of 450 ± 70 14 C yr (1σ , Cheng at al., 2018). This mean value
The presence of 14 C plateau periods in the underlying at- and standard deviation have been further tested and refined
mosphere is a necessary condition for PT (discussed further in the frame of IntCal20 by comparing the Hulu data for in-
in Sect. 3.8). However, the presence of such periods (in the dividual speleothems with the tree-ring 14 C record over the
unknown true atmosphere) is certainly not sufficient to en- past 14 cal kyr BP. This IntCal20 testing gives an estimate of
sure the reliability of PT. Rather, the main statistical con- 480 ± 55 14 C yr (Reimer et al., 2020; Heaton et al., 2020b).
cern for PT is as to whether any such genuine atmospheric The low value and stability of the Hulu DCF are attributed to
14 C age plateaus can be identified in both the sparse and un- the characteristics of the Hulu cave with its sandstone ceiling
certain Lake Suigetsu 14 C record and the marine sediment and open system conditions with the soil above it. In a similar
14 C record being plateau-tuned. If one either mislocates a way to the ocean modeling in Sect. 2.7, the carbon transport
true 14 C age plateau in one or other of the records or incor- and mixing processes leading to the DCF should have some-
rectly pairs plateaus between the records, then the subsequent what smoothed the atmospheric 14 C variations. Although a
timescales of the sediment core and MRA estimation will specific kind of modeling should be performed for a particu-
be unreliable. We raise specific statistical concerns regarding lar cave system, the DCF value for Hulu cave (ca. 480 14 C yr)
the reliable identification and pairing of potential plateaus. is equivalent to the average MRA of low-latitude to midlati-
tude surface oceans (Heaton et al., 2020a). Consequently, the
14 C age plateaus should be smoothed and delayed at a simi-
3.2 Identification of atmospheric plateaus
lar level as in surface ocean records, for which Sarnthein et
The first statistical requirement for the PT technique is the al. (2020) assume that plateaus are of the same duration and
ability to precisely identify hypothesized 14 C age plateaus timing as in the atmospheric record.
based upon limited sequences of noisy and sparsely sampled Further, one would expect that due to the time-directional
14 C observations. The limitations in the amount of data avail- nature of any speleothem filtering (i.e., that it averages over
able in the underlying records used for PT and their observa- past atmospheric 14 C concentrations), 14 C age plateaus in the
tional noise lead to rather ambiguous estimations of the lo- Hulu record should either be seen with a time lag compared
cations and durations of the proposed Sarnthein et al. (2020) with the atmosphere or at least towards the more recent end
14 C age plateaus. The challenge of plateau identification will of the atmospheric plateau. This is not the case in Sarnthein
be most significant in the ocean sediment cores to be tuned, et al. (2020), where Fig. S1 predominantly proposes Hulu
since they are typically the most sparsely sampled and lack Cave 14 C age plateaus that occur at the beginning (i.e., older
a timescale, as we discuss later. However, such ambiguity is end) of their hypothesized atmospheric 14 C age plateaus.
also present in the atmospheric records. This raises questions When one considers the uncertainty in the 14 C determi-
regarding the reliability of the atmospheric 14 C age plateaus nations, which are used to identify the hypothesized atmo-
used as a target. spheric 14 C age plateaus (see Fig. S1 of Sarnthein et al.,
In the case of Sarnthein et al. (2020), the hypothesized at- 2020, showing error bars plotted at 1σ ), it is unclear how
mospheric 14 C age plateaus are selected based on the Lake strong the evidence is for several of the plateaus in the at-
Suigetsu and Hulu 14 C records (see Sarnthein et al., 2020’s mospheric target suite. When measurement uncertainties are
Fig. S1, showing 14 C error bars at 1σ ). Sarnthein et al. (2020) large, one would expect (simply due to the randomness of
invoke ad hoc changes of the dead carbon fraction (DCF) these uncertainties) to observe sequences of 14 C determina-
of the Hulu Cave speleothems (Sect. 2.2) and an argument tions that are non-monotonic even when the underlying at-
that filtering has removed the plateaus within the speleothem mospheric 14 C age to calendar age is monotonically increas-
14 C record to explain the lack of correspondence between ing. Based upon the Lake Suigetsu observations and uncer-
the 14 C age plateaus they outline in the Lake Suigetsu tar- tainties, it is therefore hard to assess whether some of the
get curves compared with the Hulu Cave target (Sect. 1.2). hypothesized atmospheric 14 C age plateaus really exist or are
There is no obvious reason that would explain systematic instead just random artifacts due to measurement uncertainty.
changes in the speleothem DCF occurring only during the This is particularly true for the upper panel of their Fig. S1,
atmospheric 14 C age plateaus in such a way as to both mask which is focused on the period between 21 and 27 cal kyr BP.
these atmospheric plateaus in the speleothem 14 C record
https://doi.org/10.5194/cp-17-1701-2021 Clim. Past, 17, 1701–1725, 20211712 E. Bard and T. J. Heaton: Plateaus in atmospheric and oceanic 14 C records
To illustrate this concern about the reliability of the hy- rectly paired between the two records. One would need to be
pothesized atmospheric target plateaus more clearly, as men- confident both that the Lake Suigetsu record had identified
tioned in Sect. 2.3, we created a Lake Suigetsu-only calibra- all genuine atmospheric 14 C age plateaus and further that one
tion curve. This used the same Bayesian statistical method as can then pair each identified marine 14 C age plateau correctly
implemented for IntCal20 (Heaton et al., 2020b; Reimer et with its corresponding atmospheric 14 C age plateau. This lat-
al., 2020) but was constructed based only upon the 14 C obser- ter step needs to take into account that the marine 14 C age
vations from Lake Suigetsu (using the updated Lake Suigetsu plateau is offset by an unknown and potentially varying sur-
calendar age timescale provided by Bronk Ramsey et al., face marine reservoir age.
2020). Figure 1 shows the Lake Suigetsu 14 C data with their If one fails to identify a genuine atmospheric 14 C age
1σ analytical uncertainties (both in radiocarbon and calen- plateau using the Lake Suigetsu record, then one cannot pre-
dar age) and the resulting Suigetsu-only radiocarbon calibra- sumably be sure one is matching the same 14 C age plateaus
tion curve with its 95 % posterior predictive probability inter- between the records with the consequential risk of severe
val. Superimposed horizontal lines indicate the 15 hypothe- misalignment of the marine core. As a hypothetical example,
sized atmospheric plateaus with their numbering as listed in suppose there were five true atmospheric 14 C age plateaus,
Table 1 of Sarnthein et al. (2020). Besides the well-known but only three of these five plateaus were identifiable in
plateau no. 1, corresponding to the beginning of the Bölling the noisy Lake Suigetsu observations. The other two gen-
period, it is dubious as to whether many of the older plateaus uine plateaus would therefore remain unknown in our tar-
in particular are supported by the Lake Suigetsu data based get. Further, suppose one then identified three plateaus in
on our statistical assessment. the marine core to be tuned. With there being five true un-
Furthermore, most of the Sarnthein et al. (2020) hypoth- derlying 14 C age plateaus, these three marine plateaus could
esized 14 C age plateaus have calendar durations exceeding correspond to different plateaus from the three identified in
the 95 % posterior predictive probability interval around the the Lake Suigetsu target. Despite this, PT would confidently
Lake Suigetsu data (notably plateaus nos. 2a, 4, 8, and 10b). align the three plateaus in both records. The resulting align-
The two plateaus (nos. 2b and 6b) with the shortest dura- ment could however be entirely incorrect, leading to errors in
tion (410 cal yr) are compatible with the probability interval the marine core chronology and MRA reconstruction.
around the Lake Suigetsu data. However, these sections of
the Suigetsu-only calibration curve are also compatible with 3.4 Identification of marine plateaus
straight oblique lines with no plateau at all. Such a conclu-
sion is supported by Fig. 2, which compares the plateaus and Further statistical difficulties arise in determining 14 C age
the IntCal20 curve. Only a few plateaus could correspond to plateaus in the marine core since before PT is performed one
particular structures of the IntCal20 curve, notably plateau does not have a calendar timescale on which to provide a
no. 1, which is already known, and maybe plateaus nos. 7, gradient (in terms of 14 C yr (cal yr)−1 ). Without the ability
10a, and 11, although their identified structures are much to work out the 14 C gradient per calendar year, identifying
shorter, and thus smaller in 114 C (Fig. 3), than the hypothe- a 14 C age plateau is considerably more challenging. A nat-
sized plateaus would imply. ural option might be to use the depth scale within the core.
This would be equivalent to assuming a constant sedimen-
tation rate. However, in then tying or matching subsequent
3.3 Matching plateaus plateau to the atmospheric 14 C age plateau, this assumption
Current 14 C sediment-based records do not have the resolu- of constant sedimentation would be overridden and poten-
tion or precision in 14 C measurement one might ideally de- tially significantly violated. This introduces significant circu-
sire – it is for this reason the community aims for the use of larity and potential for contradiction into the PT approach. In
tree-rings to construct the internationally ratified IntCal cali- fact, in previous work, the PT method appears to provide sed-
bration curve. For example, the Lake Suigetsu record (Bronk imentation rates that vary by up to a factor of 5 to 8 within a
Ramsey et al., 2012) upon which PT is based contains only single core (e.g., cores PS2644 and MD08-3180 in Sarnthein
76 observations from 12–13.9 cal kyr BP with 14 C age uncer- et al., 2015; PS75/104-1 in Küssner et al., 2018), consider-
tainties varying between 39 and 145 14 C yr (1σ ). The Cari- ably more (by orders of magnitude) in other cores from the
aco marine record (Hughen et al., 2006) is one of the more Nordic Seas (Sarnthein and Werner, 2017), and even more in
highly resolved collections of foraminifera but contains only ad hoc hiatuses mentioned above in Sect. 2.4. The question
24 observations from 14–15.9 cal kyr BP with 14 C age mea- of how one identifies a marine 14 C age plateau in the context
surement uncertainties of around 40 14 C yr (1σ ). of a changing and unknown sedimentation rate and calendar
In light of such sparse sampling and measurement un- age scale – for which estimates only become available after
certainty, it is unclear how much confidence one can have one has already been required to select plateaus and perform
that the identified 14 C age plateaus, in either the target Lake the tuning – does not have a straightforward solution and is
Suigetsu record or the marine record one intends to tune, are prone to confirmatory bias.
genuine atmospheric phenomena and whether they are cor-
Clim. Past, 17, 1701–1725, 2021 https://doi.org/10.5194/cp-17-1701-2021E. Bard and T. J. Heaton: Plateaus in atmospheric and oceanic 14 C records 1713
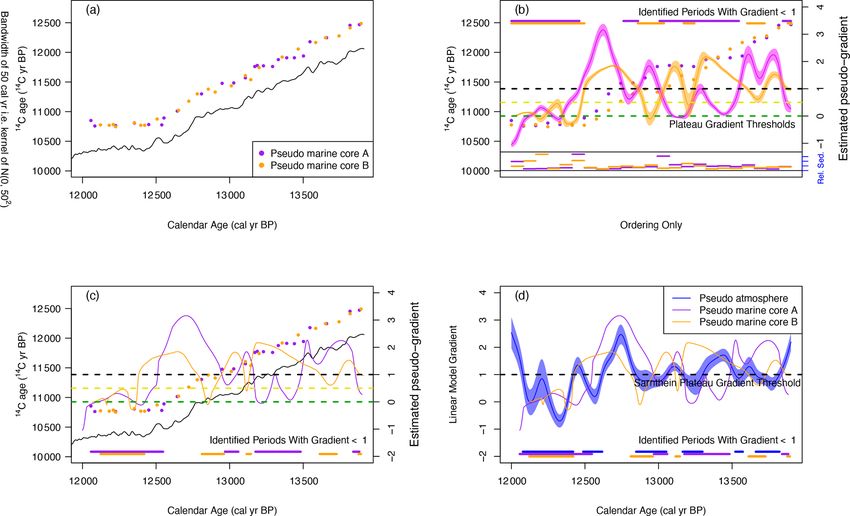
3.5 Objective plateau identification sion and density to the Cariaco Basin (Hughen et al., 2006),
can we use PT to accurately reconstruct the marine record’s
The original PT method (Sarnthein et al., 2007, 2011) was underlying calendar age scale?
based only on visual inspection of the observed 14 C ages Readers should note that our simulated pseudo-Cariaco
versus depth to determine the 14 C age plateaus (both the du- marine core is densely sampled compared with the marine
ration of the plateaus and their constant 14 C ages including cores studied by Sarnthein et al. (2020). Moreover, in our
an unknown marine reservoir age). In an attempt to reduce study we have simplified the tuning problem by setting a con-
the subjectivity of eyeball evaluation, Sarnthein et al. (2015) stant MRA for our simulated marine record. The additional
calculated the first derivative of a locally fitted 14 C age ver- complexities introduced to PT should MRAs change at any
sus depth curve to identify the 14 C age plateaus (i.e., times time are not considered. Consequently, our simulation results
when the slope drops to near zero). This refinement goes in should be considered a best-case scenario for the PT method.
the right direction, but the authors admit that there is room To maximize objectivity, we aimed to implement the au-
for subjectivity when choosing the level of smoothing and tomated 14 C age plateau identification approach presented in
the threshold for defining a plateau. In addition, their deriva- Sarnthein et al. (2015). The description of their automated
tion technique does not explicitly consider the different an- approach lacks precise detail to be completely reproducible;
alytical uncertainties of the individual 14 C measurements on however, we hope that our method follows the principles suf-
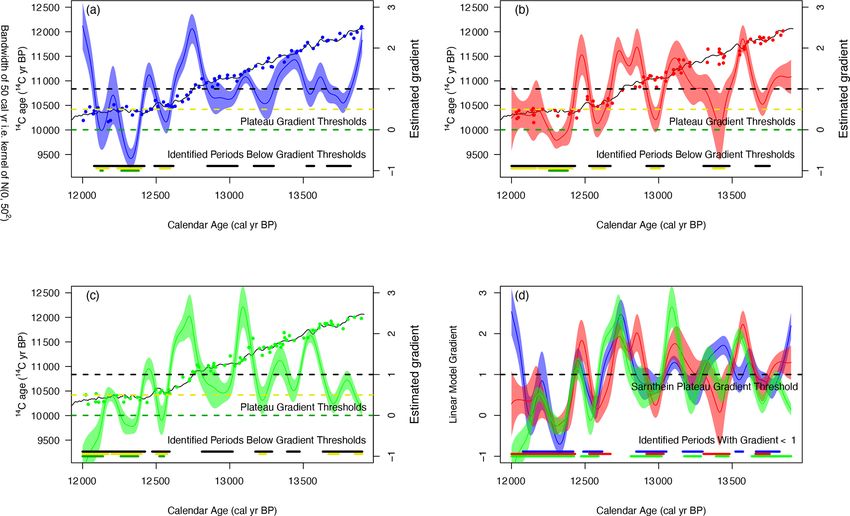
atmospheric and marine samples that are quite variable, a no- ficiently closely. Having simulated our cores, to estimate the
table example being the Lake Suigetsu 14 C data measured on local 14 C yr (cal yr)−1 gradient at any depth, we fit a kernel-
small plant macrofossils of varying carbon masses (Bronk weighted linear model using a N(0, 502 cal yr2 ) kernel (or an
Ramsey et al., 2012). Such analytical uncertainties should be analogue in the case of the marine core for which we have no
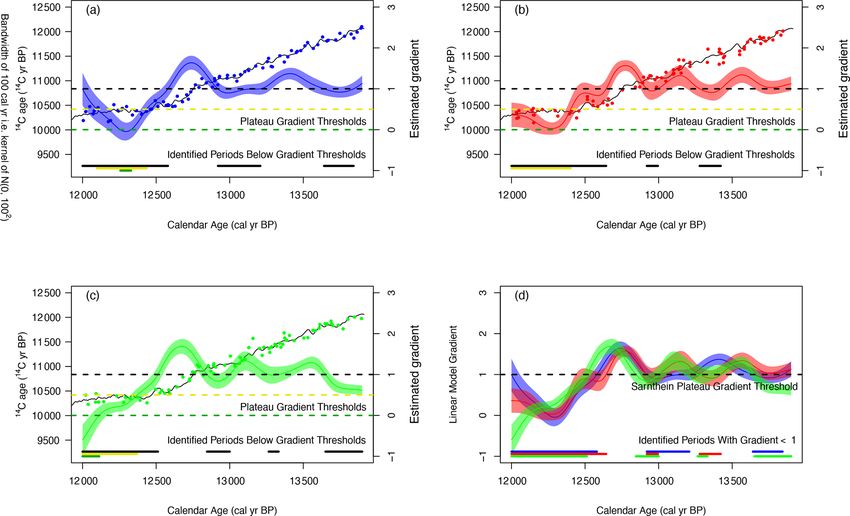
taken into account because a kink or a plateau in a 14 C versus known calendar age scale) and based upon a fixed number
depth relationship within a record could be a structure within of samples in the neighborhood of the depth under consid-
the analytical errors rather than an atmospheric feature. PT eration. We also show the results using a N(0, 1002 cal yr2 )
that includes such random analytical error would be useless. kernel to illustrate the effects on gradient estimation and
In any case, Sarnthein et al. (2015) chose to keep the visual plateau identification in our simulated pseudo-atmospheric
inspection as their main tool: “we continued to base our cal- cores. This wider kernel will extend the effective width of the
culations of reservoir ages, our tuned calendar ages of plateau window in which we calculate the local gradient, using more
boundaries, and sedimentation rates on the boundary ages neighboring observations and performing more smoothing.
defined by visual inspection.”. In Sarnthein et al. (2020), it Further details are given in Sect. 3.7 and 3.8.
seems that eyeball inspection has been preferred again: in- Sarnthein et al. (2015) do not specify definite rules as to
deed Table 1 provides 14 C age plateaus obtained “by means either the choice of bandwidth (the standard deviation of
of visual inspection” in the target records (Lake Suigetsu the weighting kernel) to use when estimating the local gra-
varved sediments and Hulu cave stalagmites). dient within a record or the subsequent gradient threshold
Weninger (2021) advocates for the use of an alternative that defines a 14 C plateau. The subjectivity in these selec-
automated technique (a “summed probability distribution”) tions, which as we show makes a considerable difference to
proposed by Weninger and Edinborough (2020) for detect- the number and locations of plateaus, will always reduce the
ing plateaus in the 14 C record. Unfortunately, this paper does ability of PT to provide an objective approach. Indeed, as ex-
not provide the necessary mathematical details to reproduce plained in Sect. 3.5, Sarnthein et al. (2015) admit to a final
and test the proposed technique. It should also be noted that selection that is based upon agreement with their eye-balled
Weninger and Edinborough (2020) only claim the detection choices.
of 4 plateaus in the 24 to 14 kyr BP time window of IntCal20 Sarnthein et al. (2015) trialed two thresholds for the lo-
(see their Fig. 1), in contrast with the 11 plateaus named by cal gradient to determine a 14 C plateau. They state that a
Sarnthein et al. (2020) over the same period. value of 0 14 C yr (cal yr)−1 generated too many short poten-
tial plateau periods. In increasing the threshold value, these
3.6 Testing PT disconnected short time periods will tend to merge with one
another to create longer time periods. However, other discon-
To objectively assess the ability to reliably identify and tune nected time periods may simultaneously be introduced. Sarn-
14 C age plateaus in the context of the noisy and sparse 14 C thein et al. (2015) therefore also trialed increasing the thresh-
data currently available to us, we performed a simulation old to 1 14 C yr (cal yr)−1 which they suggest agreed better
study. For this study, we aimed to investigate two aspects: with their visual preferences. However, a time period with
firstly, can we reliably and robustly identify atmospheric a gradient of 1 14 C yr (cal yr)−1 is quite a distance from what
14 C age plateaus in data that are of comparable density and most would describe as a plateau. Indeed, a gradient of 1 is
precision to those from Lake Suigetsu (Bronk Ramsey et al., what the slope (14 C yr (cal yr)−1 ) should be without any per-
2020). Secondly, having simulated paired 14 C age and depth turbation of the radioactive decay. Nevertheless, in order to
data from a hypothetical marine core with comparable preci- test this issue, we now show our results alongside three po-
https://doi.org/10.5194/cp-17-1701-2021 Clim. Past, 17, 1701–1725, 2021You can also read