Merging regional and global aerosol optical depth records from major available satellite products - atmos-chem-phys.net
←
→
Page content transcription
If your browser does not render page correctly, please read the page content below
Atmos. Chem. Phys., 20, 2031–2056, 2020
https://doi.org/10.5194/acp-20-2031-2020
© Author(s) 2020. This work is distributed under
the Creative Commons Attribution 4.0 License.

Merging regional and global aerosol optical depth records from
major available satellite products
Larisa Sogacheva1 , Thomas Popp2 , Andrew M. Sayer3,4 , Oleg Dubovik5 , Michael J. Garay6 , Andreas Heckel7 ,
N. Christina Hsu8 , Hiren Jethva3,4 , Ralph A. Kahn8 , Pekka Kolmonen1 , Miriam Kosmale2 , Gerrit de Leeuw1 ,
Robert C. Levy8 , Pavel Litvinov9 , Alexei Lyapustin8 , Peter North7 , Omar Torres10 , and Antti Arola1
1 Finnish Meteorological Institute, Climate Research Programme, Helsinki, Finland
2 German  Aerospace Center (DLR), German Remote Sensing Data Center (DFD), Oberpfaffenhofen, Germany
3 Goddard Earth Sciences Technology And Research (GESTAR), Universities Space Research Association,

Columbia, MD, USA
4 NASA Goddard Space Flight Center, Greenbelt, MD, USA
5 Laboratoire d’Optique Atmosphérique, CNRS–Université Lille, France
6 Jet Propulsion Laboratory, California Institute of Technology, Pasadena, CA, USA
7 Department of Geography, Swansea University, Swansea, UK
8 Climate and Radiation Laboratory, Earth Science Division, NASA Goddard Space Flight Center, Greenbelt, MD 20771, USA
9 Generalized Retrieval of Atmosphere and Surface Properties SAS, Lille, France
10 Atmospheric Chemistry and Dynamics Laboratory, Earth Science Division,

NASA Goddard Space Flight Center, Greenbelt, MD 20771, USA

Correspondence: Larisa Sogacheva (larisa.sogacheva@fmi.fi)

Received: 10 May 2019 – Discussion started: 21 June 2019
Revised: 29 November 2019 – Accepted: 15 January 2020 – Published: 24 February 2020

Abstract. Satellite instruments provide a vantage point for      proaches lead to similar results, indicating the robustness and
studying aerosol loading consistently over different regions     stability of the merged AOD products. We introduce a grid-
of the world. However, the typical lifetime of a single satel-   ded monthly AOD merged product for the period 1995–2017.
lite platform is on the order of 5–15 years; thus, for climate   We show that the quality of the merged product is as least as
studies, the use of multiple satellite sensors should be con-    good as that of individual products. Optimal agreement of the
sidered. Discrepancies exist between aerosol optical depth       AOD merged product with AERONET further demonstrates
(AOD) products due to differences in their information con-      the advantage of merging multiple products. This merged
tent, spatial and temporal sampling, calibration, cloud mask-    dataset provides a long-term perspective on AOD changes
ing, and algorithmic assumptions. Users of satellite-based       over different regions of the world, and users are encouraged
AOD time-series are confronted with the challenge of choos-      to use this dataset.
ing an appropriate dataset for the intended application. In
this study, 16 monthly AOD products obtained from dif-
ferent satellite sensors and with different algorithms were
inter-compared and evaluated against Aerosol Robotic Net-        1   Introduction
work (AERONET) monthly AOD. Global and regional anal-
yses indicate that products tend to agree qualitatively on the   Interactions of atmospheric aerosols with clouds and radi-
annual, seasonal and monthly timescales but may be offset        ation are the largest source of uncertainty in modelling ef-
in magnitude. Several approaches were then investigated to       forts to quantify current climate and predict climate change
merge the AOD records from different satellites and create an    (IPCC, 2018). To reduce such uncertainties, we need obser-
optimised AOD dataset. With few exceptions, all merging ap-      vations to constrain climate models. However, these observa-
                                                                 tions must be accurately calibrated and validated, have con-

Published by Copernicus Publications on behalf of the European Geosciences Union.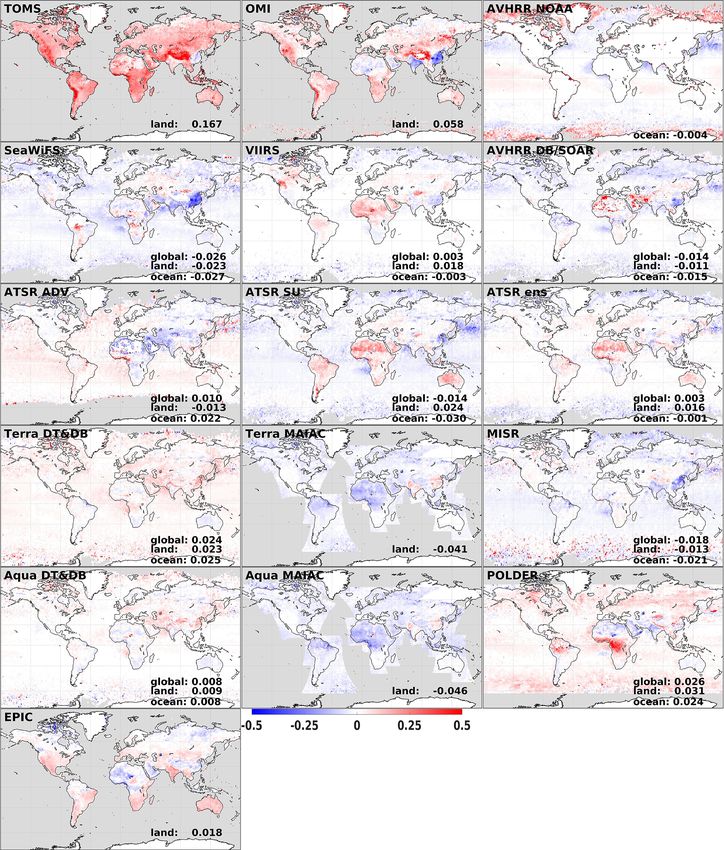
2032                                                  L. Sogacheva et al.: Merging regional and global satellite AOD records

sistent or at least well-characterised uncertainties, and pro-      or even between “identical” sensors, such as the Moderate
vide adequate temporal and spatial sampling over a long pe-         Resolution Imaging Spectroradiometers (MODISs) on Terra
riod of time. With their ability to cover the globe systemati-      and Aqua (Sayer et al., 2015; Levy et al., 2018) for which cal-
cally, satellites provide this global and temporal perspective.     ibration and time of day differences remain. Using different
Satellite observations have produced major advances in our          retrieval algorithms for products retrieved from the same in-
understanding of the climate system and its changes, includ-        struments introduces additional discrepancies, such as those
ing quantifying the spatio-temporal states of the atmosphere,       found by de Leeuw et al. (2015), Popp et al. (2016) for three
land and oceans, and aspects of the underlying processes.           Along Track Scanning Radiometer (ATSR) datasets.
However, as the typical lifetime of a single satellite platform        Differences can become larger when comparing products
is on the order of 5–15 years, a single sensor data record          from different sensors and algorithms (Kokhanovsky and de
may not be long enough to discern a climate signal (WMO,            Leeuw, 2009; Kinne, 2009; Li et al., 2014b). One other im-
2017). Moreover, aerosol products from different satellites         portant factor contributing to differences is related to the ap-
and algorithms all have limitations regarding their spatial and     proach to cloud masking, which affects the pixels selected for
temporal coverage and vary in their accuracies depending on         processing by retrieval algorithms and propagates into differ-
environmental conditions (aerosol loading and type, surface         ent levels of clear-sky bias in daily and monthly aggregates
brightness, and observation geometry), often leading to re-         (Sogacheva et al., 2017; Zhao et al., 2013; Li et al., 2009).
gional differences (e.g. Li et al., 2014b). Thus, the applica-      Escribano et al. (2017) estimated the impact of choosing dif-
tion of satellite observations for climate change studies re-       ferent AOD products for a dust emission inversion scheme
quires using products from multiple sources to derive consis-       and concluded that the large spread in aerosol emission flux
tent regional conclusions.                                          over the Sahara and Arabian Peninsula is likely associated
   The key parameter used for aerosol-related studies to date       with differences between satellite datasets. Similarly, Li et
is the aerosol optical depth (AOD), which is the vertical in-       al. (2009) concluded that differences in cloud-masking alone
tegral of extinction by aerosol particles through the atmo-         could account for most differences among multiple satellite
spheric column. Over the last several decades, AOD remote           AOD datasets, including several for which different algo-
sensing has been performed from space using a wide va-              rithms were applied to data from the same instrument.
riety of sensors that have different characteristics, includ-          There is no single “best” AOD satellite product globally.
ing being passive or active, operating in ultraviolet (UV) to       For example, the MODIS Deep Blue (DB) AOD product
thermal infrared (TIR) spectral regions, being single-view to       shows better performance than MODIS Dark Target (DT)
multi-view, being single-pixel to broad swath, having a sub-        in most regions, besides bright surfaces (i.e. deserts and
kilometre to tens-of-kilometres resolution, being intensity-        arid/semi-arid areas) (Wei et al., 2019a). However, despite
only or polarimetric, and having different orbits and obser-        the differences between satellite products and the fact that
vation time(s). Table 1 lists the datasets used in the current      none is uniformly most accurate (Sayer et al., 2014; de
study, together with key references. Aside from the Earth           Leeuw et al., 2015, 2018), the application of statistical tech-
Polychromatic Imaging Camera (EPIC; orbiting at L1 La-              niques such as principal component or maximum covariance
grange point directly between the Earth and the sun on the          analysis (Li et al., 2013, 2014a, b) shows that there are key
Deep Space Climate Observatory (DSCOVR) satellite), all             similarities among the AOD products tested.
sensors are in polar-orbiting, sun-synchronous low-earth or-           Merging multi-sensor AOD products holds the potential
bits ( ∼ 600–800 km). Only a few of these sensors were op-          to produce a more spatially and temporally complete and
timised for accurate aerosol property retrieval, and for many,      accurate AOD picture. With multiple observational datasets
AOD at one or more visible wavelengths is the only quan-            available, it is important to examine their consistency in rep-
titatively reliable aerosol parameter they provide. Table 1 is      resenting aerosol property variability in these dimensions.
not exhaustive for available AOD products. Other AOD prod-          This is useful for constraining aerosol parameterisations in
ucts such as those from active sensors such as the Cloud-           climate models (Liu et al., 2006), in the study of aerosol cli-
Aerosol Lidar with Orthogonal Polarization (CALIOP) and             mate effects (Chylek et al., 2003; Bellouin et al., 2005) and
imaging radiometers on geostationary satellites are not con-        for verifying global climate models (e.g. Kinne et al., 2003,
sidered here, as they have very different sampling charac-          2006; Ban-Weiss et al., 2014) in which satellite-retrieved
teristics (e.g. CALIOP profiles a curtain swath, with areas         AOD monthly aggregates are used.
either viewed twice daily and twice during the night during            However, such an integration into a coherent and consis-
a month or not at all; geostationary sensors sample a con-          tent climatology is a difficult task (Mishchenko et al., 2007;
stant disc, typical at a frequency of 10 min to 1 h); thus their    Li et al., 2009). There are only a few studies where an AOD
monthly mean products are conceptually very different from          record was merged from different satellites. Chatterjee et
polar-orbiters.                                                     al. (2010) describe a geostatistical data fusion technique that
   No two datasets provide identical results, whether apply-        can take advantage of the spatial autocorrelation of AOD dis-
ing the same algorithm principles to multiple similar sensors       tributions retrieved from the Multi-angle Imaging Spectrora-
(Sayer et al., 2017, 2019; S. Li et al., 2016; Levy et al., 2013)   diometer (MISR) and MODIS, while making optimal use of

Atmos. Chem. Phys., 20, 2031–2056, 2020                                              www.atmos-chem-phys.net/20/2031/2020/
L. Sogacheva et al.: Merging regional and global satellite AOD records                                                        2033

all available datasets. Tang et al. (2016) performed a spatio-          Based on the comparison with AERONET, we estimate
temporal fusion of satellite AOD products from MODIS and             how well the satellite AOD monthly aggregates reproduce
Sea-Viewing Wide Field-of-View Sensor (SeaWiFS) using                the AERONET AOD climatology. We considered areas with
a Bayesian maximum entropy method for eastern Asia and               different aerosol types, aerosol loading and surface types,
showed that, in the regions where both MODIS and Sea-                which are the dominant factors affecting AOD product qual-
WiFS have valid observations, the accuracy of the merged             ity. This allows users to choose the AOD product of a bet-
AOD is higher than those of the MODIS and SeaWiFS AODs               ter quality, depending on the area and research objective. A
individually. Han et al. (2017) improved the AOD retrieval           verification of open-ocean monthly data using the Maritime
accuracy by fusing MODIS and CALIOP data. Sogacheva                  Aerosol Network (MAN; Smirnov et al., 2009) is not pos-
et al. (2018b) combined ATSR and MODIS AOD to study                  sible in this way, because MAN data are acquired during
the trends in AOD over China between 1995 and 2017.                  cruises on ships of opportunity rather than as regular, repeat-
Naeger et al. (2016) combined daily AOD products from                ing observations at specific locations.
polar-orbiting and geostationary satellites to generate a near-         Different approaches for merging the AOD products (me-
real-time (NRT) daily AOD composite product for a case               dian, weighted according to the evaluation results) are intro-
study of trans-Pacific transport of Asian pollution and dust         duced in the current paper. AOD evaluation results are used
aerosols in mid-March 2014. J. Li et al. (2016) constructed a        to merge the L3 gridded monthly AOD data and AOD time
monthly mean AOD ensemble by combining monthly AOD                   series for the period 1995–2017, using different method-
anomaly time series from MODIS, MISR, SeaWiFS, Ozone                 ologies. The resulting AOD merged products are evaluated
Monitoring Instrument (OMI) and POLarization and Direc-              against AERONET and compared against one another.
tionality of the Earth’s Reflectances (POLDER) and apply-               This study grew out of discussions at annual AeroSat
ing an ensemble Kalman filter technique to these multi-              (https://aerosat.org, last access: 9 May 2019) meetings about
sensor and ground-based aerosol observations to reduce un-           how to move forward on the difficult topic of combining
certainties. Penning de Vries et al. (2015) examined rela-           distinct aerosol data records. AeroSat is a grass-roots group
tionships between the monthly mean AOD, Ångström expo-               of several dozen algorithm developer teams and data users.
nent (AE) from MODIS, UV Aerosol Index from the Global               Meeting in person around once a year in concert with its sib-
Ozone Monitoring Experiment–2 (GOME-2) and trace gas                 ling AeroCom group of aerosol modellers (https://aerocom.
column densities and showed the advantage of using multi-            mpimet.mpg.de, last access: 9 May 2019) allows an active
ple datasets with respect to characterising aerosol type. Boys       discussion between data providers and data users to highlight
et al. (2014) combined SeaWiFS and MISR AODs with the                developments, discuss current issues and open questions in
GEOS-Chem global model to create and study trends in a               the field of satellite aerosol remote sensing and aerosol mod-
15-year time series of surface particulate matter levels.            elling.
   A meaningful merge should account for the strengths and              The paper is organised as follows. In Sect. 2, the AOD
limitations of each constituent record. The spread of satel-         products and regions of interest are introduced. The main
lite AOD records also adds to the value of constraining their        principles and results for the statistical evaluation of in-
uncertainty; whereas a lack of diversity among datasets does         dividual monthly AOD retrievals are presented in Sect. 3.
not mean that they have converged on the true value, the ex-         Alternative methods for merging are discussed in Sect. 4.
istence of unexplained diversity does imply that they have           AOD merged products are introduced, evaluated and inter-
not.                                                                 compared with individual products in Sect. 5. Annual, sea-
   To assess their consistency, the products should be com-          sonal and monthly regional AOD time series are presented
pared during overlapping periods, because interannual and            and discussed in Sect. 6. A brief summary and conclusion
shorter-term variability in atmospheric aerosols can be sig-         are given in the final section.
nificant in some parts of the world (e.g. Lee et al., 2018). In
the current study, AOD monthly aggregates from 16 differ-
ent satellite products were evaluated with ground-based mea-         2     Regions of interest, instruments and AOD products
surements from the Aerosol Robotic Network (AERONET;
Holben et al., 1998). Note that, as with all measurements,           2.1    Regions of interest
even the AERONET spectral AOD has limitations as to
where it can be informative. For example, AERONET in-                There are huge regional differences in AOD loading types
cludes ∼ 450 active stations in 2019, offering far more spatial      (composition and optical properties), seasonality and surface
coverage than in 1993 when the network was founded, yet              reflectance (Holben et al., 2001; Dubovik et al., 2002; Pinty
even now AERONET spatial sampling is particularly limited            et al., 2011). Retrieval quality (accuracy, precision and cov-
in remote areas which are often those where aerosol gradi-           erage) varies considerably as a function of these conditions,
ents are large, e.g. near sources (e.g. Shi et al., 2011; J. Li et   as well as whether a retrieval is over land or ocean. There-
al., 2016).                                                          fore, this study focuses on surface-specific (land or ocean)
                                                                     and regional evaluation of these diverse aerosol products.

www.atmos-chem-phys.net/20/2031/2020/                                                 Atmos. Chem. Phys., 20, 2031–2056, 2020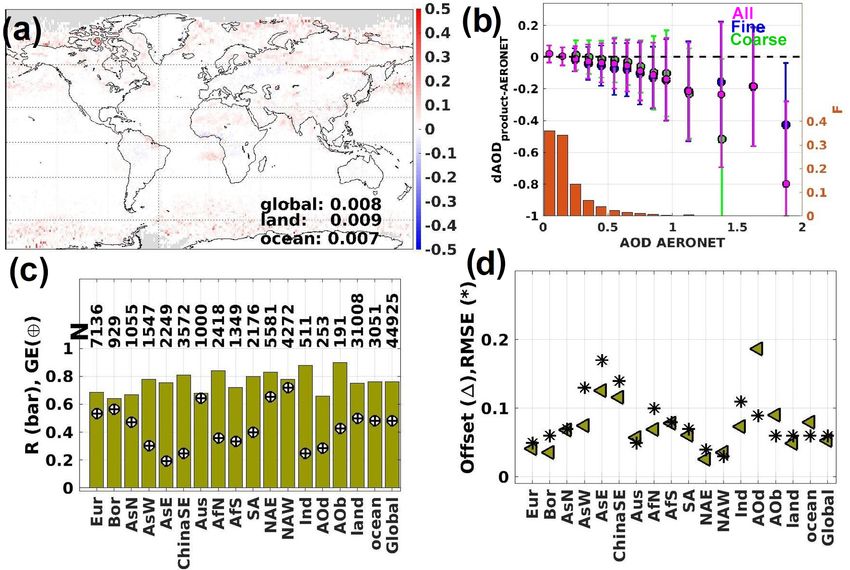
2034                                                L. Sogacheva et al.: Merging regional and global satellite AOD records

   In addition to evaluating AOD products AOD over land,         rithm were first corrected in their absolute values to agree on
over ocean and globally (note that not all sensor–algorithm      average with the mean error.
combinations retrieve over both surfaces), we chose 15 re-          For some products, AOD data are available for wave-
gions that seem likely to represent a sufficient variety of      lengths other than 0.55 µm. Specifically, Total Ozone Map-
aerosol and surface conditions (Fig. 1 and Table S1 in the       ping Spectrometer (TOMS) and OMI products include AOD
Supplement). These include 11 land regions, two ocean re-        at 0.50 µm, Advanced Very-High-Resolution Radiometer
gions and one heavily mixed region. The land regions repre-      (AVHRR) NOAA includes AOD at approximately 0.63 µm
sent Europe (denoted by Eur), Boreal (Bor), northern, eastern    (with slight variation between the different AVHRR sensors),
and western Asia (AsN, AsE and AsW, respectively), Aus-          and EPIC AOD is available at 0.44 µm (in the dataset used in
tralia (Aus), northern and southern Africa (AfN and AfS),        the current study). If the wavelength is not mentioned specif-
South America (AmS), and eastern and western Northern            ically, 0.55 µm is implicit.
America (NAE and NAW). The Atlantic Ocean is repre-                 In most cases the official AOD monthly products (typi-
sented as two ocean regions, one characterised by Saha-          cally referred to as Level 3 or L3 data), which correspond to
ran dust outflow over the central Atlantic (AOd) and a sec-      arithmetic means of daily mean data aggregated onto (typ-
ond that includes burning outflow over the southern Atlantic     ically) a 1◦ × 1◦ grid, have been used without further pro-
(AOb). The mixed region over Indonesia (Ind) includes both       cessing. The first exceptions are for AVHRR NOAA and
land and ocean. Due to documented large changes in AOD           POLDER, which provide very high AOD values poleward of
during the last 25 years (Sogacheva et al., 2018a, b), we also   ca. 60◦ and over Hudson Bay (50–70◦ N, 70–95◦ E), respec-
considered the south-eastern China (ChinaSE) subset of the       tively. The values are unrealistic, a likely a consequence of
AsE region.                                                      cloud and/or sea ice contamination. To eliminate those unre-
   The main body of the paper focuses on two regions, Eu-        alistic values, AOD values of > 0.7 have been removed over
rope and ChinaSE, and the big-picture results (global, all       the mentioned-above areas. Applying that limit decreased the
land and all ocean). The two regions, Europe and ChinaSE,        offset between the AVHRR NOAA product and other prod-
were chosen because they are often the focus of aerosol stud-    ucts but did not eliminate it (see Sect. S2 in the Supplement
ies. Results from the remaining regions are presented in the     for details). Additionally, MISR standard (0.5◦ × 0.5◦ reso-
Supplement.                                                      lution) and AVHRR NOAA (0.1◦ × 0.1◦ resolution) L3 AOD
                                                                 products were aggregated by simple averaging to 1◦ to match
                                                                 the other datasets.
2.2    Instruments, algorithms and AOD products
                                                                    Due to differences in instrument capabilities and swath
                                                                 widths (Table 1), the spatial and temporal data sampling
An overview of the instruments and AOD products included         available for calculating monthly averages varies consider-
in this study is presented in Table 1. AOD products from         ably among the satellite products. The ATSR products and
the same instruments retrieved with different algorithms are     MISR have narrow swaths and generally provide only a few
named in the paper with the instrument and retrieval algo-       days with retrievals per month, whereas most of the rest see
rithms, e.g. ATSR dual-view (ADV), ATSR Swansea Uni-             the whole planet roughly every day or two so that their cover-
versity (SU), Terra Dark Target (DT) & Deep Blue (DB) and        age is mostly limited by, e.g. the persistence of cloud cover.
Terra MAIAC (multi-angle implementation of atmospheric           As mentioned previously, EPIC is a special case, as it pro-
correction). When both Terra and Aqua are considered, we         vides moving snapshots of the day-lit portion of the Earth, up
call them together as MODIS DT&DB or MODIS MAIAC.                to several times per day, as distinct from overpasses at only
Note that we used the merged MODIS Dark Target and Deep          specific local solar equatorial crossing times for the sensors
Blue product (Sayer et al., 2014; denoted “DT&DB”), rather       on polar-orbiting satellites. Further, TOMS and OMI have a
than the results of the individual DB and DT algorithms, as      notably coarser pixel resolution than the others, so their cov-
this merged dataset was introduced into the product for sim-     erage and quality are more sensitive to cloud masking de-
ilar purposes as the one explored in this work. An ensem-        cisions. Some datasets provide measures of internal diver-
ble ATSR product (ATSR_ens) was generated from the three         sity (e.g. standard deviation), but none currently provides es-
ATSR products (ATSR ADV, ATSR SU and ATSR ORAC                   timates of the monthly aggregate uncertainty against some
– ATSR with the optimal retrieval of aerosol and cloud algo-     standard, which would be a combination of (both systematic
rithm) in order to combine the strengths of several algorithms   and random) retrieval uncertainties and sampling limitations.
and to increase the coverage of the combined product (Kos-       This is an area currently being investigated by AeroSat due
male et al., 2020). The ensemble was calculated per pixel as     to the wide use of L3 products.
the weighted mean of the individual algorithm values with           For the intercomparison between AOD products, we chose
weights given by the inverse of the individual pixel level un-   three “reference” years:
certainty values. The ensemble algorithm required as a mini-
mum for each pixel to have valid results from at least two of      – 2000, when the AOD products from TOMS, AVHRR
the contributing algorithms. The uncertainties in each algo-         NOAA, SeaWiFS, ATSR-2, MODIS Terra and MISR

Atmos. Chem. Phys., 20, 2031–2056, 2020                                           www.atmos-chem-phys.net/20/2031/2020/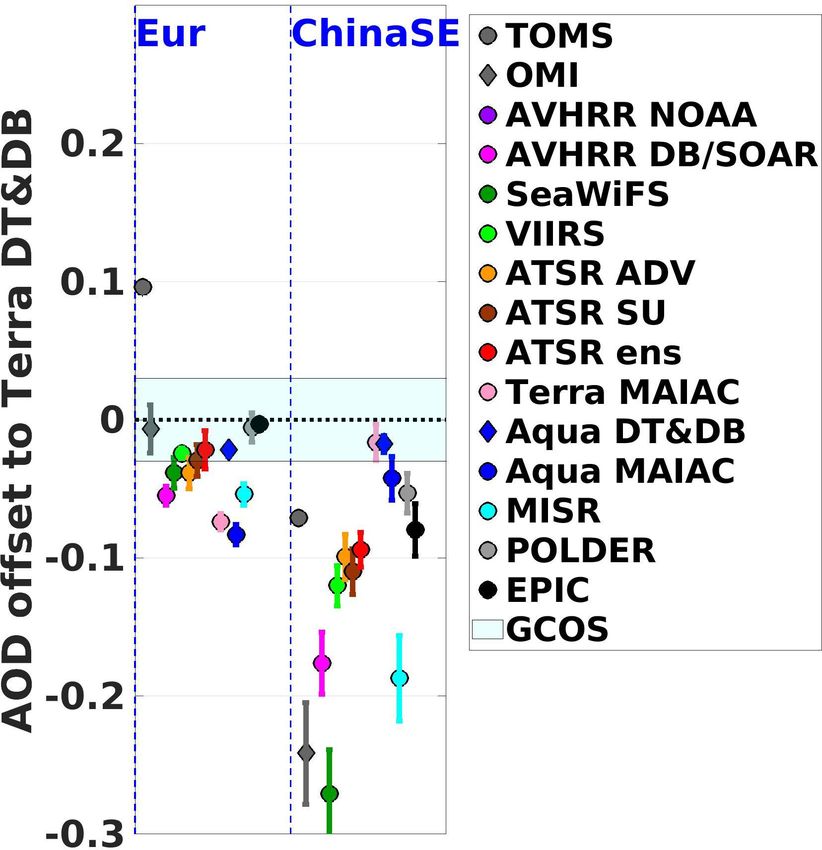
L. Sogacheva et al.: Merging regional and global satellite AOD records 2035
Figure 1. Fifteen land and ocean regions defined in this study: Europe (Eur), Boreal (Bor), northern Asia (AsN), eastern Asia (AsE), western
Asia (AsW), Australia (Aus), northern Africa (AfN), southern Africa (AfS), South America (SA), eastern North America (NAE), western
North America (NAW), Indonesia (Ind), Atlantic Ocean dust outflow (AOd) and Atlantic Ocean biomass burning outflow (AOb). In addition,
south-eastern China (ChinaSE), which is part of the AsE region, marked with a blue frame, is considered separately. Land, ocean and global
AOD were also considered.
are available (for the full year, except for MISR and AOD retrieval leads to a low bias in monthly AOD. To further
MODIS Terra, which were available from March to De- reveal differences among the AOD products retrieved with
cember); different algorithms and applied to different satellites, the
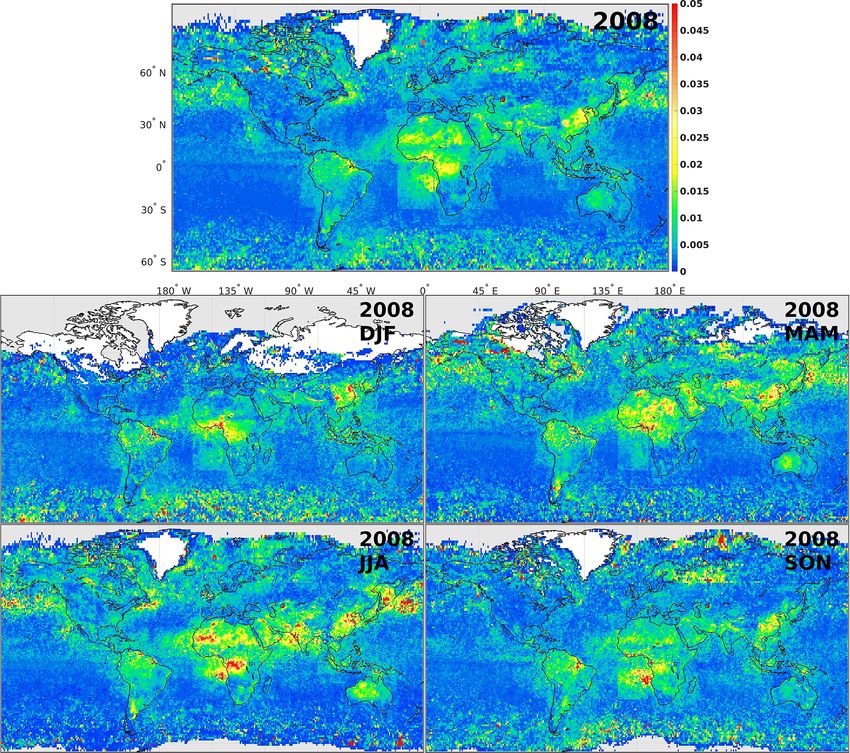
diversity of the satellite annual mean AOD for years 2000,
– 2008, when the AOD products from Advanced ATSR 2008 and 2017 is discussed in Sect. S3 (Figs. S3 and S4).
(AATSR), MODIS Terra and Aqua, MISR, AVHRR The diversity is lower in 2017, when only MODIS, MISR,
NOAA, AVHRR DB/SOAR (Satellite Ocean Aerosol EPIC and VIIRS AOD products are available.
Retrieval), SeaWiFS and POLDER are available; and
– 2017, when the AOD products from MODIS Terra 3.1 Evaluation of monthly AOD
and Aqua, MISR, VIIRS (Visible Infrared Imaging Ra-
diometer Suite) and EPIC are available. To evaluate the quality of any AOD product, the verifica-
tion of the product against more accurate reference measure-
For products with no coverage over ocean (TOMS, OMI and
ments, where possible, is obligatory. Ground-based measure-
MAIAC products) or land (AVHRR NOAA), global AOD
ments such as those from AERONET (cloud screened and
was not considered.
quality assured Version 3 Level 2.0; Giles et al., 2019) pro-
vide highly accurate measures of AOD that are widely used
3 AOD products intercomparison and evaluation with as ground truth for the validation of satellite AOD data. Ex-
AERONET tensive L2 AOD validation has been performed for different
aerosol products.
The AOD deviations of the individual products from the me- However, climate model evaluation is often performed on
dian AOD (Figs. S1 and S2 in the Supplement) are discussed monthly scales. Thus, climate analysis begs for evaluation
in detail in the Supplement (Sect. S2). These show regional of satellite AOD monthly aggregates (Nabat et al., 2013;
differences, even for products retrieved from the same instru- Michou et al., 2015; S. Li et al., 2016). Only a few at-
ments with similar algorithm. Both negative and positive de- tempts have been made to evaluate AOD monthly aggre-
viations are observed in regions with high AOD; both aerosol gates retrieved from satellites (e.g. Li et al., 2014b, Wei et
optical model assumptions and surface type are also likely al., 2019b). This is because verification of the L3 monthly
to influence the AOD retrieval. High AOD might, in turn, be aggregate satellite AOD is not a true validation (and note the
wrongly screened as cloud, and thus the resulting lack of high use of “evaluation” and “verification” here instead of “valida-
www.atmos-chem-phys.net/20/2031/2020/ Atmos. Chem. Phys., 20, 2031–2056, 2020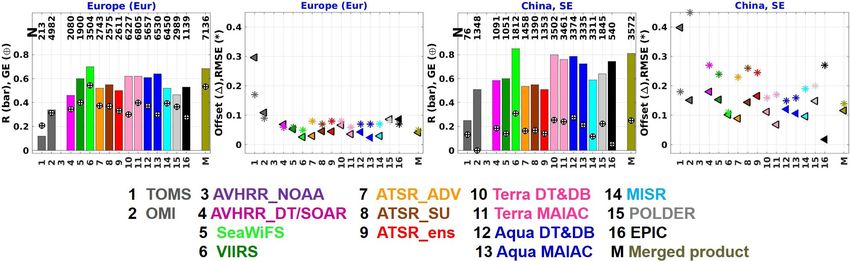
2036                                                             L. Sogacheva et al.: Merging regional and global satellite AOD records

Table 1. Overview of the sensors, data records and AOD algorithms discussed in this paper. For the products availability, see Table 4.

 Sensor(s)                          Coverage and L3 grid       Algorithm version            Algorithm principles                 References
                                    size
 Total Ozone Mapping Spec-          1979–1993 and 1996–        Nimbus-7/TOMS:               Enhanced sensitivity of TOA          Torres et al. (1998, 2005)
 trometer (TOMS) (UV spec-          2001; 3100 km swath;       N7AERUV     v.   0.4.3;      (top of the atmosphere) spectral
 trometer)                          1◦ ; daily and monthly     EP/TOMS:     EPAERUV         reflectance in the UV to aerosol
                                                               v. 0.1.3.                    extinction and absorption.
 Advanced            Very-High-     1981–2017; 2900 km         AVHRR NOAA                   Single-channel retrieval of          Ignatov and Stowe (2002) Hei-
 Resolution          Radiometer     swath; 0.1◦ ; daily and                                 aerosol optical depth; over          dinger et al. (2002), Zhao et
 (AVHRR)                            monthly                                                 ocean only.                          al. (2008)
 (bispectral, single-view, broad-   1989–1991 (NOAA7),         Deep Blue/SOAR, V. 4         Land: surface modelled using         Hsu et al. (2017), Sayer et
 swath radiometer)                  1995–1999 (NOAA14)                                      database or NDVI (normalised         al. (2017)
                                    and         2006–2011                                   difference vegetation index).
                                    (NOAA18); 0.5 and 1◦ ;                                  Ocean: bispectral simultaneous
                                    daily and monthly                                       retrieval.
 Along Track Scanning Ra-           1995–2003 (ATSR-2)         ADV/ASV                      Land: spectral constant re-          Flowerdew and Haigh (1995),
 diometer (ATSR-2) and Ad-          and 2002–2012              v2.31                        flectance ratio.                     Veefkind et al. (1998), Kolmo-
 vanced ATSR (AATSR), both          (AATSR);                                                Ocean: modelled reflectance.         nen et al. (2016), Sogacheva et
 called as ATSR                     512 km swath; 1◦ ; daily                                                                     al. (2017)
                                    and monthly
 (dual-view radiometer in the                                  SU v4.3                      Iterative model inversion for        North et al. (1999), North
 visible and near-infrared; ther-                                                           continuous retrieval of AOD          (2002), Bevan et al. (2012)
 mal infrared for cloud)                                                                    and FMF. Land: retrieval of
                                                                                            BRDF parameters. Ocean: prior
                                                                                            reflectance model.
                                                               ORAC v4.01 (in current pa-   Optimal estimation.                  Thomas et al. (2009), Sayer et
                                                               per, as a part of the ATSR   Land: SU surface parametriza-        al. (2010)
                                                               ensemble only)               tion.
                                                                                            Ocean: sea surface reflectance
                                                                                            model.
                                                               ATSR ensemble v. 2.7         Uncertainty-weighted mean of         Kosmale et al. (2020)
                                                                                            ATSR2/AATSR baseline algo-
                                                                                            rithms ADV, ORAC and SU.
 Sea-viewing     Wide    Field-     1997–2010;                 Deep Blue/SOAR               Land: surface modelled using         Sayer et al. (2012a, b), Hsu et
 of-view Sensor (SeaWiFS)           1502 km swath; 0.5 and     V.1                          database or NDVI.                    al. (2004, 2013a)
 (multispectral,   single-view,     1◦ ; daily and monthly                                  Ocean: multispectral simulta-
 broad-swath radiometer)                                                                    neous retrieval.
 Multi-angle Imaging Spec-          2000–present; 380 km       Standard algorithm (SA)      Land: surface contribution es-       Martonchik et al. (2009), Garay
 troRadiometer          (MISR)      swath; 0.5◦ ; daily and    V23                          timated by empirical orthogo-        et al. (2017, 2019), Witek et
 (multispectral,   with     four    monthly                                                 nal functions and assumption of      al. (2018), Kahn et al. (2010)
 bands,    visual–near-infrared,                                                            spectral shape invariance.
 multi-angle, i.e. nine angles,                                                             Ocean: two-band (red, NIR) re-
 radiometer)                                                                                trieval using cameras not af-
                                                                                            fected by sun glint.
                                                                                            Both: lookup table with 74 mix-
                                                                                            tures of 8 different particle dis-
                                                                                            tributions.
 Moderate Resolution Imaging        Terra: 2000–present;       DT&DB                        DT: surface is function of wind      DT: Levy et al. (2013, 2018),
 Spectroradiometer (MODIS)          Aqua: 2002–present;        C6.1                         speed (ocean) or parameter-          Gupta et al. (2016)
 Terra and Aqua (multispec-         2300 km swath; 1◦ ;                                     ized spectral relationship (land–    DB: Hsu et al. (2013a, 2019)
 tral, single-view, broad-swath     daily, 8 d and monthly                                  vegetation/dark soil).               DT&DB: Levy et al. (2013),
 radiometer)                                                                                DB: database and spectral rela-      Sayer et al. (2014)
                                                                                            tions of surface reflectance.
                                                               MAIAC V6                     Simultaneous retrieval of sur-       Lyapustin et al. (2018)
                                                                                            face and aerosol from time se-
                                                                                            ries of observations.
 Ozone Monitoring Instrument        2004–2016; 2600 km         OMAERUV v. 1.8.9.1           Enhanced sensitivity of TOA          Jethva and Torres (2011), Tor-
 (OMI) (UV spectrometer)            swath; 1◦ ; daily and                                   spectral reflectance to UV           res et al. (2007, 2013, 2018)
                                    monthly                                                 aerosol extinction and absorp-
                                                                                            tion.

Atmos. Chem. Phys., 20, 2031–2056, 2020                                                                  www.atmos-chem-phys.net/20/2031/2020/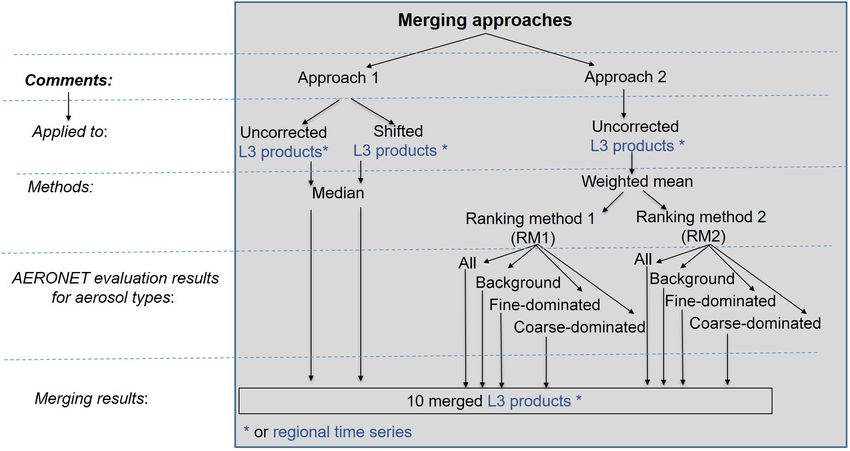
L. Sogacheva et al.: Merging regional and global satellite AOD records                                                                               2037

Table 1. Continued.

 Sensor(s)                         Coverage and L3 grid      Algorithm version          Algorithm principles               References
                                   size
 Polarization and Directional-     Dec 2004–Dec 2013         GRASP v.1                  Simultaneous retrieval of sur-     Dubovik et al. (2011, 2014,
 ity of the Earth’s Reflectances   2100 km × 1600 km                                    face and aerosol in frame of       2019)
 (POLDER) 3 (multispectral,        swath;    1◦ ;   daily,                              multi-pixel approach: statisti-
 multi-angle polarimeter)          monthly and seasonally                               cally optimised fitting of large
                                                                                        pixels groups (aggregated in
                                                                                        time and space); the aerosol is
                                                                                        assumed as an external mixture
                                                                                        of several predefined aerosol
                                                                                        components.
 Visible Infrared Imaging Ra-      2012–present; 3040 km     Deep Blue/SOAR, V.1        Land: surface modelled using       Sayer et al. (2018a, b, 2019),
 diometer Suite (VIIRS) (mul-      swath; 1◦ ; daily and                                database or spectral relation-     Hsu et al. (2019)
 tispectral, single-view, broad-   monthly                                              ship.
 swath radiometer)                                                                      Ocean: multispectral simulta-
                                                                                        neous retrieval.
 Earth Polychromatic Imaging       2015–2016; 1◦ ; daily     MAIAC V1                   Simultaneous retrieval of sur-     Huang et al. (2020)
 Camera (EPIC) (multispectral      and monthly                                          face and aerosol from time se-
 radiometer orbiting at Lagrange                                                        ries of observations.
 point)

tion”). AERONET provides AOD at a single point and is not                        the aggregate is calculated is also important; AOD distribu-
necessarily representative of AOD in a 1◦ × 1◦ grid. While                       tions on monthly scales are often closer to lognormal than
AERONET samples during all cloud-free daylight hours, a                          normal, which suggests that the arithmetic monthly mean
given polar-orbiting sensor will only report once per day and                    may not be the most appropriate summary metric (O’Neill
at the same time each day (e.g. 13:30 LT for sensors in the A-                   et al., 2000; Sayer and Knobelspiesse, 2019). The discrep-
Train). The possible spatial representativity issues associated                  ancies between different statistics can be exacerbated when
with this latter point are a topic of current investigation (e.g.                a dataset provides poor sampling of the extreme conditions.
J. Li et al., 2016; Virtanen et al., 2018; Schutgens, 2019).                     Nevertheless, as it is the most widely used statistic within the
Nevertheless, AERONET’s instantaneous AOD uncertainty                            community and is the standard output of current L3 products,
(around 0.01 in the mid-visible; Eck et al., 1999) is signif-                    monthly means are presented in this analysis. The general
icantly lower than most satellite products, and its temporal                     framework could be applied to other AOD summary statis-
sampling is much more complete. As such, it remains a use-                       tics (e.g. monthly median or geometric mean, advocated by
ful source for evaluating these L3 products, and for this pur-                   Sayer and Knobelspiesse, 2019) if these L3 outputs become
pose we compare AOD monthly aggregates of all available                          more widely available in the future.
data from both AERONET and each satellite product. Devi-                             In the evaluation exercise, AERONET monthly mean
ations between satellite and AERONET monthly aggregates                          AOD and AE (which describes how AOD depends on wave-
are expected, e.g. due to differences in satellite spatial and                   length and is sometimes used as a proxy for aerosol type)
temporal sampling (Sect. 2.2, Table 1), particularly for those                   were calculated from AERONET daily means. AOD verifi-
satellites with lower coverage.                                                  cation was performed for all available AERONET monthly
   Results from this comparison have limitations. As men-                        data and separately for different aerosol types, which were
tioned previously, AERONET provides data over certain lo-                        defined with AOD and AE thresholds. Although these thresh-
cations within a grid cell, whereas satellites cover a larger                    olds are subjective, we consider “background aerosol” to
fraction of the area of a grid cell (depending on sampling                       be cases where AOD < 0.2, “fine-dominated” to be where
and cloud cover). So, for example, if AERONET is likely                          AOD > 0.2 and AE > 1, and “coarse-dominated” to be cases
to miss extreme high values (localised plumes missing an                         where AOD > 0.2 and AE < 1 (e.g. Eck et al., 1999). This
AERONET station), that will result in AERONET showing                            classification has also been used by e.g. Sayer et al. (2018b)
lower AOD than from a satellite. Conversely, if a station hap-                   and Sogacheva et al. (2018a, b). The annual and seasonal
pens to be directly under an aerosol plume and the satellite                     maps of prevailing aerosol type for AERONET locations,
algorithm filters as a cloud, the AERONET value would be                         calculated from the AERONET data available for the period
higher.                                                                          of 1995–2017, are shown in Fig. S5. Such a classification
   Neither AERONET nor satellite monthly AOD aggregates                          differentiates major aerosol scenarios. The biomass burning
are true monthly AOD values. When we refer to “AOD                               seasons over the Amazon and South Africa are clearly iden-
monthly aggregate” we mean the daytime, cloud-free AOD                           tified by a domination of the fine aerosol particles in JJA
monthly aggregated from whatever data are available. How                         (June, July, August) and SON (September, October, Novem-

www.atmos-chem-phys.net/20/2031/2020/                                                              Atmos. Chem. Phys., 20, 2031–2056, 2020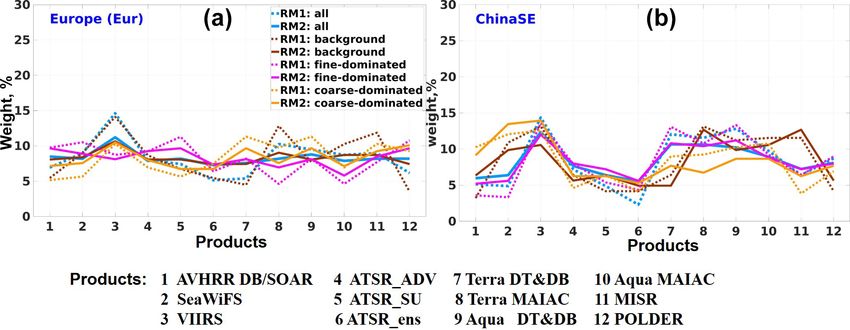
2038                                                 L. Sogacheva et al.: Merging regional and global satellite AOD records

ber), and the Asian dust transport season in MAM (March,
April, May) is clearly coarse dominated. As the deviation
of each satellite product from the median has regional com-
ponents (Figs. S1 and S2). Even though we tried to choose
regions with (somewhat) homogeneous aerosol conditions
during a given season, AOD conditions (and thus algorithm
performance) might vary within the regional AERONET sta-
tions, which may represent different aerosol/surface condi-
tions within one study regions, may have different record
lengths. To keep similar weighting for each station in a re-
gion, we first calculated statistics for each AERONET station
separately and then calculated the regional median validation
statistics from all available stations.
   To reveal how retrieval quality depends on AOD load-
ing, offsets between AERONET AOD and satellite product
AOD were estimated for binned AERONET AOD, and the
                                                                   Figure 2. Difference between Terra DT&DB and AERONET
number of observations in each AOD bin is reported. Cor-           monthly AOD for selected AOD bins: median bias (circles), bias
relation coefficient (R, Pearson correlation), offset (satellite   standard deviation (error bars) for all AOD types (purple), back-
product−AERONET), root-mean square error (RMSE) and                ground aerosol (purple; AOD ≤ 0.2), fine-dominated AOD (blue)
fraction of points that fulfil the Global Climate Observing        and coarse-dominated AOD (green) The fraction (F) of points in
System (GCOS) uncertainty goals (GE) of the larger of 0.03         each bin is represented by orange bars. For all individual products
or 10 % of AOD (GCOS, 2011) are also reported.                     see Fig. S6.
   These monthly AOD verification results are used to calcu-
late weights for each satellite dataset in one of the merging
approaches later in Sect. 4.2.
                                                                   tion) are critical in evaluation of monthly products, as ex-
                                                                   pected but are not the only factor influencing the evaluation
3.1.1   Binned offset global evaluation
                                                                   results.
As an example, AOD-binned evaluation results are shown in
Fig. 2. for Terra DT&DB and in Fig. S6 for all products.           3.1.2   AOD evaluation over selected regions
A general tendency towards positive satellite-retrieved AOD
offsets is observed for most products under background con-        Due to differences in instrument specifications and retrieval
ditions. On average, 70 %–80 % of monthly AODs fall into           approaches, the performance of retrieval algorithms depends
class “background” (AOD ≤ 0.2), so total AOD mean biases           largely on aerosol type, aerosol loading and surface proper-
are expected to have similar behaviour. TOMS and OMI have          ties at certain locations (e.g. Sayer et al., 2014). In this sec-
the highest positive offsets globally, which is in line with the   tion we show the evaluation results for AOD products in two
results from the dataset spatial intercomparison (Sect. S2).       selected regions: Europe and ChinaSE (Fig. 3). Results for
Offsets close to 0 for background AOD are observed for the         all regions are shown in Fig. S7. For each region, statistics
MODIS MAIAC products.                                              (R, % of points in GE, offset and RMSE) for all 16 products
   For most products, except MODIS DT&DB, AOD offsets              are combined into one subplot. The merged AOD product M
become negative for AOD > 0.2 (fine- and coarse-dominated          is introduced in Sect. 5.2; evaluation results for that product
aerosol types) with increasing amplitude (up to 0.2–0.5) to-       are summarised in Sect. 5.2.1.
wards highest AOD values. MODIS DT&DB show the low-                   Algorithm performance over Europe is similar for most
est offsets for 0.2 < AOD < 1. Offsets for VIIRS are close         products, with an R of 0.55–0.65, 45 %–55 % of the pixels
to 0 for AOD < 0.5 and reach ca. 30 % of AOD at AOD ≈ 1.           in the GE, an offset of 0.05–0.1 and RMSE of ∼ 0.1. For
For the current MISR standard product, AOD is systemat-            TOMS and OMI, the performance of each is slightly worse
ically underestimated for AOD >∼ 0.5; this is largely due          than for other products in Europe. In ChinaSE, the offset
to treatment of the surface boundary condition at high AOD         (0.1–0.2) and RMSE (0.2–0.3) are considerably higher than
(Kahn et al., 2010) and is addressed in the research aerosol       in Europe, and fewer pixels fit within the GE (15 %–30 %).
retrieval algorithm (Garay et al., 2019; Limbacher and Kahn,       This is likely due to a combination of high AOD loading and
2019). Except for TOMS and Terra MAIAC, offsets are                accompanying high uncertainty in the products, indicated by
smaller for coarse-dominated AOD.                                  high variability in aerosol composition and surface proper-
   AOD products retrieved from satellites having better cov-       ties. In Indonesia and for the biomass burning outflow over
erage show a better agreement with AERONET monthly ag-             the Atlantic, the MODIS and MISR products show a better
gregates. Thus, sampling differences (swath and pixel selec-       agreement with AERONET than the ATSR-family products.

Atmos. Chem. Phys., 20, 2031–2056, 2020                                              www.atmos-chem-phys.net/20/2031/2020/
L. Sogacheva et al.: Merging regional and global satellite AOD records 2039
Several products which use different surface treatment 4 AOD merging approaches
(ATSR SU, MODIS-family and MISR) show a similarly
higher R over AfN, an area of high surface reflectance. How- Here, 12 AOD products (all available at 0.55 µm) were used
ever, a high R does not imply that performance is better, only to create a merged AOD product for the period of 1995–2017.
that variations in AOD are captured better. Other statistics The temporal availability of the AOD products is shown in
(number of pixels within GE, offset and RMSE) in AfN are Table 2 (counting cases of partial coverage of a dataset during
worse compared with those in Europe. a year as available).
Overall, no single product has the best statistics for all We tested two broad approaches for merging, summarised
metrics and regions. Retrievals tend to perform well in ar- in Fig. 5. In the first, the median AODs from the available
eas with darker (more vegetated) surfaces and where aerosol (10 globally and two over land) individual uncorrected and
type is less variable over time. In these cases, biases are small offset-adjusted (shifted to a common value) products were
and retrieval uncertainties are often better than the GE, track- calculated (approach 1, Sect. 4.1 for details). In the sec-
ing temporal AOD variability well but with a tendency to ond approach, AOD-weighted means were created where the
underestimate high-AOD events. In more complex tropical weights for individual products were derived from the eval-
environments, data should be used with greater caution, as uation with the AERONET through two different ranking
there is a greater tendency to underestimate AOD. However, methods (see approach 2 in Sect. 4.2 for details). The same
correlation often remains high, suggesting a good ability to merging scheme was applied to the L3 uncorrected products
identify monthly AOD variations, despite this underestima- (Sect. 2.2) and regional time series (Sect. 3.1) yielding 10
tion. merged AOD products and 10 merged regional time series.
To achieve best estimates of the regional AOD by merg-
3.2 AOD time series ing multi-sensor monthly AOD data, the systematic and ran-
dom components of uncertainties within each product should
In order to move towards consistency in regional and global be considered explicitly. However, this cannot yet be done;
AOD records derived from multiple satellites using different only some of the L2 products used to create the L3 monthly
sensors and retrieval techniques, this section examines an- products contain pixel-level propagated or estimated uncer-
nual regional AOD time series obtained from the different tainties, and their associated propagations to L3 products
products. (together with other contributions from e.g. sampling lim-
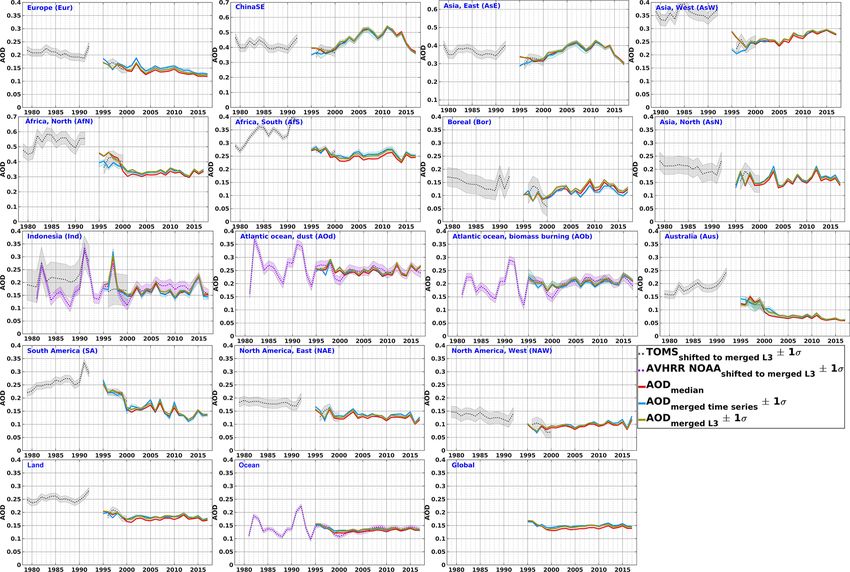
Besides the positive offset for TOMS and OMI (Figs. S1, itations) have not yet been quantified robustly. The analysis
S2, S6 and S7), consistent temporal patterns are observed, herein therefore represents an initial effort in the absence of a
and similar interannual AOD variability is tracked by all full uncertainty budget. Uncertainties for the chosen merged
datasets (Figs. 4 and S8). AOD peaks in Europe in 2002, L3 product (details are discussed in Sect. 5.2.2) were esti-
in ChinaSE in 2006/2007, 2011 and 2014, (possibly related mated as the root-mean-squared sum of the deviations be-
to changes in anthropogenic emissions; Sogacheva et al., tween the chosen merged product and either the median from
2018a, b). Relative AOD peaks over the Atlantic dust area the all uncorrected products (approach 1) or each of the other
in 1998, 2012 and 2015 (Peyridieu et al., 2013), and obvious seven merged products (approach 2).
AOD peaks in Indonesia related to the intensive forest fires
in 1997, 2002, 2006 and 2015 (Chang et al., 2015; Shi et al., 4.1 Approach 1: AOD median for uncorrected and
2019) are clearly seen. offset-adjusted (shifted) AOD products
However, significant regional offsets between products ex-
ist, which are largest in regions with high aerosol load- The mean (arithmetic average) value, although commonly
ing. Over ChinaSE, MODIS-family products show higher used in climate studies, is not generally equal to the most
monthly AOD compared to all others. Over AfN, ATSR frequently occurring value (the mode) and may not reflect the
SU and ATSR_ens reach higher monthly aggregated AOD central tendency (the median) of strongly asymmetrical dis-
than the MODIS-family products, whereas comparisons with tributions such as those that can be found for AOD (O’Neill
AERONET are similar for ATSR and MODIS (with slightly et al., 2000; Sayer and Knobelspiesse, 2019). Although the
higher RMSE for ATSR by 0.05); differences are likely tied central limit theorem implies that this should be less of an
to the small number of stations in this region. A large off- effect when making an estimate of the mean AOD from a
set between MODIS and ATSR is revealed over Australia cluster of AOD datasets (i.e. a merged time series), in prac-
(Fig. S8). tice this is unlikely to be fully the case because the differ-
AOD annual cycles for individual products for the ent datasets are not independent estimates of the underly-
year 2008 are discussed in Sect. S8. As in the annual time ing AOD field. This is because they are made with sensors
series (Figs. 4 and S8), the annual AOD cycles are similar and techniques which are not independent (i.e. typically sim-
between the products (Fig. S9), with more pronounced devi- ilar spectral/spatial bands and sampling limitations) and may
ations in areas of high AOD. have different bias characteristics. Further, by itself, the mean
does not provide any information about how the observations
www.atmos-chem-phys.net/20/2031/2020/ Atmos. Chem. Phys., 20, 2031–2056, 2020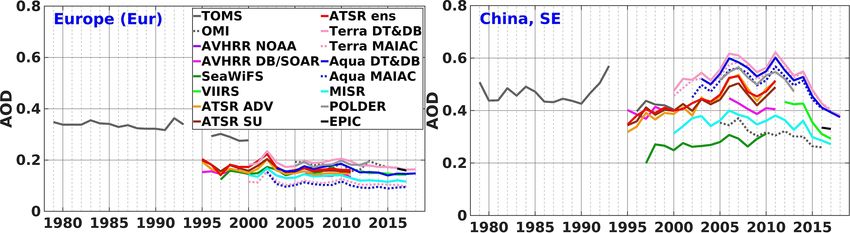
2040                                                      L. Sogacheva et al.: Merging regional and global satellite AOD records

Figure 3. AERONET evaluation statistics for Europe and ChinaSE: correlation coefficient R, bar, and fraction of pixels satisfying the GCOS
requirements, GE, ⊕; offset (satellite product−AERONET), 1, and root-mean-square error RMSE, *. Shown for AOD monthly aggregates
for each product (1 : 16; legend for products below the plot) and the L3 merged product (M; approach 2 with RM2 for all aerosol types; for
details see Sect. 4.2) with corresponding colours (legend) for the selected regions (as in Fig. 1). N is the number of matches with AERONET.
Note, for products that do not provide the global coverage (e.g. no retrieval over oceans), the results are missing. For all studied regions, see
Fig. S7.

Figure 4. Annual AOD time series from different products (see legend) for Europe and ChinaSE. For all selected regions see Fig. S8.

are scattered, whether they are tightly grouped or broadly                 face area in northern Africa, AVHRR DT/SOAR, VIIRS,
spread out. Thus, we study the median (which is more robust                ATSR SU and ATSR ensemble show high (0.05–0.1) posi-
in the presence outliers which might be caused by a poorly                 tive bias. Also, all ATSR products are biased high in Aus-
performing algorithm in a certain region) and standard devi-               tralia and South America. Thus, the median for the offset-
ations (as a metric of diversity) between the products chosen              adjusted product is expected to be positive biased. For de-
for merging.                                                               tails, see Sect. 5.1, where evaluation results for the AOD
   As shown in Sect. 3, the AOD time series of different prod-             products merged with different approaches are discussed.
ucts display highly consistent temporal patterns, albeit with                 With the shifted median merging approach, each AOD
spatiotemporally varying offsets (Figs. 4, S8 and S9). We use              product was shifted on a regional basis, based on its regional
the Terra DT&DB product as a reference to estimate the av-                 offset with respect to Terra DT&DB (Sect. 5.2). The median
erage offsets between products, because its time period over-              and standard deviation of AOD time series were then derived
laps with each AOD product considered in the current study.                from these 10 shifted and Terra DT&DB data records.
   Means and standard deviations of the offsets for all in-
dividual products from the Terra DT&DB AOD are shown                       4.2     Approach 2: weighted AOD
in Fig. 6 for Europe and ChinaSE and in Fig. S10 for all
selected regions. Offset magnitudes and their variations de-               4.2.1    Method
pend on AOD loading; offsets are typically higher for high
AOD. Over land, ocean and thus globally, the offset is nega-               As shown in Sect. 3.1, the products differ in the degree to
tive relative to Terra DT&BD for most of the products. This                which each represents the AERONET values on the monthly
includes Europe and ChinaSE. However, over the bright sur-                 scale. Our second approach is a weighted mean AOD, where

Atmos. Chem. Phys., 20, 2031–2056, 2020                                                       www.atmos-chem-phys.net/20/2031/2020/
L. Sogacheva et al.: Merging regional and global satellite AOD records                                                             2041

Table 2. Availability and coverage of the AOD products for merging for each year in the period 1995–2017. N : annual number of available
products.

 Year     AVHRR      SeaWiFS     VIIRS    ATSR     ATSR      ATSR       Terra     Terra      Aqua      Aqua     MISR     POLDER      N
         DT/SOAR                          ADV       SU      ensemble   DT&DB     MAIAC      DT&DB     MAIAC
           global      global    global   global   global    global     global    land       global    land     global    global
 1995       ×                               ×        ×         ×                                                                     4
 1996       ×                               ×        ×         ×                                                                     4
 1997       ×            ×                  ×        ×         ×                                                                     5
 1998       ×            ×                  ×        ×         ×                                                                     5
 1999       ×            ×                  ×        ×         ×                                                                     5
 2000                    ×                  ×        ×         ×          ×         ×                             ×                  7
 2001                    ×                  ×        ×         ×          ×         ×                             ×                  7
 2002                    ×                  ×        ×         ×          ×         ×                   ×         ×                  8
 2003                    ×                  ×        ×         ×          ×         ×           ×       ×         ×         ×        9
 2004                    ×                  ×        ×         ×          ×         ×           ×       ×         ×         ×        9
 2005                    ×                  ×        ×         ×          ×         ×           ×       ×         ×         ×       10
 2006       ×            ×                  ×        ×         ×          ×         ×           ×       ×         ×         ×       11
 2007       ×            ×                  ×        ×         ×          ×         ×           ×       ×         ×         ×       11
 2008       ×            ×                  ×        ×         ×          ×         ×           ×       ×         ×         ×       11
 2009       ×            ×                  ×        ×         ×          ×         ×           ×       ×         ×         ×       11
 2010       ×            ×                  ×        ×         ×          ×         ×           ×       ×         ×         ×       11
 2011       ×                               ×        ×         ×          ×         ×           ×       ×         ×         ×       10
 2012                              ×                                      ×         ×           ×       ×         ×         ×        7
 2013                              ×                                      ×         ×           ×       ×         ×         ×        7
 2014                              ×                                      ×         ×           ×       ×         ×                  6
 2015                              ×                                      ×         ×           ×       ×         ×                  6
 2016                              ×                                      ×         ×           ×       ×         ×                  6
 2017                              ×                                      ×         ×           ×       ×         ×                  6

Figure 5. Scheme for the merging approaches; applied for L3 products or regional time series.

the weights are assigned based on the agreement of each                   An AOD-weighted mean was calculated, with a ranking
dataset with monthly AERONET averages. This represents                 approach based on the statistics from the AERONET com-
an initial attempt to adjust the level of confidence assigned          parison for AOD: R, bias, RMSE, GE (Figs. 4 and S8) and
to each product on a regional basis; better-comparing prod-            median bias of the binned AOD in the range [0.45, 1] (Figs. 3
ucts are given more weight in the calculation of a combined            and S7). The last criterion was added to specifically consider
product.                                                               algorithm performance for higher AOD.

www.atmos-chem-phys.net/20/2031/2020/                                                     Atmos. Chem. Phys., 20, 2031–2056, 2020
2042 L. Sogacheva et al.: Merging regional and global satellite AOD records
As shown in Sect. 3.1, the performance of the retrieval al-
gorithms often depends on the aerosol conditions (aerosol
type and loading; Fig. 2) and surface properties. Accordingly,
weights for the different AOD products were calculated sep-
arately for each region for different aerosol types (back-
ground, fine-dominated or coarse-dominated) separately and
“all” aerosol types together considering the corresponding
regional statistics from the AERONET comparison. How-
ever, aerosol types often change in time and space within the
same region (Fig. S5). Thus, those weights for each aerosol
type were applied globally to merge both L3 monthly prod-
ucts and time series. As a result, eight merged AOD prod-
ucts were obtained, which include the following: the product
of two ranking approaches (RM1 and RM2) and four sets
of statistics (all points and the background and the fine- and
coarse-dominated subsets).
4.2.2 Ranking results (weights) for individual products
Figure 6. Regional annual average AOD offset between each
dataset and the Terra DT&DB dataset. GCOS requirement of ±0.03 The weighting of the contribution of each product to the
is shown as a background colour. For all selected regions, see merged data product is shown in Fig. 7 (Europe and Chi-
Fig. S10. naSE) and Fig. S11 (all selected regions) for three aerosol
types (background, fine-dominated and coarse-dominated)
and all aerosol types together (all). With some exceptions
Two ranking methods were tested. For the first ranking (e.g. in AOb, where the RM2 weight of Aqua DT&DB is
method (RM1) based on best statistics, the 12 products were ca. 15 % higher for coarse-dominated type, and in Australia,
ranked from 1 (worst) to 12 (best) for each statistic (R, GE, where the RM2 weight of SeaWiFS and Aqua MAIAC is
RMSE, bias and binned bias) separately. The five separate 10 %–15 % higher for coarse-dominated type; Fig. S11), the
ranks were then summed, so the maximum possible rank is difference in weights obtained with RM1 and RM2, if they
12 · 5 = 60. A downside of this method is that when several exist, does not exceed 5 %–10 %. Thus, the ranking meth-
products have similar statistics small variations in statistics ods RM1 and RM2 introduced in the current study produce
can produce large spread in ranking. Note that no product similar results. Some products show a better performance for
received a perfect (60) rating. certain aerosol types (Figs. 4 and S4). Thus, the weight of
To overcome this potential downside, the second rank- the product depends on which aerosol type is favoured for
ing method (RM2) considers statistics falling into binned merging. For example, in Europe VIIRS has lower weight for
ranges (rather than the absolute evaluation statistics). For fine-dominated aerosols, whereas the corresponding weight
each statistic, the following windows, [0.5, 1] for R, [0, 0.5] for ATSR SU is higher for that aerosol type. In ChinaSE,
for GE, [0, 0.2] for bias, [0, 0.15] for RMSE and [−0.5, 0] for Terra DT&DB performs worse than Terra MAIAC for back-
the binned bias, were divided into 10 bins, and a rank (from ground aerosols, so for that aerosol type the weight for Terra
1 to 10) was assigned depending on which bin a particular MAIAC is higher.
statistic falls for a particular product. As a result, several al- As with the results discussed in Sect. 3, none of the al-
gorithms can be ranked equally for certain statistics if their gorithms consistently outperforms the others in all regions.
statistics fell within the same bin. For example, if R for three There is no clear leader over Europe, a region with low
products is between 0.8 and 0.85, all three receive a rank AOD, indicating a similar performance of all algorithms un-
score of 8 for that statistic. der background conditions. Over land globally, also a re-
The sum of the five ranks (R, GE, RMSE, bias and binned gion with low AOD, the ranks are similar for EOS (electro-
bias), w, for each product i was calculated and transformed optical-system) sensors and ATSR, with somewhat higher
to a weight of each product (as a fraction of total sum for number for VIIRS. Over ocean globally, the ranks are simi-
the product from the total sum of ranking for all products) to lar for all existing products. One likely reason that the VIIRS
calculate the AOD-weighted mean, AOD, as follows: and MODIS ranks are often higher is their better coverage,
n
which enables them to better represent AERONET monthly
means over land as they sample the variations more fully.
P
(wi · AODi )
i=1 However, MODIS is ranked lower over the Atlantic dust re-
AOD = n . (1)
P gion. The lowest ranks are obtained consistently for TOMS,
(wi )
i=1 OMI and POLDER, due to their high biases.
Atmos. Chem. Phys., 20, 2031–2056, 2020 www.atmos-chem-phys.net/20/2031/2020/L. Sogacheva et al.: Merging regional and global satellite AOD records 2043
Ranks for the different aerosol classes (all, background, merged product. We use this for further intercomparison with
fine-dominated and coarse-dominated) are different, which individual products to reveal the regional and seasonal dif-
raises another aspect of using multiple products. Over land, ferences between the products. If not specifically stated, the
MODIS MAIAC often has a higher rank for background merged product mentioned below is the one obtained with
AOD, whereas MODIS DT&DB is better for other aerosol RM2 for all aerosol types (RM2 for all).
types.
5.2.1 Summarised evaluation results
5 Merged L3 AOD products The difference between the L3 merged product and the me-
dian of all individual products used for merging (Table 2) was
As a recap, 10 merged products are created, which in- calculated for the year 2008 (Fig. 9a, as Fig. S1 for individ-
clude the following: shifted and unshifted medians from ap- ual products). The difference is within GCOS requirements
proach 1 and eight (two ranking methods times four aerosol over both land and ocean (0.009 and 0.007, respectively) and
type classes) from approach 2. In this section these products globally (0.008). High latitudes contribute most to the pos-
are evaluated against AERONET. itive bias over oceans, whereas a positive bias is observed
over land mostly over bright surfaces.
5.1 Evaluation of the all merged L3 AOD products The evaluation statistics for the L3 merged product against
with AERONET AERONET extracted from Figs. S12 and S13 are combined
in Fig. 9b, c, d for all 15 regions, as well as for land, ocean
Evaluation results (using the same method as in Sect. 3.1) and globally. For most regions, R is between 0.75 and 0.85,
reveal similarities in the accuracy of products merged with 20 %–60 % fall within the GE, and the RMSE and offset are
different approaches. The AOD binned bias of the merged between 0.05 and 0.1, though somewhat higher for the re-
products (Fig. S12) shows a similarly small deviation from gions with potentially high AOD loading (Indonesia, AOd,
AERONET (±0.03) for AOD < 0.5 (positive for AOD < 0.3 AsW and AsE). Statistics for the merged product (M) are
and negative for 0.3 < AOD < 0.5). The offset is slightly also shown in Figs. 3 and S7 for comparisons with individual
higher for the median of the shifted AOD product (ap- products.
proach 1), because as discussed earlier, Terra DT&DB has
a positive bias relative to most of the other individual prod- 5.2.2 Uncertainties
ucts; this results in slightly elevated AOD compared to the
others. For AOD > 0.5, where the number of cases is very Uncertainties (unc, meaning 1−σ of the uncertainty distri-
low, the underestimation increases as AOD increases. As for bution) for the merged L3 products (monthly, seasonal and
individual products, the coarse-dominated merged products annual) were estimated as the root-mean-squared sum of
have the smallest offset with AERONET. the deviations between the chosen merged product M (RM2
Correlation coefficient, number of the pixels in the GE, for all), the median from the all uncorrected products (ap-
offset and RMSE for the AOD merged product are shown in proach 1) and each of the other seven merged products (ap-
Fig. 8 for Europe and ChinaSE and in Fig. S13 for all regions. proach 2, with RM1 for all aerosol types and RM1 and RM2
The merged products have the best temporal coverage and the each applied for background, fine-dominated and coarse-
number of points used for validation (N) is higher than for dominated particles).
any individual product. The correlation coefficients and the v
number of the pixels matching within the GE are as high as u
u1 X N
for the one or two best ranked products in the corresponding unc = t (mi − M)2 , (2)
regions, except for the product merged with approach 2. The N 1
offset is close to the average offset, and the RMSE tends to
be lowest. Thus, the quality of the merged products, except where mi is AOD from alternative merged product i, M is
for the shifted AOD product, is as good as that of the most AOD from the chosen merged product (RM2 for all), and N
highly ranked individual AOD products in each region. is the number of the alternative merged products. Note that
this is a structural uncertainty (i.e. a sensitivity to diversity
5.2 Final merged product evaluation and and decisions in dataset merging) rather than a total uncer-
intercomparison with individual products tainty for the merged product. Seasonal and annual uncer-
tainties for the year 2008 are shown in Fig. 10. These un-
The agreement of the RM1 and RM2 approaches is en- certainties show artefacts at regional boundaries because the
couraging, as we can conclude from the big-picture analysis merging was done according to regional statistics.
(Sect. 5.1) that the details of the methodology do not mat- The estimated annual and seasonal structural uncertain-
ter much. As there is no significant difference in the evalua- ties are low, 0.005–0.006 globally. They show seasonal de-
tion results for products merged with approaches 1 and 2, we pendence, reaching 0.008 and 0.009 on average over land
choose the RM2 approach for all aerosol types as the main in MAM and JJA, respectively. The uncertainties are larger
www.atmos-chem-phys.net/20/2031/2020/ Atmos. Chem. Phys., 20, 2031–2056, 2020You can also read


