Reviews and syntheses: Insights into deep-sea food webs and global environmental gradients revealed by stable isotope (δ15N, δ13C) and fatty acid ...
←
→
Page content transcription
If your browser does not render page correctly, please read the page content below
Biogeosciences, 16, 2837–2856, 2019
https://doi.org/10.5194/bg-16-2837-2019
© Author(s) 2019. This work is distributed under
the Creative Commons Attribution 4.0 License.

Reviews and syntheses: Insights into deep-sea food webs and global
environmental gradients revealed by stable isotope (δ 15N, δ 13C) and
fatty acid trophic biomarkers
Camilla Parzanini1 , Christopher C. Parrish1 , Jean-François Hamel2 , and Annie Mercier1
1 Department    of Ocean Sciences, Memorial University, St. John’s, NL, Canada
2 Society   for Exploration and Valuing of the Environment (SEVE), St. Philips, NL, Canada

Correspondence: Camilla Parzanini (cparzanini@ryerson.ca)

Received: 4 March 2019 – Discussion started: 12 March 2019
Revised: 24 June 2019 – Accepted: 27 June 2019 – Published: 18 July 2019

Abstract. Biochemical markers developed initially for food-      analyses, indicating that further studies should be conducted
web studies of terrestrial and shallow-water environments        using standardized methods in order to generate more reli-
have only recently been applied to deep-sea ecosystems (i.e.,    able global predictions.
in the early 2000s). For the first time since their implemen-
tation, this review took a close look at the existing litera-
ture in the field of deep-sea trophic ecology to synthesize
current knowledge. Furthermore, it provided an opportunity       1     Introduction
for a preliminary analysis of global geographic (i.e., latitu-
dinal, along a depth gradient) trends in the isotopic (δ 15 N,   1.1    Historical background of biochemical biomarkers
δ 13 C) and fatty acid composition of deep-sea macro- and               in deep-sea food-web studies
megafauna from heterotrophic systems. Results revealed sig-
nificant relationships along the latitudinal and bathymetric     While the use of biochemical biomarkers in marine food-
gradients. Deep-sea animals sampled at temperate and polar       web studies has a long and successful tradition in shallow-
latitudes displayed lower isotopic ratios and greater propor-    water ecosystems, starting from the 1970s with the use of sta-
tions of essential ω3 long-chain polyunsaturated fatty acids     ble isotopes (McConnaughey and McRoy, 1979) and lipids
(LC-PUFAs) than did tropical counterparts. Furthermore,          (Lee et al., 1971), their application in deep-water environ-
δ 15 N and δ 13 C ratios as well as proportions of arachidonic   ments is relatively new (e.g., Iken et al., 2001; Polunin et al.,
acid increased with increasing depth. Since similar latitudi-    2001; Howell et al., 2003). Undoubtedly, technological ad-
nal trends in the isotopic and fatty acid composition were       vances made over the past few decades have allowed the ex-
found in surface water phytoplankton and particulate organic     ploration of ever deeper ecosystems with more refined tech-
matter, these results highlight the link across latitudes be-    niques. Iken et al. (2001) were among the first to provide a
tween surface primary production and deep-water communi-         comprehensive analysis of a deep-sea food web, which was
ties. Because global climate change may affect quantity and      sampled at a depth of ∼ 4840 m at the Porcupine Abyssal
quality (e.g., levels of essential ω3 PUFAs) of surface pri-     Plain (PAP, northeast Atlantic), by using bulk stable N and
mary productivity, and by extension those of its downward        C isotope ratios (δ 15 N and δ 13 C, respectively) as trophic
flux, the dietary intake of deep-sea organisms may likely be     markers. In the same year, Polunin et al. (2001) used the
altered. In addition, because essential ω3 PUFAs play a ma-      same approach to study the trophic relationships of a slope
jor role in the response to temperature variations, climate      megafaunal assemblage collected off the Balearic Islands
change may interfere with the ability of deep-sea species to     (western Mediterranean). Since these first two investigations,
cope with potential temperature shifts. Importantly, method-     several others have been carried out across different oceanic
ological disparities were highlighted that prevented in-depth    regions and climes, such as the Canadian Arctic (Iken et al.,

Published by Copernicus Publications on behalf of the European Geosciences Union.
2838                                C. Parzanini et al.: Insights into deep-sea food webs and global environmental gradients

2005), the Arabian Sea (Jeffreys et al., 2009), and the Sea            shorter processing times than gut content analysis. Thanks
of Japan (Kharlamenko et al., 2013). Furthermore, over the             to this integrative approach and faster output, the application
past decade, it has become evident that the simultaneous use           of food-web tracers has been particularly helpful in deep-sea
of different trophic markers (e.g., δ 15 N, δ 13 C, and fatty acids,   studies, which are often plagued by financial and logistical
FAs) and techniques (e.g., bulk or compound specific isotope           constraints. Furthermore, due to its relative ease of use, it has
analysis, as well as FAs, gut content, and morphometric anal-          favored the analysis of wider sets of taxa/feeding guilds, pri-
yses) provides a more complete picture of trophic structure            mary producers included, rather than focusing on one or a
and dynamics. Indeed, while the first investigations relied on         few focal groups. However, the interpretation of isotopic and
a single method (Iken et al., 2001; Polunin et al., 2001; How-         FA data is complex, and both techniques require dedicated
ell et al., 2003), the latest trend in deep-sea food-web stud-         and sophisticated instrumentation (e.g., gas chromatograph,
ies favors an integrative approach, which maximizes the effi-          mass spectrometer) and knowledge of intrinsic sources of
ciency of each technique, while increasing the resolution of           variations (see Sect. 1.4). Although each method needs a suf-
the investigation (e.g., Stowasser et al., 2009; Parzanini et al.,     ficient sample size, only gut content analysis may provide
2017).                                                                 direct and clear taxonomic evidence of the diet (Table 1).
   For the first time since the implementation of trophic              Therefore, as stated above, the latest trend in trophic ecology
markers in studies of deep-sea food webs, this review syn-             advocates a multifaceted approach, on the understanding that
thesizes current knowledge in this growing field of research,          each technique may offer unique and valuable data.
mainly focusing on heterotrophic ecosystems (i.e., relying on             The principle behind the use of food-web tracers is that the
photosynthetic primary production). In addition, it provides           biochemical signature of consumers reflects that of their diet.
a preliminary overview of large-scale geographic trends                Among them, δ 15 N and δ 13 C are the most popular. While the
from the analysis of isotopic and FA data for macro- and               former is used to study trophic positions and dietary sources,
megafauna, along with guidance for future investigations. In           with an enrichment factor of 2 ‰–4 ‰ between a consumer
particular, the present contribution (i) briefly defines various       and its food (Minagawa and Wada, 1984), the latter under-
trophic biomarkers and their respective advantages; (ii) de-           goes little fractionation (< 1 ‰) and, therefore, is used to dis-
scribes deep-sea food webs, based on examples from the lit-            tinguish primary food sources (McConnaughey and McRoy,
erature; (iii) lists the sources of variation among the differ-        1979). For further details, refer to Sulzman (2007) and Mich-
ent studies to highlight pitfalls and gaps; and (iv) provides a        ener and Kaufman (2007), who have provided extensive re-
preliminary quantitative analysis across studies by using rel-         views on the chemistry behind stable isotopes and their use
evant data sets.                                                       as food-web tracers, respectively. In addition, sterols, FAs,
                                                                       and amino acids, which are important constituents of lipids
1.2    Comparison of major trophic markers                             (for the first two) and proteins (for the last), have successfully
                                                                       been used to study trophic relationships and dietary sources
The analysis of gut contents was among the first techniques            in deep-water systems (Howell et al., 2003; Drazen et al.,
(together with in situ observation of feeding behaviors) ap-           2008a, b). Their use is based on the principle that certain FAs
plied in trophic ecology and food-web studies in aquatic sys-          and amino acids are considered essential for animals, being
tems (Gartner et al., 1997; Michener and Kaufman, 2007).               required for optimal fitness. However, most species cannot
Subsequently, other methods were developed as alternative              synthesize these essential compounds de novo and, therefore,
or supplementary means of studying diet and feeding behav-             they must gain them through their diet. Indeed, only primary
iors within the same ecosystems. Among them, the use of                producers and a few consumers possess the enzymatic appa-
biochemical markers as trophic tracers rapidly grew in pop-            ratus to synthesize essential FAs and amino acids de novo.
ularity in food-web ecology since it is relatively simple and          Conversely, a few taxa are unable to synthesize sterols de
should overcome many of the issues ascribed to gut content             novo, which are critical for them; therefore, they have to ac-
analysis (Michener and Kaufman, 2007). In this regard, Ta-             quire these essential sterols through diet (Martin-Creuzburg
ble 1 lists strengths and drawbacks of gut content analysis            and Von Elert, 2009). Because sterols, FAs, and amino acids
and of the two most popular biochemical techniques, i.e.,              undergo little or no alteration when consumed, it is possi-
bulk stable isotope and FA analyses. For instance, bulk sta-           ble to detect dietary sources within the consumers’ tissues
ble isotope and FA analyses may, theoretically, be performed           (Parrish et al., 2000). The isotopic signature of amino acids
on any species, regardless of feeding mode and food sources,           can also be used to study trophic position through compound
whereas gut content analysis can only be applied to those or-          specific analysis (δ 15 N), as some of these acids show trophic
ganisms characterized by a sufficiently large and full stom-           enrichment (Bradley et al., 2015). Detailed information about
ach. Except in cases where individuals are too small and               FA analysis was outside the scope of this study, and is pro-
have to be analyzed whole, biochemical analyses are typi-              vided by Parrish (2009) and Iverson (2009), whereas the
cally conducted on target tissues (e.g., muscle) that provide          use of sterols as food-web tracers was outlined in Martin-
long-term dietary data and reduce intra-individual variability         Creuzburg and Von Elert (2009) and Parrish et al. (2000).
(Table 1). In addition, the use of biochemical tracers requires

Biogeosciences, 16, 2837–2856, 2019                                                         www.biogeosciences.net/16/2837/2019/
C. Parzanini et al.: Insights into deep-sea food webs and global environmental gradients 2839
Table 1. Comparison outlining the major strengths and drawbacks of gut content, stable isotope, and FA analysis.
Gut content analysis Stable isotope analysis FA analysis
Direct evidence of diet Indirect evidence of diet (assumption vali- Indirect evidence of diet (assumption vali-
dation required) dation required)
Snapshot of the most recent meal Integrative over time Integrative over time
Small sample sizes may lower representa- Small sample sizes may lower representa- Small sample sizes may lower representa-
tivity of diet tivity of diet tivity of diet
Inter-individual variability can only be ac- Inter-individual variability minimized due Inter-individual variability likely but mini-
counted for with appropriate sample size to integrative nature mized due to integrative nature
Temporal variability can only be accounted Temporal variability minimized due to in- Temporal variability minimized due to in-
for with appropriate sample size tegrative nature tegrative nature
Partly dependent on sex in cases where Partly dependent on sex in cases where Partly dependent on sex in cases where
there are dietary differences between sexes there are dietary differences between sexes there are dietary differences between sexes
May be sensitive to body size (e.g., onto- May be sensitive to body size, whether or Dependent on body size if size affects diet
genetic dietary changes) not size influences diet
Species with large stomachs and slow di- Applies to all species, but requires enough Applies to all species, but requires enough
gestion rates are easier to study material (see below) material (see below)
The analysis cannot be carried out with Independent of stomach fullness Independent of stomach fullness
empty stomachs
Digestion rates may bias contents recov- Independent of digestion process Independent of digestion process
ered
Small specimens with small stomachs are Small specimens may have to be pooled, Small specimens may have to be pooled,
more difficult to study guts included guts included
Only gut content is analyzed Typically applied to target tissues Typically applied to target tissues
Interpretation is relatively easy, unless Data interpretation is complex (post- Data interpretation is complex (linked to
food is highly digested, and the evidence analysis mathematical corrections are of- FA biomarkers as food tracers)
obtained cannot be misinterpreted, taxo- ten applied)
nomically speaking
Long processing time Relatively short processing time Relatively short processing time
Little instrumentation, low cost (unless Medium technology, medium/high cost Medium technology, medium/high cost
high-resolution scopes are used)
McClelland and Montoya (2002) and Larsen et al. (2009) puts, from inland and shelf areas towards abyssal offshore re-
discuss the use of amino acids as trophic biomarkers. gions (Pfannkuche, 2005). Although most of the deep-water
ecosystems are heterotrophic, a few, such as hydrothermal
1.3 Understanding deep-sea food webs through vents and cold seeps, are fueled by chemical energy (e.g.,
biochemical markers methane, hydrogen sulfide) and rely on chemosynthetic mi-
croorganisms for the production of organic matter. Each of
As there is no photosynthetically derived primary produc- these primary food sources has a specific isotopic compo-
tion in the deep sea, deep-water ecosystems are mostly het- sition and biochemical signature, resulting from a combi-
erotrophic (Gage, 2003), and may hence largely rely on par- nation of chemical and physical processes reflective of its
ticulate organic matter (POM) that passively sinks from the origin. By knowing the composition of the food source(s)
surface waters as a primary source of nutrients (Hudson et that fuel(s) a given food web, it is possible to reconstruct
al., 2004). Nonetheless, food can also be actively transported its trophic structure and dynamics. Conversely, by measuring
down by those animals that carry out vertical diel migra- the signatures of the food-web components, it is possible to
tions through the water column (Trueman et al., 2014); it assess food sources on which they rely. For instance, Iken et
can also be provided by the occasional fall of large ani- al. (2001) showed that phytodetritus was the primary energy
mal carcasses (Smith and Baco, 2003), and/or by lateral in-
www.biogeosciences.net/16/2837/2019/ Biogeosciences, 16, 2837–2856, 20192840 C. Parzanini et al.: Insights into deep-sea food webs and global environmental gradients input of the deep-sea benthic community at PAP, and also de- small particles of sinking POM should reflect a bathymet- fined two different trophic pathways: a pelagic and isotopi- ric gradient in δ 15 N. In fact, small-sized particles sink at a cally lighter one in which sinking POM and small pelagic lower velocity and, therefore, experience high rates of degra- prey constituted the main food sources, and a benthic and dation, with more evident changes in δ 15 N (Mintenbeck et more isotopically enriched trophic pathway, fueled by de- al., 2007). Based on these findings, depth-stratified sampling graded sedimented POM. In fact, once POM settles on the should ideally be conducted when studying a system charac- seafloor, it undergoes continuous degradation by microbes terized by a bathymetric gradient, as it would prevent biases and is reworked through bioturbation and feeding activities, in the interpretation of the isotopic data. thus leading to a more isotopically enriched material rela- Deep-water systems are generally characterized by a lim- tive to the sinking one (Iken et al., 2001). Depending on ited food supply, as the quantity of food being transferred the primary food source they relied on, benthic organisms from the surface to the bottom diminishes with increasing at PAP were thus characterized by either lower or higher depth (Gage, 2003). In addition, in temperate areas, food values of δ 15 N. Similar scenarios of dual trophic pathways arrives as intermittent pulses, following the spring and late characterizing benthic systems were also found by Iken et summer blooms of primary (and secondary) productivity. al. (2005) in the Canadian Arctic, Drazen et al. (2008b) in the For this reason, deep-water benthic communities can only North Pacific, Reid et al. (2012) within the benthic commu- rely on fresh, high-quality phytodetritus within short tempo- nity sampled on the mid-Atlantic Ridge, Valls et al. (2014) ral windows following algal blooms; whereas reworked and in the western Mediterranean, and Parzanini et al. (2017) in resuspended POM fuels these communities for the rest of the northwest Atlantic. Moreover, Kharlamenko et al. (2013) the year (Lampitt, 1985). Deep-sea benthic organisms have used both stable isotopes and FAs to study the dietary sources hence developed adaptations and strategies to increase their of benthic invertebrates collected along the continental slope feeding success and minimize competition for food, includ- (500–1600 m depth) in the Sea of Japan. The authors rec- ing trophic niche expansion and specialization. In this re- ognized different trophic pathways (i.e., planktonic, benthic, gard, certain benthic taxa (e.g., pennatulacean corals, hex- microbial) and dietary sources by using biochemical tracers, actinellid sponges) and/or feeding groups (e.g., suspension and they proposed a strong link with the primary production and deposit feeders) at PAP showed vertical extension of of the surface waters, as the FA composition of the deep-sea their trophic niches (i.e., omnivory), which, according to Iken echinoderms and mollusks was similar to that of the shallow- et al. (2001), was most likely driven by a strong competition water counterparts. for food. In other words, some species belonging to the same As POM sinks through the water column, its δ 15 N in- taxon or feeding guild shared similar food sources (i.e., ex- creases, reflecting the preferential assimilation of the lighter hibiting similar δ 13 C values), but they were located at differ- isotope, 14 N, by microbes; in particular, a gradient in POM ent trophic levels (i.e., exhibiting a wide range of δ 15 N). Sim- δ 15 N has been detected with depth, where POM at greater ilarly, Jeffreys et al. (2009) reported trophic niche expansion depths is more enriched (Altabet et al., 1999). For this rea- among and within feeding guilds sampled between 140 and son, Mintenbeck et al. (2007) carried out a study in the 1400 m depth, at the Pakistan margin (Arabian Sea). Pennat- high-Antarctic Weddell Sea to assess whether this gradient ulacean corals and other sestonivorous cnidarians, for exam- was reflected in the isotopic signature of POM consumers ple, displayed the greatest niche expansion; they fed on not sampled at 50–1600 m. In this regard, only those organisms only POM, but also small invertebrates (e.g., zooplankton). feeding directly on sinking POM (e.g., suspension feeders) Moreover, ophiuroids, which are typically selective deposit showed increasing values of δ 15 N with depth, whereas the feeders, switched to an omnivorous diet under food-limited increase was less evident for the deposit feeders (Minten- conditions (Jeffreys et al., 2009). Apart from trophic niche beck et al., 2007). Similar results for suspension feeders expansion, Iken et al. (2001) proposed that specialization were obtained by Bergmann et al. (2009), who analyzed on certain food items represented another adaptation devel- a benthic food web sampled at the deep-water observatory oped by benthic organisms at PAP to mitigate competition for HAUSGARTEN, west of Svalbard (Arctic), between 1300 food. Holothuroid echinoderms, for instance, were thought and 5600 m depth. Conversely, deposit feeders exhibited a to accomplish food specialization through a combination of negative trend along the bathymetric gradient in terms of different factors involving changes in morphology, mobility, δ 15 N, and predator/scavengers were not affected. In another and digestive abilities (Iken et al., 2001). Further examples of study, Sherwood et al. (2008) did not detect any relationships trophic niche segregation and food partitioning, as strategies with depth in the δ 15 N values measured from cold-water to minimize competition, were also reported for deep-sea corals collected on a slope environment in the northwest At- demersal fishes in the northwest Mediterranean Sea (Papiol lantic. Among the explanations suggested for these inconsis- et al., 2013) and for asteroid echinoderms in the northwest tencies and differences among feeding groups, Mintenbeck et Atlantic (Gale et al., 2013). Howell et al. (2003) detected al. (2007) and Sherwood et al. (2008) included feeding pref- trophic niche expansion across different species of deep-sea erences with respect to the size and sinking velocity of POM. asteroids (1053–4840 m) by analyzing their FA composition. According to these authors, only those organisms feeding on In particular, multivariate analysis of FA proportions dis- Biogeosciences, 16, 2837–2856, 2019 www.biogeosciences.net/16/2837/2019/
C. Parzanini et al.: Insights into deep-sea food webs and global environmental gradients                                                 2841

Table 2. Sources of variations across studies, distinguished by type (i.e., biological, environmental, analytical).

           Biological                         Analytical                                        Environmental
           Taxonomy                           Sample gear                                       Depth
           Sex                                Sample storage                                    Season
           Age                                Sample treatment (e.g., acidification of          Primary productivity levels at surface
                                              organisms containing carbonatic anatomical
                                              elements; lipid removal; urea removal)
           Size                               Mathematical correction                           Latitude
                                              (i.e., whether applied and which one)
           Feeding habits                     Tissue type                                       Temperature
           General physiological condition                                                      Ocean region
                                                                                                Geological feature (e.g., shelf,
                                                                                                slope, canyon, plain, trench)

criminated three different feeding guilds among the asteroids              Reid et al. (2013) detected size-related trends in the δ 13 C
analyzed, including mud ingesters, predators and scavengers,               of deep-water fish collected from the Mid-Atlantic Ridge at
and suspension feeders.                                                    2400–2750 m depth, the authors were not able to distinguish
                                                                           whether these results were due to ontogenetic changes in diet
1.4     Sources of variation across studies                                or merely to an effect of increasing size, within the size range
                                                                           sampled. Moreover, δ 15 N and trophic position may increase
When comparing studies relying on biochemical analysis,                    with body size in adult shallow-water fish, as larger predatory
there are numerous sources of variation, which may influence               fish ingest larger, more isotopically enriched prey (Badala-
results and findings and also prevent the detection of simi-               menti et al., 2002; Galván et al., 2010).
larities and general trends. However, their importance may                     The potential influence of sex as a source of variation in
depend on the scale of the investigation (i.e., local, regional,           biomarker studies has not received as much attention and
or global). In this section, the main sources of variation are             remains ambiguous. Nonetheless, Boyle et al. (2012) stud-
illustrated and explained by type (Table 2).                               ied whether diet and trophic position varied between sexes
                                                                           in deep-sea fish species collected at 55–1280 m depth in the
1.4.1    Biological sources                                                eastern North Pacific using gut content and stable isotope
                                                                           analysis of muscle tissue. The authors did not detect any dif-
Age, size, and sex, whether related to diet, determine nat-                ference between sexes, but variations in trophic position were
ural intraspecific variability in the isotopic and FA compo-               encountered when analyzing fish of different sizes (Boyle et
sitions of organisms, which may affect data interpretation                 al., 2012). An investigation of the oceanic squid Todarodes
of small-spatial-scale investigations. At a basic level, sessile           filippovae sampled within a depth range of 13–380 m in the
and sedentary taxa typically experience a transition from a                southwestern Indian Ocean by Cherel et al. (2009) revealed
pelagic to a benthic lifestyle between the larval and the ju-              that females had higher values of δ 15 N, and thus occupied
venile stage (Rieger, 1994). Research has also shown that                  a higher trophic position. However, because T. filippovae ex-
certain deep-sea fish experience changes in diet with age,                 hibits sexual dimorphism in body size, this difference was ul-
typically with younger individuals preying upon benthic or-                timately shown to be driven by size, i.e., no δ 15 N variations
ganisms and adults feeding on prey that are larger and of                  were detected when females and males of similar sizes were
benthopelagic origin (Mauchline and Gordon, 1984; Eliassen                 compared (Cherel et al., 2009). Sex may constitute a source
and Jobling, 1985). Stowasser et al. (2009) combined sta-                  of variation in relation to diet in those species that exhibit
ble isotope analysis (SIA) and FA analysis to detect onto-                 extreme cases of sexual dimorphism, as in deep-sea angler-
genetic shifts in the diet of the fish Coryphaenoides arma-                fish (Shine, 1989). However, investigation of the role of sex
tus and Antimora rostrata, collected at depths between 785                 in intraspecific variability will need to be carried out across
and 4814 m at PAP (northeast Atlantic). By looking at their                a broader taxonomic scope before drawing generalizations.
biochemical composition, the two species switched from ac-
tive predation to scavenging with increasing size. Similar re-
sults are reported in Drazen et al. (2008c) for macrourid fish
species from the eastern North Pacific. Conversely, although

www.biogeosciences.net/16/2837/2019/                                                                 Biogeosciences, 16, 2837–2856, 2019
2842 C. Parzanini et al.: Insights into deep-sea food webs and global environmental gradients
1.4.2 Environmental sources carbohydrates (DeNiro and Epstein, 1977); lipid-rich tissues
hence display lower δ 13 C values. In addition, there are tis-
Larger-scale (e.g., regional, global) comparative studies sues, such as liver in fish and gonads in other taxa, which
among deep-sea habitats are complicated by the wide bathy- are characterized by higher turnover rates of lipids than oth-
metric ranges they may occupy, anywhere between 200 and ers (e.g., white muscle), and hence incorporate information
∼ 11 000 m depth. Depth may constitute a major driver of only on the recent diet. To avoid biases caused by the pres-
variation in δ 15 N and δ 13 C in deep-sea organisms for two ence of lipids in tissues, several approaches may be used.
main reasons. First, as mentioned earlier, biodegradation pro- Stowasser et al. (2009) and Boyle et al. (2012), for exam-
cesses occurring within the water column may favor the en- ple, opted to extract lipid from the tissues prior to analysis,
richment of POM as it sinks, thus influencing the stable iso- whereas Sherwood et al. (2008), Fanelli et al. (2011a, b),
tope composition of those organisms that directly feed on it and Papiol et al. (2013) applied a mathematical correction to
(Mintenbeck et al., 2007; Bergmann et al., 2009). Second, their δ 13 C data, based on the elemental C-to-N ratio (C : N)
size-based trends and shifts in diet, and hence in the isotopic characterizing the samples. Other authors, such as Polunin et
composition, with depth have been reported for deep-sea de- al. (2001) and Carlier et al. (2009), did not apply any treat-
mersal fish (Collins et al., 2005; Mindel et al., 2016a, b). ment. In the case of mathematical corrections, two equations
Likewise, deep-sea species may exhibit different lipid and FA are currently used for deep-sea organisms, those proposed by
compositions along a bathymetric gradient, reflecting phys- Post et al. (2007) and Hoffman and Sutton (2010). Since lipid
iological adaptations to changing temperature and pressure extraction increases values of δ 15 N in deep-sea fish muscle
with depth (Parzanini et al., 2018b). tissue (Hoffman and Sutton, 2010), this practice is not rec-
Geographic location (e.g., latitude) and season, linked to ommended. Conversely, mathematical corrections seem to be
level and type of surface primary production, nitrogen supply preferable when dealing with lipids, and they have already
dynamics, and temperature, are also important factors to con- been applied in several studies, including those mentioned
sider when comparing studies, as large-scale temporal and above.
spatial differences may be detected in the organisms’ isotopic Some marine organisms, such as corals and echinoderms,
composition. Stowasser et al. (2009), for instance, combined contain carbonate skeletal elements. Since inorganic carbon-
stable isotope and FA analyses to study seasonal variations ate has higher δ 13 C values than other fractions (Pinnegar and
in the diet of five species of demersal fish collected between Polunin, 1999), it is a widespread practice to acidify these
785 and 4814 m in the northeast Atlantic. The authors found types of samples. Variations occur when acidification is exe-
overall that stable isotope and FA composition of fish varied cuted on samples that are simultaneously run for δ 15 N and
temporally, and that these differences most likely reflected δ 13 C, as the treatment may affect δ 15 N data (Bunn et al.,
timing and strength of food inputs sinking from surface wa- 1995). Whenever feasible, depending on both financial con-
ters. However, not all the species (e.g., Coryphaenoides ar- straints and the sizes of the organisms, processing samples
matus) exhibited a strong seasonality in their biochemical separately for each isotope would therefore be advisable, as
composition, probably due to the high trophic position of in Carlier et al. (2009), Sherwood et al. (2008), and Papiol et
the species and the length of the food web analyzed, obscur- al. (2013).
ing the effects of the seasonal POM inputs (Stowasser et al., The tissues of elasmobranchs (e.g., sharks, rays) con-
2009). Colombo et al. (2016) detected a latitudinal gradient tain urea and trimethylamine oxide, which are both 15 N-
in the FA composition of marine species, with higher levels depleted; therefore, their presence may affect stable isotope
of ω3-polyunsaturated fatty acids in organisms collected at data (Hussey et al., 2012; Kim and Koch, 2012; Churchill et
polar and temperate regions in comparison to tropical ones. al., 2015). As for the inorganic carbonate issue, there is no
Large-scale geographic effects will be further explored be- agreement among studies. Nonetheless, the removal of urea
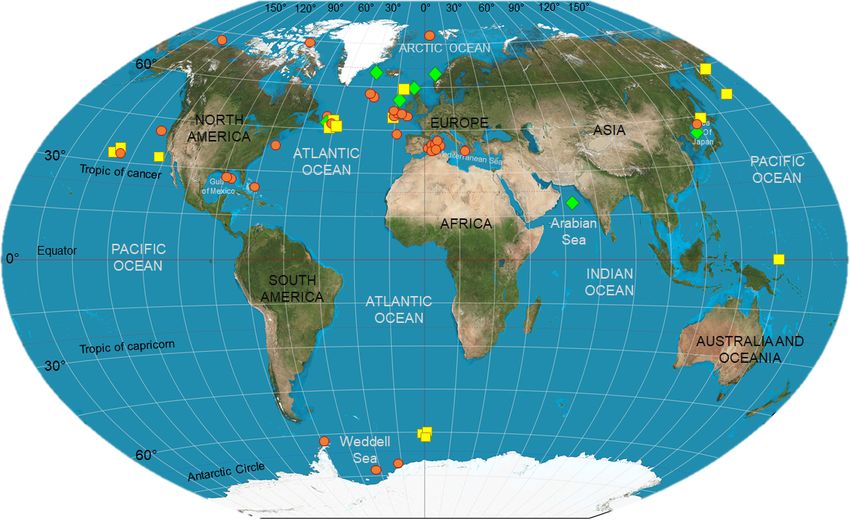
low, in the exploratory analytical section; however, Fig. 1 prior to analysis or the use of arithmetic corrections is among
shows where food-web studies accomplished via biochemi- the most common solutions applied to deal with the presence
cal tracers have been carried out in heterotrophic ecosystems, of these compounds. In addition, the former seems to be the
highlighting important geographic heterogeneity, especially more commonly recommended and performed, as the appli-
the limited number of investigations in the Southern Hemi- cation of mathematical corrections requires the calculation of
sphere. species-specific discrimination factors, which is not always
feasible (Hussey et al., 2012).
1.4.3 Analytical sources Sample storage is also crucial to obtain reliable data since
nonoptimal preservation methods may compromise the out-
Several aspects of the SIA methodology can generate vari- come of the investigation. Regarding the storage tempera-
ability among studies, including type(s) of tissue chosen for ture, while biological samples for gut content and stable iso-
analysis, as well as sample treatment and storage, thus in- tope analysis are commonly frozen at −20 ◦ C, if not pro-
fluencing interpretation of small-scale investigations. For in- cessed soon after their collection, those for lipid analysis are
stance, lipids have lower 13 C in comparison to proteins and stored at either −80 ◦ C (recommended) or −20 ◦ C prior to
Biogeosciences, 16, 2837–2856, 2019 www.biogeosciences.net/16/2837/2019/C. Parzanini et al.: Insights into deep-sea food webs and global environmental gradients 2843
Figure 1. Deep-sea biomarker studies in the world ocean. Symbols indicate where the studies listed in Table 2 have been carried out.
In detail, red circles represent those investigations that have used stable isotopes as food-web tracers; whereas yellow squares and green
diamonds indicate those which used lipids and a combination of SIA and FA analysis, respectively. This map is a derivative of “Creative
Commons The world on Winkel tripel projection” by Strebe (2011), used under CC-BY-SA 3.0.
further processing in the lab. Since storage at −20 ◦ C might tected global spatial trends (i.e., along latitudinal and depth
not completely prevent lipid degradation, especially if sam- gradients) in the isotopic and FA composition of deep-water
ples are analyzed after several years, rapid initial processing animals for the first time since the application of biochemical
of samples and vacuum packing may reduce potential issues tracers to the study of trophic ecology in the deep sea.
when freezing at −80 ◦ C is not logistically feasible. In addi- Latitudinal gradients have been detected in δ 13 C of plank-
tion, freezing is highly recommended over chemical storage ton and POM collected from surface waters in both the
for SIA, as there is evidence that formalin/ethanol consider- Southern Hemisphere and Northern Hemisphere, with de-
ably alters the isotopic ratios in biological tissues (Arring- creasing values towards the polar regions (Sackett et al.,
ton and Winemiller, 2002; Syväranta et al., 2011; Xu et al., 1965; Rau et al., 1982; Francois et al., 1993). Both envi-
2011). ronmental (e.g., temperature, nutrient supply) and biological
(e.g., plankton metabolism) factors have been proposed to
explain such trends (Rau et al., 1982; Francois et al., 1993).
2 Preliminary comparative analysis The stable N isotope signature of surface primary production
may also vary regionally, depending on the nutrient (mainly
The study of large-scale trends in biological variables (e.g., N) supply to the phytoplankton, as well as its community
distribution, biochemical composition, biodiversity) may not structure and cell size (Choy et al., 2015; Hetherington et
only help understand general functioning and structure of al., 2017). Oligotrophic areas, characterized by marked oxy-
ecosystems, but it may also allow us to make predictions gen minimum zones and by high denitrification rates, such
and support conservation initiatives. While several studies as the eastern tropical Pacific Ocean, typically have higher
already exist on large-scale distribution and biodiversity pat- δ 15 N values (Hetherington et al., 2017). In addition, latitudi-
terns of deep-sea species (Rex et al., 1993; Stuart et al., 2003; nal trends have been detected in the FA composition of ma-
Ramirez-Llodra et al., 2010), a similar approach has yet to rine organisms, which tend to have higher levels of essen-
be applied to trophodynamics. This preliminary analysis de- tial ω3 long-chain polyunsaturated fatty acids (LC-PUFA) in
www.biogeosciences.net/16/2837/2019/ Biogeosciences, 16, 2837–2856, 20192844 C. Parzanini et al.: Insights into deep-sea food webs and global environmental gradients
the polar and temperate regions in comparison to the tropi- 1000–4000 m; and abyssopelagic, > 4000 m, for pelagic
cal ones (Colombo et al., 2016). As POM is the main food species; bathyal 200–4000 m; abyssal, 4000–6000 m; and
source of most deep-sea food webs (Gage, 2003; Hudson et hadal, > 6000 m, for benthic species), and phylum (i.e., An-
al., 2004), we hypothesized that (a) similar latitudinal gradi- nelida, Arthropoda, Brachiopoda, Bryozoa, Chaetognatha,
ents exist in the isotopic and essential PUFA composition of Chordata, Cnidaria, Hemichordata, Echinodermata, Mol-
deep-water organisms and that (b) the strength of these trends lusca, Nematoda, Nemertea, Porifera, and Sipuncula). In-
varies among organisms from different habitats, i.e., pelagic, formation about species habitat was either obtained through
demersal, and benthic, as diversely dependant on POM. Fur- WoRMS and FishBase online databases or was already in-
thermore, as both isotopic and lipid composition of POM and cluded in the source paper. In addition, species were labeled
as deep-sea taxa varied along a depth gradient in the deep as “meso-bathypelagic” and “bathyal-abyssal”, if the depth
North Pacific (Lewis, 1967; Altabet et al., 1999), North At- at collection was not specified further, but the whole set of
lantic (Polunin et al., 2001; Parzanini et al., 2018a, b, 2017), samples for a study was collected within those zones. In
and Arctic oceans (Bergmann et al., 2008), we hypothesized the current analysis, tissue type, acidification treatment, sam-
that similar trends could be extended to the global scale. pling season, sex, and age were not considered as variables
because (i) they were assumed to not play a major role in
2.1 Materials and methods global-scale investigations and/or (ii) this information was
not always provided. In addition, tests were performed on
2.1.1 Data set lipid-corrected and uncorrected δ 13 C data pooled together.
For analyses regarding stable isotope composition (δ 15 N,
This analysis focused on studies that used either bulk stable δ 13 C), data were obtained from Iken et al. (2005), Mincks
isotope or FA analysis, or a combination of them, to infer et al. (2008), Bergmann et al. (2009), Quiroga et al. (2014),
trophic relationships of deep-water macro- and megafauna, and van Oevelen et al. (2018), for polar regions; Iken et
as well as to study deep-sea food webs, from heterotrophic al. (2001), Madurell et al. (2008), Sherwood et al. (2008),
ecosystems. Experimental studies as well as investigations Carlier et al. (2009), Fanelli et al. (2009), Stowasser et
on chemosynthetic habitats (e.g., hydrothermal vents) were al. (2009), Fanelli et al. (2011a, b), Boyle et al. (2012),
excluded a priori to avoid possible biases. In fact, these habi- Reid et al. (2012), Fanelli et al. (2013), Gale et al. (2013),
tats are fueled by primary dietary sources, e.g., methane, Kharlamenko et al. (2013), Papiol et al. (2013), Reid et
whose isotopic and FA composition is substantially differ- al. (2013), Tecchio et al. (2013), Kiyashko et al. (2014),
ent than that of POM (Rau and Hedges, 1979; Saito and Trueman et al. (2014), Valls et al. (2014a, b), Kopp et
Osako, 2007). Table 3 outlines the full data set collated al. (2018), Parzanini et al. (2017), Preciado et al. (2017),
for the present analysis, which includes 52 different stud- and Parzanini et al. (2018a) for temperate latitudes; and
ies. The literature search was carried out through Scopus and Jeffreys et al. (2009), Churchill et al. (2015), Shipley et
Google Scholar portals using the following key words: sta- al. (2017), and Richards et al. (2019) for tropical regions (Ta-
ble isotopes, fatty acids, food webs, deep sea, trophic ecol- ble S1). FA composition (ARA, EPA, and DHA) data were
ogy, and trophic relationships. Additional sources provided collected from Pétursdóttir et al. (2008a, b) and Würzberg
by an anonymous referee were also included. These stud- et al. (2011a, b, c) for polar areas; Lewis (1967), Howell et
ies were used to analyze global trends in δ 15 N, δ 13 C, and al. (2003), Hudson et al. (2004), Økland et al. (2005), Drazen
the essential arachidonic (ARA, 20 : 4ω6), eicosapentaenoic et al. (2008a, b), Stowasser et al. (2009), Murdukhovich et
(EPA; 20 : 5ω3), and docosahexaenoic (DHA, 22 : 6ω3) acids al. (2018), Parzanini et al. (2018a), Salvo et al. (2018), van
across deep-water communities. ARA, EPA, and DHA are Oevelen et al. (2018), and Kharlamenko et al. (2018) for tem-
the most important nutrients in aquatic ecosystems, required perate regions; and Jeffreys et al. (2009) and Shi et al. (2018)
by organisms for optimal health (Parrish, 2009), as well as for tropical regions (Table S2).
being excellent trophic biomarkers. In fact, whereas EPA and
DHA are typically used as biomarkers in diatoms and di- 2.2 Statistical analysis
noflagellates, respectively (Parrish, 2013), in the deep sea,
ARA is associated with microorganisms from the sediment Comparisons among multiple groups of deep-sea organ-
(Howell et al., 2003). Our study focused on these three FAs isms were run through t tests and one-way analysis of vari-
since they are present in all the organisms under analysis. ance (ANOVA). In particular, isotopic (i.e., δ 15 N, δ 13 C)
and FA (i.e., ARA, EPA, and DHA) data were com-
2.1.2 Variables considered pared across organisms from different latitudes (i.e., trop-
ical, temperate, and polar), habitats (i.e., pelagic, demer-
Each species from each investigation was sorted by lati- sal, benthic), and collection depths (i.e., mesopelagic, bathy-
tude (i.e., tropical, 0–30◦ ; temperate, 30–60◦ ; and polar, 60– pelagic, meso-bathypelagic, abyssopelagic, bathyal, bathyal-
90◦ ), habitat (i.e., pelagic, demersal, and benthic), depth abyssal, abyssal, and hadal) to detect any significant dif-
at collection (i.e., mesopelagic, 200–1000 m; bathypelagic, ferences. When the normality assumption was violated,
Biogeosciences, 16, 2837–2856, 2019 www.biogeosciences.net/16/2837/2019/C. Parzanini et al.: Insights into deep-sea food webs and global environmental gradients 2845
Table 3. List of trophic ecology studies in deep-sea heterotrophic systems, carried out using stable isotopes (bulk) and lipids (including FA)
as food-web tracers. Experimental studies were excluded a priori. Reference, method(s) applied, latitude, sampling depth, ocean region, and
taxa analyzed are reported for each study. Polar latitudes include investigations between 60 and 90◦ N or S, whereas temperate and tropical
latitudes represent studies carried out within 0–30 and 30–60◦ N, respectively. References are ordered according to sampling depth(s).
References Method(s) Latitude Depth Ocean region Taxa analyzed
(m)
Mintenbeck et al. Stable Polar 50–1600 Weddell Sea Benthic bryozoans, cnidarians, crus-
(2007) isotopes (Antarctic) taceans, echinoderms, echiurans, mol-
lusks, sponges, sipuncules, and tuni-
cates
Quiroga et al. (2014) Stable Polar 250–322 Weddell Sea Benthic annelids, crustaceans, bry-
isotopes ozoans, tunicates, cnidarians, echin-
oderms, mollusks, nemertean worms,
sponges, and sipuncules
van Oevelen et al. Stable Polar/ 270–850 Trænadjupet Trough Cold-water coral communities
(2018) isotopes, temper- (Norwegian continental
lipids ate shelf), Belgica Mounds
(Porcupine Seabight)
Mincks et al. (2008) Stable Polar 550–650 Bellingshausen Sea Benthic annelids, cnidarians, echino-
isotopes derms, mollusks, and sponges; demer-
sal fish
Würzberg et al. (2011a) Lipids Polar 600–5337 Weddell Sea Shelf and deep-sea peracarid crus-
(Antarctic) taceans and foraminiferans
Würzberg et al. (2011b) Lipids, Polar 600–2150 Weddell Sea Demersal fish
gut (Antarctic)
contents
Würzberg et al. (2011c) Lipids Polar 600–5337 Weddell Sea Shelf and deep-sea polychaetes
(Antarctic)
Iken et al. (2005) Stable Polar 800–2082 Canadian High Arctic Benthic cnidarians, crustaceans,
isotopes Basin echinoderms, echiurans, mollusks,
and polychaetes; pelagic crustaceans
Pétursdóttir et al. Stable Polar 1000–2000 Reykjanes Ridge Mesopelagic crustaceans and fish
(2008a) isotopes, (North Atlantic)
lipids
Pétursdóttir et al. Stable Polar 1000–2001 Reykjanes Ridge Mesopelagic crustaceans and fish
(2008b) isotopes, (North Atlantic)
lipids
Bergmann et al. (2009) Stable Polar 1300–5600 HAUSGARTEN obser- Benthic cnidarians, crustaceans,
isotopes vatory, west Svalbard echiurans, echinoderms, mollusks,
(Arctic) nemertean worms, polychaetes,
priapulids, sponges, and tunicates;
demersal fish
Valls et al. (2014a) Stable Temperate 40–400 Balearic Basin (western Mesopelagic fish and zooplankton
isotopes Mediterranean)
Sherwood et al. (2008) Stable Temperate 47–1433 Northwest Atlantic Cold-water corals
isotopes
Hamoutene et al. Lipids Temperate 50–1500 Cape Chidley, and Cold-water corals
(2008)∗ southern Grand Bank
(northwest Atlantic)
www.biogeosciences.net/16/2837/2019/ Biogeosciences, 16, 2837–2856, 20192846 C. Parzanini et al.: Insights into deep-sea food webs and global environmental gradients
Table 3. Continued.
References Method(s) Latitude Depth Ocean region Taxa analyzed
(m)
Boyle et al. (2012) Stable Temperate 55-1280 eastern North Pacific Benthic cnidarians, crustaceans, echin-
isotopes, oderms, mollusks, and polychaetes; de-
gut mersal fish
contents
Polunin et al. (2001) Stable Temperate 200–1800 Balearic Basin (western Demersal fish
isotopes Mediterranean)
Valls et al. (2014b) Stable Temperate 250–850 Balearic Basin (western Hyperbenthic echinoderms and hy-
isotopes Mediterranean) perbenthic/pelagic crustaceans, elasmo-
branchs and mollusks
Gale et al. (2013) Stable Temperate 258-1418 Northwest Atlantic Echinoderms
isotopes,
gut
contents
Carlier et al. (2009) Stable Temperate 300–1100 Ionian Sea (central Cold-water coral community
isotopes Mediterranean)
Parzanini et al. (2018a) Stable Temperate 310–1413 Northwest Atlantic Slope cnidarians, crustaceans, echino-
isotopes, derms, fish, mollusks, sponges, and tu-
lipids, nicates
elemental
Parzanini et al. (2018b) Lipids Temperate 310–1413 Northwest Atlantic Slope cnidarians, crustaceans, echino-
derms, fish, mollusks, sponges, and tu-
nicates
Parzanini et al. (2017) Stable Temperate 310–1413 Northwest Atlantic Pelagic and demersal fish
isotopes,
gut
contents,
morpho-
metrics
Madurell et al. (2008) Stable Temperate 350–780 Balearic Basin (western Suprabenthic crustaceans and fish
isotopes Mediterranean)
Kopp et al. (2018) Stable Temperate 415–516 Celtic Sea (northeast Epifaunal crustaceans, mollusks,
isotopes Atlantic) and fish
Papiol et al. (2013) Stable Temperate 423–1175 Balearic Basin (western Benthopelagic crustaceans
isotopes Mediterranean)
Fanelli et al. (2013) Stable Temperate 445–2198 Balearic Basin (western Slope crustaceans and mollusks
isotopes Mediterranean)
Økland et al. (2004) Lipids Temperate 500–1600 Porcupine Bank and Demersal fish
western continental
slope (northeast
Atlantic)
Trueman et al. (2014) Stable Temperate 500–1500 Hatton Bank Demersal fish
isotopes (northeast Atlantic)
Kharlamenko et al. Stable Temperate 500–1600 Sea of Japan Echinoderms and mollusks
(2013) isotopes,
lipids
Biogeosciences, 16, 2837–2856, 2019 www.biogeosciences.net/16/2837/2019/C. Parzanini et al.: Insights into deep-sea food webs and global environmental gradients 2847
Table 3. Continued.
References Method(s) Latitude Depth Ocean region Taxa analyzed
(m)
Preciado et al. (2017) Stable Temperate 625–1800 Galicia Bank Demersal fish and pelagic/demersal
isotopes, (northeast Atlantic) crustaceans
gut
contents
Fanelli et al. (2009) Stable Temperate 650–780 Algerian Basin Mesopelagic crustaceans and fish;
isotopes (western Mediter- benthic crustaceans
ranean)
Fanelli et al. (2011a) Stable Temperate 650-800 Balearic Basin (western Zooplankton and micronekton
isotopes, Mediterranean)
gut
contents
Fanelli et al. (2011b) Stable Temperate 650–1000 Balearic Basin (western Epibenthic/infaunal nemertean worms,
isotopes Mediterranean) polychaetes, sipuncules, mollusks,
crustaceans, and echinoderms
Salvo et al. (2017) Lipids Temperate 770–1370 Northwest Atlantic Cold-water corals
Stowasser et al. (2009) Stable Temperate 785–4814 Porcupine Seabight and Moridae and Macrouridae fish
isotopes, Abyssal Plain (north-
lipids, gut east Atlantic)
contents
Hudson et al. (2004) Lipids Temperate 800–4850 Porcupine Seabight and Holothuroids
Abyssal Plain (north-
east Atlantic)
Howell et al. (2003) Lipids Temperate 1053–4840 Porcupine Abyssal Asteroids
Plain (northeast
Atlantic)
Tecchio et al. (2013) Stable Temperate 1200–3000 Mediterranean Sea Zooplankton
isotopes (western + central +
eastern)
Reid et al. (2012) Stable Temperate 2400–2750 Mid-Atlantic Ridge Benthic cnidarians, crustaceans,
isotopes (North Atlantic) echinoderms, fish, and sipuncules
Reid et al. (2013) Stable Temperate 2404–2718 Mid-Atlantic Ridge Deep-sea fish
isotopes (North Atlantic)
Kiyashko et al. (2014) Stable Temperate 2481–3666 Sea of Japan Benthic annelids, crustaceans,
isotopes ascidians, cnidarians, echinoderms,
mollusks and sponges
Mordukhovich et al. Lipids Temperate 3352–4722 Sea of Okhotsk and Deep-sea macro-benthic nematodes
(2018) Pacific Ocean
Kharlamenko et al. Lipids temperate > 4000 Sea of Okhotsk Benthic annelids, echinoderms,
(2018) mollusks, and sipuncules
Drazen et al. (2008a) Lipids Temperate 4100 eastern North Pacific Ophiuroids and holothuroids
Drazen et al. (2008b) Lipids Temperate 4100 eastern North Pacific Cnidarians, polychaetes, and
crustaceans
www.biogeosciences.net/16/2837/2019/ Biogeosciences, 16, 2837–2856, 20192848 C. Parzanini et al.: Insights into deep-sea food webs and global environmental gradients
Table 3. Continued.
References Method(s) Latitude Depth Ocean region Taxa analyzed
(m)
Drazen et al. (2008c)∗ Stable Temperate 4100 Eastern North Pacific Macrourid fish
isotopes,
gut
contents
Drazen et al. (2009) Lipids Temperate 4100 Eastern North Pacific Macrourid fish and cephalopods
Iken et al. (2001) Stable Temperate 4840 Porcupine Abyssal Demersal/benthic cnidarians,
isotopes Plain (northeast crustaceans, echinoderms, echiurans,
Atlantic) fish, mollusks, nematodes, polychaetes,
sipuncules, and tunicates
Lewis (1967) Lipids Tropical 0–4000 Off San Diego and Baja Demersal and pelagic crustaceans
California (eastern and fish
Pacific)
Jeffreys et al. (2009) Stable Tropical 140–1400 Arabian Sea Crustaceans, cnidarians, and
isotopes, echinoderms
lipids
Churchill et al. (2015) Stable Tropical 250–1200 south-central Gulf of Elasmobranchs
isotopes, Mexico, off Florida to
gut Louisiana (western
contents Atlantic)
Shipley et al. (2017) Stable Tropical/ 472–1024 Exuma Sound (The Elasmobranchs
isotopes polar Bahamas), Lancaster
Sound (Canadian
Arctic)
Richards et al. (2019) Stable Tropical 1000–3000 Gulf of Mexico Meso-bathypelagic fish
isotopes
Shi et al. (2018) Lipids Tropical > 6000 m Pacific Ocean Benthic amphipods
∗ The study was excluded from analyses because it did not meet the criteria outlined in Sect. 2.1.1 or did not include any data.
Mann–Whitney rank sum test, Kruskal–Wallis one-way 2.3 Results
ANOVA on ranks, and Dunn’s method pairwise comparisons
were performed instead. In addition, multivariate statistics,
Analyses revealed both latitudinal and depth-related trends
i.e., principal coordinate analysis (PCO) and permutational
for isotopic and essential FA composition. In particular, mean
MANOVA (PERMANOVA), were used to study the vari-
values (± SD) of δ 15 N and δ 13 C were significantly lower in
ability in the isotopic and FA composition of deep-water or-
deep-sea fauna sampled at high latitudes than in that col-
ganisms across different latitudes, habitats, collection depths,
lected at low latitudes (δ 15 N, ANOVA on ranks, H = 35.6,
and phyla. In addition, a distance-based linear model (Dis-
p ≤ 0.001; δ 13 C, ANOVA on ranks, H = 277.9, p ≤ 0.001;
tLM) was run to assess which of these four factors con-
Fig. 2). Conversely, no difference was detected across lat-
tributed the most to such a variability. PCO, PERMANOVA,
itudes in terms of ARA, but mean proportions (± SD) of
and DistLM were run on resemblance matrices, based on
EPA and DHA were significantly greater at polar latitudes
Euclidean distance for the isotopic data, and Bray–Curtis
than at temperate and tropical areas (EPA, ANOVA on ranks,
for the FA data. Data were not normalized or transformed
H = 11.4, p = 0.003; DHA, ANOVA on ranks, H = 63.6,
prior to analysis. Univariate statistics were conducted us-
p ≤ 0.001; Fig. 3). Similarly, PERMANOVA detected sig-
ing Sigmaplot 12.5, while PCO, PERMANOVA, and Dis-
nificant differences across latitudes in terms of both stable
tLM were run through Primer 7.0 with the add-on package
isotopes (pseudo-F = 81.4, p(perm) = 0.0001) and essential
PERMANOVA+ (Clarke and Gorley, 2006).
FAs (pseudo-F = 11.0, p(perm) = 0.0001).
When deep-water species were analyzed separately ac-
cording to their habitat, the same latitudinal trend in the
Biogeosciences, 16, 2837–2856, 2019 www.biogeosciences.net/16/2837/2019/C. Parzanini et al.: Insights into deep-sea food webs and global environmental gradients 2849
in their essential FA composition (EPA, ANOVA on ranks,
H = 12.1, p = 0.002; DHA, ANOVA on ranks, H = 43.6,
p ≤ 0.001, for benthic species; EPA, ANOVA, H = 6.4, p =
0.011, for pelagic taxa). In this regard, pelagic, demersal, and
benthic taxa had a different essential FA composition (ARA,
ANOVA on ranks, H = 39.7, p ≤ 0.001; EPA, ANOVA
on ranks, H = 12.5, p = 0.002; DHA, ANOVA on ranks,
H = 76.9, p ≤ 0.001; pseudo-F = 19.7, p(perm) = 0.0001).
Benthic species had the highest proportions of ARA and EPA
(p < 0.05), while demersal species had the highest levels of
DHA, although similar to those of pelagic species.
While mean values of both stable N and C isotope ratios
significantly increased with depth for benthic and demer-
sal species (δ 15 N, ANOVA on ranks, H = 63.9, p ≤ 0.001;
Figure 2. Stable N and C isotopic composition of deep-sea animals δ 13 C, ANOVA on ranks, H = 126.2, p ≤ 0.001), only δ 13 C
across latitudes. Mean values of δ 15 N (blue circles above) and δ 13 C ratios showed the same trend in pelagic taxa (ANOVA on
(orange circles below) (‰) measured in deep-sea organisms across ranks, H = 125.5, p ≤ 0.001). Proportions of EPA signifi-
polar, temperate, and tropical latitudes. Bars represent standard de- cantly decreased along the bathymetric gradient for pelagic
viation (polar, n = 235; temperate, n = 1469; tropical, n = 41). taxa (ANOVA on ranks, H = 12.3, p = 0.002), and levels of
ARA were significantly higher at abyssal depths for ben-
thic and demersal species (ANOVA on ranks, H = 39.7,
p ≤ 0.001). In addition, levels of δ 15 N, δ 13 C, and ARA in-
creased for benthic and demersal organisms with increasing
depth (δ 15 N, ANOVA on ranks, H = 84.7, p ≤ 0.001; δ 13 C,
ANOVA on ranks, H = 105.0, p ≤ 0.001; ARA, ANOVA
on ranks, H = 22.8, p ≤ 0.001). PERMANOVA revealed
significant differences in the isotopic (pseudo-F = 74.6,
p(perm) = 0.0001) and essential FA composition (pseudo-
F = 8.6, p(perm) = 0.0001) across collection depths.
Among the four variables considered (i.e., latitude, habitat,
collection depth, and phylum), analyses revealed that “habi-
tat” and “phylum” were the most important factors influenc-
ing the variability of the stable isotope (respectively 12 %
and 9 %; DistLM, adjusted R 2 = 0.4) and FA (respectively
Figure 3. Essential FA composition of deep-sea animals across lat- 8 % and 11 %; DistLM, adjusted R 2 = 0.3) composition of
itudes. Mean proportions of essential FA measured in the tissues deep-water organisms (Fig. 4).
of deep-sea animals from polar (blue bars), temperate (orange di-
agonal striped bars), and tropical (green vertical striped bars) lati- 2.4 Discussion
tudes. Bars represent standard deviation (polar, n = 176; temperate,
n = 227; tropical, n = 11). The present analysis shows, for the first time, the existence
of (a) latitudinal trends in both stable isotope and essential
FA composition of deep-sea organisms, with decreasing δ 13 C
isotopic composition was shown for deep-water benthic ratios and increasing ω3 LC-PUFAs towards the poles, and
species (δ 15 N, ANOVA on ranks, H = 40.5, p ≤ 0.001; (b) global bathymetric trends in the isotopic composition of
δ 13 C, ANOVA on ranks, H = 171.2, p ≤ 0.001), whereas, deep-water fauna for which mean levels of δ 15 N, δ 13 C, and
for demersal and pelagic species, only the δ 13 C ratios ARA increased with increasing depth. In addition, it provides
were significantly lower at higher latitudes (ANOVA on further evidence of the link, across latitudes and depth, be-
ranks, H = 105.7, p ≤ 0.001, for demersal species; ANOVA tween surface primary production of the surface waters and
on ranks, H = 11.5, p = 0.003, for pelagic species). PER- the deep-water consumers. The present findings generally
MANOVA showed that the isotopic composition of deep- align with reports of decreasing values of δ 13 C in surface-
sea animals was indeed statistically different across the three water plankton and POM towards the polar regions, in both
habitats (pseudo-F = 112.6, p(perm) = 0.0001), and benthic the Southern Hemisphere and Northern Hemisphere (Sackett
and demersal species had higher stable N and C isotope ratios et al., 1965; Rau et al., 1982; Francois et al., 1993), as well as
than the pelagic counterparts (p < 0.05). Conversely, only of increasing POM isotopic ratios along a bathymetric gradi-
benthic and pelagic species revealed a latitudinal gradient ent (Altabet et al., 1999). They also agree with Colombo et
www.biogeosciences.net/16/2837/2019/ Biogeosciences, 16, 2837–2856, 2019You can also read