Bangladesh HCTT Coordinated Needs Assessment (CNA) - Floods in Northeast (Haor) areas of Bangladesh, April-May 2017 - Humanitarian Response
←
→
Page content transcription
If your browser does not render page correctly, please read the page content below
Bangladesh
                    HCTT Coordinated Needs Assessment (CNA)

  Floods in Northeast (Haor) areas of Bangladesh, April-May 2017
                                            Report date: 20 May 2017

                                                                             Photo: CNA Team, Netrokona

                         Md. Yousuf Ali, Director-MIM, DDM, Email: ali_yousuf_86@yahoo.com
Contact for Inquiries:
                         Mahbubur Rahman, ERPC, CARE, Email: mahbubur.rahman@care.org
Floods in Northeast (haor) areas of Bangladesh April-May 2017

Contents
Background to the assessment ......................................................................................................................................... 2
Key Findings: Summary ..................................................................................................................................................... 2
Context of the Northeast (Haor) areas of Bangladesh ........................................................................................................ 7
Key Vulnerability characteristics of six affected haor districts ............................................................................................ 8
Situation Overview ......................................................................................................................................................... 10
Aggravating Factors ........................................................................................................................................................ 13
Assessment Methodology ............................................................................................................................................... 14
Food Security ................................................................................................................................................................. 18
Livelihoods and Income .................................................................................................................................................. 20
Market access ................................................................................................................................................................ 24
Access, Infrastrucure and Early Recovery Concerns ......................................................................................................... 24
Communication .............................................................................................................................................................. 25
WASH ............................................................................................................................................................................. 27
Shelter & NFIs................................................................................................................................................................. 30
Health ............................................................................................................................................................................ 32
Nutrition ........................................................................................................................................................................ 33
Education ....................................................................................................................................................................... 35
Gender Based Violence (GBV) ......................................................................................................................................... 37
Child Protection .............................................................................................................................................................. 40
Acronyms ....................................................................................................................................................................... 42
Annex A: Team composition ........................................................................................................................................... 44
Annex B: SADD by Upazila ............................................................................................................................................... 46
Annex C: D-Form Database ............................................................................................................................................. 48

                                                                                                                                                                                   1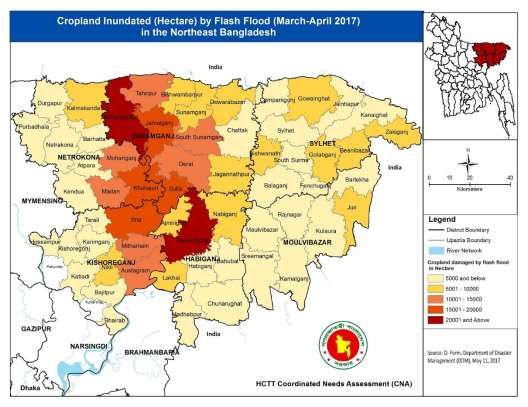
Floods in Northeast (haor) areas of Bangladesh April-May 2017
Background to the assessment
Heavy rainfalls as well as runoff from the upstream hills in India have led to early flooding of vast areas of croplands of
haors and low-lying areas of northeast Bangladesh. Flooding started on 28th March and gradually affected six districts
(Habiganj, Kishoreganj Moulavibazar, Netrokona, Sunamganj, and Sylhet). Rising water overflowed and breeched
embankments in many places and inundated vast areas of cropland, damaging a significant number of houses and
impacting the lives of more than 30% of the population of these six districts.
As agricultural land in this region remains under water for a large part of the year, there is only one cropping season in the
haors and this early onset flooding destroyed the 2017 crop of Boro rice (the primary crop) at its blooming stage, 20-30
days before harvest. The daily Dhaka Tribune has estimated, based on Ministry of Agriculture’s calculation, that the country
may lose around 800,000 MT of Boro rice this season1. Standing water has been contaminated by rotten paddy and plant
and a large number of fish and ducks have died2, although the exact cause is, as yet, unknown. Distress selling of livestock
as a negative coping mechanism has already been reported. This loss of the primary crop, together with the associated loss
of income for agricultural labourers and the loss of fish, will create severe food insecurity on top of the high underlying
poverty in the area unless assistance is received.
The Department of Disaster Management (DDM) requested this assessment which was supported by the Humanitarian
Coordination Task Team (HCTT). As per HCTT’s request, the Needs Assessment Working Group (NAWG) developed a plan
and presented at HCTT. With some revision the plan was adopted and a “Coordinated Needs Assessment (CNA)” was
initiated under the leadership of DDM and functional coordination of CARE Bangladesh.
Key Findings: Summary
Overall impact
The haor areas of northeast Bangladesh are almost entirely single cropped areas with the majority of the communities
dependent solely on the boro3 rice crop cultivated from October to May. Significantly heavier rainfall and runoff from India
caused early flooding across more than half the haor area, destroying the rice crop, fodder and killing fish and ducks. It is
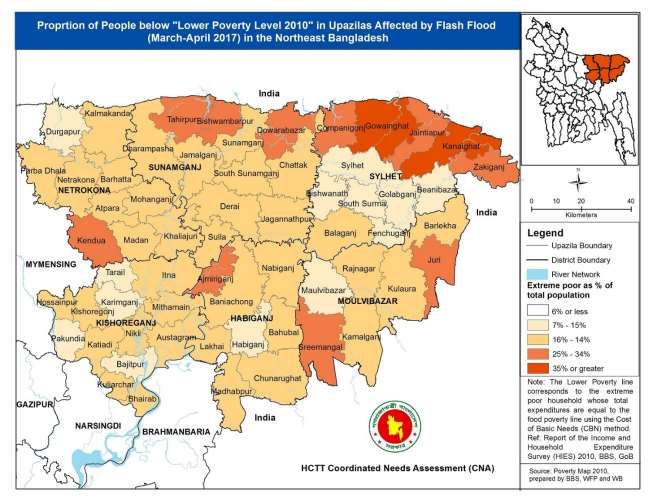
estimated4 that 4,667,000 people in 450 Unions (out of 530) in 60 Upazilas (out of 62) have been affected (to varying
degrees) in the six districts of Sunamganj, Sylhet, Netrokona, Kishoreganj, Habiganj, and Moulvibazar. With 65% of its
population affected, Sunamganj district is worst hit followed by Netrkona (33%) and Sylhet (25%). Approximately 21% of
the population is affected in the other districts.
Situation at a glance
People affected 4,667,000 (31% of population in affected area)
Districts affected 6 districts (Habiganj, Kishoreganj, Moulvobazar, Netrokona, Sunamganj, Sylhet)
Sunamganj is worst affected
Upazilas affected 60 (out of 62)
Unions affected 450 (out of 530)
Deaths 105
Boro rice crop Largely destroyed (estimated to be more than 30,400 million BDT4)
Fodder Serious losses
Fish Serious losses due to contaminated water
People affected 4,667,000
Houses damaged 28,037
Negative coping strategies Already reported reduction in food intake and in variety of food
1 http://www.dhakatribune.com/bangladesh/nation/2017/04/08/flash-flood-haors-may-worsen-rice-price-hike/
2 Shifting the Power Needs Assessment Report, April 2017
3 Boro rice season: winter cropping season in Bangladesh extending from October to April
4 DDM, D-forms, 11 May 2017
5 NDRCC report, 11/05/2017
2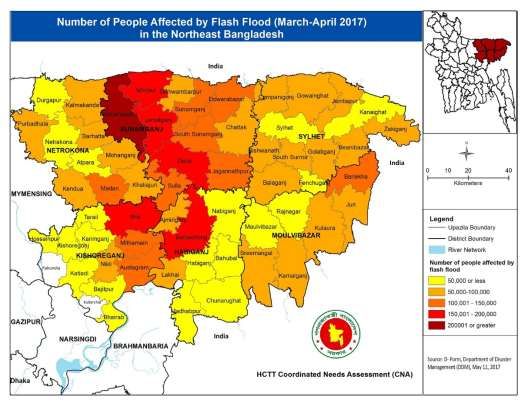
Floods in Northeast (haor) areas of Bangladesh April-May 2017
Overall key priority needs
The priority need identified by both men and women in all 27 locations was for immediate food assistance.
Most of the communities assessed reported that almost all households in the affected areas have lost most or all
their food stocks and have adopted negative coping strategies. Most have also lost a significant proportion of this
season’s (i.e. this year’s) income. Negative coping strategies such as reducing food intake or selling livestock and
poultry are being used. People are likely to be forced into more desperate coping strategies if alternative income
or sustained assistance is not available.
Feed for livestock and assistance with livelihoods support were the second priorities in almost all locations.
In ten sites, inadequate sanitation facilities were reported as a priority. This was a key area where some difference
could be noted between the male and female group responses. Women found sanitation to be more of a concern
than men and this could be related to or lead to protection concerns.. Although the sample size was small, this is
in line with other recent flooding events in Bangladesh.
Access to safe drinking water was identified as a priority in five of the six sites in Sylhet, but not prioritised
elsewhere, although it was highlighted as an issue in half the assessed sites overall.
Health and hygiene promotion activities need to be enhanced, water purification tablets provided, and Inter-
Agency Emergency Health kits prepositioned, to minimise, and respond to, the likely increase in communicable
diseases usually associated with severe flooding and a breakdown in sanitation.
In the areas where shelters/houses have been damaged, or are likely to degrade in the coming monsoon period,
assistance in effecting repairs (cash or materials) is a priority need.
Key Sector Findings
Food Security, livelihood and Income
Reduction in household income is the main impact for almost all the affected population.
Reduction in incomes has already impacted food access. The main problems identified by communities were:
Lack of food (cited as a problem in all 27 assessed sites),
Lack of cooking fuel (in 25 sites)
Poor quality of food (in 20 sites).
DDM (11 May 2017) report that over 870,000 farmers have been affected, as have the 55% of the landless
population who rely on seasonal labour (and would have been anticipating work during the upcoming harvest).
The major challenges to the resumption of livelihoods were identified as lack of livelihood assets and financial
resources, a lack of alternative income source and a lack of agricultural inputs.
Infrastructure
Infrastructure repair (embankments and culverts and river dredging) was also identified as an area that would
require external assistance.
Shelter
DDM reported more than 28,000 houses to be (fully or partially) damaged across four districts (Sunamganj (68%
of total), Moulvibazar (26%), Haobiganj (6%) and Sylhtet (0.07%).6
The CNA found reports to damage to housing in some areas, this appears to be localised to a few areas at this
stage. As the monsoon sets in it is expected that significantly more houses will become uninhabitable.
Overcrowded shelters offering insufficient privacy was the main problem identified by women.
Despite the poor condition of some homes, displacement was not identified as an issue in the CNA.
In a few sites, people reported having insufficient materials to make property repairs and in only one site was a
lack of NFIs identified as a problem.
WASH
Water and sanitation coverage in some of the haor areas of NE Bangladesh remain below the basic minimum level.
The water and sanitation coverage in the four districts assessed (Netrokona, Kisorganj, Sylhet, Sunamganj) is below
the Bangladesh average and all four districts are ‘low performing districts’ in that coverage is not effective or
uniform for all people living in the district with pockets of extreme disadvantage.
6 Moulvibazar and Haobiganj were not part of the primary data collection for the CNA because they were not considered among the 4 worst affected
districts overall.
3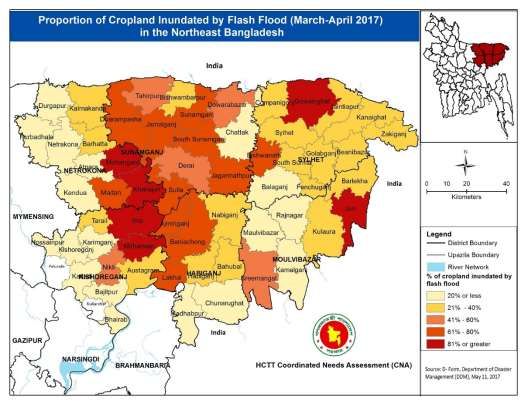
Floods in Northeast (haor) areas of Bangladesh April-May 2017
The floods have contaminated 24% of water points in Sunamganj, 18% in Sylhet, 16% in Kisoreganj, and 8% in
Netrokona. 7
In just over 50% of assessed sites, communities raised the issues of having insufficient water and poor quality of
drinking water.
In all except one ward communities said sanitation facilities were inadequate in terms of quality and, in the
majority of sites, communities reported insufficient latrines or none at all.
The low quality of ‘unimproved’ sanitation facilities and the absence of faecal sludge management gives rise to a
potential risk of skin disease and diarrhoeal disease. Although the department of public health has provided water
purification inputs the likelihood of water borne diseases remains.
Health
Respondents from Sylhet (100%), Sunamganj (83%), Kishoreganj (67%) and Netrokona (58%) have expressed their
observation as serious health problem due to the flash flood. Skin disease, snakebite and diarrhoea have been
identified by the community groups as prevailing threats in different locations of the assessment area.
Inter-Agency Emergency Health Kits (IEHK) are needed to be prepositioned to tackle the situation.
Health promotion and disease surveillance activities need to be enhanced.
Nutrition
42 CGDs (at 23 of the 27 sites) reported that health including nutrition is a serious problem.
All women’s community group discussions reported that feeding/breast-feeding children under 2 years are a
problem since the start of the flash flood.
The dietary and eating practices of women/girls been impacted more since the disaster than that of men and boys.
Pregnant and lactating women are not eating sufficient amounts of food.
Health of children has worsened since the disaster.
Education
School attendance has been impacted. Communities report that the main reasons children are not in school are:
Parents want their children to work/help the family recover
School is inaccessible
Inability to pay fees
Gender-based Violence
Physical assault was identified by community groups as the most common risk of violence confronting women and
girls (23 groups out of 54), followed by debt-bondage (9 groups out of 54).
Other identified risks of gender-based violence include desertion, sex trafficking, denial of resources and
opportunities, and increase in early/forced marriage linked to financial distress following disasters.
The observed absence of night lighting, unsafe access to bathing and latrine facilities, and limited accessibility to
services may indicate a broader spectrum of safety and security risk in Sylhet division that was not captured by
the assessment.
Communication
Information needs are highest in Sunamganj
Across all affected areas there is a particular need to provide information about how to access food; as well as
guidance about financial support and livelihoods.
60% of CGDs mentioned that no access to television was the main barrier of accessing information. People also
mentioned no access to a newspaper (51%), no electricity (51%), no credit for a mobile phone (36%) and no access
to radio (32%) as barriers of accessing information. The situation is different in different areas.
7 DPHE reported to WASH Cluster.
4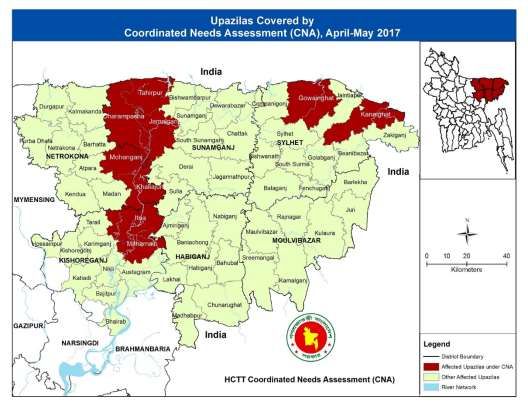
Overall Priority Needs
                       100%                                                     1

                                                      2
                       50%                                                                3
                                      6           4                                                      5
                                                              9       7                           8

                        0%

Figure 1 Overall priority needs

                           Total Female opinion
                                           1                                            Total Male opinion
                                                                                                      1
        70%                                                               70%
        60%                                                               60%
        50%                                                               50%             2
        40%                       2                                       40%
        30%                                           3                   30%                            3
                   5       4                                                        5             6              4
        20%                                   7           6    6          20%   5
        10%                               0                                                   7              0
                                                                          10%
         0%                                                                0%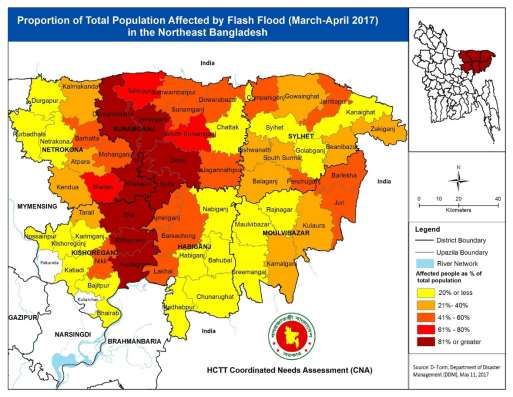
Floods in Northeast (haor) areas of Bangladesh April-May 2017

Figure 2 Male Vs Female groups opinion on priority

                                     Sunamgonj                                                       Sylhet
                                                     1                                                        1
     100%                                                                50%
      80%                                                                40%           2
                                                                               3
      60%                       2                                        30%
                                                         3                         4
      40%                                                        4       20%                                                 5
                         5                    6                                                 6
      20%           0                     0                  0           10%                             0            0             0
       0%                                                                 0%

                                    Netrakona1                                                 Kishorgonj
     70%                                                                                                       1
     60%                                                                 70%
     50%                                                                 60%
     40%                       2                                                       2
                                                         3               50%
     30%                                                                 40%                                          3
     20%                5                     4                      4   30%
     10%        0                         0                  0           20%   0   4             0       0                   0      4
      0%                                                                 10%
                                                                          0%

Figure 3 Key priority needs by district

                                                                                           6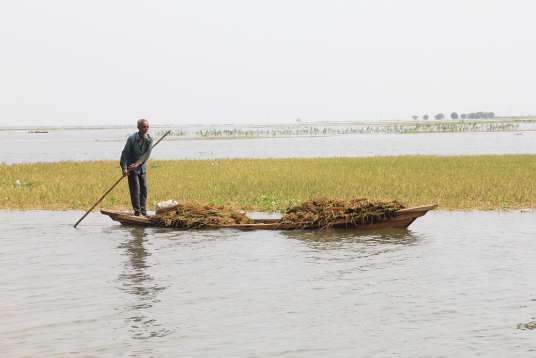
Floods in Northeast (haor) areas of Bangladesh April-May 2017
Context of the Northeast (Haor) areas of Bangladesh 8
A haor is a bowl, or saucer-shaped, shallow natural depression found
in Northeast Bangladesh. One of the key characteristics of the haor Haor: fast facts
region is that a number of these water bodies connect during the Natural depression of unique hydro-
monsoon forming vast bodies of water. In the dry season over winter ecological characteristics
water recedes again leaving a series of wetland habitats. It is a unique
wetland hydro-ecological environment rich in biodiversity. Total number of haor: 373
The Haor Basin spreads across seven districts; Sylhet, Sunamganj, Area coverage: 1.99 million ha(13.5% of
Habiganj, Moulvibazar, Kishoreganj, Brahmanbaria and Netrokona, country’s total land)
covering an area of 20,022 sq km. Three distinct rivers flow through 7 haor districts: Sylhet, Sunamganj,
the region bringing with them an inflow of water from India. Habiganj, Moulvibazar, Kishoreganj,
Bordering the Meghalaya region of India means that the haors, Brahmanbaria and Netrokona.
already a region receiving the highest precipitation in the world, can Total population: 19.37 million (12% of
be exposed to huge inflow of water from across the border. Pre- national population)
monsoon flash floods are the major natural disaster the region faces
threatening the boro crop almost every year. Boro rice is the only Major contribution to national economy:
major crop in the haors, accounting for most of the region’s income - estimated annual production of 5.25
and providing most of its employment so the local economy is tightly million MT of rice
linked to a successful harvest. On average an estimated 5.25 million - country’s 20% inland fish production,
MT of rice is produced in the haors accounting for 18% of 22% cattle production and 22% duck
Bangladesh’s total rice production. The region has an estimated fish production
habitat area of around 967,000 ha as well as 269,005 ha of forest
Numerous aquatic and forest resources
resources, valuable minerals and energy resources. including pearl mussels, migratory birds
The pre-monsoon season is characterized by increasing rainfall and and numerous other ecosystem services.
flash floods. The bulk of the annual rainfall occurs during the
monsoon season when flash floods are regular and frequent and the central part of the Northeast Region is flooded to a
depth of several meters. The post-monsoon is characterized by decreasing rainfall and the draining of water accumulated
in the monsoon season. The dry season is one of little or no rain, and river inflow is greatly reduced.9
8 Haor Advocacy Platform, Position Paper, 27 April 2017
9 More info: http://www.iwmbd.org/haorweb/
7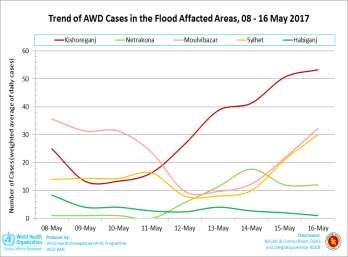
Floods in Northeast (haor) areas of Bangladesh April-May 2017

Key Vulnerability characteristics of six affected haor districts 10
                                                                                                                      Data Source
Key indicators           Netrokona Sunamgonj         Sylhet     Kishoregonj   Habiganj     Moulvibazar   National
                                                                                                                      and Year

                                                                                                                      BBS Census,
Total population          2,229,642     2,467,968   3,434,188     2,911,907    2,089,001     1,919,062 14,39,25006
                                                                                                                      2011

Population in rural                                                                                                   BBS Census,
                          1,970,781     2,204,389   2,672,142     2,422,998    1,844,035     1,710,983 11,04,80,514
areas                                                                                                                 2011
                                                                                                                      BBS Census,
Pop density/km2              798           659         995          1,083         792           686        1,203      2011
Gender Ratio                                                                                                          BBS Census,
                               99          100         101            97           96             97      101.24
(male/female %)                                                                                                       2011
% of population with                                                                                                  BBS Census,
                             30.2         34.0         62.9          49.6        47.7           50.8            57
electricity                                                                                                           2011
% HH using solid fuel
                             99.8         98.4         79.3          94.1        97.3           96.3        88.2      MICS, 2013
for cooking
% HH Use Improved
                             100          99.5         83.8          100         99.2           98.9        97.9      MICS, 2013
drinking water sources
% with access to
                             41.7         50.8         63.5          41.1        52.0           66.7        55.9      MICS, 2013
improved sanitation
                                                                                                                      The World
Life expectancy                                                                                          70.7 yrs
                                                                                                                      Bank, 2013

                                                                                                                      MSVR,BBS,
Under 5 mortality/1000       56.2         91.7         66.8          24.7        50.3           45.7            42    2014
% Severely Child
                             30.3         26.2         20.7           20.        24.4           15.8       23.39      MICS, 2013
Stunted (MICS, 2012)
% Stunted children                                                                                                    BBS, WFP,
                               44           46           44           44           44             44        41.2
under 5                                                                                                               IFAD 2012
Maternal mortality per                                                                                                WHO, 2001,
                                                                                                             220
1000                                                                                                                  UNICEF 2010

IPC Food security                                                                                                     IPC 2nd
                         Moderate       Severe      Moderate    Moderate      Moderate      Moderate        -         Round
Classification (CFI)
                                                                                                                      Chronic
% Below the upper                                                                                                     Analysis,
                             35.3           26         24.1          30.3        25.3            2.7        32.3      WB,
                                                                                                                      2015,2010
poverty line
                                                                                                                      Bangladesh
% Below the lower
                             19.5         20.6         19.5          16.4        20.1           21.1        18.4      WB, 2010
poverty line
% Underweight                                                                                                         BBS, WFP,
                               39           41           37           38           41             37        8.12      IFAD 2012
children under 5 years
                                                                                                                      BBS Census,
Literacy rates (%)          45.60        34.40        45.60          40.9        40.5           51.1       53.34
                                                                                                                      2011

Table 1: Key Indicators (source: IPC)

10 Key characteristics table prepared by IPC Bangladesh team
                                                                                                                                    8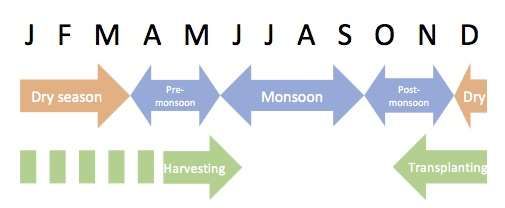
Floods in Northeast (haor) areas of Bangladesh April-May 2017

Map 1: Proportion of people below lower poverty line (produced by NIRAPAD)

                                                                                                                    9
Floods in Northeast (haor) areas of Bangladesh April-May 2017
Situation Overview
Map 2: Inundated areas of The Haor Region as at 12 May (produced by BRAC)
The impact of the flooding according to the Government of Bangladesh as at 11 May is summarised in the table below.
# of # of # of # of % of total # of Damaged Damaged
Name of
affected Affected Affected Affected population Damaged Cropland Crops
District
Upazila Union Household Population affected Houses (Hectare) (Mil BDT)
Habiganj 8 65 87,880 439,400 21% 1,746 56,560 4,751.04
Kishoreganj 13 61 152,481 609,924 21% - 61,207 8,642.43
Sunamganj 11 87 325,990 1,599,950 65% 18,969 131,285 13,128.50
Sylhet 13 105 212,520 850,080 25% 20 64,438 3,843.75
Moulvibazar 7 61 85,354 424,775 22% 7,302 21,513 1.18
Netrokona 10 71 167,180 743,494 33% - 69,710 33.94
Total 62 450 1,031,405 4,667,623 31% 28,037 404,713 30,400.83
Table 2: Key information on impact based on D-Forms of Government of Bangladesh (received 11/05/2017)
10Floods in Northeast (haor) areas of Bangladesh April-May 2017
Map 3: Number of total population affected by upazila (produced by NIRAPAD)
Map 4: Percentage of total population affected by upazila (produced by NIRAPAD)
11Floods in Northeast (haor) areas of Bangladesh April-May 2017
No Sex and Age Disaggregated Data (SADD) exists for the affected population, so the table below shows a proportional
breakdown based on census data of the affected districts11.
Total
0 - 19 yrs 65+ yrs Total Men Total Affected
District Women
F M F M
Habiganj Zila 107,078 111,027 10,294 10,673 215,723 223,677 439,400
Kishoreganj Zila 145,383 150,197 15,574 16,090 299,995 309,929 609,924
Moulvibazar Zila 99,555 102,675 9,552 9,851 209,111 215,664 424,775
Netrokona Zila 176,941 178,060 20,681 20,812 370,575 372,919 743,494
Sunamganj Zila 409,689 408,283 37,435 37,306 801,351 798,599 1,599,950
Sylhet Zila 212,759 210,327 17,330 17,132 427,483 422,597 850,080
Total 1,151,405 1,160,567 110,866 111,865 2,324,238 2,343,385 4,667,623
Table 3: Sex and Age Disaggregation (SADD) of affected Population (proportionate to the census data)
Response to date by government and other stakeholders:
The Government of Bangladesh has responded in many affected areas with distributions of rice and cash. 330,000
households are being given Vulnerable Group Feeding registration cards and a further 520,088 affected households will
receive a GR of rice and cash and cash through the Employment Generation Program for Poorest scheme.
GR Rice (MT) GR Rice (MT) VGF
District Total Total Allocation # of allotted VGF card Allocated rice (MT) for 3 month
Allocation for flood (from and 8 days (from 23 Apr to July
MoDMR) 2017) @ 30 Kg
Sylhet 428 2,437,000 50,000 4,900
Habigonj 503 1,400,000 29,000 2,842
Sunamgonj 1,550 8,500,000 150,000 14,700
Moulvibazar 343 1,450,000 1,000 98
Kishoregonj 652 3,870,000 50,000 4,900
Netrakona 648 4,240,000 50,000 4,900
Total 4,124 21,897,000 330,000 32,340
Table 4: Government response as of 12 May (NDRCC Report, 13 May 2017)
BRAC:
BRAC has provided livestock feed support (ready feed, wheat bran & rice brain) to 6,500 ultra-poor households in
Habigonj, Sunamgonj, Kishoregonj and Netrakona. According to their assessment these are the districts most in
need.
In line with GoB initiative, BRAC distributed a relief package consisting 30 Kg rice and BDT 500 to 59,461 worst
affected families in five districts (Kishoreganj, Sunamganj, Habiganj, Netrokona and Sylhet).
11N.B. this gives the vulnerable categories as in the BBS census data. The census gives the category 0-19
years unlike some age disaggregation that is 0-18 years. Total adult population (19-65 years) can be
calculated by subtracting vulnerable groups from the total.
12Floods in Northeast (haor) areas of Bangladesh April-May 2017
Dan Church Aid:
DCA Bangladesh will provide cash grant support to 1140 affected households consisting of BDT 4000 per HH in
Kalmakanda Upazila and Dharmapasha Upazila under Netrokona and Sunamganj District.
Bangladesh Red Crescent Society (BDRCS):
BDRCS is planning to distribute 2-week food packages to 400 affected people through its district branches in
Sunamganj, Netrakona, Kishorganj and Habiganj. They will provide Food package (Rice-25 kg, Pulse-2kg, Edible
Oil-2 L, Sugar-2 kg, Salt-1 kg, Suji (Semolina)-2 kg) for two weeks (the package is worth 2000 per household).
Oxfam:
Oxfam is in the process of proving support of BDT 4,000/HH through its partners in Sunamganj and Kishoreganj
districts. Proposals from partner agencies have been received and are being reviewed. The number of households
may increase.
Islamic Relief BD:
IRB will provide a 15-day food package (rice 20kg, dal 2kg, chhola 3kg, oil 2ltr, sugar 3kg) worth BDT 2000 to 7200
HH in Netrokona, Kishoreganj, Sunamganj and Sylhet.
IRB will also going to provide cash BDT 2000 to 1750 HH in the same districts.
Muslim Aid:
Muslim Aid will provide support in Sunamganj district of BDT 4000 per HH and a standard hygiene pack.
Aggravating Factors
Most of the challenges faced in haor region are linked to poverty. Overall district level indicators mask pockets of extreme
poverty in some parts of the region and poverty is manifest in food insecurity, under nutrition and fragile housing
construction materials all of which contribute to make households highly vulnerable to disasters and to circumstances such
as this years’ flooding which was both earlier and more severe than expected. The continual need to deal with flash
flooding events such as those recorded in 2002, 2004, 2007, 2009, 2010 and 2012 are considered as part of the reason for
people’s inability to escape ongoing extreme poverty (GoB flood response plan 2014).
The districts fall below the national average on a number of key indicators including access to electricity, literacy under 5
mortality (except for Kishorgonj), stunted children and underweight children (see table above)
Landlessness
Hoar inhabitants are constantly at risk of major flooding. The normal level of water in the rainy season causes considerable
damage every year on the island slopes as waves wash away a part of the island soil contributing to landlessness.
Landlessness is a significant issue in the area with some studies finding over 70% of the population to be effectively
landlessness 12. Landlessness is associated with poverty but in the haors it is also linked to this erosion of land on the hati
by wave action that takes place during the wet season. The density of population in these islands is high and houses located
on the edge of the islands are continually at risk of inundation and collapse so families in these homes face the on-going
risk of being displaced. In severe seasons, water levels during inundations reach 1.5m above the level of the floor of the
houses (JNA 2012).
Food insecurity and poor nutrition
The haor basin has been identified as one of the ‘highly food insecure’ regions of the country (WFP 2004). Sunamganj has
been classified in Level 4 or Severe Chronic Food Insecurity (CFI) by the Integrated Food Security Phase Classification (IPC),
Chronic Analysis. The three other districts have been classified in moderate CFI (Level 3)13. The physical conditions of the
haors together with the poor infrastructure are the root causes of the high levels of poverty in the region. (IFAD 2011).
12 P. K. Sarma, Scenario of haor vulnerabilities and other obstacles for sustainable livelihood development in Nikli Upazila, Bangladesh Agricultural
University Research System (BAURES), Bangladesh Agricultural University, Mymensingh- 2202, Bangladesh.
13 Chronic Food Insecurity Situation Overview in Bangladesh, December 2015; IPC
13Floods in Northeast (haor) areas of Bangladesh April-May 2017
Even though people have adapted their lives and livelihoods to live in the Haor areas, early flash flooding can have a
devastating effect as there is only one Boro crop planted annually (Haor Basin JNA 2012).
Rates of stunting are highest in the Haor region, out of all the FSNSP surveillance zones, where half of the children are
stunted (FSNSP, 2012, unpublished). The Haor region has a greater rate of adult malnutrition than the rest of the country
(FSNSP, 2012, unpublished). So any reduction in food security can have an important effect on overall nutrition if not
addressed. The timing of flooding is a critical factor in this. The 2010 flash floods occurred in April and washed away
immature crops, it was estimated that in the affected areas 80% of the Boro harvest was lost (Oxfam 2010) This flooding
in 2010 affected 75,000 people directly, according to EM-Dat, however, because the flooding took place in April (early) it
created far greater medium term food security needs. In 2012 the flash floods occurred after the harvest and people had
already secured their food, meaning there was an immediate food need (Haor Basin JNA 2012).
Infrastructure challenges
Lack of markets and power supplies has limited the growth of the non-farm sector and the growth of new employment
opportunities (IFAD 2011). There is very limited presence of financial institutions in the affected areas.
People living in the haors face greater challenges in transportation than those in many other parts of the country. Most
linking roads are submerged for six months of the year and movement is mainly only possible by boat. Motorized vehicle
transportation is possible only in major towns (Haor Basin JNA 2012). Boat transport can be both expensive and dangerous
depending on water conditions, naturally becoming even more challenged during floods. Women living in the haors are
particularly disadvantaged and vulnerable. Lack of roads affects women and girls more than men as they find it difficult to
travel by boat or walk on muddy tracks. This means they have less access to education, health services and employment,
which in turn contributes to social barriers (IFAD 2011).
On-going vulnerability
While flash floods are the main natural hazard people in the haors face, their on-going development is also frustrated by
other hazards including arsenic contamination, erosion and storms. This multiple hazard profile only increases their
vulnerability. As this is the very beginning of the rains and the monsoon can continue until September with late rains up
until November even a normal monsoon (as currently predicted by South Asian Climate Outlook Forum, April 2017) can
have a serious impact on lives and livelihoods.
Assessment Methodology
Overall objective:
To provide a shared understanding of the impact of the Flood in North-eastern haor districts of Bangladesh
Specific objectives:
To provide a shared and agreed overview of the situation in Sylhet, Sunamganj, Netrokona and Kishoreganj districts that-
Identifies priority needs
Provides approximate numbers of affected people
Identifies most severely affected geographic areas
Provides recommendations to inform strategic decisions
Gives voice to affected people
Expected Results:
1. Collection and collation of secondary data on NE flooding (including government, UN, aid agencies and other
assessments or data that has been collected)
2. 54 Community Group Discussions (CGD) (27 male, 27 female groups) at 27 sites.
3. 27 Direct Observations and 27 Severity Rankings at community level by the assessment teams (1 of each per site)
4. 9 Upazila Validation Meetings with PIOs/UNOs regarding the current situation and needs.
5. Compilation of D forms provided by DDM
14Floods in Northeast (haor) areas of Bangladesh April-May 2017
Expected Deliverables:
A. The assessment report shared with HCTT and other relevant aid stakeholders
B. A power point presentation on the summary/key findings
C. Static maps created using secondary and primary data
D. A complete data set of primary data
Data Sources:
27 purposively selected sites in 9 upazilas across 4 districts
Male and female Community Group Discussions (CGDs) at each site, 54 CGDs in total
Direct Observation and severity ranking at each site by assessment team
Upazila validation information at each upazila conducted with government officials
D forms provided by Department of Disaster Management
Secondary Data from pre-disaster and in-disaster sources
Sampling Strategy:
A purposive sampling method has been used to identify assessment areas based on what is known about this particular
disaster, referring specifically to information provided in available situation reports from INGO ESC and NIRAPAD.
Target # per Total target
Type of Site Description
Upazila (minimum) number
(Villages that have direct access to roads, facilities and
Mainland village 01 09
other communities without crossing any waterway)
(Island villages surrounded by water but easily accessible
Baro (large) hati 01 09
by boat, not far from mainland)
(Island villages surrounded by water, difficult to reach and
Choto (small) hati14 only accessible by boat, located far from mainland) 01 09
Total target 03 27
Geographic Targeting:
The four most affected districts – Sylhet, Sunamganj, Netrokona and Kishoreganj –within these districts 27 purposively
selected sites in 9 upazilas were identified as the sample for this assessment.
District Upazila Sites
Sunamganj Dharmapasa 3
Jamalgonj 3
Taherpur 3
Sylhet Goainghat 3
Kanaighat 3
Netrokona Khaliajuri 3
Mohonganj 3
Kishoreganj Itna 3
MithaimoIn 3
4 Districts 9 Upazilas 27 Sites
14 Hati are villages which appear to be islands in a haor where boat is the only transportation system. Sometimes hati do not appear as islands until the
rainy season.
15Floods in Northeast (haor) areas of Bangladesh April-May 2017
Timeframe:
Major Activity Start Date End Date
Planning Meeting 23-Apr 23-Apr
Form the Core Group 24-Apr 30-Apr
Area wise responsibility distribution
Formation of field teams
Finalize the methodology, sampling, TOR
Finalize the Qs and translate
Digitization of the Tools & Database
Field Orientation sessions 1-May 2-May
Field Assessment/data collection & entry 3-May 8-May
Data entry (using Tab/Android phone) 3-May 8-May
Review of the secondary data 3-May 8-May
Primary data analysis 9-May 11-May
First draft of the findings 12-May 15-May
Joint Analysis meeting (finding presentation to core group) 16-May 16-May
Incorporating Feedback from core group 17-May 20-May
Dissemination of the findings and report 20-May 20-May
Data Collection & Data Entry:
In each selected upazila three sites were chosen: one mainland village, one baro (large) hati and one chato (small hati). At
each site two community group discussions (CGDs) were held to discuss the assessment questions: one comprised 30-40
males and the other 30-40 females. In addition, field teams undertook a direct observation assessment. At the upazila level,
field teams met with the UNO/PIO in order to cross-check information, collect the D-form and ask other relevant questions.
Method of data Total
Geographic areas Remarks
collection formats
30-40 (max) male participants from different livelihood groups,
CGD-01 with Male 1
elderly, PWD etc.
30-40 (max) Female participants from different livelihood groups,
CGD-02 with Female 1 elderly, pregnant and lactating mothers, widow/divorced,
Mainland village
adolescent girl, PWD etc.
Direct observation through transit work, field visit and cross
Direct Observation 1
checking (if possible)
Severity Ranking 1 Will be done by respective field team after completing all tasks
CGD-01 with Male 1
CGD-02 with Female 1
Baro (large) hati
Direct Observation 1
Severity Ranking 1
As above
CGD-01 with Male 1
CGD-02 with Female 1
Choto (small) hati
Direct Observation 1
Severity Ranking 1
Upazila validation with Need to cross-check CGDs information, asking few new questions
Key informant interview 1
UNO/PIO as mentioned in format. Collection D-form etc.
Total formats for each Upazila 13
Each field team is requested to write down and submit any special findings/information of each discussion.
District focal will also collect the compiled D-Form or GoB any response form from District level.
16Floods in Northeast (haor) areas of Bangladesh April-May 2017
Map 5: Upazilas covered by CNA (produced by NIRAPAD)
17Floods in Northeast (haor) areas of Bangladesh April-May 2017
Detailed Assessment Findings
Food Security
Baseline
Sunamganj has been classified in Level 4 or Severe Chronic Food Insecurity (CFI) by the Integrated Food Security Phase
Classification (IPC), Chronic Analysis. The three other districts have been classified in moderate CFI (Level 3)15. Food access,
utilization, sanitation, caring practices and more especially poverty are the major limiting factors in the districts with higher
levels of Chronic Food Insecurity.
In all the four districts the status of food security outcomes - food consumption quality, quantity and under nutrition are
of major concern.
Limited livelihood opportunities and insufficient human, physical and financial capitals limit access to food and utilisation.
Impact and needs
A review of secondary data on flooding in the haor region identified the following major impacts flash floods 16:
Food stocks are damaged or destroyed.
Food security is affected through loss of crops, food stocks and agricultural inputs and equipment.
Potential disruption to markets (however these are restored quickly, in the flash floods of 2012 only one market
was not re-established in the first 48 hours).
Excessive rains combined with the onrush of water from the nearest Indian hills across the broader from the end of March
to 5 April inundated more than 60% standing boro paddy fields in North East Bangladesh. The flood has affected daily life
in the affected areas and many people have been marooned while houses, agricultural farms, and cultivable land have
been inundated. Water is declining gradually but the damage to crops is irrecoverable.17
All the community groups, both men and women, reported that they currently face a problem in relation to food. By far,
the most reported problem in relation to food was that households did not have enough food available, followed by
concerns about fuel for cooking and quality of food. The findings were similar for both male and female CGDs and across
districts18.
Overall and per gender Per district
60 20
50
15
40
per CGD
per CGD
30 10
20 5
10
0 0
Not enough No cooking No fuel to Not good No access Not enough No cooking No fuel to Not good No access to
food facilities cook with enough to markets food facilities cook with enough markets
food food
OVERALL MALE FEMALE Kishoreganj Netrakona Sunamganj Sylhet
Figure 4: Main problems in relation to food. Three options were mentioned by each of the 54 FGD (12 CDGs in. Kishoreganj,
12 in Netrakona, 12 in Sylhet, and 18 in Sunamganj)
15 Chronic Food Insecurity Situation Overview in Bangladesh, December 2015; IPC
16 Pre-disaster Secondary Data, The JNA Consolidation Project, March 2014
17 INGO Emergency Sub-committee, Sitrep No: 02, April 13, 2017
18 Please note, 2 upazilas in Kishoreganj, Netrakona and Sylhet, and 3 in Sunamganj.
18Floods in Northeast (haor) areas of Bangladesh April-May 2017
Communities reported that usually, at this time of the year, a majority of the communities have food stocks expected to
last more than 15 days. According to community groups now, food stocks have been mostly or completely destroyed.
Insufficient food was the main problem reported in relation to food security. The main reasons for not being able to access
food and other commodities in the market were that households could not afford food and commodities (reported by 51
out of 54 CGDs). Reasons given for this were:
1) prices have increased;
2) difficulty in accessing markets (16 out of 54 CGDs) due to road condition or transportation cost;
3) food and commodities are not available in the market as the supply chain has been disrupted;
Women’s access to markets (women mobility) was not considered an issue, as it was reported for only one CGD.
Overall and per gender
60
50
40
per CGD
30
20
10
0
Commodities not Food not available Difficulty accessing Cannot afford Cannot afford food others
available in the in the market market (road commodities (prices have
market condition or (prices have increased)
transportation increased)
cost)
OVERALL MALE FEMALE
Figure 5: Reasons for not being able to access essential food for all the CDGs and by gender. (Each of the 54 CGDs could
mention three options)
Per District
18
16
14
12
per CDG
10
8
6
4
2
0
Commodities not Food not available Difficulty accessing Cannot afford Cannot afford food others
available in the in the market market (road commodities (prices have
market condition or (prices have increased)
transportation cost) increased)
Kishoreganj Netrakona Sunamganj Sylhet
Figure 6: Reasons for not being able to access essential food per district. Note the chart shows total of male and female
CDGs for each district
Since the flooding began on 28th March, negative coping strategies are already being reported as households attempt to
address their food needs. Eating fewer meals per day, reducing meal size, selling livestock and poultry and purchasing food
on credit were reported in all districts by both male and female CGDs.
19Floods in Northeast (haor) areas of Bangladesh April-May 2017
OVERALL MALE FEMALE Kishoreganj Netrokona Sunamganj Sylhet
Eating fewer meals per day 2.07 0.93 1.15 0.39 0.54 0.78 0.37
Eating smaller meals (reduced meal 0.98 0.52 0.46 0.19 0.26 0.24 0.30
size)
Selling livestock and poultry 0.85 0.54 0.41 0.26 0.26 0.31 0.04
Purchasing food on credit 0.54 0.28 0.26 0.07 0.00 0.07 0.39
Reducing food consumption to 0.28 0.07 0.20 0.06 0.11 0.07 0.04
feed children
Borrowing money at high interest 0.26 0.20 0.06 0.09 0.02 0.07 0.07
Figure 7: Main coping strategies reported by CGDs (by gender and district)
The figure above shows the more frequently reported coping strategies. Selling advance labour, migration, selling
household possessions, eating less preferred food, and male family members migrating to find job opportunities were also
reported but less often than those above.
23 CGDs (12 male and 9 female) reported that they have taken a new loan/credit. The 1st source is Money Lender (9 CGD),
then Family/Relatives (8 CGDs) and Neighbours (5 CGDs). The interest rate has increased for around 25% of them
Livelihoods and Income
Baseline
About 15 million people live in the haor region in Bangladesh. 80% of them depend for their livelihoods on boro rice
cropping and fishing. The haor region produces 18% of Bangladesh’s rice and makes up of 6% of GDP.
According to government statistics (2014), 55% of the population were landless with the most marginalized depending on
physical labour in agriculture and fisheries. Seasonal wage labour was the main occupation for the majority people (37.5%),
the second most prevalent occupation was labour on agriculture farming (27.12%)19. 20% of people work in fishing.
In all four districts, the dependency on low value livelihood strategies are substantially high. Around 55% households are
engaged in agriculture; one in five households have unskilled day labour and around 27% population lives below the
poverty line. The limited livelihoods opportunities constrain the purchasing power of the households which, according to
the IPC food security classifications fall into Level 3 (Moderate) & 4 (Severe) in Chronic Food Insecurity.20
This lack of suitable alternative livelihoods people makes people susceptible to shocks.
There is very limited presence of financial institutions in the affected areas. Physical cash distribution is possible. Most of
the organisations planning for a response are planning for one month of multi-purpose cash grant. Mobile money transfer
is too costly and too lengthy for one instalment.
Human capital is limited due to low literacy rates, lack of adult education with literacy rate at 43%. This is a strong barrier
for economic development and in terms of acquiring technical skills for a better livelihood.
Moreover, recurrent natural disasters such as flash floods in the haor areas frequently worsen the acute food insecurity
which then impacts chronic food insecurity.
In the haor areas, the most affected people are marginal farmers and day labourers. According to the GoB statistics (2014),
55% of the population is absolutely landless and the most marginalized living depends on the physical labour in agriculture
field and fisheries. The seasonal wage labour was the main occupation for the majority of people (37.5%), second
occupation was labour 27.12% on agriculture farming and 20% was fishing. While the potential loss of crops by farmers in
the region is estimated to be around 879,360 MT, the farm labourers who are seasonally employed in these areas to harvest
the rice have lost around 263,808,000 person/day work (Nirapad situation report, May 4). Therefore, Cash Grant support
targeting the most affected households is recommended to help people resume their livelihoods and avoid negative coping
strategies.
Beside this, restoration of livelihoods is hampered due to lack of livelihood assets and financial resources to the affected
people. The early restoration of livelihoods and productive assets are essential steps towards recovery for the disaster-
19 Seasonal labour is predominantly for the harvest (and therefore time sensitive) while agricultural labour is the routine maintenance (weeding etc.)
20 IPC Chronic Food Insecurity Situation in 10 districts of Bangladesh - December 2015-2018/20
20Floods in Northeast (haor) areas of Bangladesh April-May 2017
affected communities. This has been particularly important and urgent for the affected population who are heavily
dependent on the agriculture and day labouring (both agriculture and non-agriculture). The affected people need to wait
for rehabilitation of roads and bridges, and prepare the land for the next agricultural season. Therefore, rehabilitation of
community infrastructure using local labour could help create alternative income sources for the affected people.
Impact and needs
This year, the floods came three weeks earlier than usual. An estimated 404,713 ha of croplands ready for harvesting and
305 tons of fodder for livestock was destroyed, and 2 thousand metric tons of fish and thousands of ducks have died21.
877,171 farmers have been affected. The estimated damage to crops is over 30 billion BDT22.
It is estimated that 263,808,000 days of seasonal daily labour on the harvest have been lost. (Nirapad situation report, May
4).
Large numbers of people who reside in the worst affected upazilas have incomes based on agriculture and fishing activities,
including daily labourers. When asked about the main occupations of the people at the site, 43 CGDs reported day labour
(agricultural and non-agricultural), 42 CGDs reported marginal/small famers, 27 groups reported day labour for fishing and
15 CGDs reported livestock. Most of the people have multiple activities. In the haor areas, the most affected people are
marginal farmers and day labourers. All community groups reported loss of livelihoods. These people have been seriously
impacted by the floods. The most impacted livelihood groups are the small and marginal farmers (52 of CGDs reported this
group to be impacted), agricultural day labour (48 CGDs), medium & big farmers (40 CGDs), fishermen (35 CGDs) and non-
agricultural day labour (24 GCDs).
The main impact on agriculture is on boro rice, which was considered severe23 by all the 54 CGDs, followed by fodder for
46 CGDs, then fisheries and then livestock. The reported likely impacts of this crop damage on immediate and long term
household food security will be no seed for cultivation of next crop (54 CGDs), no food stock for next 3 months (52 CDGs)
and loss of secure income (51 CGDs).
Across all districts, community groups expressed concern over how long it would take to resume livelihood activities. 51
CGDs (out of a total of 54) mentioned that their previous livelihood activities were expected to resume after 3 months or
more.
Major Challenges for Resumption of Livelihoods
100%
90%
80%
70%
60%
50%
40%
30%
20%
10%
0%
Kishoreganj Netrakona Sunamganj Sylhet
Lack of Agricultural inputs Lack of alternative source of income
Lack of financial resources Lack of infrastructure
Livelihood assets and financial resources
Figure 8: Major challenges related to livelihood resumption in the flood affected areas
The majority of both male and female CGDs reported that food, fodder, agricultural subsidy and agricultural inputs were
priority needs for in restoring food and livelihood status over the next six months. Agricultural inputs were specified as
21 Department of Disaster Management (DDM), Department of Agriculture Extension and Department of Fisheries
22 DDM
23 Explanation of severity: Severe damage- 50% damaged; Moderate damage- 20-50% damaged; Least damaged- less than 20% damaged
21Floods in Northeast (haor) areas of Bangladesh April-May 2017
seed (homestead, rice), fertilizer, fishing equipment (boat, fishing net) and cash support. Alternative income generating
activities, and market stabilisation were also seen as needs of the affected communities along with infrastructure repairs
including the reconstruction of embankments and culverts, opening of the water body and river dredging.
Map 6: Hectares of crop land affected Upazila wise (produced by NIRAPAD)
Map 3: Proportion of cropland affected Upazila wise (produced by NIRAPAD)
Response information
22Floods in Northeast (haor) areas of Bangladesh April-May 2017
The Government of Bangladesh has targeted 330,000 households to provide Vulnerable Group Feeding (VGF) registration
cards. Under this social safety net, each family receives 30 kg rice and cash 500 BDT every month until the next harvesting
season (March 2018). The remaining 520,088 affected households will receive a GR of rice and cash and cash through the
Employment Generation Program for Poorest scheme.
BRAC has responded by providing fodder, rice and cash (same package for cash as the GoB). A few INGOs are planning to
respond.
Food security and livelihoods response lessons learnt:
In 2012 in after the flash floods in Sylhet all the markets were functional again very quickly as is the usual
pattern in Bangladesh after a disaster. This implies that if affected households are given cash grants, they can
access all the survival materials.
In flash flood prone areas farmers use raised seedbeds which will have had a significant impact in preventing
losses24 so this needs to be investigated.
Recommendations
Immediate response:
Multi-Purpose Cash Grant (1st choice)
o Area: all affected districts, only affected upazilas and unions
o Selection criteria: as defined in the MPCG guideline25
o Exclusion of HH targeted by GoB
o Duration: 4-5 months
Other proposed recommendations:
o Emergency School Feeding in the flood affected schools
o Fodder and other animal food for the livestock
o Destocking of animal, at the price before the floods
Early Recovery/medium to longer term response
Alternate Income Generating Activities
Cash for work to support food assistance (after the monsoon) and infrastructure rehabilitation – should not
compete with agricultural seasonal activities
Longer term programme in livelihood with a study to explore the various livelihoods options existing and potential
opportunities
Advocacy
Advocacy issues can be addressed through the Haor Advocacy Platform (HAP)
Crop insurance
Cancellation of lease of water bodies for one year
Soft loan for the most vulnerable
Diversification of rice varieties: traditional, shorter term, flood immerged
Monitoring
Market prices and market stabilization
GoB suspension of loan repayment
Information gaps and recommended assessments
No additional assessment. Communities mentioned their fatigue of assessment without any support
Sectoral assessment to be determined at a later stage based on the situation
Points selling Open Market Sales (OMS) rice and flour have not been adequately stocked. The OMS operation that
began on 9 April failed to take into account how many ultra-poor families26 were affected in the region.
Additionally, allegations have arisen that unscrupulous middlemen are selling off OMS rice to local restaurants
(The Daily Star, April 26). Proper headcount of ultra-poor households that have been affected must be calculated
and relief distribution must be monitored.
24 Sylhet JNA 2012
25 See http://www.cashlearning.org/downloads/guidelines-on-mpg--final--april-24-2017-1.pdf
26 Defined as the group of people who eat below 80% of their energy requirements despite spending at least 80% of income on food.
23Floods in Northeast (haor) areas of Bangladesh April-May 2017
Market access
There was a market observed in most of the sites visited27 or located nearby (22 sites out of 27). Almost of all of
the markets were functioning (21 sites out of 22) with sufficient quantity and variety of food available (15 sites
out of 21); four sites did not normally have markets and in two sites the markets were not functioning. Assessment
teams found that prices in 26 markets had increased: 17 sites by 10-20% and prices in 8 by more than 20%. Access
to market is an issue for 16 Community Group Discussion (CGDs, 6 male and 10 female).
Access, Infrastrucure and Early Recovery Concerns
Key findings
Marginal farmers and agricultural and non-agricultural labourers are found as the most affected section of the
population, therefore, Cash Assistance targeting the most affected households is recommended to help people
resume their livelihoods and avoid negative coping strategies. Approximately 72% of assessed population stated
inability to resume their main income generating activities due to lack of livelihood assets and financial resources.
Community infrastructure is one of the major challenges for response and recovery interventions. Cash for Work
(CFW), Food for Work (FFW) and other safety net programmes is recommended to rehabilitate essential
community infrastructures including roads, culverts and embankments with the deployment of local labourers to
support early recovery of affected community. Timing for CFW, FFW needs to consider labour demand for
upcoming agriculture season.
Build Back Better approach should be considered during repairing and rehabilitating community infrastructure
considering the existing vulnerabilities of the affected areas. Linking early recovery resources and interventions
(such as cash/food for work) to shelter reconstruction will provide added advantage and should be considered,
therefore.
Community infrastructure
Access and transport is a major issue in the haor area. Most linking roads were submerged at the time of the assessment
and movement is mainly only possible by boat. Lack of transportation is hampering response activities and recovery of
livelihoods, education, health and other sectors. Construction and reconstruction of essential community infrastructure is
emphasized for early recovery of communities and the local economy. Deployment of local labours during repairing and
rehabilitation of essential community infrastructures will be an important way to increase employment opportunities of
the affected people and promote recovery of affected communities. A build Back Better approach also needs to be
considered along with how to best address the existing vulnerabilities of the affected areas.
Recommendations
Short Term Recommendation (Off-Farm Livelihoods)
Off-Farm livelihood inputs and cash support to the affected families for resumption of livelihoods
Cash for training for off-farm livelihood interventions
Mid-Term Recommendation (Community Infrastructure)
Reconstruction and repair of community infrastructures (such as roads and embankments) using local labourers
Creation of alternative income generation opportunities.
Raising school grounds, graveyards and bazars which can also uses as community place
Slope protection to save community infrastructure from wave action
Capacity building of local community for regular operation of cross drainage structures
Introduce green technology for protection from wave erosion
27 From the Direct Observation questionnaire
24You can also read