Characterization of aerosol composition, aerosol acidity, and organic acid partitioning at an agriculturally intensive rural southeastern US site ...
←
→
Page content transcription
If your browser does not render page correctly, please read the page content below
Atmos. Chem. Phys., 18, 11471–11491, 2018
https://doi.org/10.5194/acp-18-11471-2018
© Author(s) 2018. This work is distributed under
the Creative Commons Attribution 4.0 License.

Characterization of aerosol composition, aerosol acidity, and
organic acid partitioning at an agriculturally intensive rural
southeastern US site
Theodora Nah1,a , Hongyu Guo1 , Amy P. Sullivan2 , Yunle Chen1 , David J. Tanner1 , Athanasios Nenes1,3,4,5 ,
Armistead Russell6 , Nga Lee Ng1,3 , L. Gregory Huey1 , and Rodney J. Weber1
1 School of Earth and Atmospheric Sciences, Georgia Institute of Technology, Atlanta, GA, USA
2 Department  of Atmospheric Science, Colorado State University, Fort Collins, CO, USA
3 School of Chemical and Biomolecular Engineering, Georgia Institute of Technology, Atlanta, GA, USA
4 ICE-HT, Foundation for Research and Technology, Hellas, 26504 Patras, Greece
5 IERSD, National Observatory of Athens, P. Penteli, 15236 Athens, Greece
6 School of Civil and Environmental Engineering, Georgia Institute of Technology, Atlanta, GA, USA
a now at: School of Energy and Environment, City University of Hong Kong, Kowloon, Hong Kong, China

Correspondence: Rodney J. Weber (rweber@eas.gatech.edu)

Received: 10 April 2018 – Discussion started: 26 April 2018
Revised: 6 August 2018 – Accepted: 7 August 2018 – Published: 15 August 2018

Abstract. The implementation of stringent emission regula-        centration divided by the total oxalic acid molar concentra-
tions has resulted in the decline of anthropogenic pollutants     tion) ranged between 47 % and 90 % for a PM1 pH of 1.2 to
including sulfur dioxide (SO2 ), nitrogen oxides (NOx ), and      3.4. The measured oxalic acid gas–particle partitioning ratios
carbon monoxide (CO). In contrast, ammonia (NH3 ) emis-           were in good agreement with their corresponding thermody-
sions are largely unregulated, with emissions projected to in-    namic predictions, calculated based on oxalic acid’s physico-
crease in the future. We present real-time aerosol and gas        chemical properties, ambient temperature, particle water, and
measurements from a field study conducted in an agricul-          pH. In contrast, gas–particle partitioning ratios of formic and
turally intensive region in the southeastern US during the        acetic acids were not well predicted for reasons currently un-
fall of 2016 to investigate how NH3 affects particle acid-        known. For this study, higher NH3 concentrations relative to
ity and secondary organic aerosol (SOA) formation via the         what has been measured in the region in previous studies had
gas–particle partitioning of semi-volatile organic acids. Par-    minor effects on PM1 organic acids and their influence on the
ticle water and pH were determined using the ISORROPIA II         overall organic aerosol and PM1 mass concentrations.
thermodynamic model and validated by comparing predicted
inorganic HNO3 -NO−                    +
                       3 and NH3 -NH4 gas–particle partition-
ing ratios with measured values. Our results showed that de-
spite the high NH3 concentrations (average 8.1 ± 5.2 ppb),        1   Introduction
PM1 was highly acidic with pH values ranging from 0.9 to
3.8, and an average pH of 2.2 ± 0.6. PM1 pH varied by ap-         Ammonia (NH3 ) is the most abundant basic gas in the tro-
proximately 1.4 units diurnally. Formic and acetic acids were     posphere and plays an important role in many atmospheric
the most abundant gas-phase organic acids, and oxalate was        processes. It is a major neutralizer of atmospheric acidic
the most abundant particle-phase water-soluble organic acid       species, reacting readily with sulfuric acid (H2 SO4 ) and ni-
anion. Measured particle-phase water-soluble organic acids        tric acid (HNO3 ) to form ammonium sulfate and nitrate
were on average 6 % of the total non-refractory PM1 organic       salts (e.g., (NH4 )2 SO4 , and other forms such as NH4 HSO4 ,
aerosol mass. The measured molar fraction of oxalic acid in       (NH4 )3 H(SO4 )2 , and NH4 NO3 ), which are often the main
the particle phase (i.e., particle-phase oxalic acid molar con-   inorganic components of atmospheric aerosols. The forma-

Published by Copernicus Publications on behalf of the European Geosciences Union.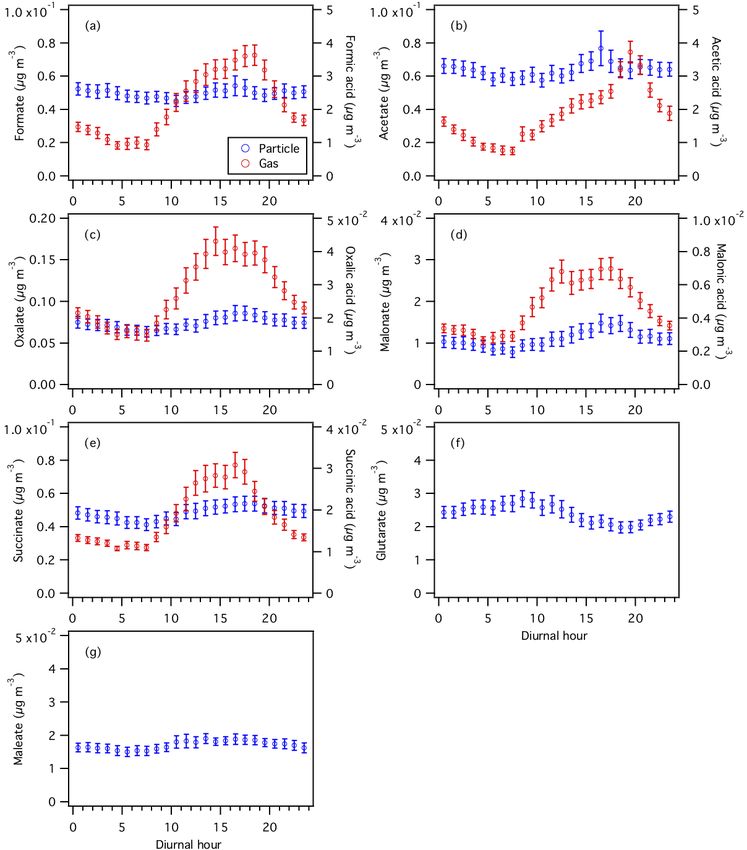
11472                T. Nah et al.: Characterization of aerosol composition, aerosol acidity, and organic acid partitioning

tion of particle-phase ammonium sulfate and nitrate salts          (J. Laskin et al., 2010; Updyke et al., 2012; Lee et al., 2013;
in the aerosol phase depends on the thermodynamic states           A. Laskin et al., 2015).
of their precursors and the environmental conditions, which           The southeastern US is a natural outdoor laboratory for
can consequently affect aerosol pH. For example, Guo et            studying the effects of biogenic–anthropogenic interactions
al. (2017b) showed that for southeastern US summertime             on atmospheric aerosol formation and processing. Subtropi-
conditions, as aerosol pH increases, the relative fractions of     cal vegetation composed mainly of mixed conifer and decid-
SO2−              −
    4 and HSO4 increase and decrease, respectively. Wet            uous forests emits large quantities of biogenic volatile or-
and dry deposition are the principle NH3 sinks (Dentener           ganic compounds (BVOCs) that can act as precursors for
and Crutzen, 1994). NH3 is spatially heterogeneous, with the       SOA formation (Blanchard et al., 2011, 2013a; Guenther
highest concentrations typically found near emission sources       et al., 2012). Large urban centers and small towns are sur-
(Seinfeld and Pandis, 2016). The dominant NH3 sources in           rounded by large expanses of forests and widespread rural
rural areas are agricultural in nature, and include the applica-   areas with agricultural activities. Scattered within the south-
tion of fertilizers and volatilization of livestock waste (Reis    eastern US are also coal-burning power plants and industrial
et al., 2009; Ellis et al., 2013; Van Damme et al., 2014).         facilities. Anthropogenic activities in this region emit large
Biomass burning, either from wildfires or from controlled          concentrations of VOCs, SO2 , NOx , CO, NH3 , and aerosols
burning during land-clearing operations, is also a significant     (Blanchard et al., 2013c). Similar to other parts of the US,
source of NH3 in rural environments. The primary source of         SO2 , CO, and NOx concentrations have decreased steadily
NH3 in urban areas is industrial emissions (e.g., NH3 syn-         in the southeastern US due to the implementation of emis-
thesis, manufacture of ammonium nitrate and urea, fluid, and       sion controls (Blanchard et al., 2013b). In contrast, gas-phase
thermal catalytic cracking processes in petroleum refineries),     NH3 concentrations have increased in the southeastern US
though vehicular emissions can be a significant NH3 source         over the same time period (Saylor et al., 2015). These factors
in some heavily populated cities (Reis et al., 2009; Lamar-        make the southeastern US an intriguing place to study the
que et al., 2010; Yao et al., 2013; Sun et al., 2017). Vehicular   influence of NH3 on atmospheric aerosol chemistry.
NH3 emissions are thought to be produced primarily from               We performed aerosol and gas measurements during a
the reaction of nitrogen oxide with hydrogen in the presence       field study conducted in Yorkville, Georgia, US, in the fall
of carbon monoxide in three-way catalysts of gasoline light-       of 2016, with the goal of understanding how NH3 affects
duty vehicles (Barbier Jr. and Duprez, 1994; Whittington et        aerosol acidity and SOA formation. The field site is sur-
al., 1995; Livingston et al., 2009; Suarez-Bertoa et al., 2014).   rounded by forest and agricultural land, affording an op-
   In the US, implementation of stringent emission controls        portunity to make ambient observations in an area impacted
on traditional anthropogenic air pollutants, such as sulfur        by local emissions of BVOCs and NH3 . In this paper, we
dioxide (SO2 ), nitrogen oxides (NOx ), and carbon monoxide        present gas and aerosol composition measurements that in-
(CO), have led to steady decreases in their emissions, and         clude a suite of organic acids. The thermodynamic equi-
consequently their concentrations (Blanchard et al., 2013b;        librium model, ISORROPIA II, is used to calculate par-
Xing et al., 2013). In contrast, NH3 emissions are largely un-     ticle water and pH based on measured inorganic aerosol
regulated and are projected to increase due to increased agri-     and gas composition (Nenes et al., 1998; Fountoukis and
cultural operations to feed a growing world population (Reis       Nenes, 2007), and these predictions are compared to ob-
et al., 2009; Ellis et al., 2013). Satellite observations showed   served gas–particle partitioning of NH3 , HNO3 , and or-
that gas-phase NH3 concentrations have increased substan-          ganic acids. Together, these measurements are used to de-
tially in US agricultural areas from 2002 to 2014 (Warner et       termine how aerosol acidity affects the mass concentration
al., 2017). More wildfires from a changing climate, or from        of particle-phase organic acids at this site.
controlled burning for land clearing for agricultural use, may
also lead to increased NH3 emissions (Reis et al., 2009; Pe-
chony and Shindell, 2010; Warner et al., 2016). These trends       2     Methods
suggest that NH3 could play an increasingly important role
in atmospheric chemistry.                                          2.1    Field site
   Previous laboratory studies have shown that NH3 can in-
fluence secondary organic aerosol (SOA) formation and pro-         Aerosol and gas measurements were conducted at the
cessing. For example, NH3 increases SOA mass yields in             Yorkville, Georgia (33.929◦ N, 85.046◦ W) SouthEastern
the α-pinene ozonolysis system and is hypothesized to be           Aerosol Research and Characterization (SEARCH) field site
due to the formation of ammonium salts from the reaction           from mid-August to mid-October 2016. This is one of the
of NH3 with organic acids (Na et al., 2007). The heteroge-         sampling sites for the Southeastern Center for Air Pollution
neous uptake of NH3 by SOA can also lead to the formation          and Epidemiology (SCAPE) study in which aerosol charac-
of particulate organonitrogen compounds, a class of brown          terization measurements were conducted in the summer and
carbon species that can reduce visibility and impact climate       winter of 2012 (Xu et al., 2015a, b). A detailed description
                                                                   of the field site can be found in Hansen et al. (2003). This

Atmos. Chem. Phys., 18, 11471–11491, 2018                                              www.atmos-chem-phys.net/18/11471/2018/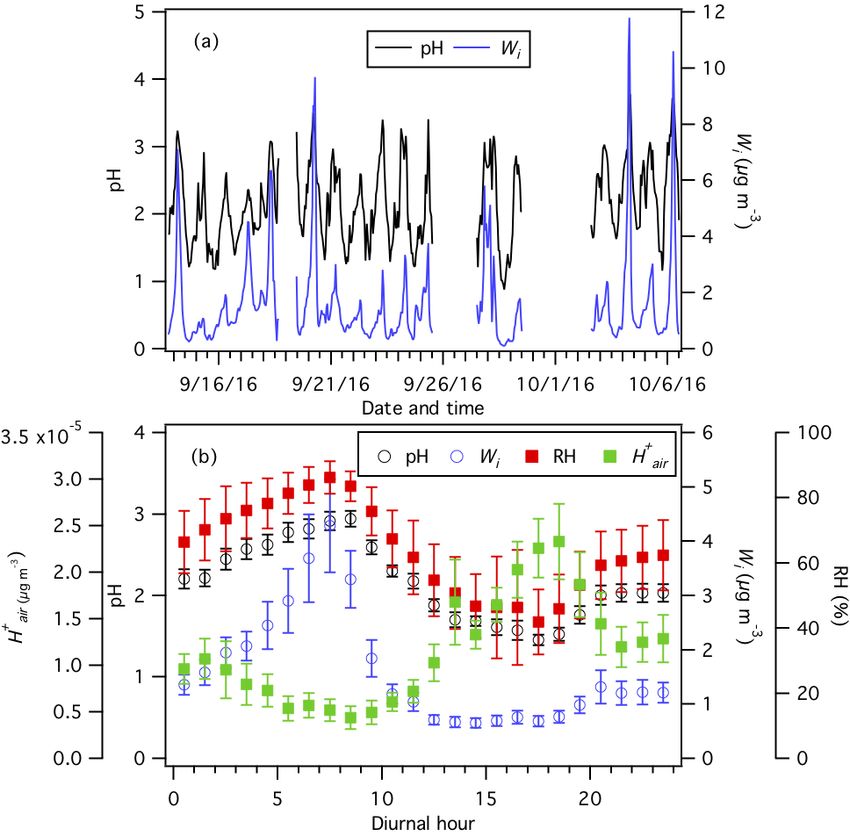
T. Nah et al.: Characterization of aerosol composition, aerosol acidity, and organic acid partitioning                      11473

rural site is situated in a mixed forest–agriculture area ap-        Background measurements were performed every 25 min
proximately 55 km northwest and generally upwind of At-           for 4 min for both the SF6 -CIMS and NH3 -CIMS. Dur-
lanta. The immediate surrounding area is used for cattle          ing each background measurement, the sampled air flow
grazing and poultry concentrated animal feeding operations        was passed through an activated charcoal scrubber (Sigma
(CAFOs) (Fig. S1 in the Supplement). There are no major           Aldrich) that removed SO2 , HNO3 , and organic acids prior
roads near the field site and nearby traffic emissions were       to delivery into the SF6 -CIMS, and through a silicon phos-
negligible. A large coal-fired power plant (Plant Bowen) is       phate scrubber (Perma Pure LLC) that removed NH3 prior to
situated approximately 25 km north of the site. Hence, the        delivery into the NH3 -CIMS. More than 99 % of the targeted
field site is impacted mainly by BVOC and NH3 emissions,          species were removed during background measurements for
with occasional spikes in SO2 and minimal influence from          both the SF6 -CIMS and NH3 -CIMS. Standard addition cal-
urban anthropogenic pollutants such as HNO3 , O3 , NOx ,          ibrations were performed every 5 h for the SF6 -CIMS using
and CO (Fig. S2). The sampling period was characterized by        the outputs of a 1.12 ppm 34 SO2 gas cylinder (Scott Marrin
moderate temperatures (24.0 ◦ C average, 32.6 ◦ C maximum,        Inc.) and a formic or acetic acid permeation device (VICI
9.5 ◦ C minimum) and high relative humidities (RHs) (68.9 %       Metronics). Calibrations for the other gases measured by the
RH average, 100 % RH maximum, 21.6 % RH minimum).                 SF6 -CIMS were performed in post-field laboratory work, de-
Meteorological data are shown in Fig. S3. Data reported are       tails of which can be found in Nah et al. (2018) and Sup-
displayed in eastern daylight time (EDT).                         plement Sect. S1. Standard addition calibrations were per-
                                                                  formed hourly for the NH3 -CIMS using the output of a NH3
2.2   Instrumentation                                             permeation device (KIN-TEK). The outputs of the formic
                                                                  and acetic acid permeation devices were measured periodi-
Instruments were housed in a temperature-controlled (∼            cally by scrubbing the output of the permeation tube in deion-
20 ◦ C) trailer during the field study. Gas-phase HNO3 , SO2 ,    ized water, followed by ion chromatography analysis for for-
and organic acids (formic, acetic, oxalic, butyric, glycolic,     mate and acetate. The emission rate of the NH3 permeation
propionic, valeric, malonic, and succinic acids) were mea-        device was measured using UV optical absorption (Neuman
sured with a custom-built chemical ionization mass spec-          et al., 2003).
trometer (CIMS) using sulfur hexafluoride ions (SF−      6 ) as      The detection limits for species measured by the SF6 -
reagent ions. SO2 and HNO3 were detected as fluoride              CIMS and NH3 -CIMS were approximated from 3 times the
                            −q
adducts (F2 SO−  2 and NO3 HF, respectively) while the or-        standard deviation values (3σ ) of the ion signals measured
ganic acids (HX) were detected primarily as conjugated an-        during background mode. The detection limits for HNO3 ,
ions (X− ) using the quadrupole mass spectrometer (Huey et        SO2 , and the various organic acids measured by the SF6 -
al., 1995, 2004; Nah et al., 2018). This CIMS is referred         CIMS ranged from 1 to 60 ppt for 2.5 min integration peri-
to hereafter as the SF6 -CIMS. Gas-phase NH3 was mea-             ods, which corresponded to the length of a background mea-
sured with an additional custom-built CIMS using protonated       surement with a ∼ 4 % duty cycle for each m/z (Table S1 in
ethanol clusters ((C2 H5 OH)+  n ) as reagent ions. NH3 was de-   the Supplement). Measurement uncertainties for the concen-
tected primarily as NH+  4 ions with the quadrupole mass spec-    trations of HNO3 , SO2 , and the various organic acids orig-
trometer (Nowak et al., 2002; Yu and Lee, 2012; You et al.,       inate mainly from calibration measurements and were be-
2014a). This CIMS is referred to hereafter as the NH3 -CIMS.      tween 12 % and 25 % (Table S1). The detection limit for NH3
   Since HNO3 , NH3 , and organic acids may condense on           measured by the NH3 -CIMS was 1 ppb for 2.3 min integra-
surfaces, both SF6 -CIMS and NH3 -CIMS used inlet config-         tion periods, which corresponded to the length of a back-
urations that minimized wall interactions (Huey et al., 2004;     ground measurement with a ∼ 29 % duty cycle for the NH+        4
Nowak et al., 2006). Each CIMS was connected to an in-            ion. Measurement uncertainties for NH3 concentrations were
let (a 7.6 cm ID aluminum pipe) that protruded beyond the         13 %.
trailer’s wall by ∼ 40 cm into the ambient air. Both inlets          A high-resolution time-of-flight aerosol mass spectrom-
were ∼ 2 m above the ground. A donut-shaped ring was at-          eter (HR-ToF-AMS, Aerodyne Research Inc.) was used
tached to the ambient sampling port of each pipe to curtail the   to measure the elemental composition of ambient non-
influence of crosswinds on the pipe’s flow dynamics. Both         refractory PM1 (particles with aerodynamic diameters <
rings were wrapped with a fine wire mesh to prevent inges-        1 µm). Ambient air was sampled at 16.7 L min−1 through a
tion of insects. A flow of ∼ 2800 L min−1 was maintained          URG PM1 cyclone and then through a Nafion dryer prior
in each pipe using regenerative blowers (Ametek Windjam-          to delivery into the HR-ToF-AMS. Aerosols were dried to
mer 116637-03). Part of this flow (7 L min−1 for the SF6 -        RH < 20 % to eliminate the influence of RH on the HR-ToF-
CIMS and 4.6 L min−1 for the NH3 -CIMS) was sampled               AMS’s particle collection efficiency. A detailed description
through a custom-made three-way PFA Teflon valve, which           of the HR-ToF-AMS can be found in the literature (DeCarlo
connected the pipe’s center to the CIMS sampling orifice and      et al., 2006; Canagaratna et al., 2007, 2015). Briefly, the aero-
could be switched automatically between ambient and back-         dynamic lens of the HR-ToF-AMS focused the dried submi-
ground measurements.                                              cron aerosols into a narrow beam. The aerosols were then im-

www.atmos-chem-phys.net/18/11471/2018/                                          Atmos. Chem. Phys., 18, 11471–11491, 2018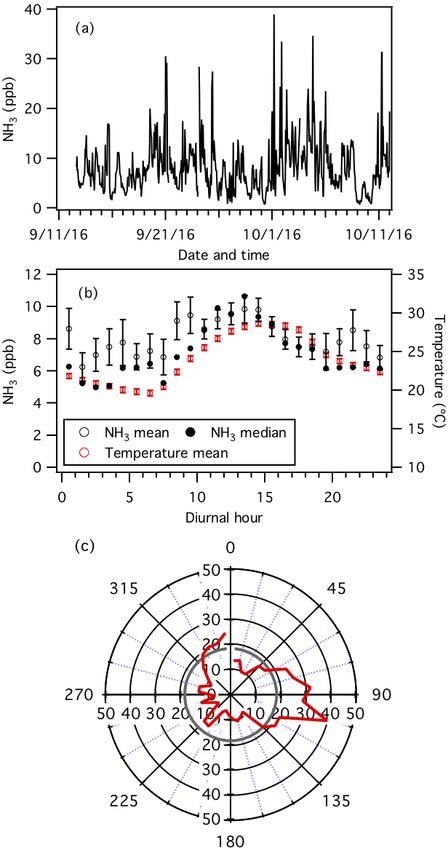
11474                T. Nah et al.: Characterization of aerosol composition, aerosol acidity, and organic acid partitioning

pacted onto a heated tungsten surface (∼ 600 ◦ C) on which         ing an eluent of 18 mM methanesulfonic acid at a flow rate
they were flash vaporized. The resulting vapors were ionized       of 1 mL min−1 . A new chromatogram was obtained every
by electron impact ionization (70 eV), and the ions were de-       30 min with a sample loop fill time (i.e., ambient sample inte-
tected by a time-of-flight mass spectrometer. Gas-phase in-        gration time) of 20 min. The limit of detection for the various
terferences were accounted for by subtracting the signals ob-      anions and cations was approximately 0.01 µg m−3 .
tained during daily measurements of filtered, particle-free            PILS2 was coupled to a Dionex ICS-4000 capillary high-
sampling air. Ionization efficiency calibrations were per-         pressure ion chromatography (HPIC) system to measure the
formed weekly using 300 nm ammonium nitrate and ammo-              water-soluble organic acids. The HPIC includes an eluent
nium sulfate particles. Composition-dependent collection ef-       generator, isocratic pump, degausser, suppressor, carbonate
ficiency (CDCE) values of 0.44 to 0.55 were determined us-         removal device, and conductivity detector. This system will
ing the procedure detailed by Middlebrook et al. (2012), in        be referred to hereafter as the PILS–HPIC. The organic
which CDCE values are derived based largely on aerosol in-         acids were separated using a Dionex AS11-HC-4 µm cap-
organic species concentrations and the RH in the sampling          illary guard and analytical column (0.4 × 250 mm, Thermo
line. In addition, a constant collection efficiency (CE) value     Fisher Scientific), which used a potassium hydroxide gradi-
of 0.9 was determined from the comparison of raw HR-ToF-           ent separation method at a flow rate of 0.015 mL min−1 . A
AMS SO2−                                      2−
           4 data with other particulate SO4 measurements          new chromatogram was obtained every 60 min with a sample
performed during the study. Comparisons of aerosol mass            loop fill time of 2 min. The limit of detection for the various
concentrations obtained from the application of CDCE val-          organic acids was approximately 0.001 µg m−3 .
ues (i.e., 0.44 to 0.55) vs. a constant CE value (i.e., 0.9) to        Particle- and gas-phase water-soluble organic carbon
the raw HR-ToF-AMS data are discussed in Sect. 3.2. Uncer-         (WSOCp and WSOCg , respectively) were measured using
tainties in HR-ToF-AMS measurements were estimated to be           two Sievers 900 series total organic carbon (TOC) analyz-
approximately 25 % (Canagaratna et al., 2007).                     ers (GE Analytical Instruments), as described by Sullivan et
   Particle-phase water-soluble organic acids and inorganic        al. (2004). For WSOCp measurements, ambient air was sam-
cations and anions were measured using two particle-               pled at 15.2 L min−1 through a URG PM1 cyclone and a par-
into-liquid sampler (PILS) systems coupled to ion chro-            allel plate carbon denuder into a PILS coupled to the first
matographs (ICs) (Orsini et al., 2003). Each PILS sampled          TOC analyzer. For WSOCg measurements, ambient air was
ambient air at nominally 16.7 L min−1 through a URG PM1            sampled at 20 L min−1 through a Teflon filter (45 mm diame-
cyclone. Before PILS1, which was used to measure water-            ter, 2.0 µm pore size, Pall Life Sciences) to remove particles
soluble inorganic cation and anions, two long (24 cm) URG          in the air stream. This filter was changed every 3 to 4 days.
glass annular denuders coated with sodium carbonate and            The particle-free air was then directed to a MIST chamber
phosphorous acid were used to remove acidic and basic              filled with ultrapure deionized water, which scrubbed the sol-
gases. Before PILS2, which measured water-soluble organic          uble gases at an air flow rate of 20 L min−1 . Soluble gases
acids, a 28 cm parallel plate carbon denuder (Sunset Lab) was      with Henry’s law constants greater than 103 mole L−1 atm−1
used to remove organic gases (Eatough et al., 1993). In each       were scrubbed into deionized water in the MIST chamber
PILS, aerosols were mixed with water vapor at ∼ 100 ◦ C            (Spaulding et al., 2002). The resulting MIST chamber liq-
generated from heated ultrapure deionized water (Weber et          uid sample was analyzed by the second TOC analyzer. The
al., 2001; Orsini et al., 2003). The resulting droplets were       TOC analyzers converted the organic carbon in the liquid
impacted onto a plate, with the resulting liquid sample an-        samples to carbon dioxide using UV radiation and chemi-
alyzed using the ICs. Each IC system was calibrated at the         cal oxidation. The carbon dioxide formed was then measured
beginning and end of the study using five multi-compound           by conductivity. The amount of organic carbon in the liq-
standards in order to create calibration curves. Periodically, a   uid samples is proportional to the measured increase in con-
HEPA filter (Pall Life Sciences) was placed on the inlet to de-    ductivity of the dissolved carbon dioxide. Each WSOCp and
termine the background in near real time. The measurement          WSOCg measurement lasted 4 min. Background WSOCp
uncertainty for each IC system was about 10 %.                     and WSOCg measurements were performed for 45 min every
   PILS1 was connected to two Dionex ICS-1500 ICs                  12 h by stopping the sample air flow and rinsing the system
(Thermo Fisher Scientific) to measure the water-soluble inor-      with deionized water. Both TOC analyzers were calibrated
ganic ions. These two IC systems include an isocratic pump,        at the beginning and end of the study using varying con-
self-regenerating anion or cation suppressor, and conduc-          centrations of sucrose solutions to create calibration curves
tivity detector. This system will be referred to hereafter as      (as specified by the instrument manual). The limit of detec-
the PILS–IC. Anions were separated using a Dionex Ion-             tions for WSOCp and WSOCg were 0.2 and 0.4 µg C m−3 ,
Pac AS15 guard and analytical column (4×250 mm, Thermo             respectively. The measurement uncertainties for WSOCp and
Fisher Scientific) employing an eluent of 38 mM sodium hy-         WSOCg were estimated to be 10 % based on uncertainties in
droxide at a flow rate of 1.5 mL min−1 . Cations were sep-         the TOC analyzer, sample air, and liquid flows.
arated using a Dionex IonPac CS12A guard and analyti-                  A suite of instruments operated by the SEARCH net-
cal column (4 × 250 mm, Thermo Fisher Scientific) employ-          work provided supporting gas and aerosol measurements

Atmos. Chem. Phys., 18, 11471–11491, 2018                                          www.atmos-chem-phys.net/18/11471/2018/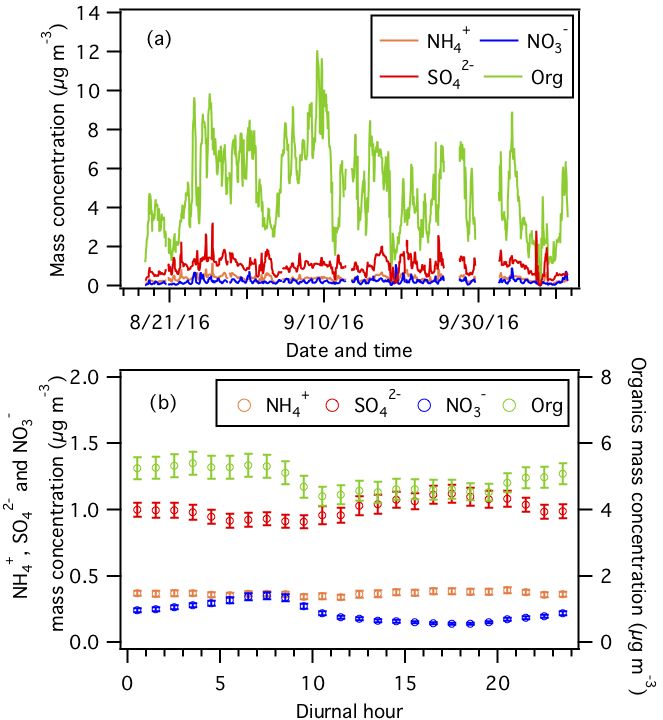
T. Nah et al.: Characterization of aerosol composition, aerosol acidity, and organic acid partitioning                     11475

(Hansen et al., 2003; Edgerton et al., 2005, 2006, 2007).           ∼        1000γH+ H+
                                                                                      air
                                                                    = −log10              ,                                  (1b)
O3 was measured with a UV absorption instrument (Thermo                          Wi
Fisher Scientific) with a temporal resolution of 1 min. NO
and NOx were measured using a chemiluminescence in-              where γH+ is the hydronium ion activity coefficient (assumed
strument (Thermo Fisher Scientific) with a temporal reso-        to be 1), H+ aq is the concentration of hydronium ions in par-
lution of 1 min. NO2 was obtained from the difference be-        ticle water in moles per liter (i.e., the density of water is as-
tween NO and NOx . CO was measured using a nondisper-            sumed to be 1000 kg m−3 , and so pH is calculated in terms
sive infrared absorption instrument (Thermo Fisher Scien-        of molality), H+           −3
                                                                                   air (µg m ) is the hydronium ion concentra-
tific) with a temporal resolution of 1 min. NH3 was mea-         tion per volume of air, and Wi and Wo (µg m−3 ) are the bulk
sured by a denuder-based instrument (ARA) with a tempo-          particle water concentrations associated with inorganic and
ral resolution of 5 min. Comparisons of measurements by          organic species per volume of air, respectively. In Eq. (1b),
the NH3 -CIMS and denuder-based instrument will be pre-          the molecular weight of H+ is taken as 1 g mole−1 , and 1000
sented in Sect. 3.1. A filter-based particle composition mon-    is the factor needed for unit conversion of grams per liter
itor (ARA) provided 24 h-integrated PM2.5 measurements of        to micrograms per cubic meter. H+      air and Wi are outputs of
particle mass and major inorganic ions measured offline by       the ISORROPIA II model. Previous studies have shown that
ion chromatography. Organic carbon (OC) and elemental car-       particle pH values predicted using only Wi are reasonably
bon (EC) in PM2.5 were measured by an OC–EC analyzer             accurate since the sensitivity of particle pH to the effects of
(Sunset Labs) with a temporal resolution of 1 h. This analyzer   Wo is small (Guo et al., 2015). For the southeastern US, Guo
determined OC by thermal optical transmittance. VOCs were        et al. (2015) reported that particle pH values predicted using
measured by a gas chromatography–flame ionization detec-         only Wi were systematically 0.15 to 0.23 units lower than
tor (GC-FID, Agilent Technologies) with a temporal resolu-       those predicted using Wi +Wo during the 2013 Southern Ox-
tion of 1 h.                                                     idant Aerosol Study (SOAS) and SCAPE campaigns. Given
                                                                 this small deviation and that organic aerosol hygroscopicity
2.3   Particle pH and water calculation                          was not measured in this field study, we report particle pH
                                                                 only considering Wi .
The thermodynamic equilibrium model ISORROPIA II was                 ISORROPIA II was run in “forward” mode, which as-
used to determine the phase state and composition of an          sumes that aerosols are “metastable” with no solid precip-
         2−
NH+              −     −   +      2+   +    2+
    4 –SO4 –NO3 –Cl –Na –Ca –K –Mg –water inor-                  itates, to predict particle pH and the partitioning of semi-
ganic aerosol in equilibrium with its corresponding gas-         volatile compounds. In forward mode, the model calcu-
phase species (Fountoukis and Nenes, 2007; Nenes et al.,         lates the gas–particle equilibrium partitioning concentrations
1998). This approach was used in previous studies to deter-      based on the input of the total concentration of a species (i.e.,
mine particle water and pH in different parts of the world       gas + particle). In reverse mode, the model calculates the
(Guo et al., 2015, 2016, 2017a, c; Bougiatioti et al., 2016;     gas–particle equilibrium partitioning concentrations based
Weber et al., 2016; Shi et al., 2017). The pH of an aque-        on the input of only the particle-phase concentration of a
ous solution is defined as the negative logarithm of the         species. We used forward mode because the reverse mode
hydronium ion (H3 O+ ) activity on a molality basis (http:       is sensitive to measurement errors, which often result in
//www.goldbook.iupac.org/html/P/P04524.html, last access:        large model biases in the predicted particle pH (Henni-
6 July 2018):                                                    gan et al., 2015). The measured particle-phase inorganic
                                                                            2−
                                                                 NH+                      −
                                                                      4 , SO4 , and NO3 concentrations and gas-phase HNO3
pH = −log10 a(H+ ) = −log10 m(H+ )γm (H+ )/mθ ,

                                                                 and NH3 concentrations were used as model inputs. The
                                                         (1a)    metastable assumption is reasonable since the high RH (av-
where a(H+ ) is the hydronium ion activity in an aqueous         erage RH 68.9 %) observed during the study indicated that
solution, m(H+ ) is the hydronium ion molality, γm (H+ ) is      the aerosols had likely deliquesced. We excluded data for pe-
the molality-based hydronium ion activity coefficient, and       riods when the RH was above 95 % since the exponential
mθ is the standard molality (1 mol kg−1 ). For simplicity,       growth in particle liquid water with RH introduces large pH
H3 O+ is denoted here as H+ even though we recognize that        uncertainties (Malm and Day, 2001; Guo et al., 2015).
the un-hydrated hydrogen ion is rare in aqueous solutions.           In using ISORROPIA II to predict particle pH and the par-
Since most thermodynamic equilibrium models (e.g., ISOR-         titioning of semi-volatile compounds, we also assumed that
ROPIA II, E-AIM) do not report liquid concentrations, but        the aerosols are internally mixed and that the particle pH does
instead report species in terms of concentration per volume      not change with particle size (i.e., the overall particle pH is
of air (e.g., µg m−3 , µmol m−3 ), we have calculated the par-   characterized by the particle’s bulk properties). As long as
ticle pH by                                                      some small fraction of sulfate is mixed with various aerosol
                                                                 components, (e.g., non-volatile cations), the assumption that
                                1000γH+ H+air
                                                                 aerosols are completely internally mixed has a small effect on
pH = −log10 γH+ H+
                 aq = −log10                                     the predicted pH (Guo et al., 2017b). However, the presence
                                  Wi + Wo

www.atmos-chem-phys.net/18/11471/2018/                                         Atmos. Chem. Phys., 18, 11471–11491, 2018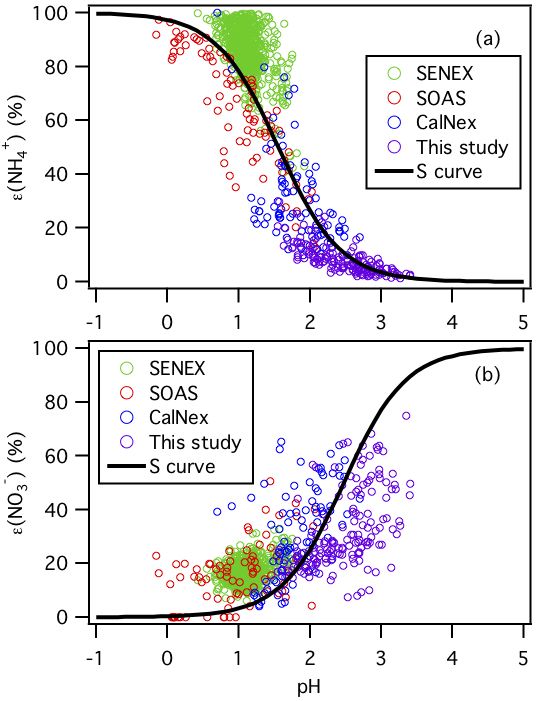
11476               T. Nah et al.: Characterization of aerosol composition, aerosol acidity, and organic acid partitioning

of multiple organic and inorganic species in ambient aerosols
may lead to multiple phases within the particle (i.e., phase
separation). Consequently, this may result in the unequal dis-
tribution of inorganic species among different phases, each
with its own water activity and inorganic concentration. Pre-
vious studies have shown that liquid–liquid and solid–liquid
phase separations may occur for mixed organic and inorganic
aerosols at low RH and organic aerosol oxygen-to-carbon
atomic ratios (O/C) (Bertram et al., 2011; Song et al., 2012;
You et al., 2013, 2014b; You and Bertram, 2015). Phase sep-
arations were always observed at O/C ≤ 0.5, while no phase
separation was observed at O/C ≥ 0.8. The probability for
the occurrence of phase separation decreased at higher RH
for 0.5 < O/C < 0.8. The average O/C for this field study
is 0.69 ± 0.06. Organic acids were not included in the cal-
culation of particle pH. This is reasonable since their total
mass concentration was small compared to the total inorganic
mass concentration. The average ratio of the organic acid
mass concentration to the inorganic mass concentration is
0.25. Furthermore, Song et al. (2018) showed that including
organic acid mass concentrations in thermodynamic model
calculations had minor effects on particle pH if the system is
in equilibrium. The validity of these assumptions and the re-
sulting thermodynamic model predictions will be evaluated
by comparing the predicted gas–particle partitioning ratios
of semi-volatile inorganic compounds with measured values
in Sect. 3.3.

3     Results and discussion

3.1    NH3 observations

Continuous measurements of NH3 were made using the
NH3 -CIMS from 13 September to 12 October. Figure 1a
and b show the time series and average diurnal profile of
NH3 , respectively. NH3 concentrations ranged from 0.7 to
39.0 ppb (0.5 to 28.5 µg m−3 ) and exhibited consistent diur-
nal cycles. NH3 was generally higher in the late mornings
and early afternoons. Concentrations started to increase at      Figure 1. Measurements by the NH3 -CIMS during the second half
07:30, which coincided with an increase in temperature at        of the study. (a) Time series of NH3 concentration. The data are
sunrise (Fig. S3). Possible reasons for the morning increase     displayed as 1 h averages. (b) Diurnal profiles of NH3 concentra-
include volatilization of particulate ammonium and animal        tion (mean and median) and temperature. Error bars shown are the
                                                                 standard errors. Dates and times displayed are local time. All the
waste, entrainment from the residual layer where NH3 may
                                                                 concentrations represent averages in 1 h intervals and the standard
not have been depleted, evaporation of dew or fog that con-
                                                                 errors are plotted as error bars. (c) Average NH3 concentration nor-
tained dissolved NH3 , and emission from plant stomata (Ellis    malized to wind speed (i.e., NH3 concentration (ppb) × wind speed
et al., 2011). NH3 decreased at 14:30, approximately 1 h be-     (m s−1 )) in each 10◦ bin (red line). The average normalized NH3
fore temperature decreased, and may be due to changes in         concentration is shown as a grey line.
the boundary layer height. However, this hypothesis cannot
be tested since the boundary layer height was not measured
during the study. The diurnal plot does not account for dilu-
tion as the boundary layer expanded and only indicates that if      The average NH3 concentration measured by the NH3 -
emissions were solely from the surface and lower concentra-      CIMS is 8.1 ± 5.2 ppb. This is approximately 2 times higher
tions aloft, these NH3 sources were of significant magnitude.    than the average NH3 concentration (3.8±2.9 ppb) measured
                                                                 by the denuder-based instrument operated by the SEARCH
                                                                 network over the same time period (Fig. S4). Differences in

Atmos. Chem. Phys., 18, 11471–11491, 2018                                         www.atmos-chem-phys.net/18/11471/2018/
T. Nah et al.: Characterization of aerosol composition, aerosol acidity, and organic acid partitioning 11477
NH3 concentrations measured by the two instruments may able for comparison due to denuder breakthrough that oc-
be due to positive and negative sampling artifacts caused by curred during the study.
differences in sampling inlets (e.g., inlet length and location), SO2−4 measurements by the various instruments are gener-
frequency of calibration and background measurements, and ally well correlated with each other, with R 2 values ranging
(in the case of the denuder-based instrument) possible sam- from 0.64 to 0.92. Although PM1 SO2− 4 measurements by
ple contamination during chemical analysis. Discussions on the two PILS systems show good agreement with each other,
how differences in measured NH3 concentrations affect PM1 HR-ToF-AMS CDCE-applied SO2− 4 measurements are ap-
pH predictions will be presented in Sect. 3.3. Nevertheless, proximately 2 times higher than the PILS and filter mea-
there is a record of NH3 concentrations measured by the surements. Similar systematic differences are also observed
denuder-based instrument at this site since 2008. Just prior for NO− + − +
3 and NH4 measurements. NO3 and NH4 measure-
to and during this study, NH3 concentrations are generally ments from the four instruments are moderately correlated
the highest observed since 2011 (Fig. S5). These elevated (R 2 = 0.54 to 0.79 and R 2 = 0.94, respectively). NO− 3 mea-
NH3 concentrations may be due to sporadic biomass burning surements from the PILS and filter systems are mostly sim-
episodes caused by elevated temperatures and widespread ilar; however, HR-ToF-AMS CDCE-applied PM1 NO− 3 and
drought across the southeastern US in 2016 (Park Williams NH+ 4 measurements are approximately 3 times and 2 times
et al., 2017; Case and Zavodsky, 2018). higher than the PILS and filter measurements. One possible
The NH3 -CIMS measurements are examined with the reason is that the calculated CDCE is lower due to organics
meteorological data to gain insights into the primary NH3 dominating the aerosol composition during the study (aver-
sources during the sampling period. To account for wind age of 74.2 ± 7.9 % of the non-refractory PM1 mass concen-
speed, the 1 h averaged NH3 concentrations are first multi- tration). Lee et al. (2015) suggested that a high organic mass
plied by their corresponding 1 h averaged wind speeds. These fraction may impede the complete efflorescence of aerosols
normalized NH3 concentrations are then used to construct when they are passed through the drier prior to delivery into
a wind direction polar plot showing the average normalized the HR-ToF-AMS, thus reducing the particle bounce and in-
NH3 concentration per 10◦ bin (Fig. 1c). The wind direction creasing the CE value. Hence, we estimated HR-ToF-AMS
polar plot shows that the normalized NH3 is approximately PM1 mass concentrations that would be consistent with PILS
2 times greater than the average when air masses are trans- and filter measurements by multiplying all the raw HR-ToF-
ported from the southeast, the general direction of the poul- AMS data by a constant CE value of 0.9, which was obtained
try CAFOs located approximately 2 km from the field site from comparisons of the raw HR-ToF-AMS SO2− 4 data with
(Fig. S1), which are known for having high NH3 emissions. 2−
PILS–IC and PILS–HPIC SO4 measurements. The constant
This conclusion is reaffirmed by NH3 measurements from CE-applied HR-ToF-AMS data are used in all our subsequent
the SEARCH network’s denuder-based instrument. analyses.
NH3 concentrations measured by the two instruments in Figure 2 shows the time series and average diurnal profiles
this study are substantially higher than those measured in of non-refractory PM1 species. The average non-refractory
three recent field studies conducted in the continental US: PM1 organics, SO2− − +
4 , NO3 , and NH4 mass concentrations
the 2010 California Nexus (CalNex) study, 2013 Southeast are 5.0 ± 2.3, 1.6 ± 0.4, 0.2 ± 0.1, and 0.4 ± 0.2 µg m−3 , re-
Nexus (SENEX) study, and 2013 SOAS study (see Table 1). spectively. Organics are the dominant non-refractory PM1
The differences in NH3 may be attributed to differences in species, accounting for 74.2 ± 7.9 % of the non-refractory
land use, proximity to CAFOs, and meteorological condi- PM1 mass concentration during the field study. Organic
tions. The high NH3 concentrations in this study allow us aerosol mass concentration was slightly higher at night,
to make ambient observations of the effect of NH3 on parti- which is likely caused by changes in the boundary layer
cle acidity and the gas–particle partitioning of semi-volatile height, emission sources, and SOA formation processes (Xu
inorganic and organic compounds, and compare them with et al., 2015b). Previous studies have shown that nighttime
previous studies. SOA production in the southeastern US is largely attributed
to nitrate radical oxidation and ozonolysis of monoterpenes,
3.2 PM1 composition which are abundant at night (Pye et al., 2015; Xu et al.,
2015a, b; Lee et al., 2016; Zhang et al., 2018). Specifically,
The aerosol inorganic chemical composition was measured the nitrate radical oxidation of some monoterpenes (e.g., β-
by several instruments during this study. The HR-ToF-AMS, pinene) could form low-volatility organic nitrates that are
PILS–IC and PILS–HPIC measured the composition of PM1 , condensable and could contribute substantially to the noc-
while a filter-based particle composition monitor measured turnal organic aerosol mass (Boyd et al., 2015, 2017; Ng
the composition of PM2.5 . Comparisons of aerosol SO2− 4 , et al., 2017). Apportionment of organic aerosol sources will
NO− , and NH +
mass concentrations obtained from the ap- be discussed in an upcoming publication. SO2−
3 4 4 is the sec-
plication of CDCE values to the raw HR-ToF-AMS data are ond most abundant non-refractory PM1 species (16.3±5.7 %
compared to those measured by the other three instruments mass fraction), followed by NH+ 4 (5.9 ± 2 % mass fraction)
in Fig. S6. NH+4 measurements by the PILS–IC are not avail-
www.atmos-chem-phys.net/18/11471/2018/ Atmos. Chem. Phys., 18, 11471–11491, 201811478 T. Nah et al.: Characterization of aerosol composition, aerosol acidity, and organic acid partitioning
Figure 3. (a) Time series and (b) diurnal profiles of ISORROPIA-
predicted PM1 pH and Wi . The diurnal profiles of RH and
Figure 2. (a) Time series and (b) diurnal profiles of non-refractory ISORROPIA-predicted H+ air are also shown in (b). Dates and times
PM1 species measured by the AMS. Error bars shown in (b) are the displayed are local time. All the data shown here represent averages
standard errors. Dates and times displayed are local time. in 1 h intervals. Error bars shown in (b) are the standard errors.
2−
and NO− 3 (3.6 ± 2.2 % mass fraction). SO4 mass concen-
Wi and pH from 13 September to 6 October. Figure 3 shows
tration peaked in the afternoon due to enhanced SO2 pho- the time series and average diurnal profiles of ISORROPIA-
tooxidation (Weber et al., 2003). The NO− 3 mass concen-
predicted PM1 Wi and pH. PM1 is highly acidic with pH val-
tration measured by the HR-ToF-AMS is the nitrate func- ues ranging from 0.9 to 3.8 and an average pH of 2.2 ± 0.6.
tional group (-ONO2 ) present on organic and inorganic ni- The average PM1 pH is 2.5 ± 0.6 during periods when the
trates. Hence, the diurnal profile of the NO− 3 mass concen-
NH3 concentration is higher than 13.3 ppb (i.e., average NH3
tration in Fig. 2 has contributions from both organic and in- concentration +1 standard deviation = 8.1+5.2 = 13.3 ppb).
organic nitrates. The mass concentrations of organic and in- The PM1 pH values in this study are generally similar to
organic nitrates increased after sunset and peaked at sunrise those reported by Guo et al. (2015) at the same field site dur-
(Fig. S7), likely due to the formation of organic nitrates from ing winter 2012. Our observation that PM1 is acidic despite
nighttime NO3 chemistry and increased gas-to-particle parti- the high NH3 concentrations in this study is consistent with
tioning of organic and inorganic nitrates as temperature de- previous studies showing that particle pH has weak sensitiv-
creased (Xu et al., 2015a, b). Quantification and characteriza- ities to wide NH3 and SO2−4 mass concentration ranges due
tion of organic nitrates based on HR-ToF-AMS and PILS–IC to pH buffering caused by the partitioning of NH3 between
PM1 NO− 3 measurements will be discussed in a future publi-
the gas and particle phases (Weber et al., 2016; Guo et al.,
cation. NH+ 4 mass concentration has moderate diurnal varia-
2017c). This weak particle pH sensitivity also explains the
tions with marginally higher concentrations in the afternoon, small changes in PM1 pH values (about 10 % lower, Fig. S8)
likely due to the contrasting day–night phases of ammonium when NH3 measurements by the SEARCH network denuder-
sulfate and ammonium nitrate formation. SO2− −
4 , NO3 , and
based instrument are used in ISORROPIA II calculations (in-
+ + stead of NH3 -CIMS measurements).
NH4 molar concentrations indicated that NH4 is mainly as-
sociated with SO2− PM1 pH varied by approximately 1.4 units throughout the
4 in PM1 .
day. Wi has an average value of 1.6 ± 1.7 µg m−3 . PM1 Wi
3.3 PM1 pH predictions and pH showed similar diurnal profiles, with both peaking in
the midmorning and reaching their minima in the midafter-
CIMS HNO3 and NH3 data, HR-ToF-AMS PM1 SO2− 4 and noon. These diurnal trends are consistent with those previ-
NH+
4 data, PILS–IC PM 1 NO −
3 and non-volatile cation (Cl− , ously reported by Guo et al. (2015) for PM1 measured dur-
+ 2+ + 2+
Na , Ca , K , and Mg ) data, measured temperature, and ing the summer and winter in different parts of the southeast-
RH are used as ISORROPIA II model inputs to predict PM1 ern US. Also shown in Fig. 3b is the diurnal profile of H+ air ,
Atmos. Chem. Phys., 18, 11471–11491, 2018 www.atmos-chem-phys.net/18/11471/2018/T. Nah et al.: Characterization of aerosol composition, aerosol acidity, and organic acid partitioning 11479
Table 1. Comparisons among different field campaigns for particle pH, major inorganic ions and gases, and meteorological conditions.
All pH values were calculated using ISORROPIA II run in forward mode. These statistics were previously compiled by Guo et al. (2017a).
Campaign acronyms used here stand for the California Research at the Nexus of Air Quality and Climate Change (CalNex), Southern Oxidant
and Aerosol Study (SOAS), and Southeastern Nexus of Air Quality and Climate (SENEX).
Campaign CalNex SOAS SENEX This study
Type Ground Ground Aircraft Ground
PM cut size PM1 PMa2.5 PM1 & PMb2.5 PM1 PM1
Year 2010 2013 2013 2016
Season (early summer) Summer Summer Fall
Region/location SW US SE US SE US SE US
SO42− , µg m−3 2.86 ± 1.70 1.88 ± 0.69 1.73 ± 1.21 2.05 ± 0.80 1.6 ± 0.4
NO− 3 , µg m
−3 3.58 ± 3.65 3.74 ± 1.53 0.08 ± 0.08 0.28 ± 0.09 0.20 ± 0.10
HNO3 , µg m−3 6.65 ± 7.03 4.45 ± 3.59 0.36 ± 0.14 1.35 ± 0.66 0.50 ± 0.26
ε(NO− 3) 39 ± 16 % 51 ± 18 % 22 ± 16 % 18 ± 6 % 26 ± 15 %
Total NO− 3 , µg m
−3 10.22 ± 9.74 8.19 ± 3.89 0.45 ± 0.26 1.63 ± 0.70 0.70 ± 0.28
+ −3
NH4 , µg m 2.06 ± 1.67 1.79 ± 0.65 0.46 ± 0.34 1.06 ± 0.25 0.40 ± 0.20
NH3 , µg m−3 1.37 ± 0.90 0.75 ± 0.61 0.39 ± 0.25 0.12 ± 0.19 5.79 ± 3.67
ε(NH+ 4) 55 ± 25 % 71 ± 19 % 50 ± 25 % 92 ± 11 % 7±5%
Total NH+ 4 , µg m
−3 3.44 ± 1.81 2.54 ± 0.89 0.78 ± 0.50 1.17 ± 0.81 6.19 ± 3.68
+
Na , µg m −3 NA 0.77 ± 0.39 0.03 ± 0.07 NA NA
Cl− , µg m−3 NA 0.64 ± 0.48 0.02 ± 0.03 NA 0.01 ± 0.01
RH, % 79 ± 17 87 ± 9 74 ± 16 72 ± 9 69 ± 18
T , ◦C 18 ± 4 18 ± 3 25 ± 3 22 ± 3 24 ± 4
Wi , µg m−3 13.9 ± 18.1 29.8 ± 20.7 5.1 ± 3.8 3.2 ± 2.8 1.6 ± 1.7
pH 1.9 ± 0.5 2.7 ± 0.3 0.9 ± 0.6 1.1 ± 0.4 2.2 ± 0.6
Reference Guo et al. (2017a) Guo et al. (2015) Xu et al. (2016) This study
a Only during the last week of CalNex.
b PM
2.5 was sampled in the first half and PM1 sampled in the second half of the study. Various parameters were similar in both cases.
Crustal components were higher but are overall generally at low concentrations so the differences had minor effects. For example, PM2.5
Na+ was 0.06 ± 0.09 µg m−3 and PM1 Na+ was 0.01 ± 0.01 µg m−3 .
NA = not available.
which peaked in the midafternoon. The Wi and H+ air maxi- which diluted H+ and raised particle pH, resulting in more
mum / minimum ratios are comparable (6.5 and 5.3, respec- gas-to-particle partitioning of NO− 3 , and eventually leading
tively), thus indicating that the diurnal variation in particle to pH levels similar to those observed in this study. This
pH is driven by both Wi and H+ air . type of feedback does not happen in the southeastern US,
The average PM1 pH for this study is about 1 unit higher where non-volatile SO2− 4 dominates the uptake of particle
than that for the SENEX and SOAS campaigns (Table 1) water. It is also possible that the higher RH and lower tem-
and is likely due to the much higher abundance of NH3 in peratures during the CalNex campaign (relative to this study)
this study. The average NH3 mass concentration in this study contributed to high particle Wi , which diluted H+ and raised
is approximately 49 times and 15 times higher than that in particle pH levels similar to those observed in this study.
the SENEX and SOAS campaigns, respectively. The average The validity of this study’s thermodynamic model pre-
PM1 pH for this study is similar to that for the CalNex cam- dictions is evaluated by comparing the predicted gas–
paign even though the average NH3 mass concentration in particle partitioning ratios of semi-volatile inorganic com-
this study is only approximately 4 times higher than that in pounds (i.e., NO− +
3 and NH4 ) with measured values
the CalNex campaign (Guo et al., 2017a). This may be due, (Fig. S9). CIMS HNO3 and NH3 data, PILS–IC NO− 3,
in part, to PM1 SO2− −
4 and NO3 mass concentrations at Cal- and HR-ToF-AMS NH+ 4 data are used in this compari-
Nex being approximately 2 times and 18 times larger than son. ε(NO− +
3 ) and ε(NH4 ) are defined as the particle-phase
those of this study, respectively. Aerosol inorganic SO2−4 and molar concentration divided by the total molar concentra-
NO− 3 species are hygroscopic species. The much higher NO−3 tion (gas + particle), i.e., ε(NO− −
3 ) = NO3 /(HNO3 + NO3 )
−
mass concentrations in the CalNex campaign (due, in part, and ε(NH4 ) = NH4 /(NH3 + NH4 ). Predicted NH3 , NH+
+ + +
4,
to high NOx emissions) increased particle Wi substantially, and ε(NH+ 4 ) values are generally within 10 % of and are
www.atmos-chem-phys.net/18/11471/2018/ Atmos. Chem. Phys., 18, 11471–11491, 201811480 T. Nah et al.: Characterization of aerosol composition, aerosol acidity, and organic acid partitioning
The molar fractions of NO− +
3 and NH4 in the particle phase
− +
(i.e., ε(NO3 ) and ε(NH4 )) measured in this study are com-
pared with those measured during the CalNex, SENEX, and
SOAS campaigns. Figure 4 shows the measured ε(NO− 3 ) and
ε(NH+ 4 ) values as a function of their ISORROPIA-predicted
particle pH for the various field studies. For each field
study, only a subset of the data are chosen for this compar-
ison (1 ≤ Wi ≤ 4 µg m−3 and 15 ◦ C ≤ temperature ≤ 25 ◦ C)
to reduce the effects of variability in Wi and temperature
on gas–particle partitioning for comparison with the calcu-
lated S (or sigmoidal) curves, which are calculated based
on Wi = 2.5 µg m−3 and temperature = 20 ◦ C. The S curves
for HNO3 –NO− +
3 and NH3 –NH4 partitioning as a function of
particle pH are also plotted as solid lines. The S curves are
calculated based on the solubility and dissociation of NO− 3
and NH+ 4 species in water:
ε NO−
3
∗
HHNO3
RT Wi × 0.987 × 10−14
= , (2)
γH+ γNO− 10−pH + HHNO
∗
3
RT Wi × 0.987 × 10⁻¹⁴
3
γH+ 10−pH ∗ −14
γNH+ HNH3 RT Wi × 0.987 × 10
+ 4
ε NH4 = , (3)
γH+ 10−pH ∗ −14
1+ γNH+ HNH3 RT Wi × 0.987 × 10
4
where ∗
HHNO3
and ∗(mole2 kg−2 atm−1 ) are equilibrium
HNH3
Figure 4. Analytically calculated S curves of ε(NH+ −
4 ) and ε(NO3 ) constants and are the products of the Henry’s law constant
and ambient data plotted against ISORROPIA-predicted particle pH and the dissociation constant of HNO3 and NH3 , respec-
for this study, SENEX, SOAS, and CalNex. For the ambient data tively; R is the gas constant (8.314 m3 Pa K−1 mol−1 ); T is
sets, a narrow range of Wi (1 to 4 µg m−3 ) and temperature (15 ∗
temperature (K); and γi ’s are activity coefficients. HHNO
to 25 ◦ C) is selected to be close to the analytical calculation input ∗ ◦ 3
(i.e., Wi = 2.5 µg m−3 and temperature = 20 ◦ and HNH3 values at 20 C are calculated using equations
q C). Similar to Guo found in Clegg and Brimblecombe (1990) and Clegg et
et al. (2017a), γNH+ = 1 and γH+ −NO− = γH+ γNO− = 0.28 are
4 3 3 al. (1998), respectively. Activity coefficients predicted by
used for the analytically calculated S curves. ISORROPIA II are γH+ −NO− = γH+ γNO− = 0.28, γH+ = 1
p
3 3
and γNH+ = 1. Derivations of the analytically calculated S
4
curves for ε(NO− +
3 ) and ε(NH4 ) in Eqs. (2) and (3) can be
found in Guo et al. (2017a). As shown in Fig. 4, the mea-
highly correlated (R 2 = 0.96 to 0.99) with measured values sured ε(NO− +
3 ) and ε(NH4 ) values for the four field studies all
(Fig. S9). While predicted HNO3 values generally agreed generally converged on the calculated S curves. The higher
with measurements, substantial scatter can be seen between particle pH values in this study and the CalNex campaign rel-
the predicted and measured values for NO− −
3 and ε(NO3 ). ative to those for the SENEX and SOAS campaigns resulted
This scatter can be attributed, at least in part, to uncertain- in less NH3 and more HNO3 partitioned to the particle phase,
ties brought about by the low PM1 NO− 3 mass concentrations as predicted by these simple analytical expressions. A similar
and effects of coarse-mode cations (e.g., Na+ , Ca2+ , K+ , analysis will be performed for the organic acids in Sect. 3.5.
and Mg2+ ) on fine-mode HNO3 –NO− 3 gas–particle equi-
librium (i.e., HNO3 can partition to both fine and coarse 3.4 WSOC and water-soluble organic acids
modes, thereby affecting fine-mode NO− 3 concentrations; no
such effect occurs for NH3 –NH+ 4 gas–particle equilibrium). The time series and average diurnal profiles of WSOCg and
In general, the overall good agreement between model pre- WSOCp are shown in Fig. S10. The average WSOCg mass
dictions and measurements indicated that our assumptions concentration (3.6 ± 2.7 µg C m−3 ) is roughly 4 times higher
that aerosols are metastable (i.e., aerosols are supersaturated than that of WSOCp (1.0 ± 0.6 µg C m−3 ). The diurnal pro-
aqueous droplets) with no phase separation for the thermo- file of WSOCp is somewhat flat, likely due to various or-
dynamic calculations are reasonable for the conditions of this ganic aerosol sources having different water solubility and
study and do not affect model predictions. diurnal cycles and compensating for each other throughout
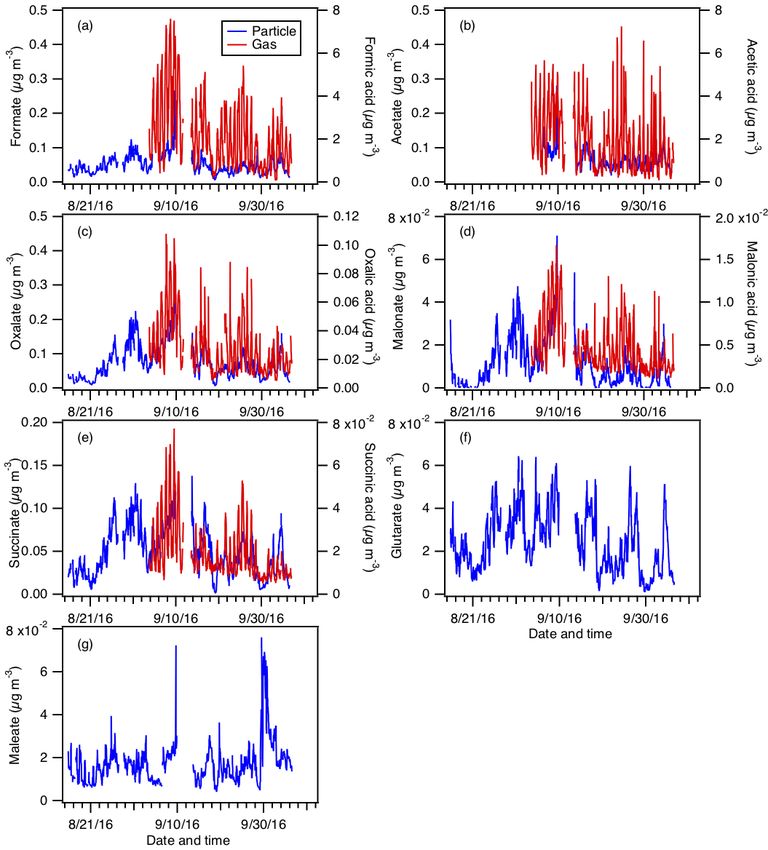
Atmos. Chem. Phys., 18, 11471–11491, 2018 www.atmos-chem-phys.net/18/11471/2018/T. Nah et al.: Characterization of aerosol composition, aerosol acidity, and organic acid partitioning 11481 Figure 5. Particle- and gas-phase measurements of (a) formic, (b) acetic, (c) oxalic, (d) malonic, (e) succinic, (f) glutaric, and (g) maleic acids. Particle-phase measurements are shown on the left y axes, while gas-phase measurements are shown on the right y axes. Dates and times displayed are local time. Gas-phase measurements of glutaric and maleic acids are not available. the day (Xu et al., 2015b, 2017). In contrast, WSOCg dis- urnal profiles of WSOCp in both studies are flat, the diurnal played strong diurnal variations. WSOCg increased at 07:30, profiles of WSOCg measured in the two studies are different. which coincided with the sharp increase in solar irradiance WSOCg measured in the SOAS study decreased at sunset, (Fig. S3). WSOCg decreased at 21:30, approximately 2 h af- while WSOCg measured in this study decreased 2 h after sun- ter sunset. Also shown in Fig. S10 are the time series and set. Differences in WSOCg diurnal profiles in the two studies average diurnal profile of the mass fraction of total WSOC in are likely due to differences in emission sources as a result the particle phase, i.e., Fp = WSOCp /(WSOCp + WSOCg ). of different sampling periods (SOAS was in early summer The peak Fp coincided with the minima of WSOCg at 07:30. and this study was in early fall), land use, and/or land cover. The average WSOCg and WSOCp (3.6±2.7 µg C m−3 and The ratio of WSOCp to OC for this study was estimated at 1.0 ± 0.6 µg C m−3 ) are slightly lower than those measured 30 %, but this comparison is imprecise because WSOCp was during the SOAS campaign (SOAS WSOCg = 4.9 µg C m−3 PM1 and OC was PM2.5 (refer to Fig. S11 and Supplement and WSOCp = 1.7 µg C m−3 ) (Xu et al., 2017). While the di- Sect. S2). www.atmos-chem-phys.net/18/11471/2018/ Atmos. Chem. Phys., 18, 11471–11491, 2018
11482                 T. Nah et al.: Characterization of aerosol composition, aerosol acidity, and organic acid partitioning

Figure 6. Diurnal profiles of particle- and gas-phase (a) formic, (b) acetic, (c) oxalic, (d) malonic, (e) succinic, (f) glutaric, and (g) maleic
acids. Particle-phase measurements are shown on the left y axes, while gas-phase measurements are shown on the right y axes. All the data
shown here represent averages in 1 h intervals. Error bars shown are the standard errors.

   Figure 5 shows the time series of particle- and gas-phase               these organic acids (Nah et al., 2018). Formic and acetic
concentrations of formic, acetic, oxalic, malonic, succinic,               acids are the most abundant gas-phase organic acids, with av-
glutaric, and maleic acids. Their diurnal profiles are shown in            erages of 2.2±1.6 and 1.9±1.3 µg m−3 , respectively. The av-
Fig. 6. Gas-phase measurements of glutaric and maleic acids                erage carbon mass fraction of WSOCg comprised of formic
are not available. Gas-phase measurements of butyric, gly-                 and acetic acids is 7 % and 13 %, respectively. All the gas-
colic, propionic, and valeric acids were also measured during              phase organic acids displayed strong and consistent diurnal
the study and have been presented in Nah et al. (2018), but                cycles, with higher concentrations being measured during
will not be discussed here since their particle-phase measure-             warm and sunny days. Their concentrations start to increase
ments are not available.                                                   at sunrise (at 07:30), building to a peak between 15:30 and
   Assuming that all the measured organic acids are com-                   19:30, then decrease overnight.
pletely water soluble, 30 % of the WSOCg is comprised of

Atmos. Chem. Phys., 18, 11471–11491, 2018                                                    www.atmos-chem-phys.net/18/11471/2018/
You can also read


