Exploring the Microdiversity Within Marine Bacterial Taxa: Toward an Integrated Biogeography in the Southern Ocean
←
→
Page content transcription
If your browser does not render page correctly, please read the page content below
ORIGINAL RESEARCH
                                                                                                                                                    published: 14 July 2021
                                                                                                                                          doi: 10.3389/fmicb.2021.703792

                                             Exploring the Microdiversity Within
                                             Marine Bacterial Taxa: Toward an
                                             Integrated Biogeography in the
                                             Southern Ocean
                                             Guillaume Schwob 1,2* , Nicolás I. Segovia 2,3 , Claudio González-Wevar 2,4 , Léa Cabrol 2,5 ,
                                             Julieta Orlando 1 and Elie Poulin 1,2
                                             1
                                               Departamento de Ciencias Ecológicas, Facultad de Ciencias, Universidad de Chile, Santiago, Chile, 2 Instituto de Ecología
                                             y Biodiversidad, Santiago, Chile, 3 Universidad Católica del Norte, Coquimbo, Chile, 4 Facultad de Ciencias, Centro Fondap
                                             IDEAL, Instituto de Ciencias Marinas y Limnológicas, Universidad Austral de Chile, Valdivia, Chile, 5 Aix Marseille University,
                                             Univ Toulon, CNRS, IRD, Mediterranean Institute of Oceanography (MIO), Marseille, France

                                             Most of the microbial biogeographic patterns in the oceans have been depicted at
                                             the whole community level, leaving out finer taxonomic resolution (i.e., microdiversity)
                                             that is crucial to conduct intra-population phylogeographic study, as commonly done
                                             for macroorganisms. Here, we present a new approach to unravel the bacterial
                                             phylogeographic patterns combining community-wide survey by 16S rRNA gene
                                             metabarcoding and intra-species resolution through the oligotyping method, allowing
                          Edited by:
                     Anne Bernhard,          robust estimations of genetic and phylogeographic indices, and migration parameters.
   Connecticut College, United States        As a proof-of-concept, we focused on the bacterial genus Spirochaeta across three
                      Reviewed by:           distant biogeographic provinces of the Southern Ocean; maritime Antarctica, sub-
                    Tanja Shabarova,
                                             Antarctic Islands, and Patagonia. Each targeted Spirochaeta operational taxonomic
  Academy of Sciences of the Czech
           Republic (ASCR), Czechia          units were characterized by a substantial intrapopulation microdiversity, and significant
                        Gastón Azziz,        genetic differentiation and phylogeographic structure among the three provinces. Gene
Universidad de la República, Uruguay
                                             flow estimations among Spirochaeta populations support the role of the Antarctic
                  *Correspondence:
                   Guillaume Schwob          Polar Front as a biogeographic barrier to bacterial dispersal between Antarctic and
          guillaume.schwob@uchile.cl         sub-Antarctic provinces. Conversely, the Antarctic Circumpolar Current appears as
                                             the main driver of gene flow, connecting sub-Antarctic Islands with Patagonia and
                   Specialty section:
         This article was submitted to       maritime Antarctica. Additionally, historical processes (drift and dispersal limitation)
                 Aquatic Microbiology,       govern up to 86% of the spatial turnover among Spirochaeta populations. Overall, our
               a section of the journal
             Frontiers in Microbiology
                                             approach bridges the gap between microbial and macrobial ecology by revealing strong
             Received: 30 April 2021
                                             congruency with macroorganisms distribution patterns at the populational level, shaped
            Accepted: 23 June 2021           by the same oceanographic structures and ecological processes.
            Published: 14 July 2021
                                             Keywords: Antarctic Polar Front, Antarctic Circumpolar Current, Spirochaeta, phylogeography, Minimum Entropy
                              Citation:      Decomposition, Microbial Conveyor Belt, microdiversity, Southern Ocean
                Schwob G, Segovia NI,
          González-Wevar C, Cabrol L,
        Orlando J and Poulin E (2021)
    Exploring the Microdiversity Within
                                            INTRODUCTION
     Marine Bacterial Taxa: Toward an
              Integrated Biogeography
                                            Biogeography has traditionally investigated the geographic distribution of macroorganisms in the
                in the Southern Ocean.      Eukaryota domain. Yet, the last two decades have witnessed a growing number of studies focused
          Front. Microbiol. 12:703792.      on the biogeography of microorganisms, and repeatedly reporting non-random community
     doi: 10.3389/fmicb.2021.703792         assemblages of various prokaryotic microorganisms (Martiny et al., 2006; Wilkins et al., 2013;

Frontiers in Microbiology | www.frontiersin.org                                      1                                               July 2021 | Volume 12 | Article 703792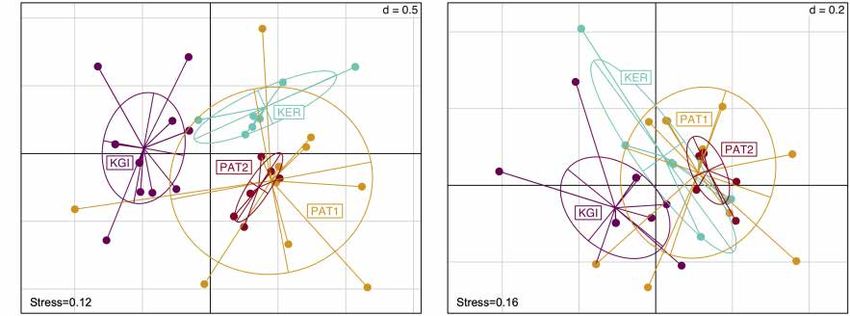
Schwob et al.                                                                                         Microdiversity and Phylogeography of Spirochaeta

Karimi et al., 2018). Unlike contemporary driving factors (i.e.,            González−Wevar et al., 2017; González-Wevar et al., 2019).
environmental selection) that have been extensively studied                 Accordingly, and based on the described distribution of species,
(Gilbert et al., 2012; Stegen et al., 2012; van der Gast,                   biogeographers have traditionally recognized Antarctica and
2015), the role of historical processes – past ecological and               sub-Antarctica as the two main biogeographic provinces of
evolutionary events – onto the present-day distribution patterns            the SO, even if several provinces have been proposed within
of microorganisms remains poorly investigated. Initially, the               each of them (Koubbi et al., 2014). Contrarily, outside the
consensus was that the rapid and widespread dispersal of                    APF, the ACC is generally described as the driver of genetic
microbes should erase any signal of past historical events                  connection across the sub-Antarctic zone due to its eastward
(Martiny et al., 2006). Nevertheless, it is now clear that historical       circulation (Nikula et al., 2010; Cumming et al., 2014; Moon et al.,
processes, such as the dispersal barriers and geographic distance,          2017; González−Wevar et al., 2018). Intraspecific genetic and
might substantially contribute to microbes’ biogeography instead            phylogeographic studies of macroorganisms have demonstrated
of environmental filtering (Hanson et al., 2012, 2019). Similarly           the ACC’s role in connecting geographically distant sub-
to larger organisms, biogeographic regionalization, isolation,              Antarctic provinces (Gérard et al., 2008; Fraser et al., 2009;
and endemism have been reported for microbes, reflecting the                González−Wevar et al., 2018; Frugone et al., 2019). The marine
predominant effect of geographic distance over environmental                biota distribution in this region has been synthesized in the
variations (Papke et al., 2003; Whitaker et al., 2003).                     Biogeographic Atlas of the SO, providing updated biogeographic
    To date, most of the microbial biogeographic patterns have              information of a wide range of benthic and pelagic taxa
been depicted at the whole community level, taking advantage                from Metazoan, macroalgae, and phytoplankton (De Broyer
of the extensive survey capacity provided by the next-generation            et al., 2014). Despite being the most abundant and diverse
sequencing (NGS) technologies (Almasia et al., 2016; Karimi                 domains on Earth, Bacteria, and Archaea are not included
et al., 2018; Wu et al., 2019). Nevertheless, as observed in various        in the SO Atlas (Shade et al., 2018). Studies conducted at
empirical studies, a finer taxonomic scale generally allows better          the whole community-level support (1) the role of ACC as a
detection of geographic patterns (Hanson et al., 2012; Chase                likely efficient mechanism of circumpolar microbial transport
and Martiny, 2018; Bay et al., 2020). Moreover, the ecological              and dispersal (Murray and Grzymski, 2007; Wilkins et al.,
processes driving the biogeographic patterns at the community-              2013) and (2) the role of APF as the main dispersal barrier
level would mainly result from the accumulation of micro-                   separating Antarctic and sub-Antarctic microbial assemblages
evolutive processes, i.e., mechanisms contributing to the genetic           (Wilkins et al., 2013; Flaviani et al., 2018; Raes et al.,
composition and diversity within populations, and how they vary             2018). However, even when geographic distributions of marine
in space and time (Hanson et al., 2012; Larkin and Martiny,                 microbial communities have been characterized in the region,
2017). Hence the comprehensive description of these micro-                  the underlying evolutionary processes remain unclear, and their
evolutive processes requires considering the intra-population               comprehensive understanding may rely on a higher taxonomic
diversity, as commonly applied in phylogeographic studies of                perspective, exploring bacterial populations’ microdiversity.
macroorganisms. In other words, microbial assembly processes                    Targeting the intraspecific microdiversity using NGS data
need to be investigated at a finer taxonomic resolution than                requires specific computational methods to discriminate the
usually done by microbial biogeographic surveys and consider                stochastic noise caused by random sequencing errors from
the “microdiversity” within groups (Larkin and Martiny, 2017;               those associated with biologically significant diversity (Hanson
Chase and Martiny, 2018).                                                   et al., 2012; Edgar and Flyvbjerg, 2015; Chase and Martiny,
    The oceans have been considered among the most challenging              2018). For this purpose, an algorithm called “Minimum Entropy
environments to test hypotheses about microbial biogeography,               Decomposition” (MED) relying on the oligotyping method
mainly due to the speculated transport of organisms over large              has been proposed by Eren et al. (2015). This algorithm
distances by marine currents and the absence of perceivable                 allows to identify true sequence variants (i.e., oligotypes)
marine barriers impeding potential dispersal events (Fenchel                within the “operational taxonomic units” (OTUs), classically
and Finlay, 2004). However, oceanic fronts separating different             defined at 97% identity of the bacterial 16S rRNA gene. This
water masses have been recently identified as major microbial               approach has already been successfully used to unravel fine-
dispersal barriers (Flaviani et al., 2018). The Southern Ocean              grained biogeographic patterns of bacterial microdiversity in
(SO) is a vast region representing approximately 20% of the                 Arctic sediments, such as variations in oligotype distribution
world ocean surface. It surrounds Antarctica, and its northern              according to spatial and environmental parameters (Buttigieg
limit is the Subtropical Front (Gruber et al., 2019). Two                   and Ramette, 2014). Moreover, focusing on the sulfate-reducing
main oceanographic structures shape the SO biogeography; the                genus Desulfotomaculum in Arctic marine sediments, Hanson
Antarctic Polar Front (APF) and the Antarctic Circumpolar                   et al. (2019) showed clear biogeographic patterns – attributed
Current (ACC). The APF is classically considered a harsh                    to historical factors associated with past environments – were
north–south obstacle for dispersing marine organisms due to                 only evident at the microdiversity level achieved with the
the brutal change in water temperature and salinity (Griffiths,             oligotyping method. However, the microevolutionary processes
2010; Halanych and Mahon, 2018). Phylogenetic reconstruction                causing the microdiversity were not assayed, and the study
achieved on various vertebrate and invertebrate taxa clearly                did not encompass large-scale distribution among different
supports the role of the APF on their respective diversification            biogeographic provinces, as it was restricted to the west coast of
processes (Díaz et al., 2011; Poulin et al., 2014; Hüne et al., 2015;       Spitsbergen, Svalbard in the Arctic Ocean.

Frontiers in Microbiology | www.frontiersin.org                         2                                        July 2021 | Volume 12 | Article 703792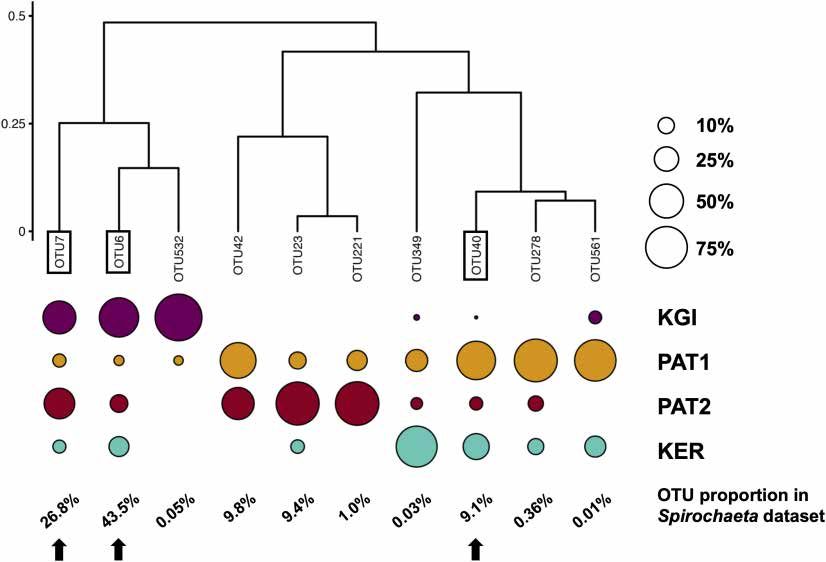
Schwob et al.                                                                                          Microdiversity and Phylogeography of Spirochaeta

    In the present proof-of-concept study, we aim to elucidate               model to validate our methodology and explore marine bacteria’s
the evolutionary processes driving microbial biogeography across             spatial genetic patterns, from genus to population level. We
different provinces of the SO by combining (1) community-                    hypothesized that the strong biogeographic barrier between
wide surveying provided by the high-throughput sequencing of                 South America and maritime Antarctica classically observed in
the 16S rRNA gene, (2) intra-species microdiversity resolution               the literature for macroorganisms (i.e., vicariance process) also
obtained through the oligotyping method implemented in the                   affects the fine-scale genetic structure and the phylogeographic
MED pipeline, and (3) phylogeographic analysis as traditionally              patterns within Spirochaeta OTUs. Besides, the ACC-mediated
developed for macroorganisms as models. Considering the                      connectivity among sub-Antarctic provinces should be reflected
SO as an outstanding idoneous frame, we investigated the                     by a greater genetic homogeneity of Spirochaeta populations
geographic distribution of genetic diversity of marine bacterial             between South American sites and the Kerguelen Islands, rather
taxa across three biogeographic provinces: maritime Antarctica               than with maritime Antarctica. Alternatively, the potential high
(King George Island, South Shetland Islands, West Antarctic                  dispersal capacity of Spirochaeta taxa may result in the absence of
Peninsula), sub-Antarctic Islands of the Indian Ocean (Kerguelen             genetic and phylogeographic structure across the SO.
archipelago), and southern South America (Patagonia). We
selected sites separated by the APF, i.e., maritime Antarctica and
Patagonia, and others connected through the ACC, i.e., Patagonia             MATERIALS AND METHODS
and Kerguelen archipelago.
    As the contribution of geography to biological diversity                 Sampling Collection, DNA Extraction,
patterns (i.e., dispersal limitation) is stronger on habitat-                and 16S rRNA Gene Library Preparation
specialists (i.e., taxa found in habitat with high selective strength)       Adult Abatus individuals were sampled from four localities
(Lindström and Langenheder, 2012; Szekely et al., 2013), and                 across the SO, including two sites in Patagonia, southern South
emphasized within homogeneous habitats distributed across                    America (Possession Bay, PAT1 and Puerto Deseado, PAT2),
large spatial scales (Astorga et al., 2012; Hanson et al., 2012;             one site in Kerguelen Islands (Port-aux-Français, KER), and
Langenheder and Lindström, 2019), we focused our study on                    one site in the West Antarctic Peninsula (King George Island,
the bacterial community associated to a specific habitat: the gut            KGI) (Figure 1 and Table 1). Marine surface sediments (0–
of Abatus irregular sea urchins. The Abatus genus is distributed             5 cm, referred here as “external sediment”) were also sampled
across the SO and gathers various sibling species homologous                 in each Abatus population’s immediate vicinity as the ingested
in ecology and habitat, such as Abatus cavernosus in southern                food source of the sea urchins. Due to logistic constraints, it was
South America, Abatus cordatus in Kerguelen Islands, and Abatus              not possible to collect external sediment in the PAT2 site. All
agassizii in maritime Antarctica (Poulin and Feral, 1995; David              individuals were dissected under sterile conditions to collect the
et al., 2005; Díaz et al., 2012; Guillaumot et al., 2018). Since these       whole digestive tract minus the caecum (identified as “gut tissue”)
species lack specialized respiratory structure, they are restricted          following Schwob et al. (2020). Gut tissue samples were gently
to the well-oxygenated coarse sediments found at shallow depth               rinsed with nuclease-free sterile water to remove the content
(typically 1–3 m depth) in sheltered bays, protected from the                (i.e., in sediment) and were then individually homogenized using
swell (Poulin and Feral, 1995). Within the Abatus hosts, we                  mortar and pestle under a laminar-flow cabinet. Genomic DNA
focused on a specific micro-environment – the gut tissue –                   was extracted from both external sediments and the totality of the
previously described to act as a selective filter of the external            homogenized gut tissue samples using the DNeasy PowerSoil                R

sediment microbiota, as illustrated by the reduction of bacterial            Kit (Qiagen, Hilden, Germany) following the manufacturer’s
diversity at both taxonomic and functional levels (Schwob et al.,            recommendations.
2020). Working on the gut community with supposedly more                         A metabarcoding approach was used to assess the bacterial
limited dispersal capacity, through a high sequencing depth, is              community composition in the external sediment and Abatus
expected to (1) provide robust coverage of the bacterial diversity,          gut tissue samples. Briefly, extracted genomic DNA was used
(2) minimize the relevance of environmental filtering between                as the template for PCR amplification using the primers
provinces, (3) emphasize the contribution of geographic and                  515F 50 -GTGYCAGCMGCCGCGGTA-30 and 926R 50 -
oceanographic factors, and therefore (4) enhance the detection               CCCCGYCAATTCMTTTRAGT-30 (Parada et al., 2016).
of phylogeographic signals across the SO (Hanson et al., 2012).              The PCR conditions and 16S rRNA gene library preparation
As a model taxon to explore bacterial phylogeography in the                  were the same as described in Schwob et al. (2020).
SO, we chose the Spirochaeta genus (phylum Spirochaetes).
Spirochaeta bacteria are recognized as the most prevalent and                Metabarcoding Data Processing
abundant genus in the Abatus gut tissue (Schwob et al., 2020).               External sediment and gut tissue amplicons were sequenced
Moreover, spirochaetes are classically reported in marine benthic            using the paired-end sequencing technology (2 × 250 bp) on
sediments (Bowman and McCuaig, 2003; Beiruti et al., 2017)                   the Illumina MiSeq platform at the UWBC DNA Sequencing
and, to a lesser extent, in the water column (Ocean Barcode                  Facility (University of Wisconsin–Madison, United States). Reads
Atlas1 ). Thus, due to its ease of detection and ubiquity across             of 16S rRNA were processed using the open-source software
biogeographic provinces, Spirochaeta represents an illustrative              Mothur v1.44.0. Briefly, 30 and 50 reads were paired and
                                                                             trimmed according to their length and quality as described
1
    http://oba.mio.osupytheas.fr/ocean-atlas/                                in Schwob et al. (2020). Chimeric sequences were removed

Frontiers in Microbiology | www.frontiersin.org                          3                                        July 2021 | Volume 12 | Article 703792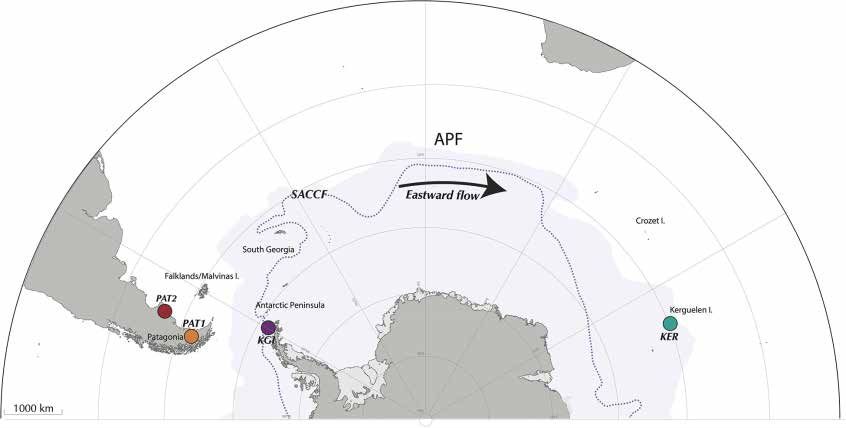
Schwob et al.                                                                                                         Microdiversity and Phylogeography of Spirochaeta

TABLE 1 | Experimental design and sequencing data.

Locality                Province                  GPS coordinates                           Date    Designation   Sample types            N      Nseq. (Relat. Abund.)

King George Island      Maritime Antarctica       62◦ 120 55.300 S 58◦ 560 43.800 W     01–2019        KGI        External sediments      8      255786 (10%)
                                                                                                                  Gut tissue              31     563383 (22%)
Bahía Posesión          Patagonia                 52◦ 190 52.9700 S 69◦ 290 10.5000 W   07–2019        PAT1       External sediments      6      271828 (11%)
                                                                                                                  Gut tissue              15     447892 (18%)
Puerto Deseado          Patagonia                 47◦ 450 07.000 S 65◦ 520 04.000 W     12–2016        PAT2       External sediments      NA     NA
                                                                                                                  Gut tissue              10     470087 (18%)
Port-aux-Français       Kerguelen Island          49◦ 210 13.3200 S 70◦ 130 8.75900 E   11–2017        KER        External sediments      5      92564 (4%)
                                                                                                                  Gut tissue              14     440498 (17%)

N, number of samples; Nseq., total number of cleaned sequences obtained; Relat. Abund., relative abundance in the global dataset.

  FIGURE 1 | Sampling localities across the Southern Ocean, encompassing Possession Bay and Puerto Deseado in Atlantic Patagonia (PAT1 and PAT2,
  respectively), King George Island in Maritime Antarctica (KGI), and Port-aux-Français in Kerguelen Islands (KER). The Antarctic Polar Front (APF) and the Southern
  Antarctic Circumpolar Front (SACCF) are represented by the limit between the white and the blue areas, and by the dashed line, respectively.

using Uchime implemented in Mothur (Edgar et al., 2011).                                    pairwiseAdonis R packages, respectively (Oksanen et al., 2011;
Reads were clustered into OTUs at 97% identity threshold,                                   Martinez Arbizu, 2017).
and a filter of relative abundance at >0.0001% was applied,                                    A subset of the three most abundant Spirochaeta OTUs
as recommended by Bokulich et al. (2013). Following this,                                   present in the four localities was retained for further analysis
a taxonomic classification was performed with the classify.otu                              (Supplementary File 2). All the sequences assigned to the
function and the SILVA database v138 implemented in Mothur.                                 selected Spirochaeta OTUs were retrieved using the bin.seqs
An OTU table of Spirochaeta was edited (i.e., all OTUs assigned                             command in Mothur. Finally, the resulting fasta files were
to the genus Spirochaeta), and converted into a presence/absence                            processed independently through the Minimum Entropy
matrix to detect the shared or exclusive OTUs across the                                    Decomposition pipeline following Eren et al. (2015).
four selected sites, discarding abundance variations resulting
from short-term environmental conditions. Bray–Curtis and                                   Minimum Entropy Decomposition
Unweighted Unifrac distances were calculated from the OTU                                   Minimum Entropy Decomposition pipeline was used to identify
presence/absence matrix and used to perform a non-metric                                    nucleotidic polymorphism at fine-scale resolution (
Schwob et al. Microdiversity and Phylogeography of Spirochaeta
Unsupervised oligotyping was carried out individually on point to dispersal limitation and ecological drift out as possible
Spirochaeta OTUs using the default dynamically computed community composition drivers.
threshold from which entropy is considered as zero (−m). Then, the respective effect of dispersal limitation and
Additionally, each identified oligotype had to have a default ecological drift were disentangled using the pairwise Bray–
minimum relative abundance of 2% in the OTU sequences Curtis-based Raup–Crick dissimilarity index (RCBray ) among
dataset (Eren et al., 2015). Accumulation curves of oligotypes’ sites (Chase et al., 2011), weighted by oligotype abundance
richness were computed for each Spirochaeta OTU at a 95% (Stegen et al., 2013). The RCBray values < −0.95 and
confidence interval using the package iNext (Hsieh et al., 2016) > +0.95 correspond to communities that have –respectively–
in r v3.6.0 (R Core Team, 2012). Pie charts of the relative site more or fewer taxa in common than expected by chance,
contributions in the total abundance of the Spirochaeta OTUs and therefore indicate that community turnover is driven
oligotypes were performed with the pie function in the package by homogenizing dispersal (RCBray < −0.95) or dispersal
graphics in r v3.6.0. limitation plus drift (RCBray > +0.95). On the contrary, RCBray
values > −0.95 and < +0.95 are indicative of ecological drift
Genetic Diversity and Structure of (Ramoneda et al., 2020).
The βMNTD/βNTI and RCBray matrices, and the respective
Spirochaeta Populations
contributions of the four ecological processes, were calculated
The number of oligotypes (k), the oligotype diversity (H), the
using an optimized version of the initial script of Stegen
number of discriminant sites (S) and the pairwise difference
et al. (2013), developed by Richter-Heitmann et al. (2020).
between sequences (8) were estimated individually for each
The phylogenetic trees required for the βMNTD/βNTI matrix
Spirochaeta OTU using the packages pegas (Paradis, 2010) and
were generated using PhyML v3.0 (Guindon et al., 2010), and
ape v5.3.0 (Paradis et al., 2015) in R v3.6.0. For comparative
the oligotype sequences of Spirochaeta previously aligned with
purposes among sites with unequal sample sizes, a composite
MUSCLE (Edgar, 2004). Comparisons with βNTI and RCBray null
bootstrapping script was written to rarefy the sequence datasets
models included 999 randomizations.
to the minimum number of sequences per site and repeat the
rarefaction with 1,000 re-samplings. Confidence intervals at 95%
of genetic diversity indices were then calculated using these Testing for Isolation by Distance and
iteration values. The genetic differentiation (Fst and 8st ) among
Environment
Spirochaeta populations was analyzed using the software arlequin
To disentangle the relative effect of geographic distance
v3.5.2 (Schneider et al., 2000) with 1,000 permutations and a
and abiotic environmental differences on the Spirochaeta
significance threshold at 0.05. Phylogeographic differentiation
oligotype composition between samples, we used the distance-
was also estimated with the nearest-neighbor statistic Snn
based multiple matrix regression with randomization (MMRR)
(Hudson, 2000), and the significance of Snn estimates was
approach (Wang, 2013). We extracted a set of 9 environmental
tested with a permutation test through DnaSP v5.10.01 (Librado
variables for each of our sampling site from the Bio-ORACLE
and Rozas, 2009). The reconstruction of oligotype networks
database (Assis et al., 2018), including pH, the means of
was performed using the Median Joining method with the
nitrate, silicate, and phosphate concentrations, and the means
software Populational Analysis with Reticulate Trees v1.7.0 in
at the mean depth of seawater salinity, dissolved oxygen
PopART (Leigh and Bryant, 2015). Because of the differences in
concentration, seawater temperature, seawater temperature
Spirochaeta OTUs’ abundances across the four sites, oligotypes
range and chlorophyll concentration. All environmental variables
frequencies were calculated for each site and then summed per
were standardized ((xi − x)/sd(x)), and were then analyzed
OTU to reconstruct the oligotype networks.
through principal components analysis (PCA). As a high
percentage of the variation among localities was explained by
Quantification of Selection, Dispersal, the first component (PC1, >91%, Supplementary Files 6, 7),
and Drift we transformed the scores of PC1 into Euclidean distance
The relative contribution of stochastic (i.e., dispersal, drift) and using the vegdist function in the vegan package in R to use
deterministic (i.e., selection) processes, on Spirochaeta oligotype it as the environmental distance matrix further. The longitude
assembly was measured for the selected OTU, following the and latitude coordinates were converted into kilometers using
analytical framework described in Stegen et al. (2015) and the earth.dist function implemented in the fossil package in R
illustrated by Feng et al. (2018). Briefly, the approach relies on the (Vavrek, 2011). The geographic distances were transformed using
comparison of the phylogenetic turnover between communities the Hellinger method through the decostand function of the vegan
across samples (β mean nearest-taxon distance, βMNTD) to package in R. The dissimilarity matrix of Spirochaeta oligotype
a null distribution of βMNTD, and denoted as the β-nearest composition among samples was also created from Bray–Curtis
taxon index (βNTI). βNTI values indicate that taxa between distances using the vegdist function of the R package vegan.
two communities are more (i.e., βNTI < −2) or less (i.e., Finally, to evaluate the relative weight of environmental and
βNTI > +2) phylogenetically related than expected by chance, geographic distance matrices, an MMRR was performed using
thus suggesting that communities experience homogenizing or the R package PopGenReport (Adamack and Gruber, 2014), and
variable selection, respectively (Stegen et al., 2015). βNTI values the correlation coefficients and their significance were estimated
ranging from −2 to +2 indicate a limited selection effect and based on 10,000 random permutations.
Frontiers in Microbiology | www.frontiersin.org 5 July 2021 | Volume 12 | Article 703792Schwob et al. Microdiversity and Phylogeography of Spirochaeta
Connectivity Among Spirochaeta Microdiversity Within Spirochaeta OTUs
Populations A total of 48, 96, and 48 oligotypes were defined for OTU6,
The amount and direction of gene flow among Spirochaeta OTU7, and OTU40, respectively (Supplementary File 4).
populations were estimated using the coalescent-based program Accumulation curves of OTU6, OTU7, and OTU40 oligotypes
Lamarc v2.1.10 (Kuhner, 2006). A total of 10 runs was performed reached saturation in almost all localities indicating that the
for each Spirochaeta OTU, consisting of likelihood searches of overall majority of Spirochaeta microdiversity has been found
20 initial and 2 final chains, with a minimum of 500 and 10,000 within the analyzed samples (Supplementary File 5). Diversity
recorded trees, respectively, and sampling every 20 generations indices measured as N, k, S, h, and 5 for each OTU in each
after a burn-in of 1,000 genealogies. The effective number of locality are provided in Table 2. The genetic diversity (H) ranged
migrants per generation (Nm) among Spirochaeta populations from 0.0681 (OTU40 in KER) to 0.8036 (OTU7 in PAT1) across
was calculated by multiplying the maximum likelihood estimates localities (Table 2). Patagonian sites exhibited higher oligotype
(MLE) of the mutation parameter (θ) by the migration parameter and nucleotide diversity for OTU6 and OTU7 than maritime
(M), both estimated through the Lamarc program. We present Antarctica and Kerguelen Islands localities. In contrast, the
the mean and standard deviation of the estimated Nm values genetic diversity of the OTU40 oligotypes was higher in the
obtained from the 10 runs for each Spirochaeta OTU. maritime Antarctic site and lower for the Kerguelen population.
Populations Differentiation and
RESULTS Phylogeographic Structure of
Spirochaeta Oligotypes
Sequencing Performance and Independently of the OTU considered, the genetic (Fst ) and
OTU-Based Analysis phylogeographic (8st ) structures between the two closest
A total of 4,184,226 raw reads was generated from the 91 localities (i.e., Patagonian sites PAT1 and PAT2) were extremely
samples of external sediments and gut tissues. Once processed, to moderately low. In the case of the OTU40, the genetic diversity
2,542,038 cleaned sequences distributed into 727 OTUs were and frequencies of Spirochaeta oligotypes were fully homogenous
obtained from the external sediment and gut tissue samples between PAT1 and PAT2, as indicated by the non-significant
(details provided in Table 1). Out of this condensed dataset, values of Fst and 8st comparisons (Table 3). Contrarily, higher
425,613 sequences associated with the Spirochaeta genus were values of Fst and 8stT comparisons were recorded among the
retrieved, representing a total of 10 OTUs. three provinces considered in this study (Patagonia, PAT1/PAT2;
Both Bray–Curtis and Unweighted Unifrac distance methods maritime Antarctica, KGI; Kerguelen Islands, KER) (Table 3).
did not reveal any difference in Spirochaeta OTU composition Consistently, the distribution of the Spirochaeta oligotypes
between the Patagonian sites (PAT1 and PAT2) (Figures 2A,B was geographically discontinuous across the localities, with
and Supplementary File 1). Conversely, Kerguelen Islands (KER) various province-specific oligotypes (Supplementary File 4).
and martime Antarctic (KGI) sites were significantly different Two exceptions were observed, in the case of maritime Antarctica
from each other in terms of Spirochaeta OTU composition and and Kerguelen Islands (KGI and KER) for OTU6, and in the case
with the Patagonian ones (Supplementary File 1). of Kerguelen Islands (KER) and Patagonia (PAT1) for OTU7,
The relative abundance analyses among the 10 Spirochaeta with relatively lower values of Fst and 8st (Table 3). The Snn
OTUs (Figure 3) showed four of them were shared among test for phylogeographic structure among all sites was significant
all the SO’s sampled provinces. Three OTUs (OTU6, OTU7, with statistic values ≥ 0.5 (OTU6; Snn = 0.50, p-value < 0.0001,
and OTU532) were more abundant in maritime Antarctica OTU7; Snn = 0.57, p-value < 0.0001, OTU40; Snn = 0.50,
(KGI), four (OTU40, OTU42, OTU278 and OTU561) were more p-value < 0.0001). All in all, these results indicate the existence
abundant in the Patagonian locality PAT1, two (OTU23 and of both genetically and geographically differentiated Spirochaeta
OTU221) were predominantly found in the Patagonian locality populations across the three biogeographic provinces sampled.
PAT2, and a single one (OTU349) was predominant in Kerguelen Within the 48 oligotypes identified in the OTU6, 11 (∼23%)
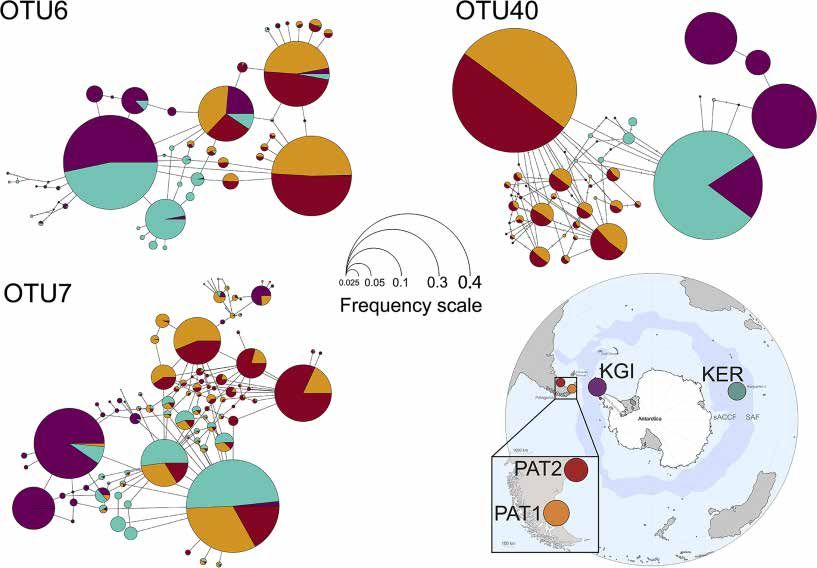
Islands (Figure 3). were exclusive to one of the three provinces, and more than
To test the genetic and phylogeographic structure of half were exclusive to Kerguelen Islands (Supplementary File
Spirochaeta at the broadest geographic scale available through our 4). Maritime Antarctic and Kerguelen Islands (KGI and KER)
dataset, we selected the three most abundant Spirochaeta OTUs shared 27 (∼66%) of their oligotypes. The Patagonian localities
which were detected within the four localities of the dataset (i.e., (PAT1/PAT2) shared 18 of the 23 total oligotypes (∼78%)
OTU6, OTU7, and OTU40). These three selected co-distributed observed in this province (Figure 4 and Supplementary File 2).
OTUs are good targets to constitute a metapopulation, which A total of five (∼10%) oligotypes were broadly distributed
is a meaningful ecological unit of distinct local populations across all localities. Oligotype network of OTU6 showed
separated by gaps in habitats and interconnected to some extent short genealogies and the presence of at least five dominant
via dispersal events of individuals (Halsey et al., 2015). The oligotypes. The dominant oligotype in Patagonia (PAT1/PAT2),
relative abundance in sample types, the closest sequence retrieved and the dominant oligotype in maritime Antarctica and
from Blast analysis, and the distribution of these OTUs among the Kerguelen Islands (KGI/KER), were separated by a single
localities are provided in the Supplementary Files 2, 3. substitution (Figure 4).
Frontiers in Microbiology | www.frontiersin.org 6 July 2021 | Volume 12 | Article 703792Schwob et al. Microdiversity and Phylogeography of Spirochaeta FIGURE 2 | Non-metric multidimensional scaling scatter diagram of the Spirochaeta OTUs composition in gut tissue samples across the localities. Presence/absence matrix converted in Bray–Curtis distances (A) and Unweighted Unifrac distance (B). Colors are assigned to the locality. FIGURE 3 | Clustering of Spirochaeta OTUs based on their relative abundances in each site. Clustering of Bray–Curtis distances matrix using the complete linkage method. The size of the circles indicates the repartition of a given OTU sequences among the four localities. The percentages indicate the OTUs’ proportions in the Spirochaeta dataset. Framed labels and black arrows indicate the selected OTUs that were selected to be process through the Minimum Decomposition Entropy pipeline (MED). In the case of OTU7, the percentage of exclusive oligotypes in Kerguelen Islands (∼68%) and even fewer in the Patagonian was almost the same as the OTU6, with 21 (∼22%) oligotypes localities (∼62%) (Figure 4). exclusive to one of the provinces (Supplementary File 4). The For OTU40, we recorded a predominant group of oligotypes dominant oligotype was different between maritime Antarctic specific to the Patagonian sites representing 65% of the and Kerguelen Islands localities (KGI and KER) (Figure 4). While oligotypes identified within the OTU40 (Supplementary File most oligotypes from Kerguelen Islands (KER) were detected in 4 and Figure 4). A clear separation was observed in the at least one of the Patagonian sites (PAT2 or PAT1) (∼94%), oligotype network between the KGI/KER and PAT1/PAT2 fewer oligotypes from maritime Antarctica (KGI) were observed localities (Figure 4), with only four shared oligotypes (∼8%) Frontiers in Microbiology | www.frontiersin.org 7 July 2021 | Volume 12 | Article 703792
Schwob et al.                                                                                                       Microdiversity and Phylogeography of Spirochaeta

TABLE 2 | Summary of oligotypes number and genetic indices per OTU and per site for the three most abundant Spirochaeta OTUs found in all sampling localities.

OTU                     Site                        N                      k                       S                      H                                5

OTU6                     KGI                    125,112                 26 ± 0                  24 ± 0             0.4879 ± 0.0004                 0.7919 ± 0.0012
                        PAT1                      6,452                 18 ± 0                   8±0               0.6701 ± 0.0000                 1.5772 ± 0.0000
                        PAT2                      22,545                22 ± 0                  12 ± 0             0.6574 ± 0.0002                 1.5426 ± 0.0006
                        KER                       29,448                33 ± 1                  29 ± 0             0.5677 ± 0.0003                 0.9687 ± 0.0011
OTU7                     KGI                      53,645                31 ± 0                  32 ± 0             0.5555 ± 0.0003                 1.4443 ± 0.0021
                        PAT1                      7,249                 69 ± 0                  37 ± 0             0.8036 ± 0.0000                 2.0247 ± 0.0003
                        PAT2                      44,509                60 ± 0                  33 ± 0             0.7958 ± 0.0002                 1.7336 ± 0.0011
                        KER                       7,021                 43 ± 0                  37 ± 0             0.6306 ± 0.0000                 1.0261 ± 0.0000
OTU40                    KGI                       47                   4±0                      4±0               0.6984 ± 0.0000                 1.6606 ± 0.0000
                        PAT1                      24,612                32 ± 0                  14 ± 0             0.3741 ± 0.0007                 0.4922 ± 0.0011
                        PAT2                      2,423*                34 ± 0                  11 ± 0             0.3816 ± 0.0000                 0.4903 ± 0.0000
                        KER                       11,017                12 ± 0                   8±0               0.0681 ± 0.0004                 0.0913 ± 0.0006

N, number of sequences; k, number of oligotypes; S, number of polymorphic sites; H, genetic diversity; 5, mean number of pairwise diversity. The mean and standard
deviation were calculated from a total of 1,000 bootstraps, performed by randomly subsampling per site a number of sequences equal to the minimum number of
sequences obtained among sites for a given OTU.
*In the case of OTU40, the number of sequences in the PAT2 site was used to perform the resampling.

(Supplementary File 2). In maritime Antarctica (KGI), three                                Gene Flow Under a Migration–Drift
of the four oligotypes were exclusive, whereas the dominant                                Equilibrium Model
one from Kerguelen Islands (KER) was shared with maritime
                                                                                           All the analyzed OTUs showed high genetic similarities between
Antarctica (KGI) (∼8%) (Figure 4 and Supplementary File 4).
                                                                                           the analyzed Patagonian populations (PAT1 and PAT2). Gene
                                                                                           flow analyses identified a bidirectional pattern from PAT2 to
                                                                                           PAT1 (effective number of migrants per generation, Nm > 4)
TABLE 3 | Genetic (FST ) and phylogeographic structure (8ST ) of the Spirochaeta           and from PAT1 to PAT2 (Nm > 14) (Table 4). The connectivity
populations among localities.                                                              between the Patagonian and maritime Antarctic localities showed
                                                                                           relatively low values of Nm, ranging from 0.001 (OTU40, from
OTU         Index       Locality        KGI              PAT1     PAT2           KER
                                                                                           PAT2 to KGI) to 0.64 (OTU7, from KGI to PAT1) (Table 4). The
OTU6            FST        KGI            –                0        0             0        OTU6 and OTU7 were both characterized by a substantial gene
                          PAT1         0.4428              –        0             0        flow between maritime Antarctica and Kerguelen Islands that was
                          PAT2         0.4417           0.0026      –             0        stronger in the direction KGI to KER (OTU6, Nm = 9.81 and
                          KER          0.0654           0.3856    0.3829          –        OTU7, Nm = 1.39) than in the direction KER to KGI (OTU6,
             8ST           KGI            –                0        0             0        Nm = 2.63 and OTU7, Nm = 0.41) (Table 4). Contrarily, an
                          PAT1         0.5371              –        0             0        unidirectional and low gene flow from KER to KGI (Nm = 0.87)
                          PAT2         0.5360           0.0027      –             0        was recorded for the OTU40 (Table 4). Finally, the connectivity
                          KER          0.1041           0.5063    0.4933          –        between Patagonian (PAT1 and PAT2) and Kerguelen Islands
OTU7            FST        KGI            –                0        0             0        (KER) localities was illustrated by three distinct patterns; a
                          PAT1         0.3436              –        0             0        low-intensity flow (Nm < 0.5) predominant in the direction
                          PAT2         0.3254           0.0726      –             0        PAT1/PAT2 to KER for the OTU6, a substantial flow (Nm
                          KER          0.3902           0.0568    0.1734          –        values from 2.00 up to 24.41) predominant in the direction KER
             8ST           KGI            –                0        0             0        to PAT1/PAT2 for the OTU7, and an absence of connectivity
                          PAT1         0.4393              –        0             0        (Nm < 0.03) in the case of the OTU40 (Table 4). The gene flows
                          PAT2         0.5361           0.1341      –             0        are summarized in Figure 5.
                          KER          0.3967           0.1312    0.3429          –
OTU40           FST        KGI            –                0        0             0
                                                                                           Contribution of Contemporary Selection
                          PAT1         0.5549              –      0.4505          0
                          PAT2         0.5445
Schwob et al. Microdiversity and Phylogeography of Spirochaeta
FIGURE 4 | Median-joining oligotype networks of the three selected OTUs of Spirochaeta. Each circle represents a distinct oligotype. Colors indicate the locality of
provenance. Circle size is scaled on the sum of the oligotype frequencies in each locality, within the corresponding OTU dataset. Raw abundances are provided in
Supplementary File 2.
to 20% (OTU40) of turnover, and homogenizing selection, we identified numerous oligotypes within each of the Spirochaeta
ranging from 9% (OTU6) to 19% (OTU40) of turnover OTUs. These oligotypes, corresponding to Spirochaeta sub-
(Table 5). Overall, deterministic processes (i.e., homogeneous taxa, were characterized by contrasting geographic distribution
and variable selection) did not account for more than 10% of the and high levels of 16S rRNA gene similarity (>97%). Taking
populations’ turnover. advantage of the populational taxonomic resolution provided
The MMRR approach was used to disentangle the relative by the oligotype definition, we depicted the Spirochaeta
effect of geographic distance environmental abiotic differences biogeographic patterns across the analyzed provinces in the SO,
on the Spirochaeta oligotype compositions between samples. using various tools adapted from population genetics classically
The geographic distance matrix was linearly correlated to the applied in phylogeographic study of macroorganisms’ models.
abundance-based similarity matrix of Spirochaeta population Despite its low substitution rate [approximately 1% in 50 million
composition for OTU7 and OTU40, explaining about 31 and years (Espejo and Plaza, 2018)], our study demonstrates that
67% of the observed variation, respectively (Table 6). In contrast, the 16S rRNA gene shows value in the evaluation of the
the geographic distance did not significantly impact Spirochaeta microdiversification, as it offers the best compromise between
oligotype composition for OTU6 (Table 6). Whatever the OTU an informative genetic signal, and robust screening of global
considered, the environment distance had a significant but slight microbial diversity at intra-OTU level, in a wide range of barely
contribution (Schwob et al. Microdiversity and Phylogeography of Spirochaeta
TABLE 4 | Effective numbers of migrants per generation (Nm) among Spirochaeta
populations of the OTU6, OTU7, and OTU40.
OTU From θ± SD To Nm ± SD
OTU6 KGI 0.003 ± 0.0003 KER 9.81 ± 3.14
PAT1 0.12 ± 0.06
PAT2 0.14 ± 0.09
KER 0.004 ± 0.0004 KGI 2.63 ± 1.19
PAT1 0.12 ± 0.05
PAT2 0.07 ± 0.05
PAT1 0.003 ± 0.0004 KGI 0.14 ± 0.05
KER 0.43 ± 0.15
PAT2 24.99 ± 7.10
PAT2 0.005 ± 0.0005 KGI 0.20 ± 0.07
KER 0.27 ± 0.16
PAT1 14.57 ± 4.93
OTU7 KGI 0.002 ± 0.0003 KER 1.39 ± 0.60
PAT1 0.64 ± 0.23
PAT2 0.03 ± 0.02
KER 0.006 ± 0.0006 KGI 0.42 ± 0.13
PAT1 24.41 ± 8.23
PAT2 2.00 ± 0.54
PAT1 0.015 ± 0.0029 KGI 0.16 ± 0.06
KER 0.41 ± 0.16
PAT2 4.69 ± 1.82
PAT2 0.004 ± 0.0005 KGI 0.05 ± 0.03
KER 0.13 ± 0.09
PAT1 19.95 ± 9.57
OTU40 KGI 0.002 ± 0.0002 KER 0.09 ± 0.04
PAT1 0.01 ± 0.01
PAT2 0.02 ± 0.02
KER 0.001 ± 0.0002 KGI 0.87 ± 0.21
PAT1 0.02 ± 0.02
PAT2 0.02 ± 0.02
PAT1 0.005 ± 0.0008 KGI 0.01 ± 0.01
KER 0.03 ± 0.02
PAT2 28.65 ± 10.15
PAT2 0.005 ± 0.0008 KGI 0.00 ± 0.00
KER 0.06 ± 0.02
PAT1 15.94 ± 10.48
Only gene flows with Nm values > 0.25 are considered as significant (values
in bold). Mean and standard deviation values were calculated from the 10 runs
performed for each OTU.
The β-diversity analysis performed at the Spirochaeta genus
level revealed that each of the three geographic provinces might
host specific Spirochaeta OTUs representing distinct phylogenetic
FIGURE 5 | Gene flows summary and proposed dispersal routes across the lineages. We also reported a non-random distribution trend
Southern Ocean for each Spirochaeta taxa. Only the gene flows with Nm with contrasting patterns of Spirochaeta OTU compositions
values > 0.25 are graphically represented. Discontinuous arrows represent
across the localities. Nevertheless, about half of the Spirochaeta
Nm values > 0.25 and 1.
Continuous arrows’ width is proportional to Nm values.
OTUs exhibited a broad distribution encompassing Patagonia,
maritime Antarctica, and the Kerguelen Islands located more
than 7,000 km to the east. This result suggests that despite
being mostly detected in Abatus gut, and to a lesser extent
of the reads based on entropy variation. We propose to expand in marine benthic sediments, some Spirochaeta representatives
the concept of “metaphylogeography” to the prokaryotes since it would disperse through the SO currents. Concordantly, previous
permits phylogeographic inferences of uncultured microbes from campaigns of high-throughput sequencing of the ocean water
a wide range of habitats. column have consistently reported the presence of free-living
Frontiers in Microbiology | www.frontiersin.org 10 July 2021 | Volume 12 | Article 703792Schwob et al. Microdiversity and Phylogeography of Spirochaeta
Spirochaeta OTUs in surface to mesopelagic water, away from the evidenced the critical role of the APF on biogeographic patterns,
coastlines (Pesant et al., 2015). as an open-ocean barrier inducing a genetic break between South
For each of the three assessed OTUs, the Spirochaeta America and Antarctica (e.g., ribbon worms (Thornhill et al.,
populations were expected to be remarkably homogeneous 2008); brittle stars (Hunter and Halanych, 2008); notothenioid
between the two Patagonian sites due to the geographic vicinity fishes (Hüne et al., 2015); limpets (González-Wevar et al.,
and the absence of an evident oceanographic barrier. Consistently 2012, 2019; González−Wevar et al., 2017); sea urchins (Díaz
with this assumption, and for each of the three OTUs, most et al., 2011). Regarding the microbial distribution patterns,
of the Spirochaeta oligotypes were shared, the lowest genetic significant β-diversity differences between prokaryotes assembly
and phylogeographic structures were reported, and high levels from both sides of the APF have been reported in the past, but
of gene flow were recorded between these two sites. Similarly, most of the studies focused on global community in the water
low or absent differentiation patterns along the Atlantic coast column, at high taxonomic resolution [summarized in Flaviani
of Patagonia were previously reported for marine Patagonian et al. (2018)]. Here, we extend this discontinuity in bacterial
macroorganisms, including notothenioid fishes (Ceballos et al., diversity to a fine taxonomic resolution (i.e., intra-OTU),
2016), scorched mussels (Trovant et al., 2015), and pulmonate revealing province-restricted oligotypes and strong genetic and
gastropods (Iriarte et al., 2020) presumably due to their high phylogeographic structure between Patagonian and maritime
dispersal potential and the ecological continuum of the sampled Antarctic Spirochaeta populations.
localities that may conform a same biogeographic province Contrarily, and despite the substantial geographic distance
connected through the equator-ward Falkland current (Phillpot, separating the sub-Antarctic Kerguelen Islands and the
1985; Arkhipkin et al., 2004). Further phylogeographic studies Patagonian and Antarctic sites (>6,500 km), population genetic
focusing on microbial taxa of additional sampling sites from analyses suggest the existence of some level of connectivity
Atlantic Patagonia should confirm the microbial biogeographic between Kerguelen and the other sites. These findings support
consistency of this province. a potential dispersion of Spirochaeta taxa from Patagonia
Between Patagonian and maritime Antarctic provinces, and maritime Antarctica to the Kerguelen Islands, and
Spirochaeta populations exhibited strong genetic and contrariwise, from the Kerguelen Islands to Patagonia and
phylogeographic structures, and low levels of gene flow were maritime Antarctica. As evidenced by the numerous shared
estimated between these two provinces. These results corroborate oligotypes, such connectivity would maintain a sufficient
our hypothesis that the APF hinders individual dispersion and gene flow among these provinces to partially counteract the
genetic homogeneity among bacterial populations and suggest genetic divergence driven by selection, mutation, and genetic
that the geographically structured Spirochaeta populations drift, inducing oligotypes mixing, and limiting the spatial
from these two provinces are genetically diverging over time differentiation of oligotypes assembly (Martiny et al., 2006;
(Nagylaki, 1980; Charlesworth, 2003). Previous studies focusing Orsini et al., 2013). Moreover, we suggest that this gene flow
on diverse macroorganisms taxonomic groups of the SO have is not bidirectional, but governed by exclusively eastward
TABLE 5 | Quantitative parsing of ecological processes driving populations turnover within Spirochaeta OTUs.
Ecological processes contributions
Spirochaeta OTU Homogeneous selection (%) Homogenizing dispersal (%) Ecological drift (%) Dispersal limitation (%) Variable selection (%)
OTU6 2.7 8.8 74.0 12.1 2.3
OTU7 0.4 10.3 63.7 17.6 8.0
OTU40 0.3 19.4 49.6 21.7 9.1
According to the Stegen et al. (2013) approach, percentage refers to the percentage of pairs of communities that appear to be driven by either homogeneous selection,
homogenizing dispersal, ecological drift, dispersal limitation, or variable selection.
TABLE 6 | Multiple matrix regression with randomization (MMRR) to quantify the relative effects of isolation by distance (IBD) and isolation by environment (IBE) on
oligotypes assemblage within Spirochaeta OTUs.
Spirochaeta OTU Model Coefficient t Statistic t p-Value F statistic F p-value R2
OTU6 IBE 0.037 17.82Schwob et al. Microdiversity and Phylogeography of Spirochaeta
oriented dispersion routes (Figure 5), following the major particulate matter, either biotic [e.g., hitchhiking on zooplankton
and constant flow of the ACC (Güller et al., 2020). Under (Grossart et al., 2010) and seaweed (Serebryakova et al., 2018)] or
this scenario, Spirochaeta individuals from Kerguelen Islands abiotic [e.g., microplastics (Bowley et al., 2020), known to have
may seed toward Patagonia following the ACC eastward flow a long-distance dispersion potential], may also contribute to the
around Antarctica. Such ACC-mediated connectivity among bacterial spreading in the oceans (Milici et al., 2017; Mestre and
sub-Antarctic provinces (Patagonia and Kerguelen Islands) Höfer, 2020).
is well known in a wide range of benthic macroorganisms The marine prokaryote communities are usually considered
populations, such as buoyant kelps Durvillaea antarctica and widely dispersed and mainly shaped by contemporary ecological
Macrocystis pyrifera (Macaya and Zuccarello, 2010), and several processes such as environmental filtering (Sunagawa et al.,
kelp-associated macroinvertebrates (Leese et al., 2010; Nikula 2015; Louca et al., 2016). By applying the ecological framework
et al., 2010; Cumming et al., 2014; González−Wevar et al., developed by Stegen et al. (2013) to oligotypes data, we
2018; Güller et al., 2020). Occasionally, Spirochaeta individuals found contrarily that ecological drift was the predominant
from Kerguelen Islands may also be able to reach the maritime stochastic mechanism shaping intra-populations turnover within
Antarctic province. Such pattern has been recently reported Spirochaeta taxa across the SO. Our previous study of the
for the southern bull kelp D. antarctica, a typical sub-Antarctic Abatus gut microbiota showed that non-neutral processes drove
macroalgae, which is transported by rafting to as far as the West the bacterial community at the OTU level in the host gut
Antarctic Peninsula coasts, pushed by the circumpolar flow of tissue (Schwob et al., 2020). While deterministic processes
the ACC or by storms leading to the occasional crossing of the are usually prevalent in structuring microbial communities’
APF (Fraser et al., 2020). assembly at a higher taxonomic resolution (Martiny et al., 2011;
Several studies have provided evidence of a high dispersal Wang, 2013; Sintes et al., 2015; Larkin and Martiny, 2017),
capacity of marine bacteria by comparing community the stochastic mechanisms tend to have a more significant
composition mostly at high taxonomic resolution (e.g., class, contribution at finer taxonomic scales (Logares et al., 2020),
genus, or OTU) among various water masses and oceanic regions since niche overlapping and functional redundancy enhance
(Sul et al., 2013; Sunagawa et al., 2015; Milici et al., 2017; Logares the susceptibility of populations to drift (Zhou and Ning,
et al., 2020). Particularly, the most abundant marine bacteria 2017). Thus, the biogeographic structure observed among
are supposed to migrate between adjacent regions through Spirochaeta populations might result from stochastic birth, death,
passive transport (Sul et al., 2013). An innovative conceptual disturbance, emigration, and immigration events rather than
framework called “Microbial Conveyor Belt” (MCB) has been oligotype-sorting through the biotic and abiotic environmental
proposed by Mestre and Höfer (2020), to emphasize that the variations (Martiny et al., 2006; Nemergut et al., 2013; Vellend,
marine microorganisms’ dispersion would not merely rely on 2016). Consistently, the MMRR analysis revealed that the
passive and stochastic dispersal, but instead on the adaptation isolation-by-environment (IBE) model might account for a low
of life-history traits (e.g., dormancy stage). These traits would percentage of the Spirochaeta oligotypes turnover. Altogether,
allow microorganisms to successfully and recurrently disperse in these results tend to validate the strategy applied in our study,
unfavorable habitats through specific dispersion avenues (Locey, that is, to focus on specialist bacterial taxa hosted in sibling
2010). Here, we provided empiric results from Spirochaeta sea urchin species with the same habitat preferences, in order
population based on genetic data supporting a partial MCB to homogenize the environment, to reduce the diversity, to
in the SO driven by the ACC. Unfortunately, details about soften the deterministic selection driven by environmental
the benthic Spirochaeta taxa’s ecology are scarce, with a single variations, thus leading to the maximization of the detection of
isolated strain from subseafloor sediment (Miyazaki et al., 2014). neutral micro-evolutive processes associated with biogeography
Thus, the life-history traits of Spirochaeta, as the sporulation (Langenheder and Lindstrom, 2019).
capacity, remain to be investigated to further understand By analogy with the genetic drift, whereby changes in gene
its distribution pattern in the SO. Nevertheless, in order to frequencies occur solely by chance in a population (Chase et al.,
disperse, we propose that Spirochaeta individuals (enriched in 2011), our result suggests that the microdiversity observed within
the digestive tract) could be released from the host gut toward the Spirochaeta taxa would be mostly generated by genetic drift
the surrounding benthic sediments through fecal pellets. Such without any adaptive implications. An earlier study reported that
enrichment of the digesta with taxa from the host microbiota, microdiversity observed in the 16S rRNA gene of marine coastal
as well as the presence of Spirochaeta within the fecal material, Vibrio splendidus isolates was ecologically neutral (Thompson
have been demonstrated in the sea urchin species Lytechinus et al., 2005). Nevertheless, we cannot discard that, while the
variegatus (Hakim, 2015). The released Spirochaeta individuals microdiversity within the V4–V5 of 16S rRNA gene-targeted here
may be resuspended in the water column through the action of is likely to be acquired through neutral processes (Chust et al.,
one or several processes such as upwelling, bioturbation by the 2016), it may also be associated with substantial modifications
benthic deposit-feeders, or water column mixing during winter in niche-defining traits and functional attributes specific of the
(Meysman et al., 2006; Petro et al., 2017; Mestre and Höfer, Spirochaeta strains, driven by deterministic processes, in order
2020). Once in the water column, these Spirochaeta individuals to cope with local conditions (Zure et al., 2017; Chase and
may disperse over large geographic scales, transported through Martiny, 2018). Further studies will need to focus on other loci
oceanographic features (e.g., currents, punctual meteorological (e.g., functional genes), potentially under selection, as they are
events) (Mestre and Höfer, 2020). The attachment to suspended expected to display a higher degree of differentiation among
Frontiers in Microbiology | www.frontiersin.org 12 July 2021 | Volume 12 | Article 703792Schwob et al. Microdiversity and Phylogeography of Spirochaeta
populations and to provide an insight into the ecology of the taxa, such as the cyanobacteria Synechococcus or the Vibrio
Spirochaeta sub-taxa (White et al., 2010). populations, demonstrate fine-tuning of their physiology by
Given the highly specific targeted habitat (i.e., gut tissue) accumulating microdiversity in functional genes through
and the intricate association between Spirochaeta and Abatus, duplication events, SNPs, and allelic variants (Everroad and
it remains unclear whether or not the host contributes to Wood, 2012; Shapiro et al., 2012). Alternatively, these differences
the Spirochaeta genetic and phylogeographic pattern reported may also be related to the Spirochaeta OTU abundance, since the
in the gut populations. Indeed, the Abatus guts may have more relatively abundant the Spirochaeta populations were (i.e.,
individual colonization histories also contributing to the higher number of sequences retrieved from the gut tissue through
microbial community assembly process at the population the metabarcoding approach), the more they tend to exhibit
level. However, due to the limited sequencing coverage of cosmopolitan oligotypes (i.e., detected across each of the four
Spirochaeta diversity outside the host, we cannot evaluate to localities). It is not unreasonable to infer that a larger population
what extent the most abundant oligotypes from the gut tissue, may have more chance to migrate and successfully reach a
also detected in the external sediment samples, would be suitable habitat, while small-size populations may be more likely
representative of the composition of free-living populations, diluted along the dispersal route with no/too few dispersive
thus preventing a comprehensive understanding of the host particles to establish in the new habitat (Sul et al., 2013).
contribution to Spirochaeta oligotype assembly. Ultimately, The diversity units defined by 16S rRNA gene sequences are
conclusion about the predominant effect of stochastic ecological generally considered as insensitive to diversification resulting
processes onto Spirochaeta oligotype composition need to from dispersal limitation (Hanson et al., 2012). Contrastingly, we
be nuanced, as potential historical contingencies related to reported that the dispersal limitation was the second most crucial
the host can eventually shape the final state of microbiota ecological factor driving the turnover of Spirochaeta oligotypes,
composition through both stochastic and/or deterministic and by extension, their genetic divergence. Dispersal limitation
processes (Obadia et al., 2017). In strong instance, host early- is classically considered as a historical factor since current
life microbial colonization by early colonizers benefiting from oligotypes assemblage results from past dispersal limitations
a “priority effect” may influence the order and timing of the (Martiny et al., 2006). Our result indicates that the potentially
historical sequence of species arrival within the local community suitable habitats are too distant (Heino et al., 2015), or
(Fukami, 2015). Under the hypothesis of a predominantly inaccessible due to the existence of oceanic currents (Sul et al.,
stochastic gut colonization by random microbes, diverging 2013; Logares et al., 2018), hence limiting the homogenization
chronologies of the ensuing microbial species would be expected, of Spirochaeta oligotypes’ frequencies across populations and
leading toward different stable states and a noisy community allowing the neutral genetic divergence of genomic regions
assembly across Abatus populations (Obadia et al., 2017). overtime via genetic drift (Nosil et al., 2008; Hanson et al.,
Contrastingly, we reported patterns of high dominance and 2012). Note that our results obtained from distinct methodologies
prevalence of Spirochaeta across Abatus individuals, and high [i.e., the genetic differentiation and phylogeographic structure,
homogeneity of oligotypes composition within populations (data the contribution of dispersal limitation from Stegen et al.
not shown), rather suggesting that Spirochaeta may benefit framework (Stegen et al., 2013), and the contribution of
from a priority effect during Abatus early-life, and that the the geographic distance isolation by distance (IBD) from the
subsequent interactions may deterministically constrain gut MMRR analysis] were highly consistent with each other, and
colonization success (Fukami, 2015; Higgins et al., 2020). across the three selected Spirochaeta OTUs. For instance, the
Moreover, while there is no evidence of vertical transmission in OTU40 that harbored the overall highest value of genetic
Abatus, the transovarial transmission of a bacterial endosymbiont divergence was also characterized by the highest estimated
was reported in the regular sea urchin species Heliocidaris contribution of geographic distance and dispersal limitation,
erythrogramma (Carrier et al., 2021) and maternal-inherited thus supporting the interrelation between genetic divergence and
bacterial communities were detected in unfertilized eggs of oligotypes population turnover, and the overall consistency of the
Strongylocentrotus purpuratus (Carrier and Reitzel, 2019). The approach implemented.
presence of preexisting Spirochaeta strains within the gut may
also limit the ensuing horizontal colonization and constrain the
microbiota composition toward a homogenous and stabilized CONCLUSION
state (Renelies-Hamilton et al., 2021). The presence of vertically
transmitted Spirochaeta, the compositional transition states of Our study highlights the application of V4–V5 16S rRNA gene
Abatus gut microbiota, and the biogeographic structure of free- metabarcoding and oligotyping approach as rapid, robust, and
living Spirochaeta populations in the external sediment remain to resolutive enough to unravel marine bacterial phylogeographic
be further investigated. patterns and detect genetic connectivity among the SO provinces.
Notwithstanding the consistency of the global Taken together, the three Spirochaeta OTUs analyzed evidence
phylogeographic and connectivity patterns depicted across three consistent phylogeographic patterns, classically observed
the three tested OTUs, we also reported some differences in the studies involving benthic macroinvertebrates across
according to the taxa considered, which might be related to the SO: (1) a high populational and genetic homogeneity
different ecotypes with distinct ecological niches or different within the Patagonia province, (2) a strong barrier to dispersal
dispersal capacity. For instance, various marine bacterial between Patagonia and maritime Antarctica due to the APF,
Frontiers in Microbiology | www.frontiersin.org 13 July 2021 | Volume 12 | Article 703792You can also read