Isotopic evidence for dominant secondary production of HONO in near-ground wildfire plumes
←
→
Page content transcription
If your browser does not render page correctly, please read the page content below
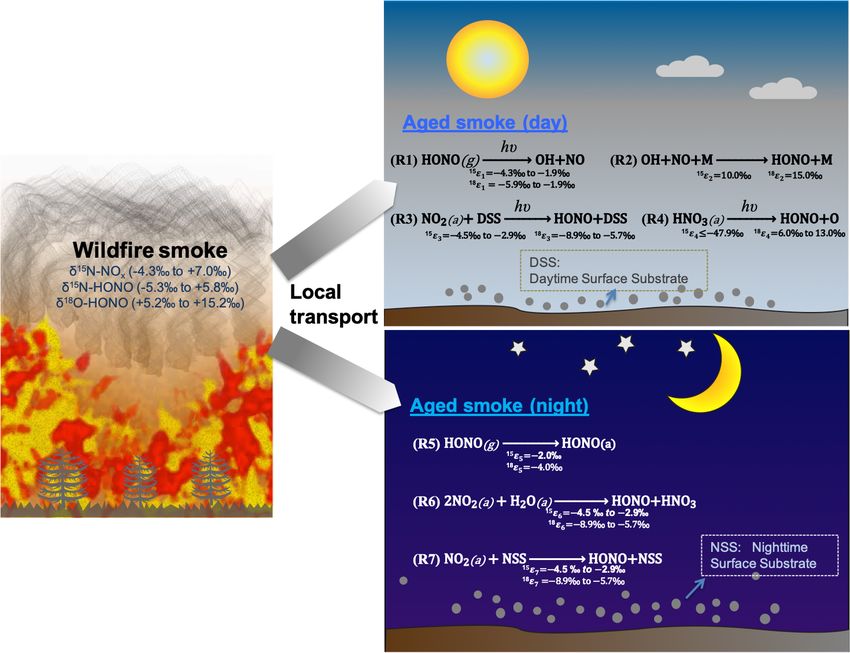
Atmos. Chem. Phys., 21, 13077–13098, 2021
https://doi.org/10.5194/acp-21-13077-2021
© Author(s) 2021. This work is distributed under
the Creative Commons Attribution 4.0 License.

Isotopic evidence for dominant secondary production of HONO
in near-ground wildfire plumes
Jiajue Chai1,2 , Jack E. Dibb3 , Bruce E. Anderson4 , Claire Bekker1,2 , Danielle E. Blum1,5 , Eric Heim3 ,
Carolyn E. Jordan4,6 , Emily E. Joyce1,2 , Jackson H. Kaspari7 , Hannah Munro3 , Wendell W. Walters1,2 , and
Meredith G. Hastings1,2
1 Institute at Brown for Environment and Society, Brown University, Providence, RI, USA
2 Department    of Earth, Environmental and Planetary Sciences, Brown University, Providence, RI, USA
3 Institute for the Study of Earth, Oceans and Space, University of New Hampshire, Durham, NH, USA
4 NASA Langley Research Center, Hampton, VA, USA
5 Department of Chemistry, Brown University, Providence, RI, USA
6 National Institute of Aerospace, Hampton, VA, USA
7 Department of Chemistry, University of New Hampshire, Durham, NH, USA

Correspondence: Jiajue Chai (jiajue_chai@brown.edu)

Received: 13 March 2021 – Discussion started: 29 March 2021
Revised: 21 July 2021 – Accepted: 3 August 2021 – Published: 3 September 2021

Abstract. Nitrous acid (HONO) is an important precursor to        the NO-to-NO2 oxidation branching ratio between ozone
hydroxyl radical (OH) that determines atmospheric oxidative       and peroxy radicals. Our approach provides a new and criti-
capacity and thus impacts climate and air quality. Wildfire is    cal way to mechanistically constrain atmospheric chemistry
not only a major direct source of HONO, it also results in        and/or air quality models on a diurnal timescale.
highly polluted conditions that favor the heterogeneous for-
mation of HONO from nitrogen oxides (NOx = NO + NO2 )
and nitrate on both ground and particle surfaces. However,
these processes remain poorly constrained. To quantitatively      1   Introduction
constrain the HONO budget under various fire and/or smoke
conditions, we combine a unique dataset of field concentra-       Vastly increased wildfire activity and intensity is a challeng-
tions and isotopic ratios (15 N / 14 N and 18 O / 16 O) of NOx    ing issue in many parts of the world including the western
and HONO with an isotopic box model. Here we report the           US, and it is strongly linked to warming surface temperatures
first isotopic evidence of secondary HONO production in           and earlier spring snowmelt (Westerling, 2016). Wildfire is
near-ground wildfire plumes (over a sample integration time       a significant source of nitrogen oxides (NOx = NO + NO2 )
of hours) and the subsequent quantification of the relative im-   and nitrous acid (HONO), as well as other important trace
portance of each pathway to total HONO production. Most           gases and particulate matter. NOx serves as a key precursor to
importantly, our results reveal that nitrate photolysis plays     atmospheric ozone (O3 ) and secondary aerosols in the pres-
a minor role (
13078                                        J. Chai et al.: Isotopic evidence for dominant secondary production of HONO

time, and it greatly counteracts reduced OH production from        formation via reduction of NO2 on inorganic surfaces (e.g.,
O3 photolysis caused by high particle loading reducing ac-         iron-bearing minerals) and organic surfaces (e.g., quinone-
tinic flux (Jaffe and Briggs, 2012; Peng et al., 2020; Theys et    rich humic acid) in soils and particulate matter (Reaction R7)
al., 2020). Wildfire-emitted NOx and HONO not only greatly         (Scharko et al., 2017; Kebede et al., 2016; Martins-Costa et
impact the atmospheric chemistry in local regions close to         al., 2020). While the emission sources and heterogeneous
the fire but also contribute significantly to the reactive ni-     pathways were hypothetically used to account for missing
trogen (RN) burden thousands of kilometers downwind via            HONO sources (Stemmler et al., 2006; Su et al., 2011; Ye et
transport and RN cycling, especially when mixed with fossil        al., 2016; VandenBoer et al., 2014; Donaldson et al., 2014a;
fuel combustion emissions (Jaffe et al., 2013; McClure and         Kebede et al., 2016; Scharko et al., 2017), their relative im-
Jaffe, 2018; Westerling et al., 2006; Westerling, 2016).           portance is poorly quantified due to large uncertainties asso-
                                                                   ciated with emission heterogeneity, surface area and compo-
            hν
HONO(g) −→ OH + NO                                         (R1)    sition, environmental condition (day versus night, tempera-
                                                                   ture, relative humidity), quantification of heterogeneous re-
   Despite their important impacts on air quality, climate, and    action rate, and knowledge gaps in detailed mechanisms. As
human and ecosystem health, the budgets of wildfire-derived        a result, the HONO budget in the atmospheric boundary layer
NOx and HONO are poorly constrained due to limited field           remains poorly constrained.
measurements, high reactivity and large spatiotemporal het-
erogeneity. Bottom-up approaches rely on limited emission          HO + NO + M → HONO + M
factor measurements with uncertainty in HONO sources and                (M = third body gas molecules, e.g., nitrogen)        (R2)
chemistry; top-down approaches (i.e., satellite observations)                        hν
have limited sensitivity in the lower troposphere and bound-       NO2 (g) + DSS −→ HONO + DSS
ary layer and again are limited by large uncertainties in               (g = gas; DSS = daytime surface substrate)            (R3)
HONO sources and chemistry to interpret the satellite mea-                 hν
surements. Although gas-phase reaction between OH and              HNO3 −→ HONO + O                                           (R4)
NO (Reaction R2) ubiquitously produces HONO, it is far             HONO(g) → HONO(a)
from sufficient to explain the observed HONO levels in nu-              (a = adsorbed to surfaces)                            (R5)
merous studies given the fast photolysis during the day (Su
et al., 2011). HONO, along with NOx , can be directly emit-        2NO2 (a) + H2 O(a) → HONO + HNO3                           (R6)
ted from various sources including vehicle exhaust, biomass        NO2 (a) + NSS → HONO + NSS
burning (BB) and microbially driven soil emissions. In ad-              (NSS = nighttime surface substrate)                   (R7)
dition, it has been proposed that HONO can be produced
from other RN species (e.g., NO2 and nitrate) via various het-        Stable isotopes hold unique promise to provide rig-
erogeneous pathways (Fig. 1). Major secondary HONO pro-            orous constraints on sources, chemical processing path-
duction pathways during the day include heterogeneous NO2          ways and sinks of RN species as they reflect iso-
conversion on photoactive surfaces (Reaction R3) (Ammann           topic signatures associated with these processes. δ 15 N
et al., 1998; George et al., 2005; Stemmler et al., 2006) and      (= [(15 N / 14 N)sample / (15 N / 14 N)air−N2 − 1] × 1000 ‰) has
heterogeneous photolysis of nitrate including particulate ni-      shown great potential to trace the atmospheric origin
trate (p-NO−  3 ) and nitric acid (HNO3 ) via Reaction (R4) (Ye    of NOx and its fate as nitrate (Hastings et al., 2009),
et al., 2016; Zhou et al., 2011). In past studies, heterogeneous   whereas δ 18 O (= [(18 O / 16 O)sample / (18 O / 16 O)VSMOW −
conversion of NO2 to HONO on photoactive surfaces such             1] × 1000 ‰; VSMOW is Vienna Standard Mean Ocean Wa-
as organic surfaces (Reaction R3) has been proposed to ex-         ter) serves as a sensitive indicator for the relative importance
plain a missing HONO source (Ammann et al., 1998; George           of major oxidants (i.e., O3 , RO2 and OH) that lead to NOx
et al., 2005; Stemmler et al., 2006; Wong et al., 2012). Or-       conversion (Thiemens, 2006). In particular, O3 has an exclu-
ganic surfaces exist in both aerosol particles and soils at the    sively high δ 18 O as a result of mass-independent fraction-
surface (e.g., humic acids), but there is major uncertainty        ation associated with its formation in the atmosphere, and
associated with quantifying available surface area and the         this anomaly is transferred to oxidized products such as NO2 ,
NO2 uptake coefficient. During the night, surface (soils and       HONO and HNO3 (Thiemens, 2006).
aerosols) uptake is the predominant sink for HONO (Reac-              Using our recently developed and validated sampling tech-
tion R5), and heterogeneous conversion of NO2 to HONO              niques in combination with offline isotopic composition
has been widely accepted as the major secondary HONO               analyses (Chai et al., 2019), we characterized for the first
production source during the night (Reaction R6 and/or Re-         time δ 15 N of NOx and HONO, as well as δ 18 O-HONO, in
action R7). Although it is clear that heterogeneous NO2 hy-        ground-level wildfire plumes in the western US as part of
drolysis (Reaction R6) can be a major pathway for night-           two major field campaigns: Western Wildfire Experiment for
time HONO production (Finlayson-Pitts et al., 2003), recent        Cloud Chemistry, Aerosol Absorption and Nitrogen (WE-
work has also shown compelling evidence for faster HONO            CAN) in summer 2018 and Fire Influence on Regional and

Atmos. Chem. Phys., 21, 13077–13098, 2021                                          https://doi.org/10.5194/acp-21-13077-2021
J. Chai et al.: Isotopic evidence for dominant secondary production of HONO 13079 Figure 1. The schematics of loss and secondary production of HONO in areas impacted by wildfire smoke in daytime (Reactions R1–R4) and nighttime (Reactions R5–R7). We conducted our sample collection
13080                                           J. Chai et al.: Isotopic evidence for dominant secondary production of HONO

                                                                       to known interferences from NOy species, e.g., HONO and
                                                                       PAN. However, these data provide an upper limit of NOx
                                                                       level that supports the isotopic collections of NOx , HONO
                                                                       and nitrate. HONO and HNO3 concentrations were measured
                                                                       using the University of New Hampshire’s dual mist cham-
                                                                       ber and ion chromatograph (MC/IC) system with an uncer-
                                                                       tainty of 3 % at 5 min resolution (Chai et al., 2019; Scheuer
                                                                       et al., 2003). During the FIREX-AQ field campaign in July–
                                                                       August 2019, we mounted our sampling instruments onto
                                                                       the NASA Langley mobile aerosol characterization platform
                                                                       (MACH-2) (Kaspari et al., 2021).

                                                                       2.2   Description of sampling location and strategy

                                                                       While our sampling strategy was similar in both years, the ac-
                                                                       tual sampling approach differed in response to fire condition
Figure 2. Box-whisker plots for concentration of NO2 (left) and        and accessibility to fresh smoke from the mobile platforms.
HONO (right) (a), δ 18 O-HONO (b) and δ 15 N-HONO (c) for each            During the 2018 WE-CAN campaign, our ground mea-
sample. Individual data points are plotted within each box grouped     surements and sampling targeted smoke from Rabbit Foot
by various field smoke conditions including young nighttime smoke      (RF) fire in the Challis area of Salmon–Challis National For-
(YN), young daytime smoke (YD), mixed daytime smoke (M) that           est in central Idaho, from 9 to 18 August 2018 (Salmon-
contains smoke contributed by either night smoke or fresh smoke,       Challis National Forest, 2018). Measurements were made at
aged nighttime smoke (AN) and aged daytime smoke (AD). Data
                                                                       various locations around the Challis area of Idaho impacted
from three wildfires are shown here, including Rabbit Foot (RF) fire
                                                                       by the RF fire, consisting of five different conditions: young
during the 2018 WE-CAN campaign, Williams Flats (WF) fire and
Nethker fire during the 2019 FIREX-AQ campaign. N is sample            smoke during nighttime (YN), young smoke during day-
number measured for each condition. Each box-whisker presents          time (YD), aged smoke during nighttime (AN), aged smoke
the 5th, 25th, 50th, 75th and 95th percentile of sample values in      during daytime (AD) and mixed daytime smoke (M) that
each group.                                                            contains smoke contributed by either night smoke or fresh
                                                                       smoke. To sample the young smoke, we drove the Molab
                                                                       to Morgan Creek Road (MCR), which extends into a valley
ated using the synergistic measurement of HONO, NO and                 that was several kilometers away from the edge of the fire.
NO2 concentrations in the field.                                       We observed heavy smoke that based on distance and wind
                                                                       speed was expected to transport from the RF fire burning lo-
                                                                       cations to the valley within a few hours or less. Three night
2     Methodology                                                      trips and two day trips were made to MCR. While the night-
                                                                       time measurements were conducted while driving, the day-
2.1    Description of mobile laboratory platforms: Molab               time work was carried out while parked at a spike camp (i.e.,
       and MACH-2                                                      a campsite for firefighters and support personnel) at the upper
                                                                       end of MCR; the spike camp was about 2 km from the fire,
During the WE-CAN campaign in August 2018, we con-                     which we were able to see while conducting the measure-
ducted our measurements and sampling using the NOAA                    ments. The aged smoke was sampled at three stationary sites
Chemical Science Division mobile laboratory (Molab),                   located around the Challis area, each less than 30 km away
which was a cargo van with all instruments mounted on it.              from the RF fire. All of these sites were recreational vehi-
Meteorological instrumentation on the roof of the Molab pro-           cle parks that allowed for power plugins. A total of 7 nights
vides temperature, relative humidity, wind speed, wind di-             and 4 d were measured. The sampling locations and driving
rection, altitude and GPS coordinates. All additional instru-          map are shown in Fig. S1 with detailed information on the
ments were mounted onto the interior floor, and ambient air            measurements listed in Table 1.
is sampled through 1 or 2 m Teflon inlets that exit the roof of           During 2019 FIREX-AQ, we investigated five wildfires in
the Molab via boreholes. NO and NOx concentrations were                the western US including Shady fire (Idaho), Black Diamond
measured with a Thermo Scientific Model 42i chemilumi-                 fire (Montana), Williams Flats fire (Washington), Nethker
nescence NO / NOx analyzer owned by Brown University,                  fire (Idaho) and Little Bear fire (Utah) from 24 July to
with ± 0.4 ppbv precision and 0.2 ppbv zero noise at 1 min             22 August 2019. We intensively sampled the emissions from
time resolution. Note the NOx concentration measured using             Williams Flats fire and Nethker fire based on the large size
the chemiluminescence analyzer can be falsely elevated due             and easy access to sampling locations (Fig. S2). Similar to

Atmos. Chem. Phys., 21, 13077–13098, 2021                                              https://doi.org/10.5194/acp-21-13077-2021
J. Chai et al.: Isotopic evidence for dominant secondary production of HONO 13081
Table 1. Sampling condition and isotopic composition and concentration results for NOx and HONO for Rabbit Foot (RF) fire during
the 2018 WE-CAN campaign (a), as well as Williams Flats (WF) fire and Nethker fire during the 2019 FIREX-AQ campaign (b). Smoke
conditions include young nighttime smoke (YN), young daytime smoke (YD), mixed daytime smoke (MD), aged nighttime smoke (AN) and
aged daytime smoke (AD). The conditions are determined primarily by comparing the field data with the lab data involving three factors:
δ 18 O-HONO, δ 15 N relationship between HONO and NOx , and HONO / NOx (or HONO / NO2 ) ratio, along with the smoke sampling
locations. Specifically, significantly elevated δ 18 O-HONO indicates secondary production of HONO. Note that during the 2019 campaign,
NOx concentrations were not measured due to instrumental breakdown.
(a)
Start time End time Fire (smoke δ 18 O-HONO δ 15 N-HONO δ 15 N-NOx [HONO] [NOx ] [NO2 ] HONO / NO2 HONO / NOx
(MDT) (MDT) condition) ppbv ppbv ppbv
08/09/18 10:11 08/09/18 19:10 RF (AD) 50.2 ‰ 3.8 ‰ 1.3 ‰ 0.06 1.8 1.42 0.04 0.03
08/09/18 21:51 08/10/18 08:29 RF (AN) 37.3 ‰ −5.0 ‰ −2.5 ‰ 0.06 1.3 1.35 0.04 0.05
08/10/18 09:50 08/10/18 20:26 RF (AD) 61.4 ‰ −1.7 ‰ −3.6 ‰ 0.20 1.5 1.30 0.16 0.13
08/10/18 20:31 08/11/18 08:08 RF (AN) 60.4 ‰ −4.6 ‰ −2.9 ‰ 0.15 1.4 1.39 0.11 0.11
08/11/18 22:43 08/12/18 09:38 RF (AN) 51.8 ‰ −5.8 ‰ −3.5 ‰ 0.09 1.1 1.07 0.09 0.08
08/12/18 21:25 08/13/18 03:33 RF (AN) 62.1 ‰ −3.9 ‰ −2.6 ‰ 0.26 0.8 0.81 0.33 0.33
08/13/18 03:53 08/13/18 07:05 RF (YN) 16.4 ‰ 7.4 ‰ 8.7 ‰ 0.92 1.9 1.59 0.58 0.48
08/14/18 04:11 08/14/18 06:12 RF (YN) 16.1 ‰ −0.4 ‰ 1.3 ‰ 0.18 1.7 1.62 0.11 0.11
08/14/18 10:38 08/14/18 17:18 RF (AD) 57.0 ‰ 1.6 ‰ −4.3 ‰ 0.24 1.8 1.56 0.16 0.13
08/14/18 17:22 08/14/18 22:11 RF (AD) 78.0 ‰ 3.8 ‰ −2.6 ‰ 0.05 1.5 1.44 0.03 0.03
08/15/18 00:08 08/15/18 04:36 RF (YN) 9.8 ‰ 1.1 ‰ 2.0 ‰ 0.98 5.5 4.90 0.20 0.18
08/15/18 05:52 08/15/18 07:12 RF (YN) 13.9 ‰ 3.0 ‰ 3.7 ‰ 1.99 11.7 10.70 0.19 0.17
08/15/18 19:59 08/16/18 09:19 RF (AN) 41.6 ‰ −2.2 ‰ −1.5 ‰ 0.15 5.9 5.78 0.03 0.03
08/16/18 15:56 08/16/18 17:51 RF (AD) 62.2 ‰ −2.7 ‰ −4.3 ‰ 0.39 6.5 6.03 0.07 0.06
08/16/18 21:22 08/17/18 06:25 RF (AN) 59.0 ‰ −6.7 ‰ 2.0 ‰ 0.42 15.6 15.34 0.03 0.03
08/17/18 08:28 08/17/18 10:31 RF (M) 51.7 ‰ −6.0 ‰ −2.6 ‰ 0.44 13.5 11.40 0.04 0.03
08/17/18 21:55 08/18/18 09:12 RF (AN) 63.5 ‰ −6.6 ‰ −1.1 ‰ 0.25 12.3 12.15 0.02 0.02
(b)
Start time End time Fire (smoke δ 18 O-HONO δ 15 N-HONO δ 15 N-NOx [HONO] [NO2 ] HONO / NO2
(MDT) (MDT) condition) ppbv ppbv
08/03/19 23:15:57 08/04/19 07:27:02 WF (AN) 44.6 ‰ −4.5 ‰ −3.9 ‰ 0.31 5.7 0.05
08/04/19 18:25:49 08/05/19 09:40:08 WF (AN) 49.7 ‰ −6.3 ‰ −4.3 ‰ 0.04 0.8 0.05
08/06/19 00:20:11 08/06/19 09:40:38 WF (YN) 16.3 ‰ −0.3 ‰ 1.8 ‰ 0.37 0.7 0.49
08/06/19 14:11:24 08/06/19 23:02:12 WF (M) 54.7 ‰ −6.1 ‰ −3.3 ‰ 0.60 4.0 0.15
08/06/19 23:47:43 08/07/19 09:44:16 WF (YN) 32.3 ‰ 2.2 ‰ 2.9 ‰ 0.18 2.2 0.08
08/09/19 12:32:42 08/09/19 14:56:34 Nethker (YD) 25.6 ‰ 3.4 ‰ 3.5 ‰ 2.49 20.4 0.12
08/10/19 21:07:49 08/11/19 01:47:41 Nethker (YN) 25.1 ‰ 2.2 ‰ 1.8 ‰ 1.23 2.3 0.54
08/12/19 03:24:15 08/12/19 11:24:47 Nethker (YN) 25.0 ‰ −0.6 ‰ 0.1 ‰ 1.69 3.5 0.48
08/13/19 21:38:03 08/14/19 01:28:27 Nethker (YN) 4.8 ‰ 5.3 ‰ 5.2 ‰ 0.85 4.1 0.21
08/15/19 20:05:55 08/15/19 22:43:35 Nethker (AN) 34.3 ‰ −4.8 ‰ −0.8 ‰ 1.01 3.4 0.30
08/15/19 22:57:07 08/16/19 06:28:04 Nethker (YN) 19.2 ‰ 0.7 ‰ 2.1 ‰ 0.85 1.3 0.64
the 2018 field campaign, the measurements were conducted move p-NO− 3 and a Nylasorb filter to remove HNO3 , fol-
under YN, YD, AN, AD and M conditions. lowed by two annular denuders, each coated with a pre-
mixed Na2 CO3 −glycerol−methanol−H2 O solution follow-
2.3 Collection of HONO, NOx and nitrate for isotopic ing a standard Environmental Protection Agency (EPA)
analysis method (Chai and Hastings, 2018). Within 24 h after each
collection, the coating was extracted in 10 mL of ultrapure
water (18.2 M) in two sequential 5 mL extractions. Particu-
Nitrogen oxides (NOx = NO + NO2 ), nitrous acid (HONO),
late nitrate on the upstream Millipore filters and HNO3 from
particulate nitrate (p-NO−3 ) and nitric acid (HNO3 ) were the Nylasorb filters, if there was any, were extracted by soni-
captured in the field using recently developed methods and
cating the filters in ∼ 30 mL ultrapure H2 O (18.2 M). Sam-
sent to Brown University for analyses of isotopic com-
ples with [NO− 3 ] >1 µM were analyzed for isotopic compo-
position (Chai et al., 2019; Fibiger and Hastings, 2016;
sition (concentration techniques detailed below).
Chai and Hastings, 2018; Fibiger et al., 2014). In brief,
The denuder-extracted solution with a pH of ∼ 10 was
HONO was completely captured at a pumping flow rate
frozen and transported to Brown University for concentration
of ∼ 10 L min−1 with an annular denuder system (ADS),
and isotopic analysis, which was completed within 2 months
comprised (in order) of a Teflon particulate filter to re-
https://doi.org/10.5194/acp-21-13077-2021 Atmos. Chem. Phys., 21, 13077–13098, 202113082 J. Chai et al.: Isotopic evidence for dominant secondary production of HONO
after the sampling. The timescales for sample extraction and troscopy, cavity-enhanced spectroscopy, and proton-transfer-
isotopic analysis preserve both the solution concentration reaction time-of-flight mass spectrometer. In the same work,
and isotopic composition of HONO in the form of nitrite the NOx concentrations collected in the permanganate im-
(Chai and Hastings, 2018). The two-denuder setup allows pinger were verified by real-time measurement with a chemi-
for the minimization of the interference for both concentra- luminescence NOx analyzer. In addition, our NOx collection
tion and isotopic analysis from other N-containing species technique has been verified with real-time NOx concentra-
that could be trapped and form nitrite in residual amounts on tions in on-road, near-road and urban background environ-
the denuders, especially NO2 . Note that HONO levels were ments (Wojtal et al., 2016; Miller et al., 2017). These agree-
above the minimum detection limit (0.07 µM in extraction so- ments verify complete capture of HONO and NOx associated
lution) and that the breakthrough amount of HONO threshold with biomass burning emissions using our techniques, which
is far from being reached given the concentrations (Table 1), preserve the isotopic signatures without isotopic fractiona-
flow rate (∼ 8 L min−1 ) and collection times. Isotopic analy- tion during the sampling process.
sis of nitrite required the collection of a minimum amount
of 10 nmol. NOx was completely collected in an imping- 2.4 Isotopic analysis
ing solution containing 0.25 M KMnO4 and 0.5 M NaOH
which oxidizes NO and NO2 to NO− The denitrifier method was used to complete nitrogen
3 by pumping sampled
air through a gas washing bottle at a flow rate of ∼ 4 L min−1 . (15 N / 14 N) and oxygen (18 O / 16 O) isotope analyses of sep-
Collection time for HONO ranged from 2 to 12 h and that for arate NO− 3 samples converted from NOx and NO2 sam-
−
NOx ranged from 0.75 to 2.5 h depending on their mixing ples converted from HONO by quantitative conversion to
ratios to make sure sufficient samples were captured against N2 O by denitrifying bacteria P. aureofaciens (Casciotti et
blanks for isotopic analysis (Fibiger et al., 2014; Fibiger and al., 2002; Sigman et al., 2001). The isotopic composition of
Hastings, 2016; Wojtal et al., 2016). Particulate filters and N2 O is then determined by a Thermo Finnigan Delta V Plus
Nylasorb filters were collected over 7–12 h due to the low isotope ratio mass spectrometer at m/z 44, 45 and 46 for
14 N14 N16 O, 14 N15 N16 O and 14 N14 N18 O, respectively. Sam-
concentration of particulate nitrate and HNO3 .
The samples from each collection system were retrieved ple analyses were corrected against replicate measurements
and processed following the procedures described in Chai et of the NO− 3 isotopic reference materials USGS34, USGS35
al. (2019). All treated samples from NOx , HONO, p-NO− and IAEA-NO-3 (Böhlke et al., 2003) and that of the NO− 2
3
and HNO3 collection and their corresponding blanks were isotopic reference materials N7373 and N10219. Precisions
analyzed offline for concentrations of NO− − for δ 15 N-NOx , δ 15 N-HONO and δ 18 O-HONO isotopic anal-
2 and NO3 with a
WestCo SmartChem 200 discrete analyzer colorimetric sys- ysis across each of the entire methods are ± 1.3 ‰, ± 0.6 ‰
tem. The reproducibility of the concentration measurements and ± 0.5 ‰, respectively (Chai and Hastings, 2018; Fibiger
was ± 0.3 µmol L−1 (1σ ) for NO− −1 for et al., 2014).
2 and ± 0.4 µmol L
NO− 3 when a sample was repeatedly measured (n = 30). A
detection limit of 0.07 µmol L−1 for NO− 2 and 0.1 µmol L −1
3 Results and discussion
for NO− 3 was determined, and no detectable nitrite or nitrate
was found in the blank denuder coating solution, whereas 3.1 Concentrations of HONO and NOx
blank NO− 3 concentrations of ∼ 5 µM are typical for the NOx
collection method (Fibiger et al., 2014; Wojtal et al., 2016). Among the three fires, increased HONO concentrations were
We only report the samples whose concentrations were at observed in young smoke during both night (0.2–2.0 ppbv)
least 30 % above NO− 3 present in the blank KMnO4 solu- and day (2.5 ppbv), while HONO level is significantly lower
tion upon purchase to avoid increasing the error associated in aged smoke during both night (0.06–1.0 ppbv) and day
with the isotopic composition (Fibiger et al., 2014). Note that (0.05–0.6 ppbv) as shown in Fig. 2a. Although median val-
NO− 3 concentration was measured on the ADS solutions to ues show young night and day are significantly higher than
verify whether and to what extent NO− 2 was oxidized to NO3
−
aged smoke day and night, there is significant overlap be-
on denuder walls because the denitrifier method will convert tween young nighttime and aged day and night for WF and
both NO− −
3 and NO2 to N2 O for isotopic analysis (see below). Nethker fires. These parts per billion volume to sub-parts per
Note that the complete collection of HONO and NOx have billion volume HONO concentrations can be a major OH
been verified in various environments including biomass source in areas that are impacted by wildfire. We also de-
burning emissions. During the FIREX fire lab experiment, termined the molar ratio HONO / NO2 from the concentra-
we applied the same method to quantify the HONO and tions for each sample (Fig. 3), and the values represent the
NOx isotopic composition (Chai et al., 2019). The concen- upper bound of [HONO] / [NOx ] (Table 1a). Median ratios
trations of HONO captured with our ADS compared well of [HONO] / [NO2 ] for the five smoke conditions are 0.35
with four other high-time-resolution concentration measure- (YN), 0.12 (YD), 0.07 (AN), 0.09 (AD) and 0.04 (MD). The
ment techniques, including mist chamber and ion chromatog- median ratios of [HONO] / [NO2 ] for the young smoke fall
raphy (MC/IC), open-path Fourier transform infrared spec- in the range of fresh emissions measured in the lab (0.13–
Atmos. Chem. Phys., 21, 13077–13098, 2021 https://doi.org/10.5194/acp-21-13077-2021J. Chai et al.: Isotopic evidence for dominant secondary production of HONO 13083
0.53) and the field (0.05–0.33) (Yokelson et al., 2009; Se-
limovic et al., 2020, and references therein). Our results
for YN are also in agreement with airborne measurements
(0.34 ± 0.08) from the BB-Flux campaign that occurred in
parallel with WE-CAN but are lower than the WE-CAN air-
borne observation of 0.72 ± 0.34 during the day (Theys et
al., 2020; Peng et al., 2020). It is worth noting that the ma-
jority of the WE-CAN airborne data overlap with the BB-
Flux results and our measurements, and Peng et al. (2020)
associate very high ratios with different transport dynamics
of fresh plumes. The concentration results for the ADS col-
lected [HONO] agree well with that measured via MC/IC
in real time and averaged over the ADS sampling periods
(Fig. S3). The good agreement between these techniques
sampling the same plumes near the ground and previous
agreement with other HONO and NOx observation methods
suggest the concentrations are accurate (see also Sect. 2.3).
It is important to also consider possible interference of per-
Figure 3. HONO / NO2 concentration ratio summarized in box-
oxyacetyl nitrate (PAN) with NOx collected in the alkaline whisker plot for each sampling condition. The red cross indicates
permanganate solution for biomass burning conditions (Jaffe an outlier. The whiskers from bottom to top represent 5 %, 25 %,
and Briggs, 2012). There is minimum PAN formed in fresh 50 %, 75 % and 95 % quartiles.
biomass burning (BB) emissions and young smoke of less
than half an hour, based upon previous lab and field measure-
ments, as well as modeling studies (Stockwell et al., 2014; ters from the fire, HONO levels may be maintained via sec-
Yokelson et al., 2009; Alvarado et al., 2010, 2015). In aged ondary chemistry due to the high particle loadings and other
BB plumes in the upper troposphere, PAN can form rapidly terrestrial surface reactions in wildfire plumes (Alvarado and
at low temperatures and act as a temporary NOx reservoir, Prinn, 2009). While the concentration data are valuable for
reaching a maximum PAN / NOy ratio of 0.3 (comparable to the ground-based setting near the fires, considerable uncer-
NOx / NOy ) within ∼ 2 to 4 h of aging after emission (Yokel- tainty exists in the rate coefficients of the heterogeneous pro-
son et al., 2009; Liu et al., 2016; Akagi et al., 2012). Though cesses in daytime, as well as the HONO and NO2 uptake co-
we note that these results are all from airborne measure- efficient and surface area densities (Appendix A). This makes
ments. There are no ground-level measurements for PAN in it challenging to quantify the relative contribution of each po-
BB plumes during WE-CAN or FIREX-AQ, nor from other tential pathway to the observed HONO budget.
field studies to the best of our knowledge. PAN is thermally
unstable in the boundary layer during summertime, and its 3.2 Isotopic signatures of HONO and NOx
main loss process in the atmosphere is thermal decomposi-
tion to release NO2 . The lifetime of PAN is on the order of In the 2016 FIREX fire laboratory experiment, we obtained
1 h or less at 20 ◦ C and above (Talukdar et al., 1995; Fischer δ 15 N of NOx and HONO, as well as δ 18 O of HONO, in
et al., 2010). We therefore expected PAN in near-ground air direct emissions from controlled burning of various vegeta-
to maintain low levels or less due to photochemistry and ther- tion biomasses representative of the western US (Chai et al.,
mal decomposition. Thus, given the short lifetime and the 2019). The lab-based δ 15 N and δ 18 O results serve as source
sample integration time of over 40 min to 2 h timescale, PAN signatures of biomass burning (BB) emissions: δ 15 N-NOx
is unlikely to interfere with our NOx results. (−4.3 ‰ to +7.0 ‰) and δ 15 N-HONO (−5.3 ‰ to +5.8 ‰)
In the aged smoke, [HONO] / [NO2 ] are greatly reduced are derived from biomass N and the transformation in the
to median values of 0.05 and 0.07 observed for AN and AD, combustion process, and δ 18 O-HONO (5.2 ‰ to 15.2 ‰) in-
respectively, lower than the lab-derived range (Fig. 3). Wild- corporates δ 18 O of molecular oxygen and water via combus-
fire plumes near ground level are expected to be more diluted tion reactions (Chai et al., 2019). In the field, we expect that
than those directly injected upwards during the day, and the once NOx and HONO are released and transported, atmo-
loss of HONO due to photolysis in the plume and/or sur- spheric processing including photochemistry and nighttime
face reactions would be expected to be much faster than that chemistry would cause the isotopic composition of emitted
in higher altitude dense plumes. The very low ratios indicate NOx and HONO to change.
that HONO was lost faster than NOx ; however, given the 10– By directly comparing the field-measured δ 18 O-HONO
20 min lifetime of HONO against photolysis during the day with that measured from lab-controlled burning, we sepa-
and up to a couple of hours during the night (Nie et al., 2015), rate the data observed in young smoke from those in aged
and considering aged smoke was sampled tens of kilome- smoke. Very young smoke largely reflects fresh wildfire
https://doi.org/10.5194/acp-21-13077-2021 Atmos. Chem. Phys., 21, 13077–13098, 202113084 J. Chai et al.: Isotopic evidence for dominant secondary production of HONO emissions without significant atmospheric processing, while manganate solution. In this case, we would expect that aged aged smoke δ 18 O-HONO should deviate from the lab val- smoke would not shift from the δ 15 N-NOx range of young ues due to the influence of secondary chemistry involving smoke because δ 15 N shifts in both PAN and NOx could off- RN cycling. The δ 18 O-HONO of young nighttime smoke set each other. However, our observed δ 15 N-NOx mean val- ranged from 4.8 ‰ to 32.3 ‰ with a median value of 19.0 ‰, ues for both aged daytime and nighttime smoke are signifi- while the value in a single young daytime sample was 25.6 ‰ cantly (p0.5) (Chai et al., 2019; Fibiger and Hastings, bination of more negative δ 15 N-HONO values and elevated 2016). This consistency suggests δ 15 N is a reliable tracker δ 18 O-HONO indicate secondary production of HONO. We generally for BB-derived NOx and HONO, although there next explore quantitative use of δ 15 N-NOx , δ 15 N-HONO and is clear variability between the different smoke conditions δ 18 O-HONO to understand the isotopic shifts in terms of sec- that can refine our understanding of reactive N cycling. We ondary chemistry involving RN cycling. note again that, although no near-ground PAN measurements in BB plumes are available, the isotopic results also suggest 3.3 Isotopic mass balance modeling that PAN interference is not important to the δ 15 N-NOx re- sults. For aged smoke, we would expect δ 15 N-NOx to de- In aged smoke, the observed δ 18 O-HONO enhancement and crease from that in fresh emissions due to partial transforma- shift of δ 15 N values away from the δ 15 N NOx –HONO line, tion of NOx to additional oxidized N products (e.g., PAN), as a result of RN cycling, would be expected to be de- as well as isotopic exchange between NOx and these oxi- rived from the integrated kinetic isotopic fractionation (ex- dized species; both processes will leave 15 N depleted in NOx pressed as enrichment factor 18 ε and 15 ε) associated with and 15 N enriched in PAN (Walters and Michalski, 2015). If each of the loss/production processes (Fig. 1) weighted by PAN existed at significant concentrations that were (1) com- their relative contribution to the budget. By definition, ε = parable with NOx in the atmosphere and (2) completely col- (α − 1) × 1000 ‰, with fractionation factor α referring to lected in the permanganate solution, then the δ 15 N would re- the rate coefficient ratio between the heavy isotopologue and flect the overall δ 15 N of NOx + PAN in the final reduced per- the light isotopologue. For δ 18 O-HONO, we also took into Atmos. Chem. Phys., 21, 13077–13098, 2021 https://doi.org/10.5194/acp-21-13077-2021
J. Chai et al.: Isotopic evidence for dominant secondary production of HONO 13085
none of these key parameters are currently available in the
literature (Appendix B).
X
1δ 15 NHONO−NOx = i,L
f i,L × 1δ 15
N i,L
X
15
+ i,P
f i,P × 1δ N i,P (1)
X
δ 18 O−HONO = i,L
fi,L ×18 εi,L
X
18
+ i,P
f i,P × 1δ O−HONO i,P (2)
1δ 18 O − HONOi,P = δ 18 Oi,t + 18 εi,P (3)
3.3.1 Modeling of δ 15 N of HONO and NOx in aged
daytime and nighttime smoke
We first simulated 1δ 15 NHONO−NOx for both daytime and
nighttime aged conditions using this model. According to the
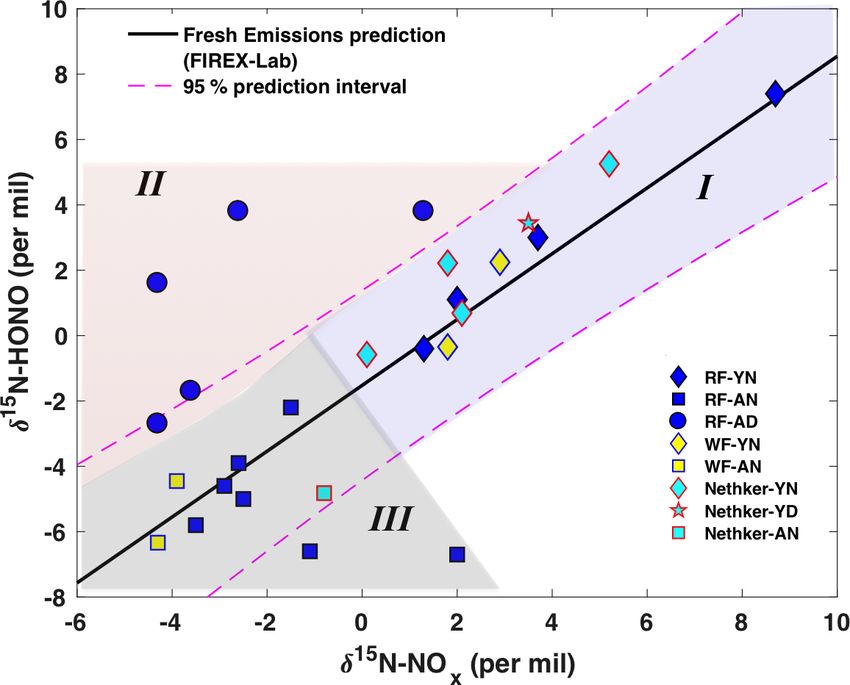
Figure 4. Relationship between wildfire-derived δ 15 N-HONO and potential HONO–NOx chemistry in ground areas impacted
δ 15 N-NOx . Samples from plumes of three wildfires including Rab- by wildfire smoke plumes (Fig. 1), HONO is expected to be
bit Foot fire (RF; 2018), Williams Flats fire (WF; 2019) and Nethker predominantly lost to photolysis (Reaction R1) during the
fire (2019) are shown as different colors. Different symbols indicate day. It is well known that HONO can be produced via a
different smoke conditions including young nighttime smoke (YN), gas-phase radical recombination reaction between NO and
young daytime smoke (YD), aged nighttime smoke (AN) and aged OH (Reaction R2) (Platt et al., 1980). However, the rate of
daytime smoke (AD). Note that the mixed smoke samples displayed Reaction (R2), calculated from the rate coefficient, the typ-
in Fig. 2 are not shown here due to their large uncertainty. The ical daytime OH concentration (1–2 × 10⁶ molecule cm−3 )
solid black line (δ 15 N-HONO = 1.01δ 15 N-NOx −1.52; R 2 = 0.89,
(de Gouw et al., 2006) in biomass burning plumes and our
p13086 J. Chai et al.: Isotopic evidence for dominant secondary production of HONO addition to gas-phase OH + NO (Reaction R2) to produce HONO. As 15 ε2 has a positive value, a larger Reaction (R2) contribution leads to higher 1δ 15 NHONO−NOx . With mech- anism M2 (dashed line in Fig. 5), nitrate photolysis (Reac- tion R4) is included in addition to Reactions (R2) and (R3) in the HONO production mechanism. Taking the contribu- tion of Reaction (R2) of 10 % as a constant, three scenar- ios were modeled by varying the relative contribution of Reaction (R3) (75 %–85 %) and Reaction (R4) (5 %–15 %). The results suggest larger Reaction (R4) contribution yields lower 1δ 15 NHONO−NOx due to severe 15 N depletion associ- ated with nitrate photolysis (15 ε4 ≤ −47.9 ‰) (Appendix B). Importantly, the addition of Reaction (R4) in M2 also lowers 1δ 15 NHONO−NOx compared to M1. By applying the field- observed 1δ 15 NHONO−NOx for the aged daytime smoke to the model, we solved frp for all scenarios and plotted these as circles in Fig. 5. All five aged daytime datasets from RF can be reproduced by M1 under all three scenarios; by contrast, Figure 5. Modeling results of δ 15 N for aged daytime smoke via two via M2, none of the three scenarios can explain the two high- plausible mechanisms (M1 and M2) for secondary HONO produc- est 1δ 15 NHONO−NOx values observed in the field. As such, tion. The isotope mass balance model (Eq. 1) is used to simulate the we conclude that Reaction (R4) plays a minor role (
J. Chai et al.: Isotopic evidence for dominant secondary production of HONO                                                             13087

tionation associated with photochemical gas-phase O3 for-
mation (Thiemens, 2006), while OH and RO2 have very low
δ 18 O values (Thiemens, 2006). O3 participation in reactive N
cycling involving NOx (Reaction R8) results in high δ 18 O of
NO2 (Michalski et al., 2003; Walters et al., 2018). In pseudo-
photochemical steady state, NO and NO2 are expected to
have similar δ 18 O which is a result of competition between
O3 and RO2 oxidation (Reactions R8–R10), expressed as
fONO3 /(O3 +RO2 )
                  via Eqs. (4) and (5) below.

NO + O3 → NO2 + O2                                                 (R8)
NO + HO2 /RO2 → NO2 + HO/RO                                       (R9a)
        → HONO2 /RONO2 (5 %)                                     (R9b)
NO2 + hν + O2 → NO + O3                                          (R10)

δ 18 O−NO ≈ δ 18 O−NO2 = fONO                × δ 18 O−O3                    Figure 6. Model prediction of fraction of NO oxidized to NO2
                               3 /(O3 +RO2 )                                via O3 to that via O3 and RO2 together (fONO/(O +RO ) ) on the
                                                                                                                        3    3    2
          + 1 − fONO
                   3 /(O3 +RO2 )   × δ 18 O−RO2                      (4)    basis of field-measured δ 18 O-HONO for aged daytime (a) and
                                                                            nighttime (b) smoke. During the day (a), the contribution of Re-
                             kNO+O3 [O3 ]
fONO
   3 /(O3 +RO2 )
                 =                                                   (5)    action (R2) to HONO production is varied from 5 % to 15 % fol-
                     kNO+O3 [O3 ] + kNO+RO2 [RO2 ]                          lowing M1 in Fig. 5, and Reaction (R3) accounts for the remaining
                                                                            secondary HONO contribution. The modeling results are shown in
The δ 18 O signature is subsequently passed to HONO when it                 Fig. S5 and Table S3 in the Supplement. During the night (b), three
is produced from NO (Reaction R2) and NO2 (Reaction R3)                     scenarios with various contributions of Reactions (R6) and (R7) are
during the day and from NO2 (Reactions R6 and R7) during                    modeled (Fig. S6 and Table S4). fONO/(O +RO ) is predicted to be
the night, and thus δ 18 O-HONO is a positive linear function                                                   3    3    2
                                                                            over unity for the last four observed δ 18 O-HONO values if Reac-
of fONO 3 /(O3 +RO2 )
                      if kinetic isotopic fractionation (18 ε) associ-      tion (R6) is assumed as the only nighttime pathway.
ated with these processes are fixed values (as calculated in
Appendix B). Given that HONO is predominantly produced
via Reactions (R2) and (R3) in aged daytime smoke (Fig. 5),                 pathways for HONO production by varying the relative con-
δ 18 O-HONO was simulated following the three M1 scenar-                    tribution between the two pathways and comparing it to the
ios with the contribution of Reaction (R2) varying from 5 %                 observed δ 18 O-HONO (Fig. 6b). If HONO is constrained to
to 15 %. All three scenarios reproduced the range of our field              exclusively form via Reaction (R6) (surface hydrolysis), the
results for aged daytime smoke, further pointing to M1 as ex-               model would require an unrealistic fONO                   >100 % to
                                                                                                                        3 /(O3 +RO2 )
plaining the HONO in this environment. In addition, the vari-
                                                                            explain δ 18 O-HONO >55 ‰. Even for samples with lower
ation in δ 18 O was driven by differing oxidation that is deter-
                                                                            δ 18 O-HONO values (34 ‰ to 52 ‰), the high branching ra-
mined by fONO                  , which depends on the relative con-
                 3 /(O3 +RO2 )                                              tio fONO3 /(O3 +RO2 )
                                                                                                  (>0.6) required to create such large en-
centration of O3 to RO2 (Figs. S5 and S6). The fONO         3 /(O3 +RO2 )   richment is unrealistic for BB environments. In particular,
corresponding to each observed δ 18 O-HONO were solved                      [O3 ] / [RO2 ] converted from fONO 3 /(O3 +RO2 )
                                                                                                                             solved under this
and plotted in Fig. 6a. We found fONO       3 /(O3 +RO2 )
                                                          decreased by      mechanism is at least twice as large as values derived from
less than 0.02 as the contribution of Reaction (R2) to to-                  the previous field measurement of aged wildfire smoke (Bay-
tal HONO production decreased from 15 % to 5 %. On the                      lon et al., 2018). By contrast, the inclusion of Reaction (R7)
other hand, δ 18 O-HONO changes sensitively with varying                    in addition to Reaction (R6) in rate ratios 3 : 1 and 20 : 1
fONO3 /(O3 +RO2 )
                  , increasing from 50.2 ‰ to 78.0 ‰ as the frac-           based on previous lab studies (Kebede et al., 2016; Scharko
tion of NO oxidized by O3 rather than RO2 increases from                    et al., 2017) can elevate the modeled δ 18 O-HONO and ex-
0.34 to 0.65.                                                               plain all observed δ 18 O-HONO values. This suggests NO2 -
   The δ 18 O-HONO of nighttime aged smoke was modeled                      to-HONO heterogeneous conversion catalyzed by surface-
following the nighttime chemistry (Reactions R5–R7), i.e.,                  hosted iron oxides and quinone (Reaction R7) in the night-
taking NO2 conversion as the source and surface uptake as                   time aged smoke proceeds significantly faster than NO2 hy-
the sink. In areas impacted by nighttime aged smoke, HONO                   drolysis (Reaction R6). Our isotopic analyses provide evi-
forms from wildfire-derived NO2 residing in the nocturnal                   dence for the participation of such a pathway in BB envi-
boundary layer. As the two pathways (Reactions R6 and                       ronments and also shows the capability to constrain the rela-
R7) for heterogeneous NO2 conversion lead to very differ-                   tive importance between these two pathways. Although the
ent δ 18 O-HONO stemming from different δ 18 O transfer (Ap-                daytime δ 18 O-HONO can be larger than that of nighttime
pendix B), we examined the relative importance of the two                   aged smoke, similar [O3 ] / [RO2 ] ratios are derived from our

https://doi.org/10.5194/acp-21-13077-2021                                                  Atmos. Chem. Phys., 21, 13077–13098, 2021
13088 J. Chai et al.: Isotopic evidence for dominant secondary production of HONO
solved fONO
3 /(O3 +RO2 )
and are consistent with the limited field
measurements (Parrington et al., 2013; Baylon et al., 2018),
and they further indicate the important role peroxy radicals
play as an oxidant in wildfire-smoke-impacted environments.
4 Conclusions
As wildfire has enormously impacted climate, air quality and
ecosystems in the past and is expected to worsen (Wester-
ling, 2016), accurately tracking wildfire-derived reactive ni-
trogen species (i.e., NOx and HONO) and their cycling is
extremely important for quantifying and mitigating key pol-
lutants such as O3 in wildfire-impacted areas both close to
the fire and thousands of kilometers downwind. We show
δ 15 N-HONO and δ 15 N-NOx can serve as a powerful tool to
track BB sources and constrain secondary HONO production
pathways. With the help of field-observed δ 18 O-HONO, we
grouped our measured relationship between the δ 15 N-HONO
and δ 15 N-NOx into three different regimes, which clearly
distinguish between young wildfire plumes, aged daytime
plumes and aged nighttime plumes. The δ 15 N results allow
for constraining the daytime HONO budget and particularly
secondary production mechanisms via the isotope mass bal-
ance simulation. The use of excess δ 15 N (1δ 15 NHONO−NOx )
also provides an approach for constraining HONO budgets
in other environmental settings, such as urban ambient ar-
eas and remote areas including forest and polar regions. Fur-
thermore, by combining δ 15 N emission source signatures
and chemical fractionation characteristics, we could poten-
tially track the impact and relative role of wildfire-derived
reactive nitrogen more extensively when the plume transfers
thousands of kilometers downwind and mixes with other air
such as urban plumes. In addition, the δ 18 O-HONO results
not only offer direct evidence for secondary production of
HONO that allows for the determination of the NO oxidiz-
ing branching ratio between O3 and RO2 but also constrains
nighttime HONO production mechanisms. We expect to ap-
ply the δ 18 O-HONO approach to a variety of atmospheric
settings for constraining the HONO budget and its cycling
with other reactive nitrogen species, as well as O3 . As such,
online isotopic measurement techniques with higher time
resolution will benefit the use of stable isotopes and broaden
its application in atmospheric chemistry. In the meantime, in
order to more accurately quantify the relative contribution of
these potential pathways, further experimental and theoreti-
cal investigations on isotopic fractionation characteristics of
each pathway under various environmental conditions are re-
quired.
Atmos. Chem. Phys., 21, 13077–13098, 2021 https://doi.org/10.5194/acp-21-13077-2021J. Chai et al.: Isotopic evidence for dominant secondary production of HONO 13089
Appendix A: Overview of HONO budget quantification Donaldson, 2016, 2013). The p-NO− 3 and surface-adsorbed
under different conditions based upon concentrations HNO3 were found to be photolyzed with rate coefficients
2–3 orders of magnitude larger than gas-phase HNO3 and
A common approach to quantitatively understand the possess lifetimes as short as a few hours (Ye et al., 2017).
wildfire-derived HONO budget – its direct emissions, sec- However, the rate coefficient of Reaction (R4) is poorly con-
ondary productions and sinks – is to use concentration-based strained. Not only have the branching ratios between the
mass balance calculation. Ideally, if we know the rate coeffi- NOx -producing channel and HONO-forming channel been
cients and reactant concentrations for each of the pathways, poorly known (Baergen and Donaldson, 2016), but previous
we would be able to quantify the relative contribution of each laboratory-measured nitrate photolysis rate coefficients also
pathway to the total HONO concentration measured in the vary by up to 3 orders of magnitude (Ye et al., 2017). The
field under the assumption of pseudo-steady-state approxi- uncertainty is even greater because it is complicated by de-
mation (PSSA) as described in Eq. (A1), where Remission , pendence on relative humidity, particle composition and pH.
Rproduction and Rloss are rate of emission, production and loss, During the night, HONO is primarily lost to uptake on sur-
respectively. In aged smoke, we expect HONO is almost ex- faces including aerosols and soils, and the uptake coefficient
clusively produced from secondary formation. During the can be expressed by Eq. (A3).
day, HONO is predominantly lost to photolysis with a co-
efficient depending on solar zenith angle differing with time uptake
LHONO = 0.25 × γHONO × ωHONO × S/V × 100 (A3)
of the day, while one or more reactions of Reactions (R2)–
(R4) may be responsible for producing HONO. Under PSSA, In this equation, ωHONO is the mean thermal
√ HONO molec-
using the well quantified rate coefficient k2 , observed NO ular velocity calculated by ωHONO = 8RT /π M, where
and HONO concentrations, estimated OH concentration, and R, T and M are the gas constant, absolute temperature
TUV-model-calculated (tropospheric ultraviolet and visible) and molecular weight. S/V is the surface-to-volume ratio
HONO photolysis coefficient jHONO , we estimated the ratio (cm2 cm−3 ). The uptake coefficient γHONO was measured to
of Reaction (R2) to the total HONO production (POH+NO ) be 10−5 for soil surface and in the range of 10−5 –10−3 for
via Eq. (A2) and found Reaction (R2) can only contribute aerosol particle surface (Donaldson et al., 2014b; Wong et
2 %–15 % (Table A1) of the total HONO production under al., 2012). In addition, OH + HONO occurs at rates 1–2 or-
the ambient conditions when the five aged daytime samples ders of magnitude smaller than the uptake and therefore plays
were collected. This suggests at least 85 % of HONO was a minor role. The combined loss processes lead to a HONO
produced from heterogeneous HONO formation via Reac- lifetime of about 4 h during the night.
tion (R3) and/or Reaction (R4). HONO is generally assumed to be produced via hetero-
d[HONO] geneous NO2 hydrolysis disproportionation (Reaction R6)
= Remission + Rproduction − Rloss ≈ 0 (A1) (Finlayson-Pitts et al., 2003), and the production rate of
dt
HONO is estimated by Eq. (A4), expressed in the unit of
k2 [OH] [NO]
POH+NO = (A2) ppbv-HONO ppbv−1 -NO2 s−1 .
jHONO [HONO]
night surface
HONO production from photo-enhanced NO2 conversion PHONO = 0.5 × RNO 2 →HONO
has been proposed to take place on various types of surfaces.
hν = 0.5 × γNO2 × ωNO2 × S/V × 100, (A4)
However, the uptake coefficient (γNO 2 →HONO
), which indi-
cates the probability of NO2 collisions with a surface that where ωNO2 is the mean NO2 molecular velocity, and S/V
results in the formation of a HONO molecule, varies by at is the surface-to-volume ratio of particles, which could range
least 3 orders of magnitude depending on the specific type of from 9.0 × 10⁻⁶ to 3.0 × 10⁻⁴ cm2 cm−3 for normally pol-
hν
surface materials. For instance, γNO on soot particles
2 →HONO luted areas and highly polluted areas, respectively (Spataro
was found to range from 3.7 × 10⁻⁴ to 1.1 × 10⁻³ s−1 (Am- and Ianniello, 2014). The S/V in biomass burning smoke
mann et al., 1998), while that on surfaces comprised of hu- plumes has huge uncertainty; additionally, ground surface is
mic acid was measured as 2–8×10⁻⁵ s−1 in several lab stud- also expected to play an important role in nighttime HONO
ies (Stemmler et al., 2006; Scharko et al., 2017). The latter production given our ground sampling location (Tuite et al.,
is consistent with daytime modeling results of 6 × 10⁻⁵ s−1 2021; Scharko et al., 2017; Kebede et al., 2016; Stemmler et
(Wong et al., 2013). Additionally, a much smaller (10−7 – al., 2006); however, its S/V is not well defined/quantified.
hν
10−6 s−1 ) γNO value was obtained for metal oxide
2 →HONO
Overall, considerable uncertainty remains regarding the
surfaces such as TiO2 and SiO2 (Ndour et al., 2008). rate coefficient of the heterogeneous processes in the day-
Daytime photolysis of nitrate (HNO3 and pNO− 3 ) via Re- time, as well as the HONO and NO2 uptake coefficients and
action (R4) has also been proposed as an important renoxi- S/V ratio. This uncertainty, complicated further with large
fication pathway that produces HONO and NO2 in low NOx variability in fire behavior and emissions, make the HONO
remote environments (Zhou et al., 2011), as well as high budget quantification extremely challenging.
NOx urban settings with abundant urban grime (Baergen and
https://doi.org/10.5194/acp-21-13077-2021 Atmos. Chem. Phys., 21, 13077–13098, 202113090 J. Chai et al.: Isotopic evidence for dominant secondary production of HONO
Table A1. HONO budget estimation.
[OH] = 1 × 10⁶ [OH] = 2 × 10⁶
molecule cm−3 molecule cm−3
Start time Stop time [HONO] [NO] [NO2 ] jHONO k[OH] POH+NO / k[OH] POH+NO /
(MDT) (MDT) ppbv ppbv ppbv s−1 s−1 LHONO s−1 LHONO
08/16/18 15:56 08/16/18 17:51 0.39 0.51 6.03 1.2 × 10⁻³ 1.2 × 10⁻⁵ 0.01 2.4 × 10⁻⁵ 0.03
08/09/18 15:38 08/09/18 19:10 0.06 0.41 1.42 1.1 × 10⁻³ 1.2 × 10⁻⁵ 0.08 2.4 × 10⁻⁵ 0.15
08/14/18 10:38 08/14/18 17:18 0.24 0.22 1.56 1.4 × 10⁻³ 1.2 × 10⁻⁵ 0.01 2.4 × 10⁻⁵ 0.02
08/14/18 17:22 08/14/18 20:11 0.05 0.07 1.44 6.1 × 10⁻³ 1.2 × 10⁻⁵ 0.03 2.4 × 10⁻⁵ 0.06
08/10/18 09:50 08/10/18 20:26 0.20 0.22 1.30 1.1 × 10⁻³ 1.2 × 10⁻⁵ 0.01 2.4 × 10⁻⁵ 0.02
Note: LHONO = jHONO [HONO].
Atmos. Chem. Phys., 21, 13077–13098, 2021 https://doi.org/10.5194/acp-21-13077-2021J. Chai et al.: Isotopic evidence for dominant secondary production of HONO 13091
Appendix B: Quantification of isotopic fractionation
factor
B1 Nighttime processes
B1.1 Isotopic fractionation of N and O associated with
nighttime uptake
Surface uptake is the major sink for HONO during the night.
Surface uptake of HONO has been found to be kinetically
limited by bulk diffusion in particles containing viscous
organic-water matrices, and it incorporates two simultane-
ous processes: (1) reactive uptake of HONO on the bare par-
ticle/mineral surface and (2) accommodation and reaction
of HONO in the bulk aqueous layer that is affected by pH
and diffusion in the organic-water matrix (Donaldson et al.,
2014b). The uptake coefficient of HONO is determined by
the competition between these two processes as a function
Figure B1. Absorption wavelengths shift for HO15 NO, H18 ONO
of fraction of water coverage on the surfaces, θH2 O , rang- and HON18 O compared with the most abundant form of HONO
ing from 0 to 1 in Eq. (B1), where γ0 and γ1 are the reac- (H16 O14 N16 O). The spectra of HO15 NO, trans-H18 ONO and
tive uptake coefficients of HONO onto particle (mineral/soil) trans-HON18 O are blue shifted 0.23–0.43, 0.21–0.39 and 0.25–
surfaces at dry (θH2 O = 0) and wet (θH2 O = 1) conditions, re- 0.46 nm, respectively, spanning 293–398 nm. Note that the blue
spectively. Under completely dry conditions (θH2 O = 0 or rel- shift illustrated here is 2 nm (larger than the actual shift) in order
ative humidity (RH) = 0 %), the former process is dominant, to demonstrate the shift clearly.
and the isotopic fractionation can be estimated by the ratio of
the square root of inverse mass, which is caused by different γ1 × ωHONO
thermal velocities (ωHONO ) of two isotopologues following ku-HONO ∝ (B5)
4
Eq. (B2), where R is the gas constant, T is absolute temper-
ature, and M is the molecular weight. Thus, heavier isotopes Taking the previously measured HONO γ1 of 2 × 10⁻⁵
are depleted in HONO, resulting in −10 ‰ and −20 ‰ for as that for the light isotopologue and α of 5.8 × 10⁻⁵ as a
15 ε and 18 ε, respectively. By contrast, under wet conditions
constant (Donaldson et al., 2014b), 0b (H16 O14 N16 O) is cal-
when RH is 30 % which results in a monolayer water cover- culated to be 1.36 × 10⁻⁵ following Eq. (B3). As derived
age on particle surfaces (θH2 O = 1), the aqueous layer uptake from Eqs. (B2) and (B4), 0b ratio between two isotopo-
becomes dominant, and the wet uptake coefficient γ1 can be logues equals the ratio between the two molecular weights,
mechanistically simulated with a resistor model simplified as and therefore 0b (H16 O15 N16 O) and 0b (H16 O15 N16 O) were
Eq. (B3) (Hanson, 1997; Pöschl et al., 2007). In Eq. (B3), α calculated and used to derive the corresponding γ1 val-
is the accommodation coefficient describing the probability ues. The fractionation factor associated with HONO uptake
that a HONO molecule striking a water-coated particle en- (αu-HONO ), defined as the ratio between heavy and light rate
ters into the bulk liquid phase, and 0b is the solubility of coefficients (kH /kL ), was calculated following the relation-
HONO in the bulk water in the particles or soils. 0b can be ship determined by Eq. (B5). On the basis of this model, we
calculated with Eq. (B4), where Da is the apparent diffusion estimate that the isotopic fractionation associated with the
coefficient of HONO in the particle–water (soil (organics)– wet uptake process is −2 ‰ and −4 ‰ for 15 ε and 18 ε, re-
water) matrix, and τ is the exposure time. Heff is the effective spectively. From our calculation, RH clearly influences iso-
Henry’s law constant that depends on the absolute Henry’s topic fractionation in the range of 0 %–30 %, with the wet up-
law constant for HONO, pH, and acid dissociation constants take of HONO favoring a smaller kinetic isotope effect than
for HONO (Ka1 ) and H2 NO+ 2 (Ka2 ). dry uptake.
γHONO = 1 − θH2 O γ0 + θH2 O γ1 (B1) B1.2 Isotopic fractionation of N and O associated with
r
8RT each nighttime HONO production pathway
ωHONO = (B2)
πM Heterogeneous conversion of NO2 to HONO has been widely
1 1 −1 accepted as the major secondary HONO production source
γ1 = ( + ) (B3)
α 0b during the night. However, the mechanism via which the
r
4Heff RT Da conversion occurs remains disputed. Additionally, the kinetic
0b = (B4) isotopic fractionation factor (KIF) associated with this pro-
ωHONO π τ
https://doi.org/10.5194/acp-21-13077-2021 Atmos. Chem. Phys., 21, 13077–13098, 2021You can also read


