The Next Level SUSTAINABILITY REPORT 2017 - netdna-ssl.com
←
→
Page content transcription
If your browser does not render page correctly, please read the page content below
UOL    1
                        SUSTAINABILITY
                           REPORT 2017

The Next Level
 SUSTAINABILITY REPORT 2017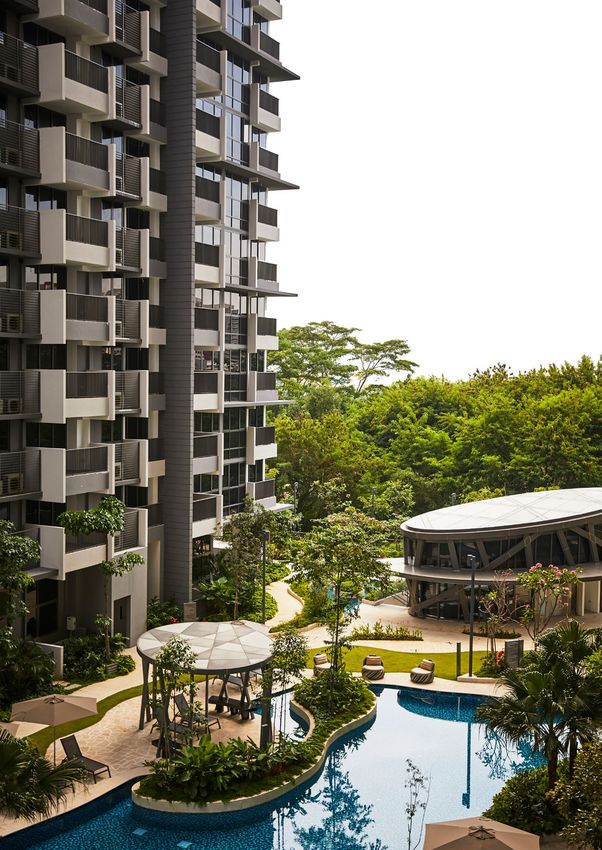
2    UOL
     SUSTAINABILITY
     REPORT 2017

    C ON T E N T S

    03     ABOUT US
    04.    ABOUT THIS REPORT

    GROW IN G R E SP O N S I B L Y

    06.    GROUP CHIEF EXECUTIVE STATEMENT
    10.    2017 HIGHLIGHTS
    12.    SUSTAINABLE DEVELOPMENT GOALS
    15.    FIVE-YEAR PERFOMANCE OVERVIEW
    16.    ECONOMIC PERFORMANCE

    SEEI NG R E SU L T S

    18.    PRODUCT AND SERVICE QUALITY
    23.    ENVIRONMENT

    TOUC HIN G L IV E S

    28.    HEALTH AND SAFETY
    32.    PEOPLE
    38.    COMMUNITY
    40.    AWARDS AND ACCOLADES
    42.    APPENDIX A: SUPPLEMENTARY
           SUSTAINABILITY DATA
    51.    APPENDIX B: NOTES FOR SUSTAINABILITY
           PERFORMANCE DATA
    54.    APPENDIX C: RESTATEMENTS
    58.    APPENDIX D: GRI CONTENT INDEX
    67.    INDEPENDENT LIMITED ASSURANCE REPORT

           Cover & this page: Riverbank@Fernvale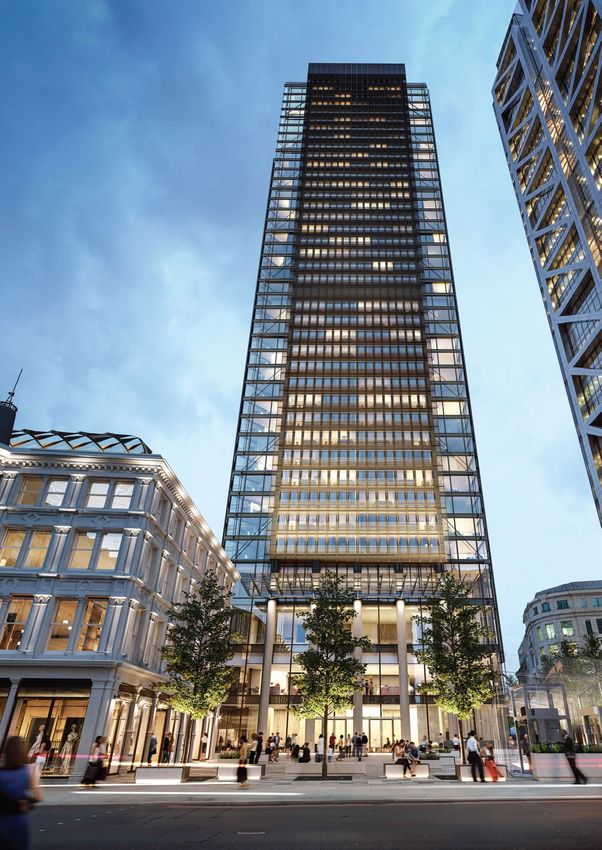
UOL    03
                                                            SUSTAINABILITY
                                                               REPORT 2017

V I SI O N                           CORE VALUES
A robust property                    Passion Drives Us
and hospitality group                Innovation Defines Us
dedicated to creating                Enterprise Propels Us
value, shaping future.               Corporate Social Responsibility
                                     Shapes Us
MI SSI O N                           People, Our Leading Asset
Driving Inspirations,
Fulfilling Aspirations.

ABOUT US

UOL Group Limited (UOL) is one of Singapore’s leading public-listed
property companies with an extensive portfolio of development
and investment properties, hotels and serviced suites.

With a track record of over 50 years, UOL strongly believes in
delivering product excellence and quality service in all our
business ventures.

Our list of property development projects includes residential units,
office towers and shopping malls, hotels and serviced suites.

Our unwavering commitment to architectural and quality excellence
is reflected in all our developments, winning us prestigious prizes
such as the FIABCI Prix d’Excellence Award, Aga Khan Award
for Architecture, Urban Land Institute Awards for Excellence and
President’s Design Award.

UOL, through our hotel subsidiary Pan Pacific Hotels Group Limited
(PPHG), owns two acclaimed brands namely “Pan Pacific” and
PARKROYAL. PPHG now owns and/or manages over 30 hotels in Asia,
Oceania and North America with over 10,000 rooms in its portfolio.

UOL values and recognises our people as the leading asset. The culture
of competitiveness, commitment, competency, creativity, collaboration
and caring shapes our people and drives the company forward.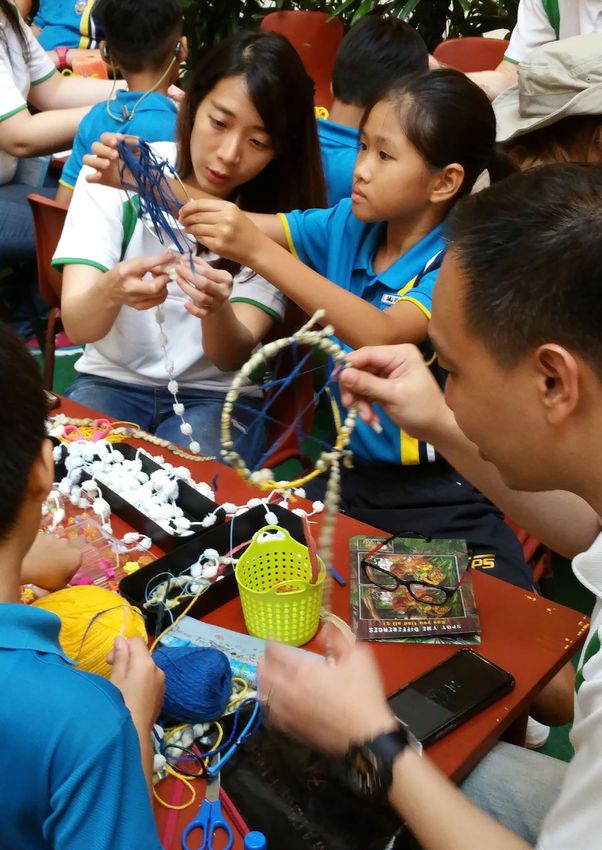
04       UOL
         SUSTAINABILITY
         REPORT 2017

                                           ABOUT THIS REPORT

                          Our approach for sustainability is described on our website
                          https://www.uol.com.sg/sustainability/our-approach. This report focuses on
                          performance data and commentary of our material environmental, social and
                          governance issues for the period 1 January to 31 December 2017. The report
                          is published annually, and is UOL’s fifth sustainability report. Our sustainability
                          report for FY2016 was published on 31 May 2017.

                          This report has been prepared in accordance with the Global Reporting
                          Initiative (GRI) Standards: Core option, and includes consideration of the GRI
                          Construction and Real Estate Sector Disclosures. The report also complies
                          with requirements of the Singapore Exchange Securities Trading Limited
                          (SGX-ST) Listing Rules Practice Note 7.6 Sustainability Reporting Guide.
                          Definitions and source of data measurements are indicated in Appendix B.

                          The report covers the property development and property investments
                          businesses, as well as hotel operations in Singapore, excluding those arising
                          from the accounting of United Industrial Corporation Limited (“UIC”) as
                          a subsidiary. Assets and revenue from operations covered in the report
                          comprise approximately 57% of the Group’s total assets and 58% of the
                          Group’s total revenue respectively as at 31 December 20171. The coverage
                          had decreased compared to FY2016 due to the consolidation of UIC’s
                          figures into the annual report. UIC reports on sustainability separately at
                          http://www.uic.com.sg/investor-relations/sustainability-report, and meets
                          both SGX and GRI requirements. We intend to expand our scope of
                          reporting to include our overseas operations when an operation significantly
                          contributes to our assets or profit i.e. more than 10%.

                          We engaged KPMG to perform limited assurance using SSAE 3000 for review
                          of our performance data for material aspects reported, alignment with SGX
                          Sustainability Reporting requirements under Listing Rules 711A and 711B
                          and the GRI Standards: Core option. The assurance statement can be found
                          on page 67 of this report.

                          We welcome your feedback to help us improve our performance in
                          sustainability and meet stakeholder’s expectations. Please send your feedback
                          to Mr Tan Kian Siew, Deputy General Manager (Corporate Affairs), Chairman
                          of the Sustainability Coordinating Committee, at sustainability@uol.com.sg.

                          No hard copies of this report have been printed as part of our efforts to
                          promote environmental conservation.
     1
         102-45
UOL    05
                                                                                       SUSTAINABILITY
                                                                                          REPORT 2017

         UOL GROUP SUSTAINABILITY
          GOVERNANCE STRUCTURE
 As a property company with a strong legacy, we are committed to our vision
 of creating value, shaping future by conducting our business operations
 in a manner that practises high standards of corporate governance, and
 considers the environmental and social impact to sustain profitable growth.
 Our governance structure of sustainability permeates functions and
 seniority, ensuring that sustainability is integrated at both strategic and
 operational levels.

 The principal responsibilities of the Board include reviewing UOL’s strategic
 business plans, taking into account sustainability (environmental, social and
 governance) issues. Since 2016, the Board oversees the monitoring and
 management of key material issues and their performance indicators, and
 approves the annual sustainability report. The Board is supported by the
 Sustainability Steering Committee and Sustainability Coordinating Committee.

                                     UOL GROUP

                                   Board of Directors

                                     UOL GROUP

                          Sustainability Steering Committee
                    Chairman: Deputy Group Chief Executive Officer

                                     UOL GROUP

                       Sustainability Coordinating Committee
                 Chairman: Deputy General Manager (Corporate Affairs)

          PROPERTY                                              HOSPITALITY

Sustainability Working Committee                        Sustainability Working Committee
Chairman: Deputy General Manager                            Chairman: Vice-President,
        (Corporate Affairs)                             Operations Support & Pre-opening
06    UOL
      SUSTAINABILITY
      REPORT 2017

     The Clement Canopy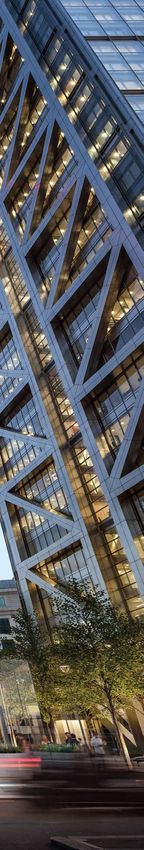
UOL    07
                                                           SUSTAINABILITY
                                                              REPORT 2017

          Growing
         Responsibly
GROUP CHIEF EXECUTIVE STATEMENT

Dear Stakeholders,

Focus on environmental, social and governance
issues has gained greater momentum both locally
and globally in recent years. The Singapore
government, which ratified the Paris Agreement
in 2016, demonstrated its commitment to combat
climate change by declaring 2018 as the Year of
Climate Action and announced a carbon tax of $5
per tonne of GHG emissions imposed from 2019,
with the intention of raising it to between $10 and
$15 per tonne by 2030. The tax will be imposed on
primary emitters producing 25,000 tonnes or more
of GHG emissions in a year, and is expected to be
passed down at least partially to households and
companies consuming electricity.

In line with the global demand for ESG disclosures,
sustainability reporting will also be required from this
year onwards by the Singapore Exchange (SGX).

The Board, supported by the Sustainability Steering
Committee and Sustainability Coordinating
Committee, oversees the management of key
material issues and their performance indicators,
and has approved this report. For the first time, our
report is externally assured to have met requirements
of both SGX and also the Global Reporting Initiative
(GRI). In 2017, we are also pleased to maintain our
inclusion in the SGX Sustainability Leaders Index.
08   UOL
     SUSTAINABILITY
     REPORT 2017

                      Our vision of being a robust property group that creates value
                      and shapes the future will increasingly become more important as
                      Singapore places greater emphasis on sustainability. We strongly
                      believe in leveraging new construction technologies to improve
                      sustainability through employing them in our projects and sharing
                      our knowledge in prefabricated prefinished volumetric construction
                      (PPVC) and Building Information Modelling (BIM) with the real estate
                      community.

                      Our commercial properties achieved a 7.9% reduction in building
                      energy intensity by gross floor area (GFA) occupied, compared to the
                      base year of 2010. For reduction in water intensity by GFA occupied,
                      our commercial properties achieved and exceeded their target of 10%
                      by 2020 with a 18.4% reduction in 2017 compared to the base year of
                      2010.

                      Our hospitality business exceeded our target by achieving a 28.3%
                      reduction of energy intensity by guest night compared to the base
                      year of 2013. For reduction in water intensity by guest night, our
                      hospitality business met our target by achieving an 23.8% reduction in
                      water intensity by guest night, compared to the base year of 2013. We
                      believe we are on track towards our long-term target, and will continue
                      to adopt best practices to achieve it.

                      As most of our development projects are in their peak construction
                      stages, we recorded an increase of 14.2% in GHG emissions intensity,
                      and an increase of 10.2% of water intensity from 2016 to 2017. We
                      are closely monitoring the environmental footprint of our development
                      projects and have adopted technologies such PPVC to reduce the
                      environmental footprint of our construction activities.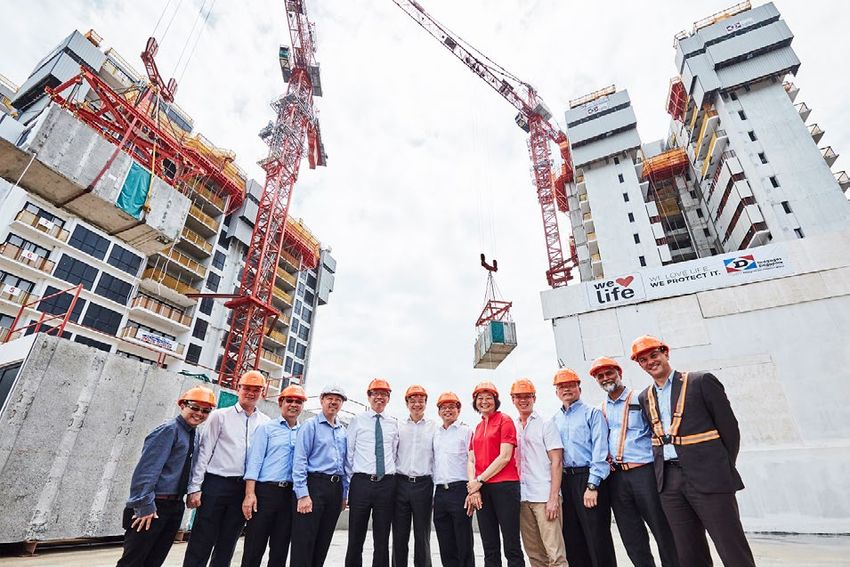
UOL    09
                                                                            SUSTAINABILITY
                                                                               REPORT 2017

We maintained a good safety track record in 2017, with an accident
frequency rate of 0.6 and accident severity rate of 5.5, both well below
the respective national industry averages of 1.6 and 104. We will
continue with our initiatives towards a workplace with zero incidences,
maintaining focus on high occupational safety standards and engaging
our contractors.

We have a responsibility to create a fair and respectful workplace, and
believe a diversified team that supports gender equality, different age
groups, backgrounds and skillsets, will bring forth broader and more
enriching perspectives to the workplace. For our hospitality business,
we will revamp the Service Excellence 2.0 programme and rebrand
it as Project Atlas to focus on service culture, leadership and self-
development programmes this year. Group turnover rate decreased
slightly from 32.1% in 2016 to 32.0% in 2017.

Supporting and caring for our community has become part of our
culture. We are pleased to see continued commitment amongst our
staff in volunteering their time to give back to the community.

At UOL, we believe that the journey towards sustainability will foster
innovation and future-proof us against ESG risks, so as to continue to
create value for all our stakeholders. We look forward to your continuous
support as we strive towards a sustainable future beyond generations.

Gwee Lian Kheng
Group Chief Executive
May 2018
10   UOL
     SUSTAINABILITY
     REPORT 2017

                                 2017 HIGHLIGHTS

                                            UOL maintained our
                                            leadership position as one of
                                            28 constituents in the SGX
                                            Sustainability Leaders Index

     Aligned our efforts to global issues
     through Sustainable Development
     Goals (SDGs)

                                            Achieved all targets for 2017
                                            - for energy, water, safety,
                                            training and compliance

     PPHG won Best Regional Hotel
     Chain at Travel Weekly Asia’s
     Reader’s Choice Awards for
     2017 (Service Quality)
UOL 11
SUSTAINABILITY
REPORT 2017
Supported technological
advancement through knowledge-
sharing on PPVC, advocating for
BIM, and implementing Smart
Nation initiatives at our properties
Contributed towards inclusive
hiring with Pan Pacific Singapore
becoming first hotel in Singapore
to pilot SG Enable’s School-to-Work
Transition Programme
Improved report quality through
independent assurance
Transitioned to GRI Standards12 UOL
SUSTAINABILITY
REPORT 2017
SUSTAINABLE DEVELOPMENT GOALS
SDGS FOR UOL UOL'S IMPACT AND CONTRIBUTION
SDG 3: As a provider of living, working and leisure spaces, promoting
Good Health and good health and well-being of our workforce and customers is our
Well-being responsibility. We have a strong focus on occupational health and
safety and offer healthcare insurance to all our employees. We
actively consider users’ needs, including people with disabilities and
parents with young children in our developments, properties and
hotels. We integrate appropriate features where relevant, drawing
reference to the Code on Accessibility 2013 by the Building and
Construction Authority (BCA).
SDG 5: Gender diversity is important to us in attracting and retaining talent.
Gender Equality We also recognise our shared responsibility in fostering a more
productive and equal society. We recruit, develop and reward our
employees in a fair and inclusive manner, as demonstrated by our
pledge in support of The Tripartite Alliance for Fair Employment
Practices (TAFEP). We also provide flexible work arrangements in
the form of part-time work, which are considered and adjusted
based on the needs of the department and individual.
SDG 8: Developing our employees' capabilities ensures that UOL maintains
Decent Work a competitive advantage. We recognise that people are our leading
and Economic asset and a key focus in executing our strategy, in both our lean
Growth property development business as well as our service-oriented
hospitality business. Through our People Development and
Health and Safety policies, we are committed to developing the
full potential of our close to 2000-strong workforce, and providing
them a safe and healthy work environment.
SDG 9: We are dedicated towards incorporating innovative design and
Industry, quality excellence in the buildings we develop. For example, we
Innovation and are one of the early adopters of PPVC and advocate for BIM. These
Infrastructure technologies not only improve the quality of our buildings, but also
reap positive social and environmental impact such as improved
workers safety, and reduced dust and noise at construction sites.
We promote sustainable practices in our hospitality business as
well, through sharing and encouraging other companies to hire
employees with disabilities and using local produce where possible.UOL 13
SUSTAINABILITY
REPORT 2017
SUSTAINABLE DEVELOPMENT GOALS
SDGS FOR UOL UOL'S IMPACT AND CONTRIBUTION
SDG 11: We actively consider sustainable design in all our development
Sustainable and investment properties, and hotels. We are also committed to
Cities and advancing local talent. In a densely populated and vibrant city like
Communities Singapore, we focus on designing buildings with features to reduce
GHG emissions, and explore ways to preserve the environment’s
inherent character and cultural heritage. We are also mindful of
users’ needs, including people with disabilities and parents with
young children.
We also support knowledge-sharing on innovation in the industry
through events such as the biennial World Cities Summit, where
government leaders and industry experts convene to address
challenges of liveable and sustainable cities. As an early adopter of
technologies, we are also privileged to have government leaders and
regulators requesting for sharing of innovative solutions that we have
implemented, such as our use of PPVC for The Clement Canopy.
SDG 12: We engage our key stakeholders on sustainable consumption and
Responsible production to positively impact the construction and hospitality
Consumption industry value chain. In our property development business, all
and Production our main contractors are OHSAS 18001 and ISO 14001 certified.
We also actively review and monitor the safety and environmental
performances of main contractors at the selection and project
implementation phases. As our hospitality business consumes
large quantities of products, we can influence our suppliers with
our preference for environmentally-friendly and socially-conscious
products that are also commercially feasible. We apply various
criteria including ISO 14001 certification, Forest Stewardship
Council (FSC) certification, FSC Chain-of-Custody certification and
Singapore Green Label.14 UOL
SUSTAINABILITY
REPORT 2017
SUSTAINABLE DEVELOPMENT GOALS
SDGS FOR UOL UOL'S IMPACT AND CONTRIBUTION
SDG 13: UOL is committed to combat climate change and its impact by
Climate Action regulating GHG emissions through the reduction of energy and
water usage. We play our part by managing our carbon footprint in
response to climate change concerns, and prepare our business to
operate effectively in a low-carbon scenario. We have set targets
for energy reduction across all our properties in Singapore, and
adopt systematic environmental management systems to regularly
measure and drive performance. We also aim to positively impact
the wider industry, for example, by requiring our main contractors
to be ISO 14001 certified.
SDG 16: UOL adopts a zero tolerance stance towards fraud and corruption.
Peace, Justice Through our Code of Business Conduct (CBC) which sets out
and Strong expectations of employees in relation to issues such as fraud, bribery,
Institutions conflicts of interests, anti-competitive conduct, harassment, health,
safety and environment, we are committed to conduct our business
with integrity and in compliance with all applicable laws. We respect
the rights and interests of our employees, our business partners,
customers and the communities where we operate. We support
diversity and elimination of discrimination in all our operations.
SDG 17: We actively seek to form long lasting and strong partnerships,
Partnerships for forged on respect, trust and mutual benefit, with our stakeholders.
the Goals In our description of the SDGs above, we illustrate how we engaged
external stakeholders such as the building and hospitality industries,
government, regulators and our suppliers including main contractors
to promote sustainable practices. An example is our move to
incorporate smart facilities in our developments, in response to the
call by the government to move towards a Smart Nation.UOL 15
SUSTAINABILITY
REPORT 2017
FIVE-YEAR PERFORMANCE OVERVIEW
INDICATOR 2017 2016 2015 2014 2013
ENVIRONMENT
Gross Floor Area (GFA) (m2) 414,976 414,589 414,626 385,689 385,689
Energy Consumption (MWh) 130,412 134,316 131,607 129,681 130,159
(Numbers may not add up due to rounding errors)
Completed Buildings* 122,880 127,038 124,115 120,840 125,411
Development Projects 7,532 7,278 7,492 8,841 4,748
GHG Emissions (tonnes of CO2e) 53,945 55,656 54,330 53,963 55,734
Completed Buildings* 51,738 53,501 52,069 51,356 54,364
Development Projects 2,207 2,156 2,261 2,606 1,370
Water Consumption (thousand m3) 1,060 1,110 1,110 1,078 1,054
Completed Buildings* 961 1,010 1,002 941 980
Development Projects 99 100 108 137 74
Building Energy Intensity by GFA (kWh/m2) 296.1 306.4 299.3 313.3 325.2
Building GHG Emissions Intensity by GFA (kg CO2e/m2) 124.7 129.0 125.6 133.2 141.0
Building Water Intensity by GFA (m3/m2) 2.3 2.4 2.4 2.4 2.5
WORKPLACE HEALTH & SAFETY**
Development Projects
OHSAS 18001 for Main Contractors 100% 100% 100% 100% 87.5%
Accident Frequency Rate 0.6 0.5 0.4 3.8 3.6
Accident Severity Rate 5.5 10.1 6.2 66.6 5.8
Hospitality
Accident Frequency Rate 10.8 NA NA NA NA
Accident Severity Rate 56.9 NA NA NA NA
PEOPLE
Turnover 32.0% 32.1% 34.5% 41.4% 41.5%
Property 10.1% 16.1% 15.4% 14.3% 16.1%
Hospitality 33.8% 33.4% 33.4% 40.3% 40.2%
Average Training hours per Employee 85.0 85.1 86.6 44.3 30.5
Property 24.7 26.7 23.8 27.8 15.5
Hospitality 90.0 89.5 92.1 45.7 31.9
COMPLIANCE
Incidents of non-compliance resulting in 0 0 0 0 0
significant fines or sanctions
* Completed buildings refer to completed properties in Singapore, including retail mall, mixed developments, offices,
hotels and serviced suites.
** For Development Projects and Hospitality only16 UOL
SUSTAINABILITY
REPORT 2017
ECONOMIC PERFORMANCE
We operate in the economy in a responsible More information on our business
manner, recognising our interconnectivity performance and plans can be found in
with our stakeholders. Our value-added the Chairman’s Statement and Operation
statement is reproduced below, and records Highlights sections of our Annual Report on
our payments to suppliers (as “purchase pages 16-17 and pages 26-40 respectively.
of materials and services”), employees,
governments and providers of capital.
VALUE-ADDED STATEMENT
2017 2016
$’000 $’000
Sales of goods and services 2,073,384 1,410,558
Purchase of materials and services (1,106,331) (879,057)
Gross value added 967,053 531,501
Share of profit of associated companies 103,158 130,849
Share of profit of joint venture companies 14,461 1,087
Income from investments and interest 37,733 35,587
Other gains/(losses) 524,615 (23,275)
Fair value gains/(losses) on investment properties 15,593 (9,700)
Currency exchange differences 3,701 (1,036)
Total Value Added 1,666,314 665,013
Distribution of Value Added:
To employees and directors
Employees’ salaries, wages and benefits 225,687 186,132
Directors’ remuneration 3,203 2,996
228,890 189,128
To government
Corporate and property taxes 98,477 76,087
To providers of capital
Interest expense 61,859 57,233
Dividend attributable to non-controlling interests 3,775 2,000
Dividend attributable to equity holders of the Company 120,716 119,416
186,350 178,649
Total Value Added Distributed 513,717 443,864UOL 17
SUSTAINABILITY
REPORT 2017
FIVE-YEAR FINANCIAL
PERFORMANCE FOR THE GROUP 2017 2016 2015 2014 2013
REVENUE ($M) 2,103.2 1,440.7 1,278.7 1,360.7 1,058.6
PATMI ($M) 891.0 287.0 391.4 686.0 785.8
GEARING RATIO 0.21 0.24 0.27 0.34 0.28
RETURN ON EQUITY (%) 10.1 3.5 5.0 9.0 11.6
TOTAL ASSETS ($M) 19,623.4 11,558.1 11,501.3 11,848.5 10,421.4
EARNINGS PER SHARE (CENTS) 108.82 35.82 49.39 88.00 102.01
For a detailed breakdown of our 2017 financial results, please refer to the following sections in the UOL Annual Report 2017:
Financial Highlights, page 10-11
Five-year Financial Summary, page 76-77
Segmental Performance Analysis, page 78-79
SHARE PRICE AND TURNOVER
SHARE PRICE ($)
9.490
9.5 9.5
9.110
8.900
9.0 9.0
8.250
8.230
8.5 8.5
8.550
8.100
8.100
8.000
8.000
8.370
7.930
7.910
8.0 8.0
8.080
7.950
7.470
7.500
7.870
7.300
7.270
7.340
7.280
7.5 7.5
7.150
7.570
7.050
7.140
7.080
7.060
6.970
7.420
6.960
6.950
7.350
7.350
6.840
6.820
6.770
6.720
6.720
6.740
6.730
7.0 7.0
6.710
7.170
6.680
6.600
6.570
6.620
6.580
6.570
6.510
6.980
6.900
6.560
6.870
6.800
6.810
6.330
6.290
6.270
6.290
6 .710
6.280
6.270
6.210
6.210
6.690
6.5 6.5
6.200
6.150
6.140
6.120
6.500
6.070
6.490
6.000
5.980
6.420
6.400
6.430
5.940
6.390
6.380
6.370
5.890
5.900
6.310
5.850
6.330
6.350
6.190
6.170
5.700
6.0 6.0
6.140
6.330
6.120
6.070
6.130
6.020
5.950
5.950
5.990
5.930
5.900
5.920
5.870
5.830
5.840
5.820
5.780
5.790
5.5 5.5
5.620
5.610
5.560
5.560
5.530
5.560
5.500
5.440
5.420
5.390
5.220
5.0 5.0
4.5 4.5
4.0 4.0
3.5 3.5
3.0 3.0
High High
2.5 2017 2.5
Prices
Low Low Prices
2.0 2.0
1.5 1.5
JFMAMJJASOND JFMAMJJASOND JFMAMJJASOND JFMAMJJASOND JFMAMJJASOND
2013 2014 2015 2016 201718 UOL
SUSTAINABILITY
REPORT 2017
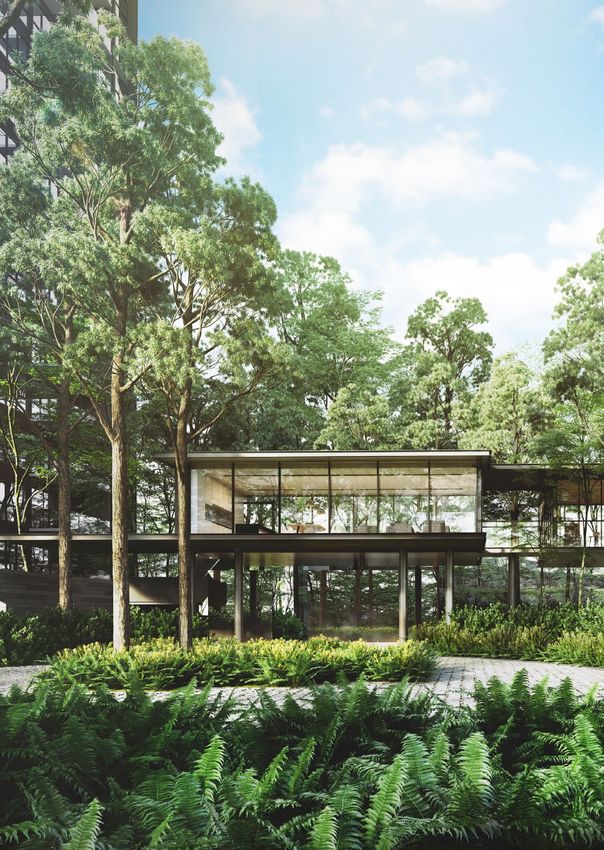
One Bishopsgate Plaza, London, UK
MUOL 19
SUSTAINABILITY
REPORT 2017
Seeing
Results
PRODUCT AND SERVICE QUALITY
We are dedicated towards incorporating design and
technology in the buildings we develop. We also
support knowledge-sharing on innovation in the
industry. One example of an innovative technology
is BIM, which we illustrate in a case study in this
report. At the BIM Symposium 2017 organised by the
Real Estate Developers’ Association of Singapore,
Mr Liam Wee Sin, Deputy Group Chief Executive
Officer, spoke on the crucial role technologies such
as BIM can play in improving productivity and quality
to help create sustainable and smart buildings
to transform cities and industries. In 2018, we will
continue to execute and hone our capabilities in
PPVC, BIM and Smart Nation technologies for our
property business.
For our hospitality business, we continue to
benchmark our performance using an external Quality
Assurance specialist, in addition to close monitoring
of satisfaction surveys and reviews on multiple
platforms. Our planned initiatives to continuously
improve our Service Quality can be found under the
People Development section, as training is the key
factor to achieving enhanced service excellence.20 UOL
SUSTAINABILITY
REPORT 2017
EMBRACING TECHNOLOGIES FOR SAFE
AND EFFICIENT CONSTRUCTION, AND
STRENGTHENING PARTNERSHIPS
One Bishopsgate Plaza, London, UK
BIM has become an exciting development that the Building and Construction Authority (BCA) has
identified to be a “key technology to improve productivity and level of integration across various disciplines
across the entire construction value chain”2. BCA is actively encouraging BIM, including through its S$250
million Construction Productivity and Capability Fund (CPCF)3 .
At its simplest, BIM is a 3D modelling tool. This departure from traditional two-dimensional technical
drawings enables sophisticated and early identification of problems, for example through its clash
detection feature. Clash detection prevents problems that would otherwise be discovered during the
assembly stage, such as misalignments of different components.
The full potential of BIM is harnessed when it is used as an integrated design and documentation tool. A
building project involves multiple partners – architects, developers, engineers, main contractors and sub-
contractors. With BIM, information from all disciplines can be incorporated in a single shared model, which
is a game changer in improving project coordination and reducing information losses. However, currently in
Singapore, BIM adoption is not widespread enough for this to be implemented across the value chain.
Our international footprint means that we gain hands-on experience from markets advanced in BIM use like
London, with our mixed development project One Bishopsgate Plaza.
By using BIM and prefabrication together, we enhance the quality and confidence in what we build. The precise
information from BIM allows for more construction work to be undertaken off-site in a controlled manner. BIM
reduces conflicts and raises confidence in building plans. Accurate fabrication of materials reduces waste while
pre-assembly can save time. Sizing of components is accurate and complex designs can be modelled prior
to prefabrication. For example, repetitive components can be fabricated off-site in a controlled environment
where testing and inspections can also be carried out prior to bringing the assemblies to site.
We are fabricating bathroom pods for One Bishopsgate Plaza’s hotel and residential components, which are
fully assembled in Italy, tapping into the skilled workforce there. Each pod comprises all interior finishes –
integrated servicing, such as underfloor heating, drainage, electrical and ventilation systems, and all sanitary
ware accessories and interior fixings such as towel rails, mirrors and shower doors. Prefabricating in Italy is
not reliant on the site conditions in London and with BIM the accuracy of modelling means there are very few
errors. Additional software can be used for visualisation, walk-throughs, tracking along the production line
and testing and commissioning prior to shipping. Final visual inspections in the factory will highlight defects
that can all be cleared before shipping, hence dramatically reducing rework on site. Each pod is tracked
along the production line via software that is developed for mobile tablets. QR codes are used to track the
various stages in the process.
BIM greatly facilitates tighter coordination between teams. We have relied on BIM and in-house software to
coordinate the design, and to track the sequencing of construction and readiness for delivery. This process adds to
the ability to have accurate reporting on progress and informs the construction manager if there are bottlenecks.
Working on this full BIM development project has greatly enhanced our expertise in the field. As an early
adopter of BIM technology, we are poised to take advantage of opportunities to utilise BIM to work on
projects in Singapore, when it becomes more prevalent.
2
https://www.bca.gov.sg/bim/bimlinks.html
3
https://www.bcaa.edu.sg/what-we-offer/academic-programmes?CourseId=3a4425c2-3230-6ef1-b0a0-ff0000a28c6cUOL 21
SUSTAINABILITY
REPORT 2017
SUPPORTING TECHNOLOGICAL ADVANCEMENT
THROUGH KNOWLEDGE-SHARING
The Clement Canopy
As an early adopter in building technologies, we welcome the opportunity to share our experiences for the
advancement of the industry.
We reported in our previous sustainability report that we have embarked on our first PPVC project for
The Clement Canopy, a 505-unit condominium that comprises two 40-storey towers in Clementi Avenue 1.
Adopting PPVC improves workers’ safety with reduced exposure working at heights, and also reduces dust
and noise levels on site. Besides PPVC, our main contractor Dragages Singapore Pte Ltd also employs
BIM to study the PPVC modules interfaces as well as the coordination of the mechanical and electrical
installation within and between each module.
We are encouraged that our stakeholders are keen to learn more about our experiences with PPVC. In
September 2017, we hosted Mr Lawrence Wong, Minister for National Development and Government
Parliamentary Committee members Mr Chong Kee Hiong, Er Dr Lee Bee Wah and Mr Louis Ng at The
Clement Canopy’s site. On 14 November 2017, at the request of BCA, Dragages Singapore hosted
international delegates from Australia, Austria, Canada, Japan, Netherlands, New Zealand, Norway,
Scotland, Sweden and the USA.
Visit by Minister for National Development and Government Parliamentary Committee members22 UOL
SUSTAINABILITY
REPORT 2017
SMART NATION: ENHANCED TECHNOLOGY USE
FOR RESIDENTS AND SHOPPERS
The Clement Canopy and OneKM
UOL supports the move in Singapore towards a Smart Nation with initiatives across our properties and
developments. For our residential development project, The Clement Canopy, residents will be able to invite
their friends who can access the condominium with ease through an e-invite system, which facilitates and
reduces security’s duties. In addition, residents can make use of the condominium application to enjoy the
discounts offered by many online delivery companies. For added convenience, The Clement Canopy also
offers control of front door lock, control of air-conditioning on/off switch and booking of facilities remotely
from anywhere via a smart phone application.
UOL has started to roll out initiatives at our malls that are aligned with the move towards a smart cashless
society with contactless payment. Our retail mall OneKM offers an online carpark rebate redemption scheme
for shoppers’ convenience. The carpark redemption is done via the mall’s website where shoppers fill in
their details and submit a photo of one or more receipts. The concierge will then process the redemption
received, allowing shoppers to drive out free of charge once the process is completed.
The aim of the scheme is to allow ease of shopping at our malls, especially for shoppers who may be in the
midst of dining and do not have time to visit the concierge. It is one of our retail malls’ online initiatives to
meet the changing needs of shoppers and to be more efficient in our work processes. In addition, we hope
to reduce the reliance on paper tickets and adopt more sustainable practices.
An Internet of Things wall at The Clement Canopy’s showflat displays the Smart Nation initiatives that will be incorporated for the projectUOL 23
SUSTAINABILITY
REPORT 2017
ENVIRONMENT
BUILDING ENERGY & WATER CONSUMPTION
Given the different nature of our to 2020, inclusive of both years. This
businesses, the normalisation factors target applies to our hospitality business,
used in our energy and water targets for which includes hotels and serviced suites.
our commercial properties and hospitality
business are GFA occupied and guest In 2017, we had incorporated OneKM,
nights respectively. Notwithstanding, our retail mall, into our target for
intensity data for the Group is available commercial properties. Despite the
on a by GFA basis in Appendix A. higher energy intensity for a retail
property type compared to offices and
Hotels have the highest energy and water mixed developments, we decided to
intensities based on property types, and face the challenge in maintaining 16%
also form the largest contributor to our reduction of energy intensity by GFA
building energy and water consumption. occupied from 2010 to 2020, inclusive of
In 2017, we set our target to reduce both years.
energy and water intensity by guest night
by 27% and 25% respectively from 2013
INDICATORS SCOPE TARGET STATUS
Energy Intensity Commercial 16% reduction of Ongoing
Properties energy intensity by
GFA occupied by
2020 (Base year:
2010)
Energy Intensity Hospitality 27% reduction of TARGET MET
energy intensity by
guest night by 2020
(Base year: 2013)
2% reduction of TARGET MET
energy intensity by
guest night by 2017
(Base year: 2016)24 UOL
SUSTAINABILITY
REPORT 2017
The Group’s building energy consumption and 2017, reduction across commercial
and GHG emissions were 122,880 MWh and property types ranged between 5.0% and
51,738 tonnes of CO2 equivalent respectively 6.4%.
in 2017. The main source of energy use at
our buildings was from electricity, with a Our hospitality business achieved a 28.3%
slight contribution from diesel. reduction of energy intensity by guest night
in 2017 compared to the base year of 2013,
In 2017, our commercial properties exceeding our target of 27% reduction by
achieved a 7.9% reduction of energy 2020. Compared to 2016, energy intensity
intensity by GFA occupied compared to of our hospitality business was reduced
the base year of 2010. Comparing energy by 11.3% on a by guest night basis, which
intensity by GFA occupied between 2016 exceeded our year-on-year target of 2%.
BUILDING ENERGY CONSUMPTION BUILDING ENERGY INTENSITY BY GFA
MWh kWh/m2
140,000 600
120,000 500
479.7
100,000
400
80,000
300 296.1
60,000
222.2
200
40,000 165.0
138.4
100
20,000
0 0
2013 2014 2015 2016 2017 2013 2014 2015 2016 2017
Retail Mall Mixed Developments Group Serviced Suites
Offices Hotels Retail Mall Mixed Developments
Serviced Suites Offices Hotels
BUILDING GHG EMISSIONS BUILDING GHG EMISSIONS INTENSITY BY GFA
tonnes CO2e kgCO2e/m2
60,000 300
250
50,000
200 201.2
40,000
150
30,000 124.7
100 94.3
20,000 70.0
58.7
50
10,000
0
2013 2014 2015 2016 2017
0 Group Serviced Suites
2013 2014 2015 2016 2017 Retail Mall Mixed Developments
Offices Hotels
Retail Mall Mixed Developments
Offices Hotels
Serviced SuitesUOL 25
SUSTAINABILITY
REPORT 2017
INDICATORS SCOPE TARGET STATUS
Water Intensity Commercial 10% reduction of water TARGET MET
Properties intensity by GFA occupied by
2020 (Base year: 2010)
Water Intensity Hospitality 25% reduction of water Ongoing
intensity by guest night and
cubic metres/guest night by
2020 (Base year: 2013)
2% reduction of water TARGET MET
intensity by guest night by
2017 (Base year: 2016)
The Group’s building water consumption was Our hospitality business achieved a 23.8%
960.5 thousand m3 in 2017. Water used at all reduction in water intensity by guest night
our properties is from the municipal source. in 2017, compared to the base year of
2013, on track towards meeting our target
Our commercial properties achieved a of 25% reduction by 2020. We achieved
18.4% reduction in water intensity by GFA our year-on-year target of 2% reduction
occupied in 2017, compared to the base of water intensity by guest night with a
year of 2010. This exceeded our target of water intensity reduction of 9.9% in 2017
10%. As such, we will be placing greater compared to 2016.
focus on achieving our energy intensity
targets.
BUILDING WATER CONSUMPTION BUILDING WATER INTENSITY BY GFA
thousand m 3
m3/m2
1,200 4
1,000 3.4
3
800
2.3
2.3
600 2
1.5
400
1.1
1
200
0 0
2013 2014 2015 2016 2017 2013 2014 2015 2016 2017
Retail Mall Mixed Developments Group Serviced Suites
Offices Hotels Retail Mall Mixed Developments
Serviced Suites Offices Hotels26 UOL
SUSTAINABILITY
REPORT 2017
ENERGY AND WATER CONSUMPTION FOR DEVELOPMENT PROJECTS
INDICATORS SCOPE TARGET STATUS
Carbon Footprint Commercial Green Mark Gold for Not applicable,
and Water Properties new development of no new
Consumption investment properties developments
in Singapore in 2017
Value Chain Impact Development All main contractors for TARGET MET
for Material Projects in ISO 14001 and Green
Environmental Singapore and Gracious Builder
Topics certification
2017 2016 2015 2014 2013
Electricity consumption (GJ) 4,515 4,888 6,077 5,541 2,151
Diesel consumed (GJ) 22,599 21,313 20,893 26,286 14,943
Total energy consumed (GJ) 27,114 26,201 26,970 31,827 17,094
Total GHG emissions 2,207 2,156 2,261 2,606 1,370
(tonnes of CO2e)
GHG emissions intensity by value of 10.5 9.2 11.1 13.0 13.0
work completed (kg CO2e/$’000)
Total water consumed (m3) 98,866 100,099 107,890 136,880 74,253
Water intensity by value of work 0.5 0.4 0.5 0.7 0.7
completed (m3/$’000)
Value of work completed ($'000) 209,678 233,943 203,130 201,091 105,108UOL 27
SUSTAINABILITY
REPORT 2017
For development projects, energy and water use at our development projects,
water consumption figures per year such as using waste water to wash trucks
are highly dependent on the phase of and other vehicles before they leave the
construction, where consumption is construction sites to minimise pollution to
heaviest during the middle phase. the public road surfaces.
Total energy consumption at our All main contractors undertaking our
development projects was 27.1 TJ in 2017. projects in 2017 were certified to
The energy consumption stemmed from ISO 14001 and Green and Gracious
diesel and electricity use. Scope 1 and Builder. The Green and Gracious Builder
Scope 2 GHG emissions were 1,675 and certification is awarded by BCA to
532 tonnes of CO2 equivalent respectively, contractors that have implemented a
adding up to a total of 2,207 tonnes of CO2 certain standard in environmental and
equivalent of GHG emissions in 2017. The social practices. Contractors are assessed
GHG emissions intensity by value of work on environmental aspects, including
completed was 10.5 kg of CO2 equivalent material use, GHG emissions, water use
per thousand dollars. and air quality. All our main contractors
are required to submit quarterly reports
Total water consumption was 98.9 on energy and water consumption to us.
thousand m3 in 2017. We seek to reduce
ENERGY CONSUMPTION FOR CORPORATE OFFICE
We track energy consumption for our increase in GHG emissions of 8.0% to 134.0
corporate office, which is located within our tonnes of CO2. The increase was largely
commercial property. Our corporate office attributed to an increase in office space and
energy consumption was 315.7 MWh in consumption of existing space.
2017. Compared with 2016, this reflected an
WASTE AND RESOURCE MANAGEMENT
In 2017, we recorded 4,131 tonnes of reporting stood at 92% by GFA. We will
waste disposed of in our hospitality continue to work on improving coverage
business, and 120.2 tonnes of waste of waste reporting at all our hotels and
was recycled. Coverage of our waste serviced suites.28 UOL
SUSTAINABILITY
REPORT 2017
UOL volunteers helped
children from CARE
Singapore build their
dream catcher at the
Come Get Wild With Us
event at United SquareUOL 29
SUSTAINABILITY
REPORT 2017
Touching
Lives
HEALTH AND SAFETY
WORKPLACE SAFETY FOR DEVELOPMENT PROJECTS
INDICATORS SCOPE TARGET STATUS
Value Chain Impact Development All main contractors TARGET
for Health and Projects to be OHSAS MET
Safety 18001 certified
Construction work for our development projects
poses the greatest risk to safety. The accident
frequency rate (AFR) increased marginally from
0.5 in 2016 to 0.6 in 2017, while remaining below
the national industry average of 1.6. The accident
severity rate (ASR) decreased from 10.1 in 2016 to
5.5 in 2017, significantly lower than the national
industry average of 104. There were a total of three
injuries resulting in 29 lost days, and there were no
injuries to female contractors in 2017.30 UOL
SUSTAINABILITY
REPORT 2017
ACCIDENT FREQUENCY RATE (AFR) ACCIDENT SEVERITY RATE (ASR)
Number of injuries per million man-hours Number of man-days lost per million man-hours
10.0 300
7.5
200
5.0 3.8
3.6
100 66.6
2.5
0.4 0.5 0.6 5.8 6.2 10.1 5.5
0 0
FY13 FY14 FY15 FY16 FY17 FY13 FY14 FY15 FY16 FY17
AFR AFR (National industry average) ASR ASR (National industry average)
SUB-
MAIN CONTRACTORS CONTRACTORS
No. of workplace fatalities 0 0
No. of non-fatal workplace injuries 0 3
No. of occupational diseases 0 0
No. of dangerous occurrences/near misses 0 0
No. of lost days 0 29
Total no. of man-hours worked 1,763,775 3,512,894
WORKPLACE SAFETY FOR HOSPITALITY
We have been reporting on occupational separately in line with GRI requirements.
health and safety incidents for our The AFR and ASR were 10.8 and 56.9
hospitality business since its inclusion in respectively in 2017. Moving forward
2016, under the Incident Reporting section. in 2018, we intend to review best
In 2017, for greater comparability and practices on safety amongst our peers to
transparency, we reported on the figures enhance our workplace safety practices.UOL 31
SUSTAINABILITY
REPORT 2017
WORKPLACE INCIDENCES
OTHER WORKERS
EMPLOYEES e.g. contractors
MALE FEMALE MALE FEMALE TOTAL
No. of workplace fatalities - - - - -
No. of non-fatal workplace 26 11 3 5 45
injuries
No. of occupational diseases - - - - -
No. of dangerous - - - - -
occurrences/near misses
No. of lost days 145 72 12 7 236
Total no. of man-hours 2,145,625 1,847,182 83,588 74,697 4,151,092
worked
FOOD SAFETY & HYGIENE
Our hotels maintained our track record investigated with laboratory tests, where
for food safety. A marginal number of possible. No indications of contamination
cases were reported and thoroughly were found in any of the samples.
GUEST SAFETY & SECURITY
There were no substantiated issues concerning guest safety and security in 2017.
INCIDENT REPORTING
The number of injuries reported at all buildings was 124 in 2017. This included guests,
tenants and visitors as well as employees and contractors.32 UOL
SUSTAINABILITY
REPORT 2017
PEOPLE
INTEGRATING UOL VALUES IN
PERFORMANCE APPRAISALS
To reinforce their understanding of the
Competency Framework and apply
it at interviews, our colleagues Jenny
Swee and Foo Say Twang (both on the
right) interviewed the job applicant
(played by the trainer on the left)
during a role-play exercise.
We strongly believe that the quality of our people defines the organisation. We developed Six Cs
(Competitive, Committed, Competent, Creative, Collaborative and Caring), which are qualities and
attributes that depict our unique UOL culture. These values are based on behavioural evidence of what
we do day to day, not aspiration based.
The 6Cs serve to guide us in recruiting and developing talents. These qualities shape our attitude and
behaviour, and are demonstrated in our work conduct and interaction with each other. In 2017, with
the assistance of a global executive search firm, the 6Cs have been incorporated into our Competency
Framework, performance appraisals and recruitment interviews. The 6Cs are articulated as below:
We are Competitive. We have an enterprising spirit, and are focused and driven. We are agile and
responsive to stakeholders’ needs and market changes. We embrace challenges and have the will and
resilience to succeed.
We are Committed. We are passionate and have a high level of ownership and self-accountability. We
take responsibility for our conduct and outcomes. We are thorough and timely.
We are Competent. We take pride in quality work and professional excellence. We are proficient and
knowledgeable in our areas of expertise. We are effective and have strong execution capabilities. We
seek pragmatic solutions.
We are Creative. We are innovative and receptive to new ideas, opportunities and ways of doing things.
We aspire to create value for the organisation.
We are Collaborative. We work as a team and leverage each other’s strengths. We look for common ground
and seek to understand each other’s perspectives. We are objective and strive for win-win outcomes.
We are Caring. We value our people, treating them fairly and with respect. We endeavour to contribute
to the community and build a sustainable environment.UOL 33
SUSTAINABILITY
REPORT 2017
In 2017, the Group had 1,953 employees in 10.1% in 2017. The turnover rate for our
Singapore, with over 90% employed in our hospitality business increased slightly from
hospitality business. Reviewing the trend 33.4% in 2016 to 33.8% to 2017.
over the past five years, the turnover rate for
both the property and hospitality businesses The Group recorded an absentee rate of
recorded a general trend of decrease. Each 2.8% in 2017, or roughly an average of 7.3
year, the turnover rates remained below days of sick leave based on a five-day work
respective national industry averages. week. The absentee rate for our property
Compared to 2016, the turnover rate for our business was 2.7% while the rate for our
property business decreased from 16.1% to hospitality business was 2.8% in 2017.
TURNOVER RATE
45%
40%
35%
30%
25%
20%
15%
10%
5%
0%
2013 2014 2015 2016 2017
Group Property Hospitality
2017 2016 2015 2014 2013
Group 32.0% 32.1% 34.5% 41.4% 41.5%
Property 10.1% 16.1% 15.4% 14.3% 16.1%
National industry average* 33.6% 34.8% 37.2% 40.8% 36.0%
(Real Estate Services)
Hospitality 33.8% 33.4% 33.4% 40.3% 40.2%
National industry average* 43.2% 43.2% 48.0% 51.6% 49.2%
(Accommodation & Food Services)
*Source: The Ministry of Manpower Labour Market Report 2017.34 UOL
SUSTAINABILITY
REPORT 2017
DIVERSITY AND INCLUSION
As diversity and inclusion is a material issue, hospitality business were above the age of
particularly for our hospitality business, we 50. We encourage and provide a supportive
believe that supporting workplace diversity environment for our employees with children.
will enrich our perspectives and attract high- All employees in our property and hospitality
calibre candidates from the widest talent businesses were entitled to parental leave.
pool. We can draw from the expertise of a
workforce with nearly 20 nationalities across We leverage and develop skills in our local
the Group. community. In our hospitality business,
79.1% of Senior Management and 53.5%
In our hospitality business, 45% of the of the employees were Singaporeans or
Senior Management of various business Permanent Residents as at end December
units were female while 55% were male. 2017. In our property business, all of
In our property business, 44% of Senior the Senior Management and 98.0% of
Management were female while 56% the employees were Singaporeans or
were male. We also continued to practice Permanent Residents as at end December
the re-employment of mature workers. In 2017. We align ourselves with Singapore’s
2017, 22.8% of employees in our property national targets on diversity and inclusion
business and 19.4% of employees in our in our workforce.
WORKFORCE BY GENDER
GROUP PROPERTY HOSPITALITY
52% 48% 34% 66% 54% 46%
Male Female Male Female Male FemaleUOL 35
SUSTAINABILITY
REPORT 2017
FOSTERING INCLUSION AT OUR WORKPLACE,
AND BEYOND
As part of our commitment to diversity and inclusion, PPHG organised a highly successful seminar
on “Fostering Inclusion at the Workplace” in collaboration with presenting partners United Overseas
Bank (UOB), SG Enable and Central Singapore Community Development Council. SG Enable is an
agency dedicated to enabling persons with disabilities and building an inclusive society. Graced by
then-Minister for Trade and Industry (Industry) Mr S Iswaran, the event was attended by 160 business
leaders and human resource practitioners from more than 80 companies, including leading hospitality
players Marina Bay Sands, Grand Hyatt Singapore and Raffles Hotel Singapore.
Through the seminar, it is hoped that sharing of best practices by PPHG and UOB will encourage other
business leaders in the industry to join them in inclusive hiring. Pan Pacific Singapore was the first hotel
in Singapore to pilot SG Enable’s School-to-Work Transition Programme (S2W), which offers customised
training pathways and work options for students with disabilities who have the potential to work.
Two memorable success stories from the programme are 18-year-old Noramira Mohd Amin and 19-year-old
Brenda Tay Wan Ying, who both have intellectual disabilities. Over several months of patient training from
their supervisors and team mates, they were offered full-time employment at the hotels under PPHG.
Noramira (left) and Brenda shared that their work has helped them grow in confidence
Noramira and Brenda are two of more than 30 individuals with disabilities who had undergone training at
the hotels under PPHG in Singapore. The trainees have shown good progress to date, with a total of four
converted to full-time roles.
Leaders at the seminar concluded that employees with disabilities widen the talent pool, and build brand
loyalty and engagement. For some, a more diverse workplace has led to flourishing creativity and higher
employee satisfaction.
We are committed to enabling individuals with disabilities by providing them with meaningful and
sustainable employment opportunities. We encourage like-minded companies to join us to promote an
inclusive and diverse workplace. We are pioneering new initiatives for the hospitality sector towards the
full integration of employees with disabilities into the workplace. In view of the successful pilot run and our
ongoing job mapping, we will continue working with SG Enable to roll out the School-to-Work programme
in all five of our Singapore hotels in 2018, with the aim of preparing 20 trainees for employment by the
end of 2018.36 UOL
SUSTAINABILITY
REPORT 2017
PEOPLE DEVELOPMENT
AVERAGE TRAINING HOURS PER EMPLOYEE
100.0
90.0
80.0
70.0
60.0
50.0
40.0
30.0
20.0
10.0
0
2013 2014 2015 2016 2017
Group Property Hospitality
2017 2016 2015 2014 2013
Group 85.0 85.1 86.6 44.3 30.5
Property 24.7 26.7 23.8 27.8 15.5
Hospitality 90.0 89.5 92.1 45.7 31.9UOL 37
SUSTAINABILITY
REPORT 2017
Average training hours per employee for the Group was 85.0 hours in 2017.
INDICATORS SCOPE TARGET STATUS
Talent Attraction Property Average training hours TARGET MET
and Retention per employee: 25 hours
through People per year
Development
For our property business, average training training for our employees, including
hours per employee was 24.7 hours, which on sustainability issues such as on the
we consider to have met our target of upcoming carbon tax in Singapore.
25 hours. In 2018, we seek to continue
INDICATORS SCOPE TARGET STATUS
Service Quality and Hospitality Average training hours TARGET MET
Talent Attraction per employee: 80 hours
and Retention, per year
through People
Development
The average training hours per employee implemented in 2018, where employees will
for our hospitality business in 2017 was 90.0 receive training on a wider range of high-
hours, exceeding our target of 80 hours. quality courses guided by the roadmap.
Further, in 2018, we plan to revamp our
In 2017, we developed a training roadmap training programme addressing topics
throughout each level of our employees’ such as service skills, service mindset,
careers for each hospitality property, as service culture and service leadership, for
well as for the corporate office. This will be employee and leadership levels.38 UOL
SUSTAINABILITY
REPORT 2017
COMMUNITY
Our community development initiatives To help needy children improve their
provide opportunities for our employees physical, mental and emotional well-being,
to give back to the society in which we we also made a donation to the Art Therapy
operate. Programme at KK Women’s and Children’s
Hospital. The free sessions support the
In 2017, we supported CARE Singapore’s young patients’ recovery through the
StarKidz! Programme through our staff creative process of making art, helping
volunteerism efforts. This programme them better manage their inner feelings
aims to help improve the self-esteem and strengthening their resilience.
of vulnerable children who struggle
academically, so they can become In our hospitality business, PPHG has been
responsible and confident adults. offering employment opportunities to
people with disabilities, as well as internship
In June 2017, 23 UOL volunteers brought opportunities for students with special
26 children from the programme to the needs. For more information, please refer
Army Museum of Singapore. The museum to the case study under the Diversity and
provides an insight into the history of Inclusion section on page 35.
the Singapore Army, and honours the
contribution of soldiers and their families. We also expanded the reach of our Eat Well
The children visited the SAFTI Military With Us initiative from four to ten charity
Institute and saw real soldiers in training, homes in 2017. First launched in 2015 by
which we hope inspired a sense of discipline PPHG in conjunction with National Council
and purpose in the children. of Social Service, senior chefs from PPHG’s
Singapore hotels and Si Chuan Dou Hua
We also hosted 22 children from CARE Restaurant impart culinary recipes and tips
Singapore and 30 students from Pathlight to the homes’ resident cooks, enabling
School at our Come Get Wild With Us them to prepare tastier and nutritious meals
event at United Square in August 2017. for their residents. The recipes considered
We transformed the mall atrium into an the homes’ budgets and the dietary needs
experiential tropical rainforest, complete of the beneficiaries, such as children and
with lush foliage and live exotic animals. the elderly.
In addition to staff volunteerism, we also
provided sponsorships and donations to
help fund programmes run by charitable
organisations in our immediate community
in Novena/Thomson.
We supported the Riding for the Disabled
Association of Singapore (RDA Singapore)
by sponsoring one of its horses, which
provide horse-riding therapy to children and
adults with physical and mental disabilities.
In June 2017, we also brought the horses
from RDA Singapore to United Square to
generate awareness for the organisation.
UOL volunteers on an outing to Army Museum of Singapore with children from
CARE SingaporeUOL 39
SUSTAINABILITY
REPORT 2017
SUSTAINABLE FOOD FOR GOOD
As part of our commitment to care for our wider community, PPHG continued the Eat Well Do Good
initiative which started in 2016. Partnering with The Food Bank Singapore in support of World Food Day,
a global day of action against hunger, we harnessed the collective experience of the senior chefs from our
five Singapore hotels, who created special dishes made from ingredients which were sourced locally from
Comcrop, a high-tech rooftop farm, and other local farms in Singapore.
Comcrop’s urban farming methods greatly reduce the distance food crops have to travel, which means
fresher and more nutritious products. The dishes were featured at the hotels’ restaurants, where diners
joined our chefs in doing good, as we donated a portion of sales proceeds from 15 July to 15 August 2017
to purchase wholesome food bundles for 1,722 low-income households.
We continue to support local farmers on an ongoing basis, sourcing local produce for our buffet dishes and
catering menus. Through our support of local produce, we hope that diners and peers will be encouraged
to understand our food sources and have access to nutritious and quality produce.
PPHG is also stepping up efforts to address food waste through food preparation and leftovers. We use
“forward-planning” of menus which helps operations, and reduces food waste, thereby reducing our
carbon footprint. PARKROYAL on Beach Road employs a system which monitors reservations and the
availability of its F&B outlets in real-time. The culinary team has access to the system to align its market list
according to demand, which leads to better management of our food inventory. In a similar fashion, food
preparation is closely tailored to the reservation covers received daily at Pan Pacific Orchard, where food
for the buffet counters are cooked when requested and replenished according to demand.
PARKROYAL on Kitchener Road has found innovative ways of recycling food, such as using unconsumed
bread from the breakfast buffet to make Bread Butter Pudding as a dessert item for dinner. The hotel’s
Executive Chef Low Hoe Kiat famously created the signature Slow-braised Pumpkin Crab in Claypot with
the pumpkins used as decorations for Halloween!
We order according to the size of the event as far as possible. At Pan Pacific Singapore, we channel
unconsumed pastries from events to the associates’ cafeteria. We are looking to better manage food waste
at our hotels in various ways, such as food waste digester machines which can convert solid food waste
materials into either liquid nutrient or reusable water. PARKROYAL on Beach Road is currently piloting such
a machine and we are looking at how this can work for the rest of the hotels in Singapore, in particular for
the largest, 790-room Pan Pacific Singapore.
Use unconsumed bread from the
breakfast buffet to make Bread Butter
Pudding as a dessert item
Chef Low Hoe Kiat created
Pilot food waste digester
the signature Slow-braised
machines to convert solid food MANAGING
Pumpkin Crab in Claypot
waste materials into liquid FOOD WASTE with the pumpkins used as
nutrients or reusable water
decorations for Halloween
Channel unconsumed
pastries from events to the
associates’ cafeteriaYou can also read