Flintshire County Council 2014/15 Local Housing Market Assessment
←
→
Page content transcription
If your browser does not render page correctly, please read the page content below
Flintshire County Council 2014/15

              Local Housing Market Assessment

                          Flintshire County Council

                                      Final Report
                                        August 2015

Main Contact:       Michael Bullock
Email:              Michael.bullock@arc4.co.uk
Telephone:          0191 386 0026
Website:            www.arc4.co.uk
         4
© 2015 arc Limited (Company No. 06205180)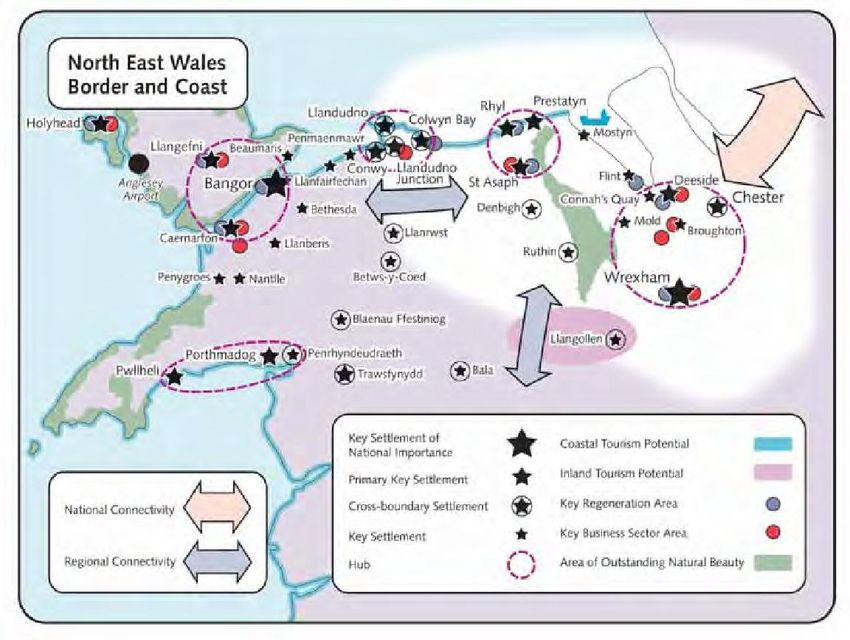
Flintshire LHMA 2014 - Draft Report                                                                                  Page | 2

Table of Contents
1.      Introduction..................................................................................................... 7
        Research methodology ..................................................................................... 8
2.      Local context ................................................................................................ 10
        Introduction ..................................................................................................... 10
        Corporate policy context ................................................................................. 12
        Strategic housing context ............................................................................... 13
        Planning policy ............................................................................................... 14
        Concluding comments .................................................................................... 15
3.      Defining the Housing Market Area .............................................................. 16
        Introduction ..................................................................................................... 16
        House prices and rates of change in house prices ......................................... 18
        Relative affordability ....................................................................................... 23
        Household migration and search behaviour ................................................... 24
        Travel to work trends ...................................................................................... 30
        Concluding comments .................................................................................... 30
4.      Understanding the Current Housing Position............................................ 31
        Introduction ..................................................................................................... 31
        Estimates of current dwellings in terms of size, type, condition, tenure .......... 31
        Concluding Comments ................................................................................... 46
5.      Understanding the future Housing Market ................................................ 48
        Introduction ..................................................................................................... 48
        Key market drivers .......................................................................................... 48
        Market signals – Housing demand pressure and housing supply ................... 52
        Past trends in housing delivery ....................................................................... 53
        Development in neighbouring areas ............................................................... 53
        Suggested future development profile of market dwellings ............................ 54
        Stakeholder Observations .............................................................................. 58
        Concluding Comments ................................................................................... 59
6.      Housing Need ............................................................................................... 61
        Introduction ..................................................................................................... 61
        Stage 1: C: Current need ............................................................................ 62
        Stage 2: A: Available stock to offset need .................................................... 65
        Stage 3: N: Newly arising need .................................................................... 66
        Stage 4: S: Supply of affordable units ......................................................... 67
        Estimates of household groups who have particular housing requirements ... 72
        Summary ........................................................................................................ 77
7.      Key Findings and Conclusion: bringing the evidence together ............... 79

March 2015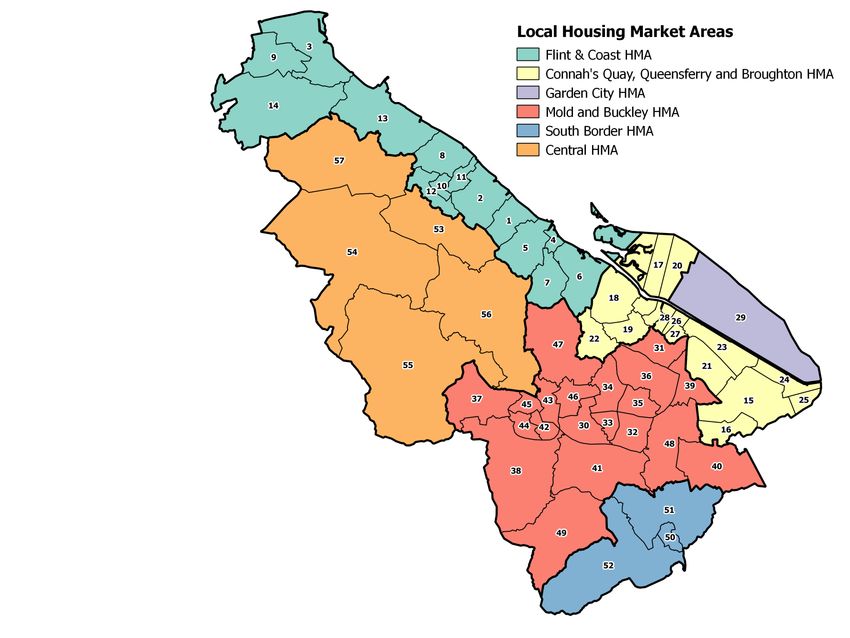
Flintshire LHMA 2014 - Draft Report                                                                                     Page | 3

        Introduction ..................................................................................................... 79
        Defining the housing market area ................................................................... 79
        Understanding the current housing position ................................................... 80
        Understanding the Future Housing Market ..................................................... 80
        Housing Need ................................................................................................. 81
        Monitoring and updating housing assessments .............................................. 82
        Concluding comments and recommendations ................................................ 83
Introduction to Technical Appendices .................................................................. 84
Technical Appendix A: Research Methodology ................................................... 85
        Overall approach ............................................................................................ 85
        Baseline dwelling stock information and survey sample errors ...................... 85
        Weighting and grossing .................................................................................. 85
        List of stakeholders interviewed as part of the SHMA process ....................... 86
Technical Appendix B: Housing need calculations ............................................. 87
        Summary of contents ...................................................................................... 87
        Introduction ..................................................................................................... 88
        Stage 1: C: Current need ............................................................................ 89
        Stage 2: A: Available stock to offset need ................................................... 91
        Stage 3: N: Newly arising need .................................................................. 92
        Stage 4: S: Supply of affordable units ......................................................... 93
        Net shortfall or surplus .................................................................................... 94
Technical Appendix C: A framework for updating the housing needs model
and assessment of affordable housing requirements ......................................... 97
        Introduction ..................................................................................................... 97
        Updating of baseline housing needs and affordable housing requirements ... 97
        Concluding comments .................................................................................... 99

List of tables
Table 3.1         House prices in Flintshire CB by sub-area ........................................... 21
Table 3.2         Relative affordability of lower quartile (LQ) prices by District
                  (residence based) ................................................................................ 23
Table 3.3         Relative affordability of median prices by District (residence based) ... 24
Table 3.4         Origin of moving households ............................................................... 25
Table 3.5         Summary of household moves in preceding 5 years ........................... 26
Table 3.6         Residential mobility – movement between different tenures ................ 28
Table 3.7         Residential mobility – profile of properties moved into by type and
                  size ...................................................................................................... 28

March 2015
Flintshire LHMA 2014 - Draft Report Page | 4
Table 3.8 First choice destination of households planning to move in next five
years .................................................................................................... 29
Table 4.1 Occupied Stock by sub-area ................................................................ 31
Table 4.2 Property type and size of occupied dwellings across Flintshire ........... 32
Table 4.3 Dissatisfaction with state of repair by sub-area, property tenure,
age and type ........................................................................................ 36
Table 4.4 Lower Quartile and median price and income required to be
affordable ............................................................................................. 39
Table 4.5 Profile of private rented sector in Flintshire County ............................. 43
Table 5.1 Primary market drivers ......................................................................... 48
Table 5.2 Household projections - Flintshire ........................................................ 50
Table 5.3 Housing market signals........................................................................ 52
Table 5.4 Dwelling completions Flintshire County 2009/10 to 2013/14............... 53
Table 5.5 Housing completions Flintshire and neighbouring LAs 2009/10 to
2013/14 ................................................................................................ 54
Table 5.6 Housing completions against local plan targets ................................... 54
Table 5.7 Open market dwelling stock and preferences ...................................... 55
Table 5.8 Open market dwelling stock and preferences ...................................... 55
Table 5.9 Comparison between current dwelling stock and market
aspirations/expectations ...................................................................... 57
Table 6.1 Summary of current housing need across Flintshire County................ 63
Table 6.2 Lower quartile market prices 2013 across Flintshire County................ 64
Table 6.3 Lower quartile private rents 2013/14 across Flintshire County ............ 64
Table 6.4 Needs Assessment Summary for Flintshire County ............................. 69
Table 6.5 Needs Assessment Summary by sub-area - Flintshire ........................ 70
Table 6.6 Range of dwelling required by bedroom size ....................................... 71
Table 6.7 Tenure preferences of existing households in need and newly-
forming households requiring affordable housing ................................ 71
Table 6.8 Affordability of intermediate tenure prices by existing households in
need and newly-forming households requiring affordable housing ...... 72
Table 6.9 Percentage of Population by Age Group.............................................. 73
Table 6.10 Popn. Estimates by Year and Age - Flintshire ..................................... 73
Table 6.11 Property type preferences.................................................................... 74
Table 6.12 Assistance required ............................................................................. 74
Table 6.13 Adaptations required either now or in next 5 years by age group ........ 75
Table 6.14 Characteristics of households previously homeless ............................ 76
Table A1 Households surveyed, response rates and sample errors ................... 86
March 2015Flintshire LHMA 2014 - Draft Report Page | 5
Table B1 Summary of current housing need across Flintshire County................ 89
Table B2 Lower quartile market prices 2013 across Flintshire County................ 90
Table B3 Lower quartile private rents 2013/14 across Flintshire County ............ 91
Table B4 Needs Assessment Summary for Flintshire County ............................. 95
Table B5 Needs Assessment Summary by sub-area - Flintshire ........................ 96
List of Charts
Figure 3.1 Wales Spatial Plan 2008 ...................................................................... 17
Figure 3.2 Median house price trends 2000 to 2014: Wrexham, Flintshire &
Wales ................................................................................................... 22
Figure 4.1 Property type by sub-area (%) ............................................................. 33
Figure 4.2 Property size by sub-area (%) ............................................................. 34
Figure 4.3 Flintshire County: tenure profile of occupied dwellings ........................ 37
Figure 4.4 Flintshire tenure profile by sub-area (%) .............................................. 38
Figure 5.1 Population projections Flintshire 2011-2036 ........................................ 49
List of Maps
Map 2.1 Flintshire context .................................................................................. 11
Map 3.1 Flintshire Local Housing Market Areas ................................................ 20
March 2015Flintshire LHMA 2014 - Draft Report Page | 6 Please note that in this report some of the tables include rounded figures. This can result in some column or row totals not adding up to 100 or to the anticipated row or column ‘total’ due to the use of rounded decimal figures. We include this description here as it covers all tables and associated textual commentary included. If tables or figures are to be used in-house then we recommend the addition of a similarly worded statement being included as a note to each table used. 4 arc Limited accepts no responsibility or liability for, and makes no representation or warranty with respect to, the accuracy or completeness of any third party information (including data) that is contained in this document. March 2015
Flintshire LHMA 2014 - Draft Report                                               Page | 7

1. Introduction

1.1     The 2015 Flintshire County Local Housing Market Assessment (LHMA)
        provides the latest available evidence to help to shape the future planning and
        housing policies of the area. This study will help inform the production of the
        Council’s Local Plan and Housing Strategy. This research provides an up-to-
        date analysis of the social, economic, housing and demographic situation
        across the area. In particular, the LHMA considers the housing market area of
        Wrexham and Flintshire, the functionality of the current housing market, the
        potential future demand for housing as well as assessing housing need.
1.2     The Flintshire County LHMA has been overseen by a Housing Market
        Partnership comprising Council housing and planning officers from both
        Wrexham and Flintshire Councils. There has been engagement with a range of
        stakeholders throughout the research process including developers/builders,
        Housing Association representatives, Estate Agents and Private Lettings
        Agents as well as through public engagement through the household survey.
1.3     To inform both individual local authority emerging plans and strategies as well
        as providing a compliant and robust mechanism to report combined data and
        evidence, this joint LHMA has been produced several thorough reports
        including:
        ● LHMA report for Flintshire County Council
        ● LHMA report for Wrexham County Borough Council
        ● An overarching report for both Wrexham and Flintshire Council areas.
1.4     This report sets out the detailed findings from the Local Housing Market
        Assessment for the Flintshire County Council area only. Details about the aims
        and objectives, the methodology used, and the overall policy context for the
        study are set out in the overarching report for the Wrexham and Flintshire Local
        Housing Market Assessment, which is published alongside this report.
1.5     To deliver the 2015 LHMA, a multi-method approach was adopted, which
        comprised:
        ● A sample survey of households across the Flintshire County Council area. A
          total of 15,198 households were contacted and 2,437 questionnaires were
          returned and used in data analysis. This represents a 16.0% response rate
          overall and total number of questionnaires returned was well in excess of
          the 1,500 recommended in Government guidance;
        ● Interviews with key stakeholders including Local Housing and Planning
          Authority representatives, Registered Social Landlords (RSLs), Estate
          Agents, Lettings Agents, Developers, Supporting People representatives;
        ● A review of relevant secondary data including the 2001 and 2011 census,
          house price trends, lettings data and Welsh Government Statistics.
1.6     Further information on the research methodology is presented within Technical
        Appendix A.

March 2015
Flintshire LHMA 2014 - Draft Report Page | 8
1.7 The findings from the study and its methodological approach of utilising
primary, secondary, and stakeholder information means that a comprehensive,
up-to-date, robust and defensible evidence base for policy development has
been completed which conforms to the Welsh Government’s Planning Policy
Wales advice and guidance.
1.8 As well as providing information and results for the Flintshire County Council
area as a whole, this report provides information for 6 internal sub-areas.
These sub-areas have been defined by the Flintshire County Council Local
Housing Strategy (2012 – 2017 ‘A Quality Home for Everyone’) and are
consistent with the previous Housing Market sub-areas produced for the
Authority in 2012. Evidence collated for this report suggests that these
boundaries still form the most appropriate internal Housing Market sub-areas
(shown on Plan 3.1).
1.9 This assessment does not therefore provide information on housing demand or
need at either administrative ward or Town and Community Council level, but is
intended to form the strategic basis for determining the appropriate type and
level of future housing for Flintshire County Council or across a combined
Wrexham and Flintshire area.
1.10 Whilst this housing assessment provides an informed up-to-date position
statement for housing need and demand, it is important to remember that
figures calculated under this model should not be used as a definitive measure
of housing need or as an absolute target figure. Instead the model and its
output is representative and reflective of any current level of imbalance within
the local housing market and so provides an indication of the scale, type, and
tenure of housing required in order to seek to redress such imbalance.
1.11 The Flintshire 2015 LHMA report is structured as follows:
● Chapter 2 reviews the local policy background to this study and establishes
the context within which this research needs to be positioned;
● Chapter 3 establishes the functional Local Housing Market Area;
● Chapter 4 assesses the current housing position;
● Chapter 5 assesses future housing demand and position;
● Chapter 6 uses primary and secondary data to assess local housing needs;
and
● Chapter 7 concludes the report with a summary of findings, comments, and
strategic recommendations.
Research methodology
1.12 The report includes a technical appendix, which provides detailed material that
underpins the needs assessment of the LHMA. The technical appendix
material includes:
● Research methodology (Appendix A);
● Housing need calculations (Appendix B); and
March 2015Flintshire LHMA 2014 - Draft Report Page | 9
● Monitoring and updating (Appendix C).
March 2015Flintshire LHMA 2014 - Draft Report Page | 10
2. Local context
Introduction
2.1 This section of the report provides a brief overview of the local context as it
relates to Flintshire County Council area; it should be read in conjunction with
the strategic policy context chapter of the overarching Wrexham and Flintshire
LHMA Contextual Report. This sets out the wider national and regional
strategic context. This chapter briefly summarises the local policy context, thus
providing the background within which these findings need to be interpreted.
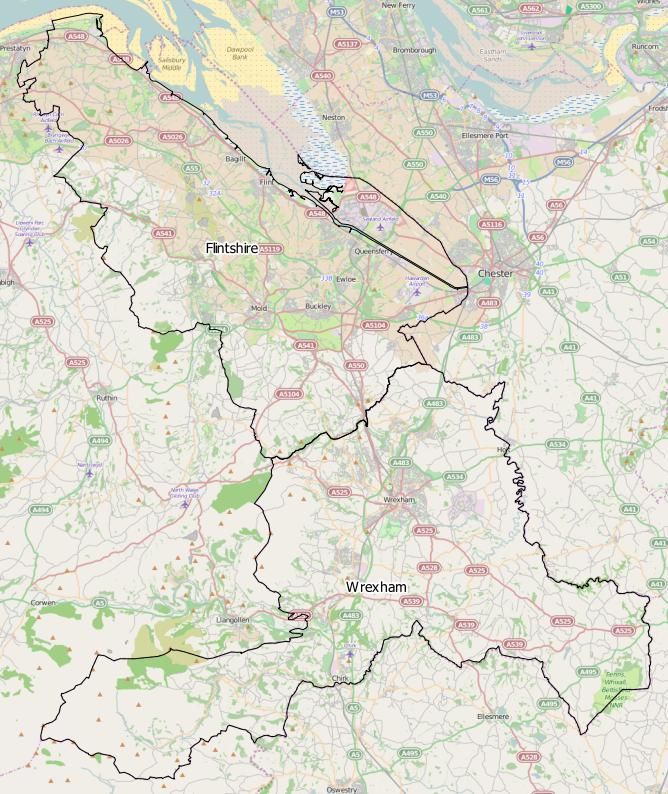
2.2 Flintshire occupies a unique border location in the North East corner of Wales,
serving as the gateway to North Wales. The County has a central role in the
operation of the sub-region and is characterised by diversity. ‘Flintshire boasts
a significant and prosperous industrial heartland, a thriving pattern of
settlements supporting a growing population, an effective transport network,
and a broad range of landscapes, environments, habitats and species, some of
internationally recognised importance’.1
1
Flintshire County Council Unitary Development Plan 2000 to 2015 para 1.2
March 2015Flintshire LHMA 2014 - Draft Report Page | 11 Map 2.1 Flintshire context March 2015
Flintshire LHMA 2014 - Draft Report                                                  Page | 12

2.3     This chapter looks at, in brief, the local strategic context in Flintshire in respect
        of:
        ● Corporate policy;
        ● Housing; and
        ● Planning.

        Corporate policy context
2.4     The Flintshire Community Strategy 2009-2019 sets out the vision for Flintshire
        as a place where:
        ● There is economic prosperity;
        ● There is health improvement;
        ● There are learning and skills for life;
        ● People live sustainably; and
        ● Communities are safe and supportive.
2.5     The Strategy goal is for Flintshire to be a place ‘built on fairness and respect
        where people feel confident in all aspects of their diversity regardless of age,
        disability, gender, language, race, religion or belief, and sexual orientation.’ The
        Strategy also promotes the Welsh Government’s national action plan to create
        a bilingual nation.
2.6     The County has a dedicated Regeneration Strategy (2009-2020), which aims to
        deliver a ‘sustainable, world class, modern economy, based on business
        enterprise and a highly motivated, well-trained workforce, supported by cutting-
        edge technology which maximises the area’s physical and human assets.’
2.7     Housing is seen as pivotal to delivering the objectives of the Regeneration
        Strategy. Alongside investment in improving both existing homes and their
        physical environment, delivering an adequate supply of quality new homes is
        identified as being essential to the economic success of the County.
2.8     Flintshire’s Wellbeing Plan, A Single Integrated Plan for Flintshire 2013-2017,
        has been developed by the Local Service Board (LSB), which is a multi-agency
        partnership. The Plan identifies four primary priorities:
        ● Lead by example as employers and Community Leaders;
        ● People are safe;
        ● People enjoy good health, wellbeing and independence; and
        ● Organisational environmental practice.
2.9     The Council is also developing a comprehensive, long-term Welfare Reform
        Strategy to help mitigate the impact of welfare reform locally. This Strategy is
        being developed in response to local evidence that the following may increase
        as a result of welfare reform:
        ● Homelessness;
        ● Demand for housing related support, welfare benefit and budgeting advice;

March 2015
Flintshire LHMA 2014 - Draft Report Page | 13
● Evictions in both the private and social housing sectors;
● Demand for smaller homes;
● The number of Houses in Multiple Occupation; and
● Pressure on both private and social rented housing.
Strategic housing context
2.10 The Flintshire Local Housing Strategy 2012-2017 ‘A Quality Home for
Everyone’, has three objectives, which are to deliver:
● More housing choice;
● Improve homes and communities; and
● Better services to improve people’s lives.
2.11 The Strategy is seen as a key policy driver locally to deliver a range of housing
programmes, including the Welsh Housing Quality Standard, regeneration and
renewal commitments, the Homelessness Strategy, Supporting People, and
work across the private rented sector.
More housing choice
2.12 Flintshire’s ambition is to increase the supply and variety of affordable homes,
by at least 740 new properties, over the lifetime of the Strategy by:
● Offering innovative affordable options designed to overcome financial
barriers to accessing the housing market; and
● Investing with partners in regeneration schemes such as the Flint Town
Centre Regeneration Project and the Deeside Growth Zone.
Improving homes and communities
2.13 The Council estimates that £166 million is needed to bring Council housing in
line with the Welsh Housing Quality Standard by March 2018. 32% of homes in
the private sector failed to meet the Decent Homes Standard. The Strategy
consequently prioritises:
● £49 million investment in Council housing;
● Offering a wide range of advice and loans and grants to owner occupiers
and landlords to eliminate Category 1 Hazards, bring empty homes back
into use, and increase energy efficiency; and
● Regenerate existing homes through the Connah’s Quay, Shotton and
Queensferry Renewal Area and the Townscape Heritage Initiative.
Better services to improve lives
2.14 The Council’s ambition is to collaborate and innovate to:
March 2015Flintshire LHMA 2014 - Draft Report Page | 14
● Improve access to suitable housing;
● Offer the best advice and support to sustain people living in their own
homes, irrespective of tenure;
● Promote independent living, especially for older people by investing in Extra
Care Schemes; and
● Ensure community safety.
2.15 The Council’s Local Housing Strategy sits within the wider local strategic
context and links to the Flintshire Community Strategy, the Regeneration
Strategy, and the Wellbeing Plan. It also sits alongside, and links with, the
Unitary Development Plan.
2.16 The Council’s 2010 Supporting People Strategy identified a series of
overarching key commissioning priorities, which are applied to all services
commissioned by Flintshire Supporting People. The commissioning priorities
are:
● To provide a range of support and accommodation models across all
vulnerable groups;
● To ensure that existing services are high quality and deliver positive
outcomes;
● To link with the Social Housing Grant (SHG) programme to facilitate new
development;
● To improve access to services, to ensure that services are flexible and able
to respond to a wider range of needs, are tenure neutral, and cross-
authority where appropriate;;
● To provide a mix of generic and more targeted services; and
● To develop an ‘outcomes framework’ for all services.
2.17 The subsequent Flintshire County Council Supporting People Local
Commissioning Plan 2013/14 provides a framework for the commissioning and
procurement of housing-related support based on the Supporting People
commissioning priorities identified in the 2010 Strategy. Actions set out within
the Plan were developed in conjunction with Flintshire’s Homeless Prevention
Strategy 2013.
2.18 The priorities of the Supporting People Strategy and Commissioning Plan
contribute to the Housing Strategy’s priority of delivering better services to
improve people’s lives.
Planning policy
2.19 The Council’s Unitary Development Plan (UDP) aims to ‘help shape Flintshire’s
future in a physical and environmental sense, as well as influencing it in
economic and social terms.’ The Plan runs from 2000 to 2015 and was adopted
in October 2011.
March 2015Flintshire LHMA 2014 - Draft Report Page | 15
2.20 The Council is currently working on a new Local Development Plan (LDP) for
the County. The LDP will focus on delivering sustainable development in the
County for a 15-year period 2015 to 2030 and will include:
● Policies that will guide decisions on planning applications;
● Proposals for the development of housing, retail, employment and other
land uses; and
● Policies that seek to protect and enhance the natural and built environment.
2.21 The Council’s Delivery Agreement, which sets out the proposed timetable for
delivering the LDP, was approved by the Welsh Government on 12 th February
2014. The Council proposes to adopt the LDP in February 2018.
Concluding comments
2.22 The main purpose of this chapter has been to consider the general local policy
and strategic context within which this research needs to be positioned. The
policy framework for housing and planning continues to change, meaning that
local flexibility and the ability to adapt to change is important. The National
context of austerity will continue to mean reduced capital expenditure on
housing, fundamental changes to the benefit system, a changing role for social
rented housing, and a need for future housing investment to support economic
growth. Economic uncertainty, lack of job security, and restricted mortgage
lending exacerbate the challenges faced.
2.23 The importance of having robust and up-to-date information to help inform
decision making at local authority level is more essential than ever. In a
challenging economic climate, this LHMA provides an excellent range of
material to inform policy debate, contribute to the delivery of a range of housing
interventions, help inform and influence strategic responses, and shape local
and regional strategic housing priorities to inform future investment plans within
the overarching priority of growing Flintshire’s economy.
March 2015Flintshire LHMA 2014 - Draft Report Page | 16
3. Defining the Housing Market Area
Introduction
3.1 The Local Housing Market Assessment Guidance (Welsh Government, March
2006) accepts that whilst previous housing-based assessments have been
based upon administrative or local authority boundaries, such boundaries are
not necessarily reflective of true functional housing market areas.
Subsequently, Local Housing Market Assessments should be based around an
understanding of ‘the area where the majority of households living or seeking to
move in the private housing sector are willing to search for alternative
accommodation’.2
3.2 More simply, a Housing Market Area can be defined and recognised as ‘the
geographical area within which there are clear links between where people live
and work’.3 The implications of such a broad definition include the
understanding that housing markets may operate across settlement, local
authority and in this case potentially national, boundaries.
3.3 The LHMA Guide (2006) recommended through the work of Bramley et al
(2000) that it may therefore be appropriate for two or three local neighbouring
authorities to work together as an approximation for the functional local
Housing Market Area.
3.4 Separate to this recommendation of approach there have been numerous
studies, commissions, and ongoing areas of work which recognise the
functional Housing Market Area within which Flintshire is located: the approach
within the Wales Spatial Plan 2008; the ongoing work (and basis for such) of
the Mersey Dee Alliance; the 2011 Simpson review; the more recent proposals
to reform the planning system in Wales as well as the Commission on Public
Service Governance and Delivery 2014 all directly inform and contribute
towards the justification for a joint Local Housing Market Assessment for the
authorities of Wrexham and Flintshire.
3.5 The Wales Spatial Plan 2008 update recognises and reflects the Welsh
Government’s understanding of the local housing markets, economic
characteristics and functional market boundaries nationally. It then describes
six functional areas, one of which covers the North East Wales Border and
Coast spatial area. Each spatial sub-area has been defined as a reflection of
the real operational linkages informing the daily activities for people living and
working within an area.
3.6 This Plan continues to recognise the very significant contribution to both the
Welsh and UK economy the Wrexham / Chester / Deeside economic hub
makes, with the prosperity of this area also closely linked with that of North
West England, in particular West Cheshire. These cross-border links are stated
as remaining crucial to the ongoing economic success of the sub-area with
2
LHMA Guide 2006 – Para 1.5
3
LHMA Guide 2006 – Para 2.3
March 2015Flintshire LHMA 2014 - Draft Report Page | 17
future opportunities and development targeted at harnessing, enhancing, and
maximising the special characteristics (including good quality travel and
communication networks, and the quality of environment) of the sub-area.
Figure 3.1 Wales Spatial Plan 2008
Source: Wales Spatial Plan
3.7 Taken from The Wales Spatial Plan, Figure 3.1 (above) recognises and reflects
the cross-border relationship for both Flintshire and Wrexham with Conwy and
Denbighshire. However, it also identifies these as being less influenced in
relation to travel to work. Accordingly the Spatial Plan suggests that these
areas (Conwy and Denbighshire) align more closely with each other and
westwards towards the North West Wales and Central Wales Spatial Plan
Areas. Reference to the Wales Spatial Plan is therefore useful as this in part
shapes both an understanding and basis for a combined approach to research
and policy between the Wrexham and Flintshire authority areas.
3.8 Other references which help to understand and define a Housing Market Area
include an understanding of the level or proportion of self-containment an area
experiences. In this regard the LHMA 2006 Guide (para 2.11) says that the
authorities ‘should consider household movement and the factors that impact
upon such flows. Functional housing market areas are partly defined by their
March 2015Flintshire LHMA 2014 - Draft Report Page | 18
degree of self-containment: i.e. the extent to which people move house within
an area. These patterns of movement reflect a variety of economic and social
factors including proximity to family and employment’.
3.9 This definition and reference is useful as it suggests several different sources
of information which can be used to further identify a Housing Market Area.
These include:
● House prices and rates of change in house prices;
● Household migration and search patterns;
● Contextual data (for example: travel to work area boundaries, retail and
school catchment areas).
3.10 The LHMA 2006 Guide recognises that the use of these types of data sources
can help to establish the level of relative self-containment of a housing market.
The more moves (migration and travel to work) which take place within an area,
the greater the level of self-containment and the greater the level of
understanding in defining a Housing Market Area.
3.11 However, there is caution in all approaches and definitions in that:
● HMAs are inherently difficult to define. They are a geographic
representation of people’s choices and preferences on the location of their
home, accounting for living and work patterns. They can be defined at
varying geographical scales from the national to sub-regional scales all the
way down to specific local and settlement scales; and
● HMAs are not definitive. As well as a spatial hierarchy of different markets
and sub-markets, they will inevitably overlap.
3.12 Flintshire County Borough is located within North East Wales and is home to a
resident population of 153,240.4 The Borough is bounded by the neighbouring
Welsh authorities of Wrexham and Denbighshire as well by Cheshire West and
Chester in England. The main population centres are in the towns of Flint,
Buckley, Deeside and Mold. The remainder of the population are located in
either a westward linear pattern extending along the Flintshire coast, within
more rural and dispersed communities to the central and western areas of the
County or in more commuter-based villages to the south and east.
3.13 In establishing the extent to which Flintshire County is a Housing Market Area,
house price, migration, travel to work, and contextual data have been
assembled.
House prices and rates of change in house prices
3.14 Figure 3.2 shows how house prices across the area have changed over the
period 2000 to 2014.
3.15 Median prices in Flintshire County have generally been slightly higher than the
median prices for Wales. Overall, prices have increased from £59,950 in 2000
4
2013 Mid Year Estimate StatsWales
March 2015Flintshire LHMA 2014 - Draft Report Page | 19
to £137,000 in 2014, an increase of 128.5%. Prices peaked at £141,375 in
2007 but dipped slightly in 2008 and have remained relatively stable since at
between £133,000 and £138,000.
3.16 For the purpose of this assessment the Housing Market Areas (HMAs) have
been defined by the Flintshire County Council Local Housing Strategy (2012 –
2017) and taken from previous HMA’s undertaken for the Authority. Evidence
collated for this report suggests that these boundaries still form the most
appropriate sub-areas within the County.
March 2015Flintshire LHMA 2014 - Draft Report Page | 20
Map 3.1 Flintshire Local Housing Market Areas
Flint and Coast HMA Mold and Buckley HMA
1 - Ba gi l l t Ea s t 30 - Argoed
2 - Ba gi l l t Wes t 31 - As ton
3 - Ffynnongroyw 32 - Buckl ey Bi s tre Ea s t
4 - Fl i nt Ca s tle 33 - Buckl ey Bi s tre Wes t
5 - Fl i nt Col es hi l l 34 - Buckl ey Mountai n
6 - Fl i nt Oa kenhol t 35 - Buckl ey Pentrobi n
7 - Fl i nt Trel a wny 36 - Ewl oe
8 - Greenfi el d 37 - Gwerna ffi el d
9 - Grona nt 38 - Gwernymynydd
10 - Hol ywel l Centra l 39 - Ha wa rden
11 - Hol ywel l Ea s t 40 - Hi gher Ki nnerton
12 - Hol ywel l Wes t 41 - Lees wood
13 - Mos tyn 42 - Mol d Broncoed
14 - Trel a wnyd a nd Gwa enys gor 43 - Mol d Ea s t
44 - Mol d South
Connah's Quay, Queensferry and Broughton HMA 45 - Mol d Wes t
15 - Broughton North Ea s t 46 - New Bri ghton
16 - Broughton South 47 - Northop
17 - Conna h's Qua y Centra l 48 - Penyffordd
18 - Conna h's Qua y Gol ftyn 49 - Treuddyn
19 - Conna h's Qua y South
20 - Conna h's Qua y Wepre South Border HMA
21 - Ma ncot 50 - Ca ergwrl e
22 - Northop Ha l l 51 - Hope
23 - Queens ferry 52 - Ll a nfynydd
24 - Sa l tney Mol d Junction
25 - Sa l tney Stonebri dge Central HMA
26 - Shotton Ea s t 53 - Brynford
27 - Shotton Hi gher 54 - Ca erwys
28 - Shotton Wes t 55 - Ci l ca i n
56 - Ha l kyn
Garden City HMA 57 - Whi tford
29 - Sea l a nd
March 2015Flintshire LHMA 2014 - Draft Report Page | 21
3.17 During the period 2013, median prices across Flintshire County were £137,000
and lower quartile prices were £108,500.
3.18 Table 3.1 summarises lower quartile, median, and upper quartile prices by sub-
area during the period January 2013 to December 1013 based on Land
Registry address-level data.
Table 3.1 House prices in Flintshire CB by sub-area
Price (£)
Lower Quartile Upper
Sub-area (25%) Median (5) Quartile (£)
Central £120,000 £171,000 £249,950
Connahs Quay, Queensferry & Broughton £102,500 £125,000 £157,500
Flint & Coast £85,000 £110,000 £140,000
Garden City £85,750 £102,500 £131,250
Mold & Buckley £124,995 £155,000 £199,950
South Border £135,000 £190,000 £255,000
Flintshire County £108,500 £137,000 £185,125
Source: Land Registry Price Paid Data 1 Jan 2013 to 31 December 2013
3.19 Figure 3.2 shows the median house prices for Wales and compares them over
time (14 years) with those for both Flintshire and Wrexham. This shows
consistently high levels of house price inflation through the early and mid
2000’s up to a peak in 2007. Median house prices then suffered a period of
devaluation reflective of the economic downturn and tighter lending restrictions
/ access to finance. Whilst there has been a slight general upturn in the housing
market from 2009 onwards, in Wrexham, Flintshire and Wales there has been a
continued period of relative stagnation in the housing market according to
prices.
March 2015Flintshire LHMA 2014 - Draft Report Page | 22 Figure 3.2 Median house price trends 2000 to 2014: Wrexham, Flintshire & Wales Source: Land Registry March 2015
Flintshire LHMA 2014 - Draft Report                                                     Page | 23

        Relative affordability
3.20    The relative affordability of open market dwellings in Flintshire County is
        compared with the other Local Authorities in Wales in Tables 3.2 and 3.3.
3.21    Table 3.2 presents lower quartile house prices, lower quartile gross earnings of
        full-time workers, and a ratio of lower quartile earnings to house prices. In
        terms of relative affordability, Flintshire is described as “moderately affordable”.
        This description is based upon comparison with other Welsh Local Authorities
        but does not imply that affordability is not an issue for Flintshire. Lower quartile
        house price to income ratio is 5.7: i.e. lower quartile house prices are 5.7 times
        quartile gross earnings. This compares with a Welsh average lower quartile
        house price to income ratio of 5.3.

Table 3.2        Relative affordability of lower quartile (LQ) prices by District (residence
based)
                                                  LQ Gross          Annual         LQ Income to
                                Lower Quartile
District                                         Earnings per       Gross          House Price
                                 House Price
                                                    week           Earnings            ratio
Monmouthshire                         £139,000       £367          £19,058              7.3
Ceredigion                            £125,000       £342          £17,779              7.0
Powys                                 £120,000       £338          £17,571              6.8
The Vale of Glamorgan                 £125,000       £359          £18,668              6.7
Pembrokeshire                         £115,000       £331          £17,186              6.7
Cardiff                               £125,000       £360          £18,694              6.7
Gwynedd                               £100,000       £303          £15,730              6.4
Denbighshire                          £100,000       £308          £16,037              6.2
Conwy                                 £110,000       £357          £18,548              5.9
Anglesey                              £104,000       £338          £17,597              5.9
Wrexham                                £99,950       £332          £17,274              5.8
Flintshire                            £110,000       £370          £19,250              5.7
Newport                                £95,000       £347          £18,018              5.3
Wales                                  £95,000       £347          £18,060              5.3
Torfaen                                £90,000       £338          £17,586              5.1
Bridgend                               £91,000       £356          £18,528              4.9
Swansea                                £90,000       £364          £18,944              4.8
Carmarthenshire                        £85,000       £359          £18,668              4.6
Caerphilly                             £81,000       £352          £18,288              4.4
Neath Port Talbot                      £72,000       £340          £17,680              4.1
Merthyr Tydfil                         £63,000       £320          £16,624              3.8
Rhondda, Cynon, Taff                   £62,000       £343          £17,841              3.5
Blaenau Gwent                          £52,000       £317          £16,494              3.2
Sources: Land Registry Price Paid 2013; Annual Survey of Hours and Earnings 2013

3.22    In terms of relative affordability based on median prices, Flintshire County is
        moderately affordable, with a median income to house price ratio of 5.2,
        compared to a Welsh average of 5.4. This is set out in Table 3.3.

March 2015
Flintshire LHMA 2014 - Draft Report Page | 24
Table 3.3 Relative affordability of median prices by District (residence based)
Median Gross Median Income
Median House Annual Gross
District Price
Earnings per
Earnings
to House Price
week ratio
Ceredigion £162,250 £435 £22,636 7.2
Powys £160,000 £425 £22,105 7.2
Pembrokeshire £150,000 £433 £22,490 6.7
Cardiff £165,000 £491 £25,527 6.5
The Vale of Glamorgan £175,000 £535 £27,799 6.3
Anglesey £142,500 £445 £23,130 6.2
Monmouthshire £185,000 £578 £30,035 6.2
Denbighshire £125,000 £417 £21,705 5.8
Gwynedd £136,000 £449 £23,327 5.8
Conwy £144,000 £516 £26,811 5.4
Wales £134,950 £479 £24,929 5.4
Newport £128,500 £462 £24,045 5.3
Flintshire £137,500 £510 £26,494 5.2
Wrexham £129,000 £480 £24,970 5.2
Bridgend £125,000 £481 £25,017 5.0
Torfaen £120,000 £468 £24,326 4.9
Swansea £125,000 £505 £26,250 4.8
Caerphilly £114,000 £471 £24,482 4.7
Carmarthenshire £120,000 £504 £26,203 4.6
Neath Port Talbot £99,000 £470 £24,419 4.1
Merthyr Tydfil £87,250 £435 £22,594 3.9
Rhondda, Cynon, Taff £92,000 £480 £24,955 3.7
Blaenau Gwent £71,750 £398 £20,712 3.5
Sources: Land Registry Price Paid 2013; Annual Survey of Hours and Earnings 2013
Household migration and search behaviour
3.23 Data reported in the 2011 Census suggests that 67.3% of households who
moved in the year preceding the Census originated from within Flintshire
County.
3.24 Table 3.4 summarises the origins of households based on 2011 Census data.
Of the 11,894 households moving into Flintshire, 8,470 (71.2%) originated from
Flintshire and Wrexham; 9,064 (76.2%) originated from Flintshire and Cheshire
West and Chester; and a total of 9,515 (80.0%) originated from Flintshire,
Wrexham and Cheshire West and Chester.
March 2015Flintshire LHMA 2014 - Draft Report Page | 25
Table 3.4 Origin of moving households
Origin of moving household Number %
Flintshire 8006 67.3
Cheshire West and Chester 1045 8.8
Wrexham 464 3.9
Denbighshire 430 3.6
Wirral 169 1.4
Liverpool 118 1.0
Conwy 112 0.9
Elsewhere 1150 13.0
Total 11,494 100
Source: 2011 Census
3.25 Data from the household survey indicated that around 14,338 households living
in Flintshire County had moved home in the preceding five years. Of these
households, 9,745 (68.0%) originated within Flintshire, 676 (4.7%) originated
within Wrexham and 3,917 (27.3%) originated from outside the area. This is
detailed by sub-area in Table 3.5.
March 2015Flintshire LHMA 2014 - Draft Report Page | 26
Table 3.5 Summary of household moves in preceding 5 years
Current sub-area of residence
Connahs Flint & Garden Mold & South
Origin Central Quay Coast City Buckley Border Total
Within Flintshire
Central 31.3 1.2 5.0 0.0 0.0 1.2 3.2
Connahs Quay Queensferry
3.0 56.7 1.6 31.0 7.1 0.0 22.7
Broughton
Flint and Coastal 10.6 3.6 59.4 0.0 3.4 1.2 14.5
Garden City 0.0 1.2 0.0 21.7 0.0 1.2 0.9
Mold & Buckley 8.3 10.2 2.4 11.1 54.4 20.1 24.7
South Border 0.7 0.0 0.0 0.0 2.1 31.9 2.1
Within Wrexham
North East 0.0 0.0 0.0 0.0 0.0 2.6 0.1
South East 0.0 0.0 0.0 0.0 0.5 0.0 0.2
South West 0.0 0.0 0.0 0.0 0.0 0.0 0.0
Western Border 0.0 1.2 0.0 2.2 1.0 15.0 1.4
Wrexham 0.0 1.2 0.0 0.0 6.4 8.2 3.0
Elsewhere
Denbighshire 21.0 0.5 7.6 3.4 2.6 0.0 3.8
Conwy 0.0 1.2 0.0 0.0 1.0 0.0 0.8
Elsewhere in Wales 2.5 3.6 0.0 0.0 0.0 0.7 1.4
Cheshire West and Chester 9.3 9.2 0.8 24.8 11.9 3.8 8.7
Shropshire 2.5 0.5 2.1 0.0 0.0 0.0 0.7
Merseyside including Wirral 1.4 2.4 1.7 1.2 2.0 0.0 2.0
Elsewhere in North West
4.8 0.0 9.5 4.6 1.6 6.8 3.0
England
Elsewhere UK 3.3 5.6 9.1 0.0 5.5 2.6 5.9
Outside UK 1.2 1.5 0.9 0.0 0.5 4.5 1.1
Total 100.0 100.0 100.0 100.0 100.0 100.0 100.0
Summary: Flintshire 54.0 72.9 68.3 63.8 67.0 55.7 68.0
Source: 2014 Household Survey
3.26 Table 3.5 indicates that in five sub-areas at least 60% of households moved
from within Flintshire. The exceptions were Central (54.0%) and South Border
(55.7%). It is worth noting Flint & Coast has the highest proportion of people
moving from elsewhere in the North West of England and elsewhere in the UK.
Flint & Coast and Mold & Buckley had the highest retention levels, with over
50% of households moving from within the same sub-area. By comparison,
only 21.7% of households moving in Garden City originated from Garden City.
March 2015Flintshire LHMA 2014 - Draft Report Page | 27
Characteristics of in-migrant households
3.27 The household survey identified around 4,600 households who had moved into
Flintshire County in the preceding five years. Information relating to in-migrant
households includes:
● A majority (71.1%) moved into a house, particularly detached (29.7%) and
semi-detached (32.5%), but few moving into terraced houses (8.9%); a
further 17.8% moved into a bungalow; 9.1% to a flat/apartment and 2.0% to
other property types;
● 34.5% moved into smaller properties with one or two bedrooms; 42.9%
moved into properties with three bedrooms and 22.7% into properties with
four or more bedrooms;
● 60.6% moved into owner occupied properties; 35.5% into private renting
and 4.0% moved into affordable (social rented/intermediate tenure)
dwellings;
● Overall, 36.5% of migrant households moved to Mold and Buckley, 28.3%
into Connahs Quay, Queensferry and Broughton, 19.0% into Flint and
Coast, 8.1% into Central, 5.5% into South Border and 2.5% into Garden
City sub-areas;
● 38.1% of in-migrant Household Reference People (Heads of Household)
were aged 16-39, a further 34.2% were aged 40-59 and 27.8% were aged
60 or over;
● The majority of Heads of Household of in-migrant households were in
employment (64.9%) with a further 21.5% retired, 7.1% permanently
sick/disabled and 2.3% looking after the home;
● 34.3% of households had a weekly income of less than £300, 21.1% had an
income of between £300 and £500 each week and 44.6% had an income of
at least £500 each week; and
● The main reasons for moving were to be closer to work/new job (19.7%), to
be closer to family/friends to give/receive support (11.7%), and wanting to
buy a larger property (11.5%).
3.28 In summary, 32.0% of households moving in the past five years originated from
outside Flintshire County. Of this number, 4.7% originated from Wrexham
County Borough and 27.3% from outside of the study area. Most moved into
the private housing sector, with around 60.6% moving into owner occupation
and 35.5% into private renting. Moving to be closer to work/new job and closer
to family/friends were key migration drivers. 72.3% of in-migrant households
had a Household Reference Person aged under 60 and 27.8% were aged 60
and over; overall 64.9% were in employment and 55.4% had an income (of
Household Reference Person and partner) of less than £500 each week.
Residential mobility within Flintshire County
3.29 The household survey identified that the vast majority (68.0%) of households
moving within the preceding five years had moved within Flintshire County
(around 9,700 households).
March 2015Flintshire LHMA 2014 - Draft Report Page | 28
3.30 Households moving within Flintshire County were doing so for a variety of
reasons. Those most frequently reported were wanting a larger property
(21.5%), being forced to move (8.8%) and to move to a better neighbourhood
(5.5%).
3.31 Table 3.6 reviews the tenure choices of households moving within Flintshire
County. Owner-occupiers are most likely to remain in the same tenure (69.8%),
while only 21.0% of private renters and 4.4% of affordable housing tenants
remained in the same tenure. 51.5% of private renters moved into affordable
(mainly Social Rented) accommodation and 95.6% of affordable housing
tenants moved into private rented accommodation. Respondents who had
previously lived with family and friends (i.e. newly forming households) moved
into all major tenures, but especially affordable accommodation (43.0%).
Table 3.6 Residential mobility – movement between different tenures
Previous Tenure
Previously
Social/Affordable Private living with
Current Tenure Owned Rented Rented family/friends Other Total
Owned 69.8 0.0 27.4 28.7 0.0 41.5
Social/Affordable 17.6 4.4 51.5 43.0 0.0 29.6
Private Rented 12.6 95.6 21.0 28.2 0.0 28.9
Total 100.0 100.0 100.0 100.0 100.0 100.0
Base 4039 1328 3029 1208 9628
Source: 2014 Household Survey
3.32 Table 3.7 considers the profile of dwellings being moved into by households
moving within Flintshire County. Households are moving into a variety of
dwelling types and sizes, most notably to: one (29.1%) and two (28.9%)
bedroom dwellings; and semi-detached (26.0%) houses.
Table 3.7 Residential mobility – profile of properties moved into by type and size
Property type (%)
Semi-detached
Detached house\ Terraced Flat/
No. Bedrooms house town house house Bungalow Apartment Total
One 0.1 7.0 7.5 9.0 5.4 29
Two 3.6 15.4 6.7 3.1 0.0 28.8
Three 9.0 0.5 0.6 0.2 0.1 10.4
Four 7.0 0.0 0.0 0.1 0.0 7.1
Five or more 1.4 0.0 0.0 0.2 0.0 1.6
Total 21.1 22.9 14.8 12.6 5.5 100.0
Base (valid responses) 9,742
March 2015Flintshire LHMA 2014 - Draft Report Page | 29
Households planning to move
3.33 Around 10,400 households plan to move in the next five years. Table 3.8
summarises the moving intentions of households based on the first preference
they stated. Overall, 76.1% of households intend on remaining in Flintshire
County and 23.9% intend to move out. This would suggest a strengthening of
Flintshire as a broadly self contained housing market.
3.34 Of the 23.9% of households planning to move out, only 0.4% were planning to
move to Wrexham County Borough. 5.2% were planning to move to Cheshire
West and Chester, 2.6% to Denbighshire and 4.9% to elsewhere in the UK.
3.35 The main reasons why households plan to move out of the Flintshire County
area were wanting a larger or better property (21.7%), needing a smaller
property (16.8%) and needing housing suitable for older/disabled person(s)
(11.9%).
Table 3.8 First choice destination of households planning to move in next five
years
Destination location % stating as first preference
Flintshire
Flint, Holywell & Coast 15.7
Chester Hinterland 5.6
Rural West Flintshire 11.9
Mold 14.3
Eastern Settlements 9.0
Ewloe 8.0
Queensferry & Connah’s Quay 11.7
Wrexham
Wrexham Town 0.0
North East Wrexham 0.2
South East Wrexham 0.0
Ceiriog Valley 0.0
West Wrexham 0.2
Elsewhere
Denbighshire 2.6
Conwy 1.9
Gwynedd 0.8
Isle of Anglesey 1.8
Elsewhere in Wales 1.5
Cheshire West and Chester 5.2
Shropshire 1.0
Merseyside (includes Wirral) 0.6
Elsewhere in North West England 1.8
Elsewhere UK 4.9
Outside UK 1.4
Total 100.0
Base 10,171
Source: 2014 Household Survey
March 2015Flintshire LHMA 2014 - Draft Report Page | 30
Travel to work trends
3.36 The 2011 Census provides an analysis of travel to work patterns and the extent
to which residents in Flintshire County travel to other areas together with details
of how many people commute into the area. The 2011 Census identified the
travel to work patterns of 69,276 individuals (using actual specified workplaces)
and of these:
● 43,733 lived and worked in Flintshire (including 6,697 who work at home);
● 23,817 commuted into Flintshire for work but lived outside the area; and
● 25,543 lived in Flintshire but commuted out of the area for work.
3.37 In addition, the 2011 Census also reports 132 residents working on offshore
installations, 4,891 with no fixed place of work and 122 working outside the UK.
3.38 Overall, 63.1% of Flintshire County residents worked in Flintshire, 15.4% in
Cheshire West and Chester, 6.6% in Wrexham and 0.4% in Shropshire.
Concluding comments
3.39 The purpose of this chapter has been to consider the general housing market
context of Flintshire County and its interrelationships with other areas. By
reviewing migration and travel to work patterns, a picture of the market
dynamics of Flintshire County emerges.
3.40 Analysis of 2011 Census migration data suggests that 63.7% of households
move within the Flintshire area and 63.1% of household reference people work
within the Flintshire area. Whilst recognising that both of these measures fall
just short of the typical 70% threshold level, Flintshire County can be described
as a broadly self-contained housing market. This description reflects the
assessed and defined housing market areas within both neighbouring local
authority areas of Cheshire West and Wrexham and the relationship between
these two areas. Flintshire is therefore part of the wider functional economic
areas including Wrexham and Cheshire West and Chester but experiences a
high and consistent level of self containment.
3.41 In keeping with good practice requirements (Planning Policy Wales Para 9.2.2),
the Wrexham and Flintshire LHMA has been produced in collaboration between
the two local authorities in order to better understand the dynamics of the wider
housing market in this part of North East Wales.
3.42 Whilst there are obvious interactions with Cheshire West and Chester, the level
of self-containment by household moves and travel to work, alongside national
guidance and regional economic evidence further strengthen the rationale for
undertaking this LHMA on a combined basis with the Wrexham County
Borough area.
March 2015Flintshire LHMA 2014 - Draft Report Page | 31
4. Understanding the Current Housing Position
Introduction
4.1 The purpose of this chapter is to explore the housing market dynamics of
Flintshire County focusing on: current stock profile and condition; tenure
characteristics; overcrowding and under-occupancy; and understanding the key
market drivers. The analysis within this chapter will help to understand the past
and current underlying market trends and conditions and will help inform the
understanding of current and future housing market drivers (covered in detail in
Chapter 5).
Estimates of current dwellings in terms of size, type,
condition, tenure
4.2 According to the 2011 Census, there were 65,795 dwellings and 63,781
households in Flintshire. The latest data from the Council would suggest a total
of 66,460 dwellings, with 64,108 occupied and an additional 2,352 vacant.
4.3 This study assumes a total of 64,108 occupied dwellings in Flintshire County
(Table 4.1).
Table 4.1 Occupied Stock by sub-area
Sub-area Total Households
Central 4476
Connahs Quay, Queensferry & Broughton 18576
Flint & Coast 14001
Garden City 1250
Mold & Buckley 23309
South Border 2496
Total 64108
Source: 2014 Council Tax
Property size and type
4.4 Table 4.2 reviews the profile of occupied dwelling stock by size and type across
Flintshire. Overall, the vast majority (73.3%) of properties are houses, 17.5%
are bungalows, 8.2% are flats/apartments and 0.9% are other types of property
including park homes/caravans. Of all occupied properties, 7.3% have one
bedroom/studio, 23.9% have two bedrooms, 48.0% have three bedrooms and
20.8% have four or more bedrooms.
March 2015You can also read