Deepwater biodiversity of the Kermadec Islands Coastal Marine Area - Science for conServation 319 - DOC
←
→
Page content transcription
If your browser does not render page correctly, please read the page content below

Science for conservation 319

Deepwater biodiversity of
the Kermadec Islands
Coastal Marine Area
Jennifer Beaumont, Ashley A. Rowden and Malcolm R. Clark
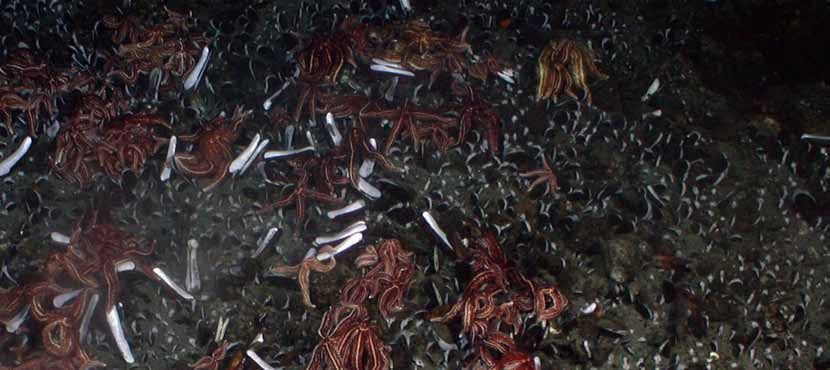
Cover: Dive PV616: an extensive, dense bed of the bivalave Gigantidus gladius with associated predatory Sclerasterias asteroids at a diffuse
hydrothermal vent site.

Science for Conservation is a scientific monograph series presenting research funded by New Zealand Department of Conservation (DOC).
Manuscripts are internally and externally peer-reviewed; resulting publications are considered part of the formal international scientific
literature.

This report is available from the departmental website in pdf form. Titles are listed in our catalogue on the website, refer
www.doc.govt.nz under Publications, then Science & technical.

© Copyright December 2012, New Zealand Department of Conservation

ISSN       1177–9241 (web PDF)
ISBN       978–0–478–14963–0 (web PDF)

This report was prepared for publication by the Publishing Team; editing by Sue Hallas and layout by Elspeth Hoskin and Lynette Clelland.
Publication was approved by the Deputy Director-General, Science and Technical Group, Department of Conservation, Wellington,
New Zealand.

Published by Publishing Team, Department of Conservation, PO Box 10420, The Terrace, Wellington 6143, New Zealand.

In the interest of forest conservation, we support paperless electronic publishing.
Contents

Abstract		                                                               1

1.   Introduction                                                        2

     1.1   Background                                                    2
     1.2   Previous seamount and vent studies in the region              3
     1.3   Project objective                                            4

2.   Methods                                                            4

     2.1   Study area and sites                                          4
     2.2   Data sources and selection                                    4
     2.3   Description of selected data                                 5
           2.3.1  MFish scientific onboard observer programme           5
           2.3.2  TAN0205 direct samples and still images               6
           2.3.3  KOK0505 and KOK0506 video and still images            9
     2.4   Data analysis                                                12
           2.4.1  Scientific observer data                              12
           2.4.2  Direct samples                                        12
           2.4.3  Still images                                          12
           2.4.4  Video                                                 13

3.   Results                                                            14

     3.1   Scientific observer data                                     14
           3.1.1    Species composition                                 14
           3.1.2    Species distributions                               15
     3.2   TAN0205 direct samples                                       16
     3.3   TAN0205 still images                                         16
           3.3.1 Hard substrate                                         17
           3.3.2 Coarse substrate                                       18
           3.3.3 Soft substrate                                         19
     3.4   KOK0505 and KOK0506 still images                             19
           3.4.1 Hard substrate                                         19
           3.4.2 Coarse substrate                                       20
           3.4.3 Soft substrates                                        20
     3.5   KOK0505 and KOK0506 video footage                            21
           3.5.1 Macauley: Dive PV616                                   22
           3.5.2 Macauley: Dive PV617                                   23
           3.5.3 Macauley: RCV-150, ROV dive 312                        24
           3.5.4 Giggenbach: Dive PV618                                 24
           3.5.5 Giggenbach: Dive PV619                                 24
           3.5.6 Giggenbach: Dive PV 620                                25
           3.5.7 Wright: Dive PV621                                     25
           3.5.8 Comparison of assemblage composition among seamounts   26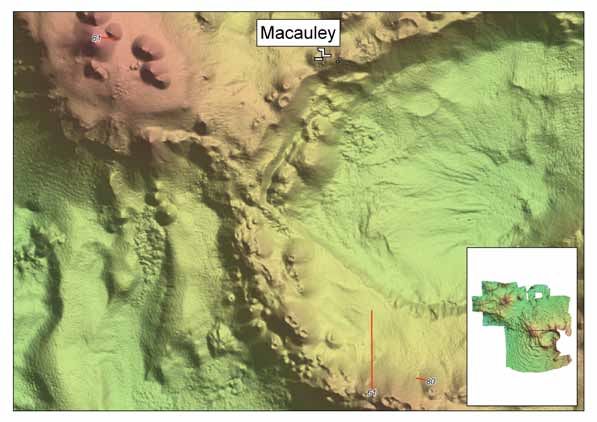
4.   Discussion                                                                                 27

     4.1   Limitations of the data                                                              27
     4.2   Assemblage composition and distribution patterns                                     27
     4.3   Significance of the study area                                                       28
           4.3.1   Uniqueness and rarity                                                        29
           4.3.2   Special importance for life-history stages of species                        29
           4.3.3   Importance for threatened, endangered or declining species and/or habitats   29
           4.3.4   Vulnerability, fragility, sensitivity or slow recovery                       29
           4.3.5   Biological productivity                                                      30
           4.3.6   Biological diversity                                                         30
           4.3.7   Naturalness                                                                  30
     4.4   Threats		                                                                            31

5.   Recommendations                                                                            32

6.   Acknowledgements                                                                           32

7.   References                                                                                 33

Appendix 1		                                                                                    36

     Taxa list, for each seamount, for TAN0205 direct samples                                   36

Appendix 2		                                                                                    48

     Taxa list for TAN0205 still images                                                         48

Appendix 3		                                                                                    49

     Pisces V and ROV dives                                                                     49

Appendix 4		                                                                                    56

     Taxa list for all Pisces V and ROV dives                                                   56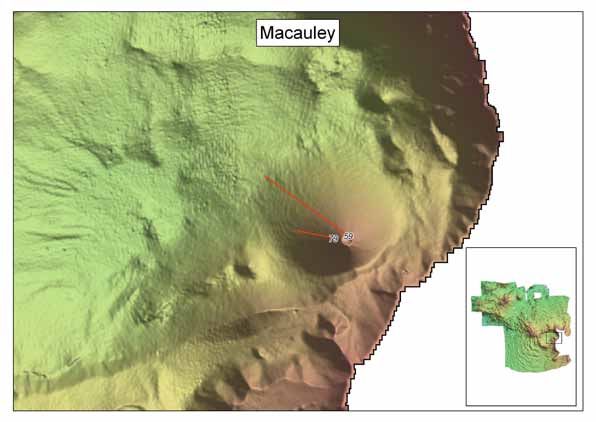
Deepwater biodiversity of the Kermadec
		 Islands Coastal Marine Area

		    Jennifer C. Beaumont, Ashley A. Rowden and Malcolm R. Clark
      National Institute of Water and Atmospheric Research Ltd, Private Bag 14901, Kilbirnie,
      Wellington 6241, New Zealand
      Email: a.rowden@niwa.co.nz

		Abstract
      The Kermadec region to the north of New Zealand, including the Kermadec Islands, has been
      noted as a ‘key biodiversity area’ for a variety of marine fauna. However, there has been limited
      scientific research at water depths below 100 m. The New Zealand Department of Conservation is
      undertaking a project to define the natural character of the region’s Coastal Marine Area (CMA),
      which includes the foreshore, seabed and coastal habitats. In addition, the project aims to identify
      natural assemblages that could be vulnerable to human disturbance. A variety of datasets held by
      the National Institute for Water and Atmosphere (NIWA) on the deepwater benthic biodiversity
      in the CMA and the surrounding area were analysed to contribute to our understanding of the
      character of the marine biological environment. Data from the scientific observer programme on
      fishing vessels, direct sampling, and seabed imagery from several seamounts and hydrothermal
      vents in the northern Kermadec area were analysed. Quantitative analysis revealed little or no
      difference in faunal assemblage composition among seamounts for direct sample and still image
      data. However, video data indicated that assemblage composition was largely different between
      Macauley, Giggenbach and Wright seamounts. This pattern is partly explained by the differences
      in water depth among these seamounts. A provisional assessment of the biological or ecological
      significance of the study area indicates that the Kermadec region satisfies a number of the
      criteria of the Convention on Biological Diversity for identifying such areas. Potential threats
      to seabed marine life in the area include disturbance from fishing, mining and pollution, and
      advection of invasive species by shipping. Small-scale, localised impacts may result from some
      kinds of scientific sampling.

      Keywords: Kermadec Islands, seamounts, hydrothermal vents, biodiversity, fish, invertebrates

      © Copyright December 2012, Department of Conservation. This paper may be cited as:

      Beaumont, J.C.; Rowden, A.A.; Clark, M.R. 2012: Deepwater biodiversity of the Kermadec Islands Coastal Marine Area.
           Science for Conservation 319. Department of Conservation, Wellington. 60 p.

      Science for Conservation 319                                                                                          1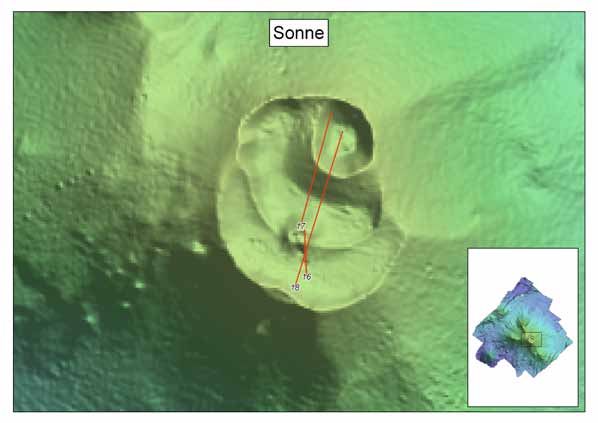
1. Introduction
    1.1   Background
          The Kermadec Ridge is a prominent feature of New Zealand’s underwater topography, extending
          from the outer Bay of Plenty northwards to Tonga (Fig. 1). It lies on the junction between the
          Pacific and Indo-Australian tectonic plates, where active subduction results in numerous
          submarine volcanoes that occur along an arc west of the ridge (e.g. de Ronde et al. 2001; Wright
          et al. 2006). The region is also interesting from an oceanographic perspective (as described in
          Sutton et al. 2012). For example, the Kermadec Ridge forms the western boundary of the deep
          South Pacific Ocean region and the resultant deep current that occurs below 2000 m is the
          South Pacific component of the global thermohaline circulation—an important part of the global
          climate system (Sutton et al. 2012).

          Figure 1. Bathymetric map of the northern Kermadec Ridge area showing the Kermadec Islands
          Coastal Marine Area (KICMA; black boundaries). The seamount sites included in this study are
          marked with squares and labelled with a name and seamount register ID number.

2         Beaumont et al.—Deepwater biodiversity of the Kermadec Islands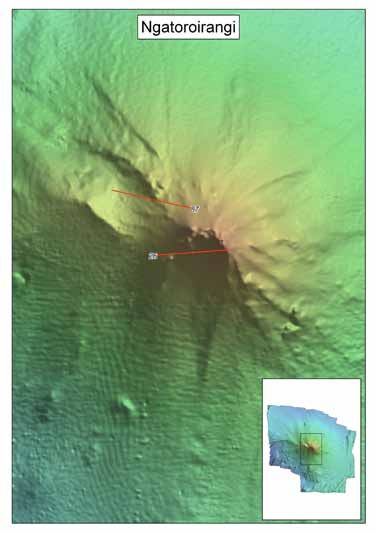
Knowledge of the nearshore shallow marine fauna of the Kermadec Islands, which emerge
      from the ridge, is reasonably good (e.g. Schiel et al. 1986; Cole et al. 1992; Brook 1998, 1999). The
      ecological significance of the islands and their surrounding waters was recognised in 1990 with the
      establishment of the Kermadec Islands Marine Reserve. The Kermadec region has been noted as
      a ‘key biodiversity area’ for a variety of marine fauna (Arnold 2004), and in 2007, the New Zealand
      government included the Kermadecs on its list of potential World Heritage Areas, which is a
      precursor for approval of that status by the UNESCO World Heritage Committee.
      The Minister of Conservation is developing a Regional Coastal Plan for the Coastal Marine
      Area (CMA1) of the Kermadec Islands. In support of this, the Department of Conservation
      (DOC) is undertaking a project to define the natural character of the CMA, and identify natural
      assemblages that could be vulnerable to human disturbance. This project includes summarising
      aspects of bathymetry, geology, water column processes, the marine biological environment,
      terrestrial–marine linkages, protected species information, and an evaluation of human activities.
      The Kermadec Islands CMA includes a large area offshore from the islands themselves that
      extends to depths of about 2500 m. However, there has been limited scientific research at
      depths below 100 m in the area, even though, in some places, such depths are close to the
      islands because of the steepness of the islands’ structures. Recent scientific surveys in the
      deeper water around the islands, and further south on the Kermadec Ridge, have tended to
      concentrate on geological aspects, but biological samples have also been taken. In particular,
      biological sampling has focused on documenting the biodiversity of seamounts and associated
      hydrothermal vents.

1.2   Previous seamount and vent studies in the region
      Kamenev et al. (1993) reported on Russian studies of a small number of vent sites in relatively
      shallow waters at the southernmost end of the Kermadec Volcanic Arc, noting that only a few
      vent-specific species were found at these locations. In 1998, a joint German and New Zealand
      expedition revisited the vicinity of the previously explored sites and also located sites of active
      venting on Brothers Volcano (Stoffers & Wright 1999). The biological information gained
      from this expedition is, in the main, yet to be formally analysed or reported upon (but some
      information is given in Wright et al. 2002).
      The National Institute for Water and Atmosphere (NIWA), funded by the former Foundation
      for Research, Science and Technology and the former Ministry of Fisheries (MFish)2, sampled
      Brothers, Rumble III and Rumble V seamounts in 2001, and Whakatane, Otara, Nukuhou,
      Tuatoru, Rungapapa, Mahina and Tumokemoke seamounts in 2004. Clark & O’Shea (2001)
      and Rowden et al. (2003) presented preliminary results of the 2001 survey, recording over 300
      macroinvertebrate species, of which at least 5% were undescribed for the New Zealand region.
      They found differences within and between seamounts; for example, Rumble V had two and
      three times more species than Rumble III and Brothers, respectively. Genetic studies of the
      vent mussel species revealed significant differences between the populations found at different
      seamounts (Smith et al. 2004). Rowden & Clark (2010) have presented preliminary results from
      the 2004 survey, recording over 500 macroinvertebrate species, of which 17% and 20% of bryozoan
      and sponge species, respectively, are undescribed for the New Zealand region. Differences were
      evident in the estimated number of species recorded for each seamount—Mahina and Nukuhou
      had the highest estimated number of species, Tumokemoke the least.

      1   The CMA includes the foreshore, seabed and coastal water of which the seaward boundary is the outer limits of the territorial sea
          (a distance of 12 nautical miles from the land) and the landward boundary is the line of mean high water springs (refer to Fig. 1).
      2   The Foundation for Research, Science and Technology is now part of the Ministry of Business, Innovation & Employment (MBIE)
          and the Ministry of Fisheries is part of the Ministry for Primary Industries (MPI).

      Science for Conservation 319                                                                                                          3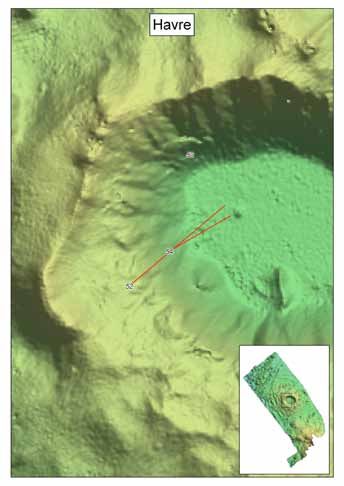
Two other international expeditions (the Japanese-New Zealand SWEEPVENTS Cruise in 2004
          and the New Zealand-American Submarine Ring of Fire Expedition in 2005) have also sampled
          seamounts on the Kermadec Arc. Preliminary reports suggest that vent communities differed
          between seamounts, and the communities had both similarities and differences to other western
          Pacific vent communities (Rowden & Clark 2005).
          Biological studies on Brothers and Rumble II seamounts have also been conducted as part of
          an exploratory minerals programme by Neptune Minerals Ltd. Community composition varied
          between sites and level of venting activity (Clark & Stewart 2005). Survey work with a remote-
          operated vehicle on Rumble II in 2007 was based on inactive sites and corals dominated the
          fauna on the chimney structures (Clark 2007). More recent research has been carried out between
          2010 and 1012 in programmes including the Kermadec ARc MinerAls (KARMA) Programme,
          Oceans 20/20, Vulnerable Deep Sea Communities and with Neptune Minerals Ltd.

    1.3   Project objective
          Although there have not been many biological surveys in the Kermadec Islands CMA, NIWA
          collections and databases hold samples, photographic imagery and data from the above and
          other surveys that have not been fully processed and analysed. This material and these data
          provide valuable information for DOC’s aim to define the natural character of the deepwater
          biodiversity of the CMA. Thus, the objective of the present study was to examine and
          analyse these data in order ‘to describe the deep-water (> 100 m) benthic invertebrate and fish
          assemblages of the Kermadec Islands Coastal Marine Area’. In addition, NIWA was asked
          subsequently by DOC to evaluate whether the CMA was a ‘significant area’ for deep-water fauna,
          to assess the threats posed by human activities and to make recommendations for future research
          in the area.

    2. Methods
    2.1   Study area and sites
          The Kermadec Islands CMA is a relatively small area, encompassing just one seamount for which
          data were available (Fig. 1). In order to provide a more comprehensive summary of the biological
          assemblages at depths greater than 100 m in the Kermadec region, the study area for the project
          was extended to include seamounts associated with the northern Kermadec Ridge area. This
          extended range encompassed nine different seamounts for which data were available: Sonne,
          Ngatoroirangi, Haungaroa, Wright, Havre, Macauley, GI4, GI9 and Giggenbach (Fig. 1).

    2.2   Data sources and selection
          Six data sources were identified for the Kermadec Islands CMA and wider northern Kermadec
          Ridge area (Table 1). The type and quality of data available varied considerably. Some datasets
          were suitable for quantitative analysis (data from TAN0205 and KOK scientific cruises), some for
          qualitative analysis (data from the scientific observer programme) and some were deemed to be
          unsuitable for analysis as part of this study (e.g. historical records, which included samples taken
          by the HMS Challenger and various New Zealand Oceanographic Institute surveys).

4         Beaumont et al.—Deepwater biodiversity of the Kermadec Islands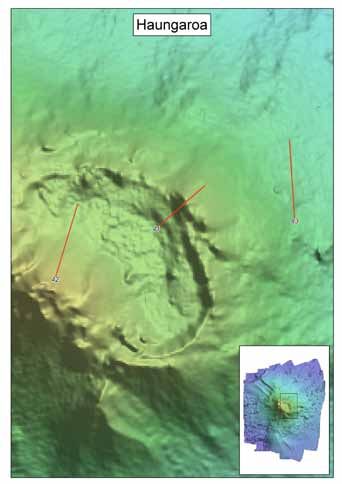
Ta b l e 1 .   D a t a s o u rc e s u s e d w i t h i n t h i s s t u d y.

                        Data source                            Type of data and method of                   Quantity available for analysis
                                                               collection

                         Scientific observer                   Fish: drop-, long-, hand-line                37 taxa from 284 line sets (4 areas)
                         programme
                         Historical NZOI &                     Macroinvertebrates: various direct gears     301 taxa from 119 stations
                         miscellaneous data*
                         TAN0205 scientific cruise             Macroinvertebrates: sled and/or dredge       420 taxa from 41 stations (6 sites)
                                                               Macrofauna: still images from tow            57 taxa from 14 stations (8 sites)
                                                               camera
                         KOK0505&0506 scientific               Macrofuana: direct collection by             32 taxa from 21 stations (3 sites)
                         cruises                               submersible
                                                               Macrofauna: video and still images from      113 taxa from 7 dives (3 sites)
                                                               submersible and Remote Operated
                                                               Vehicle (ROV)

                     * Data were unsuitable for analysis.

         2.3         Description of selected data
         2.3.1       MFish scientific onboard observer programme
                     Various research and commercial fishery databases were searched, and all records extracted for
                     the area of interest. No trawl data were found, and the only dataset used was the MFish observer
                     records from the obs_lfs database held at NIWA, Wellington. These records were obtained by
                     scientific observers placed onboard fishing vessels to monitor their fishing activities and any
                     seabird or marine mammal bycatch. A total of 284 catch records were extracted, comprising
                                                                            280 from drop- or dahn-lines, 3 from bottom
                                                                            long-lines and 1 from a handline. All data
                                                                            were combined, although it should be
                                                                            noted that the overall species composition
                                                                            reflected mainly the selectivity of drop-lines
                                                                            relative to the other methods where sample
                                                                            sizes were very small.
                                                                                                  The distribution of sampling records is
                                                                                                  shown in Fig. 2. There are four ‘clusters’ of
                                                                                                  data: one each north and south of Raoul
                                                                                                  Island, and then two further south, one near
                                                                                                  Macaulay Island, and one south of Curtis
                                                                                                  Island. The sets were targeted mainly at
                                                                                                  bass groper, bluenose and kingfish.

Figure 2. Location of sampling stations for MFish scientific observer data in the
study area.

                     Science for Conservation 319                                                                                                  5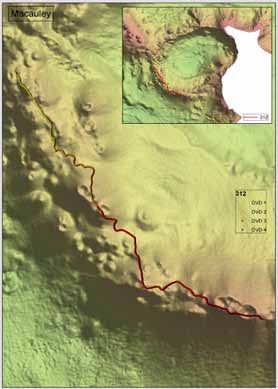
2.3.2           TAN0205 direct samples and still images
                    The TAN0205 scientific cruise was undertaken on the RV Tangaroa. Samples of
                    macroinvertebrate fauna were recovered, using a sled and/or dredge, from 41 stations on six
                    seamounts (Giggenbach, Macauley, Havre, Haungaroa, Ngatoroirangi, Sonne) in the study area.
                    A total of 300 images was captured from 14 stations on eight seamounts in the study area (in
                    addition to the above-listed seamounts, GI4 and GI9 were visited). A Teledyne Benthos camera
                    system was mounted in a rigid frame and took seafloor photographs when lowered to within 2 m
                    of the bottom. However, many of these photos were very dark and, because they were mostly
                    in black and white, faunal identification was difficult. As a result, only 115 of these images were
                    suitable for analysis, as summarised in Table 2.
                    The locations of TAN0205 stations are plotted in Figs 3–9 and depths are given in Table 3.

            Ta b l e 2 . S u m m a r y o f t h e 1 1 5 s t i l l i m a g e s f ro m     Ta b l e 3 . S e a m o u n t s , s t a t i o n n u m b e r s , a n d s t a r t
            t h e TAN 0 2 0 5 s c i e n t i f i c c r u i s e a v a i l a b l e f o r   a n d f i n i s h d e p t h s o f TAN 0 2 0 5 c a m e r a s t a t i o n s .
            analysis.
                                                                                          Seamount              Station Depth at                    Depth at
              Seamount	No. of	No. of	Total no.                                                                  number	start (m)                    finish (m)
                        tows	 images/tow of images
                                                                                          Sonne                      17               1060               1050
              Sonne                    2               7,28                  35           Sonne                      18               1050               1126
              Ngatoroirangi            1                 6                    6           Ngatoroirangi              26                793                405
              Haungaroa                2                8,5                  13           Haungaroa                  41               1219               1222
              Havre                    3               1,2,8                 11           Haungaroa                  42                730               1196
              Macauley                 3              11,6,8                 25           Havre                      52                996               1522
              Giggenbach               1                 9                    9           Havre                      53               1400               1400
              GI4                      1                 6                    6           Havre                      54               1134               1522
              GI9                      1                12                   12           Macauley                   59                305                989
                                                                                          Macauley                   61                511                828
                                                                                          Giggenbach                 69                  99               643
                                                                                          G14                        70                944               1253
                                                                                          G19                        71                885               1303
                                                                                          Macauley                   79                342                639

                    Figure 3. TAN0205 stations on Giggenbach seamount. Start and finish depths of these stations are given in Table 3.

6                   Beaumont et al.—Deepwater biodiversity of the Kermadec Islands
Figure 4. TAN0205 stations on Haungaroa seamount. Start and finish Figure 5. TAN0205 stations on Havre seamount. Start and finish
depths of these stations are given in Table 3. depths of these stations are given in Table 3.
Figure 6. TAN0205 stations on the northeastern area of Macauley seamount. Start and finish depths of these stations are
given in Table 3.
Science for Conservation 319 7Figure 7. TAN0205 stations on the southwestern area of Macauley seamount. Start and finish depths of these stations are
given in Table 3.
Figure 8. TAN0205 stations on Ngatoroirangi seamount. Start and finish
depths of these stations are given in Table 3.
8 Beaumont et al.—Deepwater biodiversity of the Kermadec IslandsFigure 9. TAN0205 stations on Sonne seamount. Start and finish depths of these stations are given in Table 3.
2.3.3 KOK0505 and KOK0506 video and still images
In 2005, a series of Pisces V submersible and Remote Operated Vehicle (ROV) dives were
conducted on seamounts in the study area from the RV Ka’imikai-o-Kanaloa (KOK). Both video
footage and still images were obtained.
The volcanic cone on the eastern caldera wall of Macaulay seamount (Macauley Cone) was the
target of two Pisces V submersible dives (616 and 617). The southern caldera rim of Macauley was
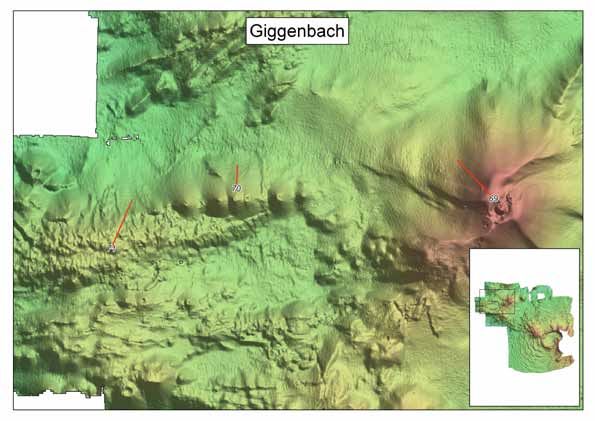
also observed using a ROV (dive 312). The main volcanic cone in the centre of the Giggenbach
seamount was observed by three Pisces V dives (618, 619 and 620). In particular, an active
hydrothermal vent site was explored in great detail on the northeast side of the main cone.
Pisces V dive 621 on Wright seamount targeted the eastern caldera, starting to the south and
moving up onto a central cone. The dives’ tracks on each seamount can be seen in Figs 10–13.
The depths of each dive are given in Table 4.
A total of 4900 images was collected by the Pisces V submersible on Macauley, Giggenbach and
Wright seamounts. However, many of these images were taken in very poor lighting and were,
therefore, unable to be analysed. Further, because the still camera on Pisces V automatically took
images every 15 seconds, many images were of the same location when the submersible stopped
to investigate an area in detail. Only one image from each location was analysed to avoid
repetitive sampling. As a result, only 366 images were suitable for analysis.
A total of 42 hours of video footage was recorded on the Pisces V and ROV dives on Macauley,
Giggenbach and Wright seamounts. The video recorder on the Pisces V dives was sometimes
manually operated to focus on areas of specific interest.
Data used from the KOK0505 and KOK0506 voyages are summarised in Table 5.
Science for Conservation 319 9Figure 10. Submersible tracks for dives 616 and 617 on Figure 11. Ship’s navigation file during ROV dive 312 on
Macauley seamount. Macauley seamount.
Figure 12. Submersible tracks for dives 618, 619 and 620 Figure 13. Submersible track for dive 621 on Wright
on Giggenbach seamount. seamount.
10 Beaumont et al.—Deepwater biodiversity of the Kermadec IslandsTa b l e 4 . M i n i m u m a n d m a x i m u m d e p t h s o f P i s c e s V d i v e s , t a k e n f ro m t h e P i s c e s V d i v e l o g s .
D e p t h i n f o r m a t i o n f o r ROV d i v e 3 1 2 w a s g e n e r a t e d f ro m b a t h y m e t r y d a t a w i t h i n a G I S .
Seamount Dive ID DVD number Minimum depth Maximum depth Mid-depth
(m) (m) (m)
Macauley 616 1 284 521 403
2 248 337 293
3 257 337 397
Overall 248 251 385
617 1 284 360 322
2 332 338 335
3 260 337 299
4 282 290 286
Overall 260 360 210
RCV312 1 564 661 613
2 548 661 605
3 455 723 589
4 396 450 423
Overall 396 723 560
Giggenbach 618 1 164 276 220
2 83 191 137
3 143 168 156
4 161 166 164
Overall 83 276 180
619 1 119 168 144
2 171 184 178
3 110 164 137
Overall 110 184 147
620 1 175 186 181
2 178 191 185
3 140 165 152
Overall 140 165 153
Wright 621 1 1155 1306 1231
2 1000 1158 1079
3 1031 1178 1105
Overall 1000 1178 1089
Ta b l e 5 . D a t a s u m m a r y f ro m K O K 0 5 0 5 a n d K O K 0 5 0 6 .
Seamount No. video Total time of Total time of No. still image No. still images
transects Pisces V video ROV video transects analysed
(hr) (hr)
Macauley 3 13.63 3.5 2 157
Giggenbach 3 19.25 – 2 137
Wright 1 5.98 – 1 70
Science for Conservation 319 112.4 Data analysis
As a result of the variation in gear types used, and the distribution and number of samples
available, the different data sources were analysed independently. It should be noted that the best
information was available from seamount sites, particularly those areas associated with active
hydrothermal venting.
2.4.1 Scientific observer data
The scientific observers recorded detailed catch composition information for each of the
observed long-line sets. These records were checked for consistency of taxonomic nomenclature,
and updated where species names had changed. Checks were also made for likely data-entry
mistakes (e.g. very high catch weights or numbers) before analysis. Each set was treated
separately as each deployment was in a different location. Most lines were thought to have
similar numbers of hooks, so no attempt was made to standardise effort, and the total catch from
each station was summarised.
2.4.2 Direct samples
Macroinvertebrates sampled by the sleds and dredges were identified to species or putative
species with the aid of microscopy and taxonomic keys. Data on presence/absence of
macroinvertebrate species were compiled prior to analysis. Data were analysed using PRIMER
v6, a suite of computer programs for multivariate analysis (Clarke & Gorley 2001; Clarke
& Warwick 2001; and see references therein for the routines mentioned below). A ranked
triangular similarity matrix for sample data was constructed using the Bray-Curtis similarity
measure (excluding the two samples with only one species). In order to visualise the pattern
of assemblage composition for the seamount samples, the similarity matrix was subjected to
non-metric multidimensional scaling (nMDS) to produce an ordination plot. A one-way analysis
of similarities (ANOSIM) test was carried out to test for differences in assemblage composition
between seamounts. The species contributing to the dissimilarity between samples from
different seamounts were investigated using the similarity percentages procedure SIMPER. The
relationships between multivariate assemblage composition and depth (mid-depth) of sled or
dredge tow were investigated using the BIOENV procedure (if any difference in assemblage
composition among seamounts was apparent).
2.4.3 Still images
Still images were analysed for faunal and substrate information using Image J software. It
was not possible to quantify faunal abundances in still images because of a lack of scaling
information on each image and parallax error (distortion due to the camera’s focal axis not being
parallel to the substrate). This meant that it was difficult to make comparisons between images,
stations or seamounts. However, it was possible to identify many taxonomic groups and these
were ranked using a relative abundance scale, SACFOR (Table 6). Estimates of percentage cover
were made for the different substrate size classes present in each image. The substrate classes
used were: bedrock, boulders, cobbles, pebbles, gravel, sand, muddy sand and mud. These size
classes were differentiated using the Wentworth scale (Table 7).
Faunal data from the still images were analysed, as for the direct samples, using routines in
PRIMER. Analysis of faunal data was carried out using a relatively low resolution of identification
owing to the poor quality of many images and the difficulties of accurate identification. This
was particularly true of many of the fish species. In order to avoid bias towards the easily
identifiable species, data were summarised by broad classes for multivariate analysis—for
example, ‘cartilaginous fish’ included all sharks and rays and ‘pelagic fish’ included fish species
such as kingfish, tarakihi etc. Analysis of data was conducted separately for images dominated by
hard substrates (bedrock, boulders and cobbles), coarse substrate (gravel and pebbles), and soft
substrates (sand, muddy sand and mud). Data were analysed as both presence/absence data and
using the SACFOR scale. Although coarse groupings were often used for multivariate analysis,
many species were identified to the lower taxonomic levels.
12 Beaumont et al.—Deepwater biodiversity of the Kermadec IslandsTa b l e 6 . S ACFOR a b u n d a n c e s c a l e ( s c a l e t a k e n f ro m J NCC 2 0 0 9 ) .
S = S u p e r a b u n d a n t , A = a b u n d a n t , C = c o m m o n , F = f re q u e n t , O = o c c a s i o n a l , R = r a re .
Percentage Size of organism Density Density
cover (/m 2 )
Crust/ Massive < 1 cm 1–3 cm 3–15 cm > 15 cm
meadow /Turf
> 80 S S >1/0.001 m2 >10 000
(1 x 1 cm)
40–79 A S A S 1–9/0.001 m2 1000–9999
20–39 C A C A S 1–9/0.01 m2
(10 x 10 cm) 100–999
10–19 F C F C A S 1–9/0.1 m2 10–99
5–9 O F O F C A 1–9
1–5 R O R O F C 1–9/10 m2
(3.16 x 3.16 m)
< 1 R R O F 1–9/100 m2
(10 x 10 m)
R O 1–9/1000 m2
(31.6 x 31.6 m)
R 25 cm at longest dimension
Cobbles 6–25 cm
Pebbles 0.4–6 cm
Gravel Up to 0.4 cm
Sand Course sediment, may have ripples or waves
Mud Fine and silty, typically with burrows and/or visible
invertebrate tracks
2.4.4 Video
DVDs of video footage were rendered as .mpg files using Sony Vegas video editing software
before being analysed using OFOP software (Greinert 2009). The quality of the video footage was
such that identification of fauna was mainly to major group. These data were recorded together
with an assignment of substrate type using the same classes as for the still images.
In principle, OFOP should allow the submersible and ROV navigation files to be linked to video
footage in order to obtain spatial information for the biological and substrate observations.
Unfortunately, there were incompatibility issues between the KOK video and/or navigation files
and OFOP, which meant that it was not possible to match precise spatial information with the
faunal and substrate data. As a result, each dive was analysed according to the DVD number
(three or four DVDs were recorded per dive) (see Figs 10–13) to allow some spatial information to
be attributed to the faunal and substrate data.
As for the direct samples and still images, routines in PRIMER were used to compare the faunal
assemblages on seamounts using presence/absence data on the species and faunal groups
identified for each submersible or ROV dive.
Science for Conservation 319 133. Results
3.1 Scientific observer data
3.1.1 Species composition
A total of 37 species or groups of fish was identified by the observers (Table 8). The main species
by weight (each having a catch total over 1 t) were bluenose (Hyperoglyphe antarctica), kingfish
(Seriola lalandi), bass groper (Polyprion americanus), spiny dogfish (Squalus acanthias), king
tarakihi (Nemadactylus sp.) and convict groper (Epinephelus octofasciatus).
Ta b l e 8 . S u m m a r y o f s p e c i e s ( c o m m o n n a m e , s p e c i e s n a m e , M F i s h c o d e ) a n d t o t a l c a t c h
w e i g h t ( k g ) f ro m t h e M F i s h o b s e r v e r d a t a b a s e .
Common name Species Code Catch (kg)
Alfonsino Beryx splendens &
B. decadactylus BYX 1
Bass groper Polyprion americanus BAS 3442
Bluenose Hyperoglyphe antarctica BNS 5506
Bronze whaler Carcharhinus brachyurus BWH 60
Carpet shark Cephaloscyllium isabellum CAR
Catshark Apristurus spp. CSH 13
Common warehou Seriolella brama WAR 35
Convict groper Epinephelus octofasciatus CGR 1084
Deepwater dogfish Various DWD 38
Dwarf scorpionfish Scorpaena papillosa RSC 3
Galapagos shark Carcharhinus galapagensis CGA 380
Hapuku Polyprion oxygeneios HAP 138
Kingfish Seriola lalandi KIN 5213
King tarakihi Nemadactylus sp. KTA 1238
Luciosudus Luciosudus sp. LUC 1
Mandarin shark Cirrhigaleus barbifer MSH 21
Moray eel Muraenidae (Family) MOR 1
Northern spiny dogfish Squalus griffini NSD 513
Orange wrasse Pseudolabrus luculentus OWR 1
Parrotfish Scaridae (Family) POT 2
Pink maomao Caprodon longimanus PMA 2
Rattails Macrouridae (Family) RAT 1
Rays Several families (e.g. Torpedinidae) RAY 10
Red snapper Centroberyx affinis RSN 121
Ribaldo Mora moro RIB 4
Rig Mustelus lenticulatus SPO 19
Ruby snapper Etelis coruscans ETE 4
Rudderfish Centrolophus niger RUD
Seaperch Helicolenus spp. SPE 7
Shovelnose spiny dogfish Deania calcea SND 22
Spiny dogfish Squalus acanthias SPD 1568
Swollenhead conger Bassanago bulbiceps SCO 30
Tarakihi Nemadactylus macropterus TAR 236
Trevally Pseudocaranx dentex TRE 333
Warehou Seriolella labyrinthica SEL 270
Yellow-banded perch Acanthistius cinctus YBP 3
Yellow moray eel Gymnothorax prasinus MOY 1
Unidentified UNI 6
14 Beaumont et al.—Deepwater biodiversity of the Kermadec Islands3.1.2 Species distributions
The main target species had differing distributions of catch (Fig. 14). Bluenose were caught
mainly at the southern stations, with a catch rate of up to 840 kg/set. Catches of this species
around Raoul Island were generally low. Bass groper were caught throughout the sampling area,
but catches north of Raoul Island were small. Kingfish and convict groper were taken at the
three northern sites, but maximum catch rates of both species were considerably lower than for
bluenose and bass groper.
Geographic differences in species composition are also seen in Fig. 15, where the main
species are plotted as a percentage of the total catch in the four ‘clusters’ of data mentioned in
section 2.3.1. Effort varied between the four areas, and so actual catch weights are not presented.
Figure 14. Catch rates (kg/set of a line) for the main target species: A. Bluenose (Hyperoglyphe antarctica) (maximum circle
size is 840 kg). B. Bass groper (Polyprion americanus) (maximum circle size 330 kg). C. Kingfish (Seriola lalandi) (maximum
circle size 150 kg). D. Convict groper (Epinephelus octofasciatus) (maximum circle size 140 kg).
Figure 15. Catch composition in the four areas. Species codes are given in Table 7.
Science for Conservation 319 15The northern area was dominated by kingfish, northern spiny dogfish and tarakihi, with the other
species being relatively minor bycatch. Just south of Raoul Island, the fish assemblage consisted
largely of kingfish, with bass groper and northern spiny dogfish. The fish assemblage in the area
to the southwest comprised bluenose, convict groper and kingfish, while the southern area had
lower diversity, with catches dominated by bluenose and bass groper.
3.2 TAN0205 direct samples
Over 400 putative species were recorded from the samples collected on the six seamounts
within the study area (Appendix 1). The number of species per sample ranged from 1 to 82,
while the mean number of species per sample was: Giggenbach—8 (n = 5), Macauley—27 (n = 7),
Havre—14 (n = 8), Haungaroa—15 (n = 8), Ngatoroirangi—18 (n = 6) and Sonne—12 (n = 7). Taking
into consideration the different number of samples from each seamount, these results suggest
that there is little difference in the number of species sampled from each seamount, with the
exception of Macauley, which appears more species rich.
The nMDS plot of samples from the TAN0205 survey, excluding one outlier sample from Macauley
seamount (the single sample of hydrothermal vent fauna), illustrates that there is relatively little
apparent difference in assemblage composition among seamounts (a lack of clustering indicates
little or no variability; Fig. 16). The formal ANOSIM test confirmed that there is only a very small,
yet statistically significant, difference in assemblage composition (R = 0.18, p < 0.001).
Figure 16. nMDS plot of Bray-Curtis similarities of presence/absence data from
TAN0205 sled and dredge samples.
3.3 TAN0205 still images
The number of distinct taxa identified to the lowest possible level per taxonomic group in still
images from each seamount is shown in Fig. 17. Overall taxa diversity was relatively low (57 taxa),
although noticeably more taxa were observed at some seamounts (Ngatoroirangi—13, G19—15,
Macauley—11) than others (Sonne—5, Haungaroa—6, Havre—4, Giggenbach—5, G14—5).
A species list is given in Appendix 2.
The characterising fauna of assemblages, and the differences in assemblage composition
between seamounts and locations on seamounts, were determined according to the dominant
substrate type, as described below.
16 Beaumont et al.—Deepwater biodiversity of the Kermadec IslandsFigure 17. Graph showing the taxonomic diversity of fauna observed in the TAN0205 still images from each seamount.
3.3.1 Hard substrate
Images dominated by hard substrate were characterised by the presence of gorgonians,
echinoids, ophiuroids, benthic fish, alcyonaceans, gastropods and asteroids (characterising
taxa were identified here, as later, using SIMPER). There was little variability in assemblage
composition among seamounts (as illustrated by the lack of clustering in the nMDS ordination
plot, Fig. 18). Formal ANOSIM tests showed there to be very little difference between the
faunal assemblages on seamounts for either the presence/absence data or the SACFOR data
(R values < 0.15, p < 0.01). The largest significant difference in assemblage composition between
individual seamounts, as revealed by pairwise comparison, was between Ngatoroirangi and G19
seamounts (R = 0.44, p < 0.05). While no detailed depth information was available for each image,
the mid-depth (between start and finish depths) of each station was used as an overlay on the
nMDS plot. There was no apparent relationship between depth and faunal assemblage pattern
(Fig. 19).
Figure 18. nMDS plot of Bray-Curtis similarities of SACFOR abundance data from
TAN0205 images dominated by hard substrates (bedrock, boulder, cobble).
Science for Conservation 319 17Figure 19. nMDS plot of Bray-Curtis similarities of SACFOR data from TAN0205
images (dominated by hard substrates) with depth overlaid as a bubble plot.
3.3.2 Coarse substrate
Images dominated by coarse substrate were characterised by the presence of ophiuroids,
asteroids, gastropods and anemones. No apparent clustering was seen within the nMDS plot
in Fig. 20 suggesting little variability in assemblage composition among seamounts. ANOSIM
tests showed there to be no significant differences between stations (R values negative, p > 0.05)
for either presence/absence data or SACFOR data. Again, no obvious relationship was present
between depth and faunal assemblage pattern (Fig. 21).
Figure 20. nMDS plot of Bray-Curtis similarities of SACFOR abundance data from
TAN0205 images dominated by coarse substrates (pebble, gravel).
Figure 21. nMDS plot of Bray-Curtis similarities of SACFOR data from TAN0205
images (dominated by coarse substrates) with depth overlaid as a bubble plot.
18 Beaumont et al.—Deepwater biodiversity of the Kermadec Islands3.3.3 Soft substrate
Images dominated by soft substrate were characterised by benthic fish, ophiuroids, echinoids
and asteroids. As for the hard substrate data, the nMDS plot (Fig. 22) and ANOSIM tests (for
both presence/absence and SACFOR data) revealed that there was effectively no difference in
assemblage composition among seamounts (R values < 0.1, p < 0.05). No obvious relationship was
present between depth and faunal assemblage pattern (Fig. 23).
Figure 22. nMDS plot of Bray-Curtis similarities of SACFOR abundance data from
TAN0205 images dominated by soft sediments (sand, mud, muddy sediment).
Figure 23. nMDS plot of Bray-Curtis similarities of SACFOR data from TAN0205
images (dominated by soft sediments) with depth overlaid as a bubble plot.
3.4 KOK0505 and KOK0506 still images
3.4.1 Hard substrate
Images dominated by hard substrate were characterised by the thermophilic tongue fish
(Symphurus sp.), crabs, Vulcanidas insolatus (von Cosel & Marshall 2012) (a vent mussel),
asteroids, cup corals, benthic fish, gastropods, pelagic fish, hydroids and anemones. There was
little variation in community assemblage composition on hard substrates between dives or
seamounts (Fig. 24). The ANOSIM tests (for both presence/absence and SACFOR data) indicated
that there were only very small, yet statistically significant, differences in the composition of
assemblages on the three study seamounts (R values = 0.1, p < 0.01).
Science for Conservation 319 19Figure 24. nMDS plot of Bray-Curtis similarities of SACFOR abundance data from
images dominated by hard substrates (bedrock, boulders, cobbles).
Circles = Macauley, squares = Giggenbach and diamonds = Wright.
3.4.2 Coarse substrate
Images dominated by coarse substrate were generally characterised by the presence of different
coral taxa, benthic fish and anemones. No apparent differences were seen in faunal assemblage
composition associated with coarse substrates between dives or seamounts (Fig. 25). The
ANOSIM tests (for both presence/absence and SACFOR data) confirmed that there was no
statistically significant difference in the assemblage composition for this substrate type among
the study seamounts (R values < 0.1, p > 0.05).
Figure 25. nMDS plot of Bray-Curtis similarities of SACFOR abundance data for
images dominated by coarse substrates (pebbles, gravel). Circles = Macauley,
squares = Giggenbach and diamonds = Wright.
3.4.3 Soft substrates
Images dominated by soft substrate were generally characterised by the tongue fish and
V. insolatus. The nMDS plot illustrated that there was little apparent difference in the
composition of faunal assemblages associated with soft substrates between dives or seamounts
on Macauley and Giggenbach (soft substrate did not dominate any images from Wright
seamount) (Fig. 26). The ANOSIM tests (for both presence/absence and SACFOR data) indicated
that there was only a very small difference in composition (R values < 0.15, p < 0.05).
20 Beaumont et al.—Deepwater biodiversity of the Kermadec IslandsFigure 26. nMDS plot of Bray-Curtis similarities of SACFOR abundance data for
images dominated by soft sediments (sand, mud, muddy sediment). Circles =
Macauley, squares = Giggenbach. There were no images dominated by soft sediments
at Wright seamount.
3.5 KOK0505 and KOK0506 video footage
The numbers of distinct taxa identified to the lowest possible level per taxonomic group in the
video images from each dive and seamount are shown in Fig. 27. Overall diversity appeared to
be high (102 taxa), with some indications of relatively high taxonomic distinctness. It can be
seen that, for all dives on all the seamounts studied, bony fish had the greatest species richness.
However, there were apparent differences both within and between the different seamounts. For
example, more taxa were present on Macauley (dives 616, 617 and 312) than on Giggenbach (dives
618, 619 and 620). The highest number of taxa represented was recorded for dive 312 on Macauley
(n = 33), whereas dive PV620 on Giggenbach had the least taxa (n = 6), though it is important to
Figure 27. Graph showing the taxonomic diversity of fauna observed on each Pisces V and ROV dive at each of
Macauley, Giggenbach and Wright seamounts.
Science for Conservation 319 21note that the amount of video footage analysed varied between seamounts (see Table 5). The
assemblage composition of individual dives is discussed in detail below, before the results of the
comparison of the assemblage composition among seamounts are presented.
A detailed description of all Pisces V and ROV dives is given in Appendix 3. A full list of taxa for
each dive is given in Appendix 4.
3.5.1 Macauley: Dive PV616
The area of Macauley surveyed on dive PV616 had a mixture of hard bedrock, breccia, sandy
substrate and areas of bacterial mat (Fig. 28). Faunal assemblages on hard substrate generally
had a low fish and invertebrate abundance and diversity (see Figs 29 & 30). However, some dense
beds of the vent mussels Gigantidas gladius and V. insolatus were observed, particularly in soft
sediment areas, together with large numbers of predatory asteroids (probably Sclerasterias
mollis and S. eructans). One of the more notable observations was that of a deep sea blind
lobster (Polycheles enthrix), sitting exposed on some breccia. This species is not often observed,
particularly not away from the soft sediments in which it is usually partially buried (Shane
Ahyong, NIWA, pers. comm. 2009).
Figure 28. Dive PV616: on top of the caldera ridge. Mixed sediment Figure 29. Dive PV616: the area is barren with respect to visible faunal
(cobbles, pebbles and soft sediment) often with a layer of bacterial mat. life—with the exception of a sea perch (Helicolenus sp.).
Some tongue fish (Symphurus sp.) and the occasional asteroid were
present.
Figure 30. Dive PV616: a wall of hard substratum. Very little encrusting
or mobile faunal life was observed on these structures.
22 Beaumont et al.—Deepwater biodiversity of the Kermadec IslandsActive hydrothermal vent sites were seen, together with elemental sulphur deposits. Tongue fish
(probably Symphurus thermophilis (Munroe & Hashimoto 2008) and Xenograpsus ngatama
(a crab) were associated with these active vents.
3.5.2 Macauley: Dive PV617
Areas of non-active hydrothermal venting were relatively barren of fauna (Fig. 31). However, some
dense beds of G. gladius and associated asteroids (Sclerasterias), together with patches of
V. insolatus, were observed (Fig. 32). Fish diversity was relatively low. Of note were two sightings
of coffin fish (Chaunax sp.).
Some very large areas of active hydrothermal venting were observed on this dive. The dominant
benthic fauna in these areas comprised the tongue fish and X. ngatama (Fig. 33). Large areas of
vertical or near vertical walls with very low faunal diversity and biomass were also seen
(e.g. Fig. 34).
Figure 31. Dive PV617: this frame grab from video footage shows how Figure 32. Dive PV617: an extensive, dense, bed of the bivalve
barren much of the hard substrate was in this dive. Gigantidus gladius with associated predatory Sclerasterias
asteroids.
Figure 33. Dive PV617: interesting formations of sulphur deposits Figure 34. Dive PV617: hard substratum mostly barren of encrusting
interspersed with hard substrate and soft sediments. Note the presence life with the exception of a few tube worms and some Vulcanidas
of a few asteroids, tongue fish (Symphurus sp.) and Xenograpsus crabs. insolatus. The fish is a bass (Polyprion moeone).
Science for Conservation 319 233.5.3 Macauley: RCV-150, ROV dive 312
The seabed in this area of Macauley was dominated by hard substrata, irregular outcrops of
bedrock with some boulders and some gravel, although there were a few soft sediment areas. On
occasions, there were unusual sheet–plate bedrock formations (Fig. 35). No active hydrothermal
venting was observed.
An unidentified stalked crinoid was by far the most numerous organism observed on this
dive, sometimes in large, very dense patches (Fig. 36). Faunal (invertebrate) diversity was high
and included numerous scleractinian corals, gorgonians and ‘armless’ brisingid seastars. Fish
diversity was low. Unusual observations included a large red-orange squid (probably a member
of Ommastrephidae) and a shark egg case (probably from a catshark, Apristurus sp.). Also of note
was a broken up cetacean skull, possibly of a rough-toothed dolphin (Steno bredanensis; to be
confirmed; Anton van Helden, Te Papa Tongarewa, pers. comm., 2009).
Figure 35. Dive 312: a frame-grab from video footage showing unusual Figure 36. Dive 312: this frame-grab from video footage shows an
plate-like sediment formations. This substrate was relatively barren of area of hard substrate supporting a dense population of an unidentified
visible faunal life with the exception of a few cnidarians (mostly cup stalked crinoid.
corals and gorgonians).
3.5.4 Giggenbach: Dive PV618
This dive had some quite distinct areas with respect to topography and biology. There were large
areas of bedrock, sometimes lava-like, and often with a soft-sediment overlay as well as extensive
areas of sand (possibly ash deposits) with ripples present. The faunal assemblage in these areas
was dominated by gorgonians and a wide variety of fish. Active and/or diffuse hydrothermal
vent sites (sometimes bubbling) were associated with bacterial mat, V. insolatus and predatory
asteroids (Sclerasterias spp.) (Fig. 37). An unidentified crab (possibly X. ngatama) was also
observed at one vent site. There was also an area of large (> 2 m tall) chimneys with very little
sessile or invertebrate life but with an abundant fish life.
In the shallower depths of the Giggenbach cone, which consisted of cobble habitat covered in a
coralline alga, there was a high density of fish. At the top of the cone, in 75–100 m depths, there
were very large numbers of many different fish species (Fig. 38).
3.5.5 Giggenbach: Dive PV619
Fish dominated the fauna on this dive on Giggenbach seamount. Active, bubbling, hydrothermal
vent sites were a big feature of dive PV619. These areas often had associations with X. ngatama,
V. insolatus and bacterial mat. Areas of just bacterial mat were also regularly observed. The
diversity of invertebrates observed on this area of Giggenbach was relatively low.
24 Beaumont et al.—Deepwater biodiversity of the Kermadec IslandsFigure 37. Dive PV618: an active hydrothermal vent site with Figure 38. Dive PV618: towards the summit of Giggenbach cone. Large
associated bacterial mat and Vulcanidas insolatus. numbers of kingfish (Seriola lalandi), pink maomao (Caprodon longimanus)
and two-spot demoiselles (Chromis dispilus) were present. The hard
substrate (cobbles/boulders) was covered in a layer of pink coralline algae.
3.5.6 Giggenbach: Dive PV 620
The area of Giggenbach observed on dive 620 was dominated by soft sediments as well as a
few cobble–boulder habitat areas. Active hydrothermal areas, sometimes bubbling, were often
associated with a bacterial crust and/or V. insolatus. Of note was a large pit area with numerous
chimneys.
Fish dominated the fauna on dive 620 and fish abundance in the vicinity of the chimneys was
especially high (Fig. 39). Unusual faunal observations included a pair of bandfish (Cepola sp.)
living in burrows in a soft-sediment area. This was a new record for the Kermadec Ridge area.
3.5.7 Wright: Dive PV621
The area of Wright observed on dive PV621 was dominated by hard substrate, mostly of bedrock
with topography including steep slopes, ridges and pillow formations. Some cobble and sandy
areas were also seen. Much of the substrate appeared barren of fauna (Fig. 40). However, the
faunal assemblage, when present, was dominated by fish (eels and grenadiers) and anemones.
Faunal observations of note included a few large vestimentiferan tubeworms (indicative of
hydrothermal venting, although no active vents were seen) together with numerous saddle
Figure 39. Dive PV620: a frame-grab from video of small chimney-like Figure 40. Dive PV621: a wall of hard substrate mostly barren of
structures in an expanse of soft sediment. Pink maomao (Caprodon encrusting life.
longimanus) were shoaling around the structures.
Science for Conservation 319 25oysters attached to rock (Fig. 41), a large octopus (probably of the family Octopodidae), and a
giant anglerfish (thought to be Sladenia sp.). This was a new record for both New Zealand and the
Kermadec Ridge area.
As the submersible moved up the slope to the summit of the cone, the seafloor changed
from hard bedrock (often in pillow formations) to a thick bacterial mat apparently devoid of
macrofauna (Fig. 42). Some diffuse active hydrothermal venting was also observed in this area.
3.5.8 Comparison of assemblage composition among seamounts
The nMDS plot in Fig. 43 shows the relationship between the composition of the different faunal
assemblages (presence/absence) as determined from the video recordings made during the
Pisces V and ROV dives on Macauley, Giggenbach and Wright seamounts. The difference in
assemblage composition among seamounts was relatively large and statistically significant
(ANOSIM: R = 0.625, p < 0.01). The largest pairwise differences in assemblage composition were
between Giggenbach and Wright seamounts (R = 0.98), then Giggenbach and Macauley (R = 0.58),
with differences between Macauley and Wright seamounts being the least (R = 0.43). A BIOENV
analysis revealed a significant correlation between overall assemblage pattern and mid-depth of
each dive (p = 0.60, p < 0.01). This relationship can be visualised in Fig. 44 where the values of mid-
depth has been overlaid onto the nMDS plot.
Figure 43. nMDS plot showing the relationship between OFOP (video) data for sites and
seamounts. Solid grey = Macauley, open grey = Giggenbach and black cross = Wright.
Figure 44. nMDS plot showing the relationship between submersible and ROV dives
and seamounts with mid-depth overlaid.
26 Beaumont et al.—Deepwater biodiversity of the Kermadec Islands4. Discussion
The present study has compiled information, from a variety of sources, on the fish and
invertebrate fauna associated with the seabed in the deeper waters of the Kermadec Islands CMA
and surrounding area. Primarily, these data are from seamount features, some of which are sites
of hydrothermal venting. The objective of the present study was to examine and analyse these
data in order to describe the composition of the deep-water biotic assemblages. However, the
types of analyses possible and the amount of relevant information obtained were limited by the
quantity and quality of data available.
4.1 Limitations of the data
For the reasons outlined in sections 2.3.2, 2.3.3 and 2.4.3 (Methods), only some of the available
data were suitable (albeit still with limitations). To avoid repetition, the reasons for excluding
images will be only listed here:
•• Poor quality of the still images (too dark; water turbid owing to the camera gear
contacting the seabed), particularly those of the TAN0205 dataset
•• Repeat images of the same area of seabed
•• A lack of scaling information on each image
•• Parallax error
These issues meant that obtaining quantitative data was a challenge, although by ranking
organisms using a relative abundance scale (SACFOR), some quantitative information was
retained. Lastly, whilst spatial coverage on each seamount was greater in the KOK surveys than
for the TAN0205 survey, there was a bias (because of the focus of the survey) towards areas of
hydrothermal venting. Thus, the sampling tools and strategies were not ideal for the purpose
of providing a fully comprehensive description of the faunal assemblages in the study area, nor
for appreciating the spatial variability in the composition of these assemblages (including any
small-scale differences in composition with changes in water depth). In addition, data were not
analysed in a way that currently allows for direct comparisons to be made with the results of
previous analyses of seamount assemblages elsewhere in the region (e.g. Rowden et al. 2003).
4.2 Assemblage composition and distribution patterns
Where possible, data were subjected to quantitative analyses using multivariate statistical
techniques. These analyses indicated very small or no differences in faunal assemblage
composition based on direct sample or still image-derived data from the TAN0205 and
KOK0505/0506 surveys. However, analysis of video-derived data from the KOK surveys showed
there to be large and significant differences between the assemblages on Macauley (inside the
CMA), Giggenbach and Wright seamounts, which can be largely explained by differences in
depth among the seamounts. Giggenbach was the shallowest seamount surveyed, with video
obtained from a depth range of 83–276 m. Data for Macauley was recovered from a depth range
of 248–723 m, while data for Wright was obtained from the greatest depths, of 1000–1306 m. It is,
therefore, surprising that the differences in assemblage composition were not also apparent from
still image data from the KOK surveys. This finding is most likely a consequence of the coarse
resolution of taxonomic identification together with a low number of useable images within each
of the substrate subgroups for the still image datasets, resulting in low power for the statistical
tests (see 4.1: Limitations of the data, above). Differences in invertebrate assemblage composition
among seamounts and vents (associated with the Kermadec Ridge) found at different depths
have been noted previously from analyses of preliminary data derived from both direct samples
Science for Conservation 319 27and seabed imagery (Rowden et al. 2003; Rowden & Clark 2005). The small differences in
assemblage composition among the seamounts sampled by the TAN0205 survey probably
relates to the fact that, even though there were some relatively shallow and deep stations, across
all seamounts, the majority of samples were taken from a similar depth range (c. 700–1500 m).
The qualitative examination of relative composition of fish species from the scientific observer
programme reflected catches taken on long-lines. Hence, the compiled data cannot be considered
representative of overall fish diversity or relative abundance. Most fish species recorded in the
observer dataset are well-known from northern waters, and have a relatively wide distribution.
However, the catches indicated latitudinal differences along the Kermadec Ridge, with bluenose
becoming less prominent in northern regions, where kingfish become more abundant. This
trend corresponds with published summaries of New Zealand fish distributions (Anderson et al.
1998), with bluenose becoming less abundant in northern New Zealand waters, near the species’
northern limits. The observed increase in species like convict groper as boats moved north
similarly reflects a latitudinal gradient in distribution, and may also relate to lines being set near
shallow features nearer the main Kermadec Islands, where groper are common. Fish diversity
appeared to be higher in the three northern sampling areas compared to the southern-most ones,
but the small sample size makes it difficult to draw firm conclusions.
The spatial differences and similarities in the assemblage composition of fish and invertebrates
revealed by the present analyses have implications for the environmental management of the
study area (e.g. the appropriate size and depth range for a protected area). Whilst at least certain
components of the deep-water fauna and habitats—such as vents—that exist in the study area are
likely to be sensitive to human disturbance (see below), assessing the potential for recovery from
disturbance is currently difficult because of a lack of knowledge (about, for example, growth rate,
longevity and recruitment potential of dominant species). Such a recovery assessment may be
unnecessary, at least in the near future, because bottom trawling is currently prohibited in the area
(which is encompassed by a Benthic Protected Area), and seabed mining for polymetallic deposits
is unlikely to progress to full-scale commercial extraction for at least a decade (see below).
4.3 Significance of the study area
Many sets of criteria have been developed to identify ‘significant’ biological or ecological
areas. In the marine context, the latest to be published is that produced for the Convention on
Biological Diversity (CBD) (CBD Secretariat 2009). The criteria of this scheme, developed to
identify significant areas in need of protection in open ocean waters and deep-sea habitats, are:
(1) uniqueness and rarity; (2) special importance for life-history stages of species; (3) importance
for threatened, endangered or declining species and/or habitats; (4) vulnerability, fragility,
sensitivity, or slow recovery; (5) biological productivity; (6) biological diversity; and (7) naturalness.
The CBD has also developed ‘guidance for selecting areas to establish a representative network
of marine protected areas’ in association with the significance criteria. The properties required for
such a network and for components of marine protected areas (MPAs), in addition to containing
ecologically and biologically significant areas, are: representativity; connectivity; replicated
ecological features; adequate and viable sites (CBD Secretariat 2009).
DOC has no set criteria for defining significance in a marine context. There are criteria for
defining significance in the terrestrial environment, which exist through environment case law
(D. Young, DOC, pers. comm. 2009). In total, these terrestrial criteria are largely synonymous
with the CBD significance criteria and the associated MPA selection guidance. Thus, given that
the CBD scientific criteria and guidance have international status, are likely to be used widely,
are designed to be relevant to deepwater assemblages, and are, presumably, the set of criteria and
guidance most relevant to New Zealand’s response to the CBD—the New Zealand’s Biodiversity
Strategy (Anon. 2000), it seems most prudent to use them to evaluate the ecological or biological
significance of the study area.
28 Beaumont et al.—Deepwater biodiversity of the Kermadec IslandsYou can also read