Geo-locating Drivers: A Study of Sensitive Data Leakage in Ride-Hailing Services - CISPA
←
→
Page content transcription
If your browser does not render page correctly, please read the page content below
Geo-locating Drivers: A Study of Sensitive Data
             Leakage in Ride-Hailing Services

                           Qingchuan Zhao∗ , Chaoshun Zuo∗ , Giancarlo Pellegrino†‡ , Zhiqiang Lin∗
                                                      ∗ The
                                                        Ohio State University
                                          † CISPA
                                               Helmholtz Center for Information Security
                                                     ‡ Stanford University

                       {zhao.2708, zuo.118, lin.3021}@osu.edu, gpellegrino@{cispa.saarland, stanford.edu}

    Abstract—Increasingly, mobile application-based ride-hailing      lication of documents describing questionable and unethical
services have become a very popular means of transportation.          behaviors of RHSes [18], [8].
Due to the handling of business logic, these services also contain
a wealth of privacy-sensitive information such as GPS locations,          Moreover, a recent attack presented by Pham et al. [30]
car plates, driver licenses, and payment data. Unlike many of         has shown the severity of the risk of massive sensitive data
the mobile applications in which there is only one type of users,     leakage. This attack could allow shady marketers or angry taxi-
ride-hailing services face two types of users: riders and drivers.    cab drivers to obtain drivers’ PII by leveraging the fact that
While most of the efforts had focused on the rider’s privacy,
unfortunately, we notice little has been done to protect drivers.
                                                                      the platform shares personal details of the drivers including
To raise the awareness of the privacy issues with drivers, in         driver’s name and picture, car plate, and phone numbers upon
this paper we perform the first systematic study of the drivers’      the confirmation of a ride. As a result, attackers could harvest
sensitive data leakage in ride-hailing services. More specifically,   a significant amount of sensitive data by requesting and can-
we select 20 popular ride-hailing apps including Uber and Lyft        celing rides continuously. Accordingly, RHSes have adopted
and focus on one particular feature, namely the nearby cars           cancellations policy to penalize such behaviors, but recent
feature. Surprisingly, our experimental results show that large-      reported incidents have shown that current countermeasures
scale data harvesting of drivers is possible for all of the ride-     may not be sufficient to deter attackers (e.g., [15], [5]).
hailing services we studied. In particular, attackers can determine
with high-precision the driver’s privacy-sensitive information            Unfortunately, the above example attack only scratches the
including mostly visited address (e.g., home) and daily driving be-   tip of the iceberg. In fact, we find that the current situation
haviors. Meanwhile, attackers can also infer sensitive information
                                                                      exposes drivers’ privacy and safety to an unprecedented risk,
about the business operations and performances of ride-hailing
services such as the number of rides, utilization of cars, and        which is much more disconcerting, by presenting 3 attacks that
presence on the territory. In addition to presenting the attacks,     abuse the nearby cars feature of 20 rider apps. In particular,
we also shed light on the countermeasures the service providers       we show that large-scale data harvesting from ride-haling
could take to protect the driver’s sensitive information.             platforms is still possible that allows attackers to determine
                                                                      a driver’s home addresses and daily behaviors with high
                                                                      precision. Also, we demonstrate that the harvested data can
                      I.    I NTRODUCTION                             be used to identify drivers who operate on multiple platforms
                                                                      as well as to learn significant details about an RHS’s operation
    Over the last decade, ride-hailing services such as Uber and
                                                                      performances. Finally, we show that this is not a problem
Lyft have become a popular means of ground transportation
                                                                      isolated to just a few RHSes, e.g., Uber and Lyft, but it is
for millions of users [34], [33]. A ride-hailing service (RHS) is
                                                                      a systematic problem affecting all platforms we tested.
a platform serving for dispatching ride requests to subscribed
drivers, where a rider requests a car via a mobile application            In this paper, we also report the existing countermeasures
(app for short). Riders’ requests are forwarded to the closest        from the tested RHSes. We show that countermeasures such
available drivers who can accept or decline the service request       as rate limiting and short-lived identifiers are not sufficient
based on the rider’s reputation and position.                         to address our attacks. We also present new vulnerabilities in
    To operate, RHSes typically collect a considerable amount         which social security numbers and other confidential infor-
of sensitive information such as GPS position, car plates,            mation are shared with riders exist in some of the RHSes we
payment data, and other personally identifiable information           tested. We have made responsible disclosures to the vulnerable
(PII) of both drivers and riders. The protection of these data is     RHS providers (received bug bounties from both Uber and
a growing concern in the community especially after the pub-          Lyft), and are working with them to patch the vulnerabilities
                                                                      at the time of this writing.

                                                                          Finally, to ease the analysis efforts, we have developed a
                                                                      semi-automated and lightweight web API reverse engineering
(To appear) NDSS 2019
24-27 February 2019, San Diego, CA, USA                               tool to extract undocumented web APIs and data dependencies
www.ndss-symposium.org                                                from a mobile app. These reversed engineered web APIs are
                                                                      then used to develop the security tests in our analysis.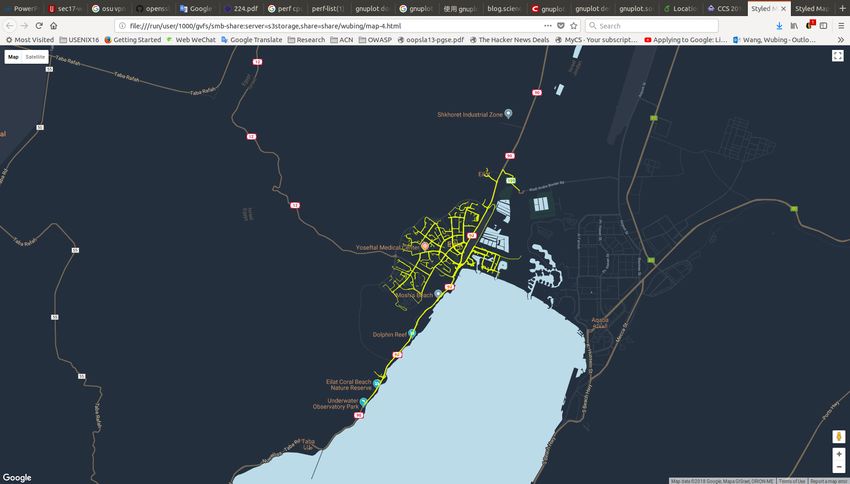
GET /nearby-cars?lat=33.7114&lng=151.1321
                                                                                   HTTP/1.1
                                                                                   …
 Rider App                Backend Servers              Driver App
                                        driver positions                           HTTP/1.1 200 OK
                                                                                   Content-type: application/json
                                                                                   ...
                login                                                              {
                token                                                                  "cars": [
                                                                                           {
             refresh token                                                                     "id"     : "509AE827",
                                                                                               "positions": [
                token                                                                               {
                                                                                                         "GPS": "-33.7100 / 151.1342",
                                                                                                         "t" : "15259620050000"
             rider position                                                                         }, {
                                                                                                         "GPS": "-33.7300 / 151.1200",
        nearby cars, est costs                                                                           "t" : "15259620060000"
                                                                                                    },
             request ride                                                                           ...
                                          accept ride?                                     }, {
                                             yes                                               "id"     : "6F09E2AA",
      driver, $, pickup location                                                               ...
                                                                                           },
                                                                                           ...
                                                                                   }
  Figure 1: An overview of the web APIs used by RHSes.
                                                                        Figure 2: An example of a rider request and response message.

Our Contribution. To summarize, this paper makes the fol-
lowing contribution:                                                    additional information to both the driver (e.g., the pickup
                                                                        location) and the rider (e.g., the estimated time of arrival).
  • Novel Attacks (§V). We present new attacks that are
    able to extract the privacy sensitive data (some of which               The ride-hailing market is flourishing over the past several
    can even lead to threat to drivers safety) of ride-hailing          years, and many companies have entered this business follow-
    drivers. We collect a large volume of data using the nearby         ing the path mapped by Curb, Flywheel, and Uber. Despite
    cars feature and show that we can determine their home              the rich variety of offerings, the underlying architectures
    address and other personal behaviors with high precision.           connecting riders to drivers are very similar to each other. An
    We also show that the analysis can reveal information               overview of the most important protocols for such services is
    about an RHS’s business performances.                               shown in Figure 1. In particular, an RHS system is composed
  • New Tool (§III). As the web APIs in our analysis are                of: (i) a mobile app for the rider (rider app), (ii) a cloud of
    typically undocumented, we present a novel lightweight              back-end servers, and (iii) a mobile app for the driver (driver
    dynamic analysis tool to reverse engineer the web APIs              app). The rider app is used by customers to request rides. It
    and perform our security tests.                                     is connected over the Internet to a cloud of back-end servers
  • Empirical Evaluation (§IV). We present an analysis of               that are responsible to authenticate riders (and drivers), and to
    Nearby Cars web APIs from 20 RHSes and assess the                   match riders to drivers. And, the driver app is used by drivers
    effectiveness of existing countermeasures.                          exclusively.
  • Countermeasures (§VI). Finally, we also present a list of               The communication between back-end servers and mobile
    dos and donts, and discuss more robust countermeasures              apps is typically via web APIs—HTTP-based1 app program-
    for protecting driver’s privacy in RHSes.                           ming interfaces to execute remote functions. Figure 1 shows
                                                                        five examples of web APIs supporting the basic operations of
Paper Organization. The rest of the paper is organized as               RHSes:
follows. We first provide necessary background in §II and
introduce our tool and methodologies for conducting this study             • Driver Real-time Position: The driver app sends a
in §III. Next, we show the results of our analysis over the                  feed of available positions of drivers to the server. The
web APIs of our interest in §IV, and present three carefully                 collected positions will later be used by the server to
designed attacks in §V. We then discuss our findings and                     dispatch riders’ requests to available drivers;
possible countermeasures against our attacks in §VI, and                   • Login: The Login API is responsible for authenticating
compare with related works in §VII. Finally, we conclude in                  users, i.e., both riders and drivers. The mobile app collects
§VIII.                                                                       username and password of the rider (or the driver), and
                                                                             sends it via an HTTP request to the server. If the authen-
                        II.   BACKGROUND                                     tication succeeds, the server produces an authenticated
                                                                             token that will be used by the mobile app as a mean
A. About RHSes                                                               of authentication proof when sending subsequent HTTP
    Ride-hailing is an emerging mode of ground transportation                requests.
that a rider can reserve a car service using a mobile app.                 • Refresh Token: Typically, a token can only be used in a
In general, it works as follows. When the rider inputs a                     limited time window. The Refresh Token API is used to
destination address and requests a ride, the mobile app reads                retrieve a new token from the server when the old one
the GPS position of the device and transmits it together with                expired.
the address to the back-end server. Then the server dispatches            1 HTTPS protocols are similarly handled with the only difference of either at
the request to the available drivers closer to the rider. If an         the networking API interception or with a packet decryption using a controlled
available driver accepts the request, then the server transmits         proxy.

                                                                    2
• Nearby Cars: The forth API is used by the rider app                                  Service Name       #Downloads     Obfuscated?
    to obtain information about nearby cars and a quote of                               Uber             100+ millions        4
    the cost of the ride. Figure 1 shows an example of this                              Easy              10+ millions        4
                                                                                         Gett              10+ millions        4
    API with the request and response message. The request                               Lyft              10+ millions        4
    message carries the rider’s location and the response mes-                           myTaxi             5+ millions        4
    sage contains several nearby cars. Each car has at least an                          Taxify             5+ millions        7
                                                                                         BiTaksi            1+ millions        4
    identifier (id), the position information, which includes                            Heetch             1+ millions        4
    the GPS coordinates and the time stamp indicating when                               Jeeny           500+ thousands        4
                                                                                         Flywheel        100+ thousands        7
    such position is recorded.                                                           GoCatch         100+ thousands        4
  • Ride Request: The last API is used to request a ride                                 miCab           100+ thousands        7
    and spawns across the three entities. It is initiated by the                         RideAustin      100+ thousands        7
                                                                                         Ztrip           100+ thousands        4
    rider when requesting a ride for a specific destination.                             eCab             50+ thousands        4
    The server will determine the closest drivers to the rider’s                         GroundLink       10+ thousands        7
    current position and ask them if they would accept the                               HelloCabs        10+ thousands        7
                                                                                         Ride LA          10+ thousands        7
    ride. If so, the server assigns the first responded driver to                        Bounce           10+ thousands        7
    the rider, and sends to the rider app the details about the                          DC Taxi Rider     5+ thousands        4
    ride.
                                                                                      Table I: The selected RHSes in our study.
    RHSes may provide additional services and APIs that
are not shown in Figure 1, such as billing information for
customers and APIs to integrate with other third-party services
(e.g., Google Maps).                                                      effect, which is brought by the execution of the Nearby Cars
                                                                          API. To our surprise, we find that this feature can actually
B. Motivation and Threat Model                                            cause a lot of damages to both the drivers and the platform
                                                                          providers as well.
Motivation. The motivation of our work is based on a serious
attack against drivers of RHSes. To the best of our knowledge,            Threat Model. We assume the attacker is either a ride-hailing
one of the first few attacks threatening the safety of drivers has        service, an individual, or a group of persons. In addition, the
been presented by Pham et al. [30] as a part of a broader study           attacker can reverse engineer the rider app of RHSes, create
on privacy threats in RHSes. In this attack, the attacker is a            fake accounts, use GPS spoofing to forge user positions, and
group of angry taxi-cab drivers who wants to harm RHS drivers             control several machines connecting to the Internet.
coordinately. To do so, the attacker exploits the behavior of the
Request Ride API that returns drivers’ personal details. Based                           III.    M ETHODOLOGY AND T OOLS
on this behavior, the attacker collects drivers’ information by               A key objective of this work is to have a systematic under-
requesting and canceling rides. While this threat may seem                standing of the current circumstances of driver’s security issues
implausible, a number of news reports is showing that physical            in RHSes by studying the related web APIs they exposed. To
violence is a real threat to RHS drivers (e.g., [39], [10], [21],         this end, we intend to investigate the deployed countermeasures
[31]). On the other hand, RHS providers have begun to charge              or mechanisms that can prevent, increase the cost, or slow
penalties if users canceling rides. This policy increases the cost        down the acquisition of the GPS positions of drivers, and
for conducting such information collection, and mitigates the             meanwhile to understand whether such data leakage is a threat
attacks utilizing the Request Ride API.                                   to drivers’ privacy and RHS business. For this purpose, we
   However, despite the Request Ride API, we find that the                have to apply security tests over web APIs, which requires
Nearby Cars API can also leak drivers’ information both                   proper descriptions of the web API end-points, parameters,
directly and indirectly. Nevertheless, it remains underestimated          and API call sequences. Unfortunately, the documentation of
and is rarely noticed by attackers and researchers. There might           web APIs is not always available: out of the 20 mobile apps we
be multiple reasons. The first reason is probably that, showing           studied, only Lyft provides a description of the Nearby Cars
the nearby cars is a common feature of apps in this category,             API2 . To solve this problem, we need to design a tool for web
which brings directly to the users with vivid visual effects and          API reverse engineering.
lets them realize how many available cars around them, in                     In this section, we first describe how we select the RHSes
order to estimate where they would better to move to catch                and their apps in §III-A, then present how we design our web
a car in a shorter time. This feature is provided by almost               API reverse engineering tool in §III-B and its implementation
every RHS app today, though different app may adopt different             in §III-C.
strategy to display the nearby cars (e.g., using different radius).
The second possible reason is that, this API is not designed              A. Selection of the RHSes
to provide drivers’ information directly as what the Request
Ride API does, such as driver’s name, plate number, and                       We conducted our study on a selection of RHSes by
phone number. As a result, when designing RHS apps, the                   searching for the keyword “ride-hail” on Google Play Store
app developers may intuitively provide this feature by default,           through a clean Chrome Browser instance and selecting the top
without challenging much about its security.                              20 suggested apps that can be installed and run on our devices
    Therefore, in this paper, we intend to systematically study              2 See "Availability - ETA and Nearby Drivers" https://developer.lyft.com/
the severity of the data leakages originated from this visual             reference

                                                                      3
POST /oauth2/access_token HTTP/1.1 GET /v1/nearby-drivers-pickup-etas?
grant_type = ***Aphone & lat=10.10&lng=-10.10 HTTP/1.1 refresh_token, which is used later to require a new token
phone_number = 123 & phone_code = 111 Authorization: Bearer dmGtpMx1qCKeA
when the current one expired.
HTTP/1.1 200 OK HTTP/1.1 200 OK
Content-type: application/json
Content-type: application/json
{
{ At the time of a successful login, Lyft triggers the Nearby
"nearby_drivers":[
"access_token": "eHdNsgsNvREH1", { Cars API automatically. As shown in Figure 3(c), the Nearby
"expires_in": 86400, ...
}
"refresh_token": "bEwazc0wcI", "driver":{
...
Cars API requires three important fields: lat, lng, and
},
(a) Login API "locations":[ Authorization, where lat and lng represents the user’s
{
POST /oauth2/access_token HTTP/1.1 "lat":10.10,
"lng":-10.10,
geo_location, and the Authorization carries the to-
grant_type=refresh_token &
refresh_token=bEwazc0wcI
},
"recorded_at_ms":1234 ken value for the authorization purpose. After 86, 400 seconds,
...
HTTP/1.1 200 OK ] the old token will be expired, then the app invokes the Refresh
},
Content-type: application/json {
...
Token API as shown in Figure 3(b). This API carries an
{
"access_token": "dmGtpMx1qCKeA", "driver":{
...
important parameter, refresh_token, whose value comes
"expires_in": 86400, },
"refresh_token": "3Rva2VuIiw", ... from the response of the Login API. Next, the invoked Refresh
} }
(b) Refresh Token API (c) Nearby Cars API
Token API receives the response from the server with a new
token, the value of access_token, as well as a new refresh
Figure 3: The web APIs and dependencies in Lyft. token. Later, this new token is carried within the Nearby Cars
API for continuously retrieving the data containing nearby
cars.
on the date of April 3rd, 2018. The selected apps are listed in
Challenges. From this running example, we can notice a
Table III. Please note that these search engine suggested apps
number of challenges we have to solve in order to perform
were determined by Google on that particular day, and these
our security analysis.
apps may not be the top downloaded apps. While we could
have just used the top 20 RHS apps based on the number of
accumulated downloads in Google Play, the reason of using • Pinpointing the Web APIs of Interest. An RHS client
the suggested RHS apps returned by the search engine is to app may involve multiple web APIs during the interaction
get a fairly reasonable distribution of these apps. with the servers. For instance, the Uber app actually
triggers hundreds of web API calls. We must identify
Then we investigate some general properties of our apps. the API of our interest, i.e., the Nearby Cars API. In-
First, we estimated their popularity by using the number of terestingly, this API does take a parameter with value of
downloads provided by the Google Play Store, which shows GPS coordinates. Identifying such a parameter is helpful
that our apps vary from the world-wide known Uber and Lyft to narrow the scope to pinpoint this API.
to local services such as RideAustin and RideLA. Further, we • Identifying the Dependencies among APIs. The pa-
looked into details about whether the mobile app has been rameters of one web API can depend on the values
obfuscated to thwart the app analysis, which is useful for obtained from other APIs. For instance, the value of
the development of our web API reverse engineering tool. To access_token in Nearby Cars API comes from the re-
do so, we manually examined each app’s binary code with sponse of Refresh Token API. Therefore, we also have to
the help of the tool JEB3 and found that 12 out 20 apps identify the closure of the web APIs related to the Nearby
(60%) have been obfuscated, which makes static analysis of Cars API. Obviously we have to perform a dependency
the app challenging. Meanwhile, we also examined the apps’ analysis of all of the executed web APIs.
communication security by setting up a man-in-the-middle • Bypassing Obfuscations Used in the Apps. We cannot
proxy with customized certificates and we found only Uber simply use static analysis to identify the web APIs,
enforces the certificate checking. because there are 60% of the RHS apps in our dataset that
have been obfuscation to thwart our analysis. Meanwhile,
B. Reverse Engineering of the Web APIs as the security analysis involves retrieving nearby cars,
the access control token must be provided otherwise the
Running Example. We begin the description of our tool with server will reject our requests. Therefore, we have to
a running example to illustrate the problems we have to solve choose dynamic analysis. In addition, we also cannot
for extracting the Nearby Cars API and all of its related simply setup a network proxy to intercept and decrypt
APIs. These APIs are required to be executed correctly in a the HTTP(S) traffic, because one of the apps (i.e., Uber)
systematic manner to generate our security test results. The performs the certificate checking. Consequently, we have
running example is from a real app, Lyft. to hook in-app APIs to intercept the network traffic.
When opening the Lyft app to use its services, the rider will
be asked to provide a phone number to receive a verification Approaches. There are multiple approaches to solve the above
code sent from the back-end server via SMS. After providing challenges. Intuitively, we can use instruction level dynamic
this verification code, the app invokes the Login API, which is taint analysis (e.g., TaintDroid [13]) to understand how the
shown in Figure 3(a), where the phone number and the verifi- information flows through the app (e.g., how the GPS location
cation code are carried by the parameter phone_number and and the server response such as token is defined and used
phone_code, respectively. It receives the access_token, by the web APIs) to pinpoint the web APIs of our interest
which will be expired in 86, 400 seconds as well as the as well as to identify the dependencies. Such a dynamic
analysis approach also bypasses static code obfuscation and
3 Available at https://www.pnfsoftware.com/jeb/ can intercept the HTTPS traffic at the network API level.
4Interestingly, according to our preliminary analysis of these this value is used in the log file in the forward direction.
20 apps, we also notice that we can use a lightweight API The web APIs that use the GPS coordinates in the request
level data dependency analysis instead of the heavyweight parameters is the candidate of the Nearby Cars API.
instruction level data dependency analysis (i.e., taint analysis) Also, interestingly, the GPS coordinates will also be used
to solve our problem. In that, the parameters are mostly strings in the return values of the Nearby Cars API because
and we can identify the dependencies by matching their values. each nearby car also has a location. An example of this
The only limitation for this approach is that we are unable to response message is in shown in Figure 2, which is the
identify the dependencies if a string is transformed between the JSON formatted item in nearby cars array. Therefore,
definition of the string and the use of the string. Fortunately, to further narrow down the candidate, we also inspect the
we did not notice such a case in our RHS apps. response messages. If the GPS coordinates exist in the
response message, we identify this Nearby Cars API.
Therefore, we eventually design a lightweight, API level, • Backward Data Dependency Analysis. Having identi-
dynamic data dependency analysis that works in the following fied the Nearby Cars API, we then search in a backward
three steps: direction to locate where the parameters of this API
are defined. Transitively, we identify the closure that
Step I: Logging Android and System APIs. First, we generates the parameters such as the access_token.
instrument a large number of system APIs of our interest, Note that to really identify whether a parameter is token,
which includes (i) all of the HTTP(S) system libraries we apply the same differential packet analysis [2] to infer
(e.g., HttpClient) and low level (SSL)Socket APIs handling the tokens in the request message. The key observation is
third-party or self-developed libraries; (ii) the system that different users are assigned with different tokens, and
APIs that are required by Ride-Hailing services, such as we can therefore align and diff their requests for the same
LocationManager.requestLocationUpdates(), web API by using two different users. Such a protocol
LocationManager.getLastKnownLocation(), alignment and diffing approach has been widely used by
GPSTracker.getLatitude(), GPSTracker.get many protocol reverse engineering systems (e.g., [2], [9],
Longitude(), and System.currentTimeMillis(). [42], [43]), and we just use the one from the Protocol
During the execution of these APIs, we log the name, the Informatics (PI) project [2].
parameters, and the return values of the system APIs in a log
file. C. Implementation
Step II: Resolving the Web APIs. Unlike the system APIs We have implemented our analysis tool atop the Xposed [3]
whose name is documented, we do not have any name of framework, which allows the dynamic interception of all of the
the web APIs because they are merely HTTP request and Android APIs including system APIs. The execution of these
response messages. On the other hand, these messages have APIs is logged into a log file, in which each entry contains
already been logged when the networking system APIs get the API name, the value of parameters, and return value.
executed. Therefore, by inspecting the networking request and To resolve the web APIs from the log file, we just develop
response API execution information in the log file, we can pair standard parsing with python scripts. In particular, we depend
each request with its corresponding response, and then parse on urllib, zlib, json, and xml python libraries to parse
these pairs according to the HTTP protocol specification [1]: and decode the content of the web API. Finally, to infer the
a request message includes 1) a request-line, 2) request header tokens in the request and response messages, we use the open
fields, 3) an empty line, and 4) an optional message-body; source message field alignment and diffing implementation
and a response message contains 1) a status-line, 2) response from PI [2].
header fields, 3) an empty line, and 4) an optional message- The last piece of our tool is a standalone data scraping
body. component that is able to collect the nearby driver information
Specifically, we parse the request message to obtain the by sending a large volume of request messages to the RHS
request URL as well as request parameters and we also parse server with proper parameters. With our web API reverse en-
the response messages to abstract its content as a set of pairs of gineering component, the implementation of this task becomes
. With respect to the parameters and quite simple. In particular, we just developed a python script
response value pairs, we parse them accordingly based on their that sends HTTP(S) request messages to the servers by using
specific encodings (e.g., JSON and XML). Eventually, the web the token obtained in the web API reverse engineering and
API is resolved by the request URL, the request parameters, mutating the GPS coordinates of our interest. If the token
and the return values (i.e., response message). Then, we replace requires refresh, we execute the refresh token API with proper
the log entires of the original network sending and receiving parameters as well. Please note that these parameters have
APIs with the newly resolved web APIs in the log file. already been identified by our data dependency algorithm.
To summarize, for each analyzed RHS app, we first in-
Step III: Data Dependency Analysis. Then by analyzing the stalled the app in an instrumented Android device where
log file in both forward and backward directions, we identify most of the Android APIs are interposed and their executions
the APIs of our interest and also dependencies. In particular: are logged. For each selected app, we also created two user
accounts for each service. Then, we performed a user login
• Forward Data Dependency Analysis. Starting from request and reached the view where the cars are displayed
the return values of the hooked system APIs (e.g., on a map, by using the two users we registered. Next, we
GPSTracker.getLongitude()), we search where analyze the log file to resolve the web APIs of our interest and
5Rider App RL1 RL2 SM1 SM2 GPS AN1 AN2 number of requests and per-user limits on the number of IPs
Uber # ∞ # ∞ used.
Easy - # # ∞ # ∞
Gett - # ∞ # ∞ (RL1) Rate Limits Reqs/s: Servers can limit the number
Lyft # 24h # ∞ # of requests processed over a period of time. The
myTaxi - # # ∞ # 20m
Taxify # ∞ # ∞ rate limits can be enforced for each user or
BiTaksi - # ∞ # ∞ web server. When the limit is reached, the web
Heetch - # ∞ # ∞ server may respond with a “429 Too Many
Jeeny - # # ∞ # 20m
Flywheel - # 20m # 10m Requests” response status. We populated this
GoCatch - # ∞ # ∞ column using the information we gathered from
miCab - # ∞ # ∞ # the ride-hailing service documentations. Only
RideAustin - # ∞ # ∞
Ztrip - # 30m # ∞ Uber and Lyft describe the rate limits based on
eCab # # ∞ # ∞ the frequency of requests per second and the total
GroundLink - # # ∞ # ∞ amount of requests per user. The other services
HelloCabs - # ∞ # ∞ #
Ride LA - # # ∞ # ∞ #
do not share these details. However, during our
Bounce - # ∞ # ∞ # experiments, we discovered that Taxify and eCab
DC Taxi Rider - # ∞ # ∞ # implement rate limits. Nevertheless, these limits
are enforced when administrators suspect under-
Table II: List of countermeasures. Values: for countermea- going malicious activities, e.g., DoS.
sure present, # for countermeasure missing, "-" for unknown, (RL2) Different IPs: RHSes may be recording the IPs
and ∞ for not expired. Columns: RL1 for Reqs/s, RL2 for for every user who logs in as a measure to mit-
Different IPs, SM1 for Authn, SM2 for Session Life-Span, igate session hijacking attacks. When the server
GPS for Anti-GPS Spoofing, AN1 for Identifier Life-Span, detects a new IP, it may require the user to
AN2 for Driver Info. be re-authenticated. To populate this column, we
checked the behavior of the server when process-
ing parallel requests from the same user session
using different source IPs. We used two sources:
identify the dependencies. After that, we run our standalone
an IP of the DigitalOcean Inc. network, and the
data scraping component to scrape the nearby cars. We refer
other of our own campus network.
to §IV and §V for the description of the individual test of the
apps.
Session Management. Session management encompasses the
IV. S ECURITY A NALYSIS OF N EARBY C ARS API mechanisms to establish and maintain a valid user session.
It includes user authentication, generation, and validation of
We now present our security analysis of Nearby Cars APIs. session identifiers. In this analysis, we focus on those aspects
The goal of this analysis is to identify server-side mechanisms that can limit attacker activities.
and possible countermeasures that can block or slow down
the attacker’s operations. The list of the countermeasures is (SM1) Authentication: The first aspect we intend to
presented in §IV-A and the analysis results are presented in check is whether the access to Nearby Cars API is
§IV-B. restricted to the authenticated user only. We verify
this by checking for the presence of a session ID
A. Analysis Description in the Nearby Cars API request.
(SM2) Session Lifespan: The second aspect is the life-
The first step of our analysis is to prepare a list of span of user sessions that may slow down attack-
countermeasures to evaluate. We reviewed publicly available ers. For example, shorter validity time windows
documents such as ride-hailing apps’ API documentation for may require the attacker to re-authenticated fre-
developers and the best practices for web service development4 quently. We measure the session lifespan by call-
to search for known countermeasures covering the following ing the Nearby Cars API over an extended period.
categories: rate limiting, anti-GPS spoofing, session manage- When we receive an error message, e.g., HTTP
ment, data anonymization, and anti-data scraping. Table II response “4xx” series status code or a response
shows the list of countermeasures. In the rest of this section, with a different response body format (e.g., keys
we discuss each category and provide details of our tests. of JSON objects), we mark this session as expired.
We did not design ad-hoc experiments for that,
Rate Limiting. Rate limiting is a technique that is used to limit but we monitored errors during the experiments
the number of requests processed by online services, and it is of §V.
often used to counter denial of service (DoS) attacks. Based on
our threat model, the attacker can take advantage of multiple Anti-GPS Spoofing. The attacker spoofs GPS coordinates to
computers to perform a large number of requests. Accordingly, fetch nearby cars. As such, services may deploy mechanisms to
we considered two countermeasures: per-user rate limits on the verify whether the GPS position is consistent with other mea-
4 See, the "OWASP REST Security Cheat Sheet" https://www.owasp.org/ surements, e.g., nearby WiFi networks and nearby cell towers5 .
index.php/REST_Security_Cheat_Sheet and the "OWASP Web Service Se- For this category, we do not enumerate and test possible
curity Cheat Sheet" https://www.owasp.org/index.php/Web_Service_Security_
Cheat_Sheet 5 See https://developer.android.com/guide/topics/location/strategies
6countermeasures, but we verify the presence of mechanisms Service name Sensitive information
that would prevent an attacker from rapidly changing position Lyft Driver avatar
via GPS spoofing. For this test, we spoofed GPS coordinates HelloCabs Name, phone number
Ride LA Name, phone number
so that the users will appear in very distant places at the same DC Taxi Rider Name, phone number, email
time. We first identified at least two cities where each ride- miCab Account creating time, account last update time, device
hailing service operates. For example, for Lyft, we selected 11 number, hiring status
Bounce Name, date of birth, driver avatar, phone number, social
cities and performed one request per second for each city for security number, driver license number, driver license ex-
twenty times. Four services, i.e., Bounce, RideAustin, RideLA, piration date, home address, bank account number, routing
number, account balance, vehicle inspection details, vehicle
and DC Taxi Rider, operate in a single city. In these cases, we insurance details
picked distant points within the same city.
Table III: List of personally identifiable information of drivers
Anonymization. This category contains countermeasures to included in Nearby Cars API responses
hide sensitive information and make it hard for an attacker
to reveal drivers’ identities. We derived this list by manually
inspecting the content of Nearby Cars API responses.
User Authentication. 14 services restrict the Nearby Cars
(AN1) Identifier Lifespan: As shown in Figure 2, the API to authenticated users only. The remaining services, i.e.,
Nearby Cars API’s responses carry identifiers for GroundLink, myTaxi, Easy, Jeeny, RideLA, and eCab do not
either cars or drivers in most cases. In this study, require any form of user authentications. This allows any pub-
we assume each driver is binding to a unique lic attacker to retrieve nearby cars without user authentication.
car, which means the identifier for a car and
It is worth to mention the case of GoCatch. Every time
for a driver is conceptually equivalent. These
a user wants to log in at GoCatch, the service requires the
identifiers can be used to track cars and drivers
submission of a token sent via SMS. While this approach may
across different responses. Shortening the lifespan
affect the service usability, it can raise the cost of the attacker
of identifiers may mitigate this problem. Then,
operations.
we tested the time it takes for an identifier to be
updated. As discussed for the session ID lifespan,
we measured the identifier lifespans during the Session Lifespan. Since the beginning of the experiments, all
experiments of §V. services—except for three—have not required us to obtain a
(AN2) Personally Identifiable Information: We inspect fresh user session. For Uber, Lyft, Heetch, Gett, and Flywheel,
the responses looking for personally identifiable the experiments last in total 28 days. During this period, only
information. We looked for the first and last name, Lyft and Flywheel require us to refresh the session ID after 24
email, phone numbers, and others. hours and every 30 minutes, respectively. For the other services
the experiment lasted 15 days (eCab and Taxify only 7 days).
Among these, only Ztrip requires to refreshen the session ID
B. Results
every 30 minutes.
We now present the main results of our analysis. Results
are presented in Table II. Anti-GPS Spoofing. Our analysis did not reveal the presence
of any anti-GPS spoofing behavior among all of tested RHSes.
Rate Limiting. Uber, Lyft, and Gett are the only three services
provide publicly available API documentations. According to Identifier Lifespan. Overall, 17 services do not use short-lived
Uber’s documentation, Uber enforces a limit of 2, 000 requests identifiers. The maximum time interval is the same as that of
per hour and a maximum peaks of 500 requests per second per session lifespan. Only three services shuffle identifiers every
user. In our experiments, we observed that the real rate limit 20 minutes. Among these, it is worth mentioning the behavior
is much lower, i.e., one request per second. As the Nearby of Flywheel that refreshes identifiers about every 10 minutes.
Cars API is undocumented, we speculated that this may be a
particular rate limit of the Nearby Cars API only. Lyft reports Personally Identifiable Information. Our analysis revealed
the presence of rate limits; however, they do not disclose the that in total six services share Personally Identifiable Infor-
actual thresholds. Gett does not report the presence of rate mation (PII). Among them, we discovered full names, phone
limits. numbers, as well as sensitive information such as social
For Taxify and eCab, we discovered rate limits at about security numbers and bank account data. The complete list
two requests per second. These limits were not always present, of PII per service is in Table III.
but they were enforced after they notified us about suspicious
traffic originated from our servers. C. Takeaway
For the remaining RHSes, we did not identify rate limits. In short, our first analysis did not observe any particular
As we elaborate more in §V, we requested on average about countermeasures hampering attackers. Instead, our analysis
four requests per second based on the insight gained with Uber, revealed behaviors that can facilitate attackers, e.g., long-lived
Taxify, and eCab. Higher rate limits may be present, but we tokens. Also, our tests identified two types of vulnerabilities
did not verify their presence for ethical reasons. Finally, none in 11 RHSes: six services do not require user authentication
of the services enforce a same-origin network policy for user to reveal the position of nearby drivers, and other six services
requests. directly return a variety of personally identifiable information
7Rider App City/Area Req/s Days Cov/M across services; however, as cities have irregular shapes, we
Uber O’ahu Island, Hawai’i 1 28 19 adjusted monitors to better adapt to the shapes manually. Also,
Easy Sao Paulo, Brazil 4 15 0.3 as monitors may cover the same area, we further refined
Gett Eilat, Israel 4 28 0.3
Lyft O’ahu Island, Hawai’i 5 28 19 the positions of monitors to reduce overlaps. The locations,
myTaxi Hamburg, Germany 4 15 20 coverage size of each monitor, and other parameters of our
Taxify Paris, France 2 7 12 experiments are reported in Table IV.
BiTaksi Istanbul, Turkey 4 15 20
Heetch Stockholm, Sweden 4 28 12
Jeeny Riyadh, Saudi Arabia 4 15 0.3 After being placed, each monitor starts to acquire data
Flywheel Seattle, US 4 28 7 at a constant request rate, which has been determined by
GoCatch Sydney, Australia 4 15 20
miCab Cebu, Philippines 4 15 0.8
considering ethical aspects. Specifically, our experiments must
RideAustin Austin, US 4 15 7 not interfere with the normal business operations of RHSes and
Ztrip Houston, US 4 15 12 not to trigger the active rate-limiting mechanism, if there is any.
eCab Paris, France 2 7 7
GroundLink Dallas, US 4 15 20 Accordingly, we first tried to acquire data from Lyft with a rate
HelloCabs Yangon, Myanmar 4 15 7 of 10 requests per second, the documented rate limits. After
Ride LA Los Angeles, US 4 15 20 two hours, we reached the Lyft’s rate limit, and we reduced
Bounce San Diego, US 4 15 20
DC Taxi Rider Washington DC, US 4 15 3 monitors’ rate by half, i.e., five requests per second. Then, we
used the new rate for Uber. However, we reached the rate limit
Table IV: An overview of the parameters of our experiments. of Uber as well and further reduced to one request per second.
Cov/M for the estimate coverage area (mi2 ) of one monitor. For the other RHSes, we set the initial rate four requests per
second and never changed it. Only for Taxify and eCab, we
further reduced the request rate to two requests per second.
(RideLA contains both vulnerabilities), which even includes In fact, we acquired data incrementally. First, we started
sensitive and confidential information (e.g., social security the acquisition for Lyft, Uber, Heetch, Gett, and Flywheel
numbers and bank account numbers). on April 13th, 2018. The responses data are collected over
four consecutive weeks (28 days), i.e., between April 13th
V. ATTACKS and May 10th. Then we extended the acquisition of data to
the remaining 15 RHSes from May 11th. In total, except for
The results of the web API analysis indicate that the Nearby Taxify and eCab, we acquired data for 15 days. Because of
Cars API may be poorly protected. Attackers may be able to a power outage, our monitors were offline or gathered partial
collect a large volume of data containing drivers’ identifiable date between May 12th and 14th, and May 19th and 21th.
information and their positions, which can uncover drivers’ We excluded these days in the following study. For Taxify
sensitive information indirectly. To demonstrate the threats, and eCab, we acquired only seven days because the network
in this section, we present three attacks to show that the providers flagged our machines as infected. Accordingly, we
current implementations of Nearby Cars API not only seriously suspended the acquisition of data.
threaten drivers’ safety and privacy, but also allow attackers to
spy on RHS business performances.
Data Aggregation. Responses of Nearby Cars API return car
In this section, we present the details of our attacks. paths. Each path is a list of timestamped GPS coordinates with
First, we present the data collection and processing in §V-A. an identifier, which is used to link paths to cars or drivers and
Then, three attacks are presented in §V-B,§V-C, and §V-D, does not change over time. One of these RHSes, i.e., Lyft,
respectively. requires additional attention. Lyft’s Nearby Cars API responses
include the URL of driver’s avatar, a driver-chosen picture
A. Design (selfie in most cases). Avatars do not change very often, and
this makes them reliable identifiers for drivers. However, each
Our attacks consist of three components: data acquisition, response contains only the URL of the closest driver. To gather
data aggregation, and data analysis. the URLs of other drivers, we deploy a mobile monitor for
each newly-discovered “driver” to perform an additional API
Data Acquisition. Data acquisition is performed with moni- call closer to the most recent GPS coordinate.
tors. A monitor is a bot that controls a rider account. In this
study, all monitors for a particular RHS use only one account.
Data Analysis. The final step is to remove noises from our
A monitor is placed in an appropriate location in a city to
dataset. First, we observe that drivers work as full-time or part-
collect data by continuously performing API calls with spoofed
time. We categorize drivers as full-time if they appear more
GPS coordinates and store collected data in a local database.
than half of the total number of days. Compared to the part-
Moreover, monitors are responsible for determining when the
time drivers, full-time drivers have a tendency to exhibit more
authorization token needs to be refreshed.
regular daily patterns. Thus, we focus on full-time drivers only.
The exact locations of our monitors are determined as Second, drivers have various activities through a day if they
follows. First, if the RHS operates in multiple cities, we are absent in our dataset, giving a ride or logged out of the
select a city which is relatively isolated from neighboring platform (e.g., to sleep or eat). As none web API we used to
cities (e.g., in an island). Second, we calculate the average collect data can distinguish a specific activity, we rely on the
size that a monitor could cover (up to 20 mi2 for ethical inter-path interval to distinguish the two cases. In particular,
concerns). Then, we place monitors in a grid based on the size we observe that the average ride in the cities that we are
of the area covered by each monitor, which varies considerably monitoring could last up to 45 minutes. Accordingly, if the
8RHS # Total # Morning % # Afternoon % # Evening %
Uber 1,202 705 58.7% 336 30.0% 161 11.3%
Lyft 638 385 60.3% 167 26.2% 86 13.5%
Gett 120 82 68.3% 27 22.5% 11 9.2%
miCab 152 136 89.5% 10 6.6% 6 3.9%
Table V: Daily working patterns of drivers from Uber, Lyft,
Gett and miCab.
six hours. Because of these constraints, we eventually choose
to only test four RHSes, Uber, Lyft, Gett and miCab, whose
(a) (b) monitors cover almost the entire city, for proof of the concept.
Figure 4: (a) Heatmap of Heetch drivers one day in Stockholm; In addition, to further remove the noise data and simplify
(b) Path of a single Gett driver in Eilat, Israel. our tests, we chose the cities which are either located in an
island or relatively isolated from the nearby cities. As an
almost closed system, most aspects of the society is expected
to remain stable, e.g., the number of cars and drivers, people’s
time interval between two consecutive paths is between 5 and life styles. A stable system benefits attackers to retrieve the
45 minutes, then the driver is treated as giving a ride. Similarly, pattern of these aspects. Specifically, the dataset of Uber and
if the interval is longer than six hours, then the driver is taking Lyft was acquired in O’ahu Island, Hawai’i, from April 13th,
a break. 2018 to May 10th, 2018, the dataset of Gett was acquired in
Eilat, Israel, and miCab in Cebu, Philippines from May 11th,
2018 to May 25th, 2018.
B. Attack #1: Tracking Drivers’ Daily Routines
In this attack, we discover that the collected data can Working Patterns: The working patterns of drivers from
be used by attackers to precisely track drivers during their an RHS is revealed by studying the repetitive behaviors of
daily routine. First, we show that the information could allow these drivers. To find out the behaviors, first, we select drivers
attackers to precisely determine the movements of drivers over whose six-hour break is across two consecutive days. Among
time. Then, we demonstrate that the information can also allow these drivers, we select those who start working from locations
attackers to identify drivers’ daily behaviors, specifically, their that are within 100m from each other. Then, we use the total
working patterns and the most likely appeared locations with number of nearby points as a measurement of the precision
a precision of 100m. for detections. By using a low precision of three points, we
identified totally 1, 202 Uber drivers, 638 Lyft drivers, 120 Gett
drivers and 152 miCab drivers who start working from almost
Movements of Drivers. Figure 4(a) is a heatmap of all Heetch the same location across days. Next, we study the working
drivers’ paths operating in Stockholm in a day, which is drawn patterns by classifying them into different work shifts. We
by overlapping all paths of Heetch drivers in our dataset. The separate a day into three shifts, morning (4:00 AM to 12:00
red color of Figure 4(a) shows the areas where the activities PM), afternoon (12:00 PM to 8:00 PM), and evening (8:00
of drivers are more intense, i.e., central Stockholm. The PM to 4:00 AM next day). If a driver starts working at 9:00
heatmap fades to the green color towards areas less popular, AM, then his or her work shift is in the morning. The result
i.e., outskirts of Stockholm. In addition, the collected data of drivers’ daily working patterns is shown in Table V. As we
allows an attacker to track a single driver too. For example, expected, most drivers from any of these RHSes prefer to start
Figure 4(b) shows all paths of a single Gett driver in Eilat, working in the morning, less in the afternoon, and the least in
Israel. the evening.
Daily Behaviors of Drivers. Our dataset reveals daily be- Appeared Locations — Home: Further analysis of the
haviors of drivers. In this attack, we focus on the daily data may reveal the most likely appeared locations of a driver,
working patterns of drivers, i.e., when to start working, and if attackers restrict the criteria by increasing the precision of
the most likely appeared locations (e.g., home) over different the location detection and narrowing down the time window.
days at about the same time of a day. Disclosure of drivers’ Among these locations, we intend to uncover one of the
behaviors and locations where a driver mostly visited is a secretest privacy information of a driver — the home address.
serious sensitive data leakage that threatens drivers’ safety. Due For this purpose, we focus on drivers who start from the same
to the limitation of computing power, network bandwidth as place between 6:00 AM and 9:00 AM with a probability of
well as ethical considerations, for some RHSes, our monitors 0.5. Our hypothesis is that, if a driver starts working in the
may not cover the entire area of the city. Drivers’ behaviors morning from the almost the same location which is in a
in these uncovered areas may bring noises to our analysis in residential area, then such location is mostly like to be his
this attack. For example, if a driver continuously works in or her home. To validate this hypothesis, we need to plot the
the uncovered area, then the related information of this driver GPS coordinates and centroid of the points of such location
is missing from our dataset. In this case, it is possible that for each driver on a map and manually verify them. Therefore,
this driver is actually working but is considered as taking a we choose to use Uber to verify this hypothesis, because it has
break because of being absent from our dataset longer than the largest number of full-time drivers in our dataset.
9As a result, our dataset revealed that 334 Uber drivers start
working from the same nearby points for half of the time.
Among these 334 drivers, we have identified that 123 of them
that start working between 6:00 AM and 9:00 AM. After
plotting and manually checking these locations, we verified
that 102 of them is located in a residential area, which may
suggest that it is nearby the real address in which drivers live;
six of them is nearby restaurants; and 15 of them is located
nearby gas stations and shopping centers, where may be the
places that these drivers are used to having breakfast.
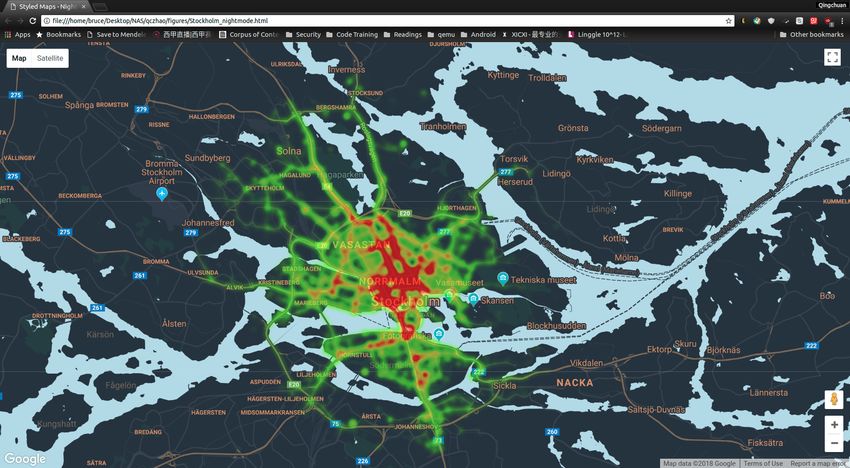
(a) (b)
Interestingly, as the data of Uber and Lyft is collected in the
same area, we then plotted possible home addresses of their
drivers on the map and we discovered a set of overlapping Figure 5: Examples of overlapped paths. Green is Uber and
points. Even this overlapping is probably a coincidence, given Red is Lyft.
the observations that many drivers work for both two RHSes,
we reasonably question whether our collected data is capa-
ble of uncovering driver’s employment status? For example, 80
whether a driver only works for one specific RHS or different Uber
Percentage of RHS Drivers (%)
70 Lyft
RHSes at the same time. This inspires us to conduct the
60
following attack, namely attack #2 presented in §V-C.
50
Takeaway. From this analysis, we showed that the data 40
obtained by Nearby Cars API can reveal the movements of a 30
driver over time. In addition, more seriously, further analysis 20
of these data can also disclose sensitive privacy information,
10
which includes drivers’ working patterns and the most likely
appeared locations, which could be a restaurant, a gas station, 0
0 2 4 6 8 10 12 14
or even the real home. Number of Days
Figure 6: CDF of shared drivers only use Lyft or Uber.
C. Attack #2: Uncovering Drivers Employment Status and
Preference
In addition to the interesting observation about drivers may
work for multiple RHSes, this attack is also inspired by a news Figure 5 shows two examples of overlapped paths of an
report. More specifically, Uber was reported to used the Hell overlapped driver. The red path with start and end markers is
program to spy on Lyft drivers from 2014 to 2016, in order to from the Lyft dataset and the green is from the Uber dataset. In
identify drivers working for both platforms and convince them Figure 5(a), the two paths start from almost the same location
to favor Uber with additional financial rewards [11]. But it is (start markers are overlapped) but end in different locations;
still unclear how technically Uber performed such an attack. and in Figure 5(b), the red path and the green path starts and
Therefore, in this attack, we intend to show that it is possible ends both in different locations. This could happen, because a
to use our collected data to identify drivers using different driver may not perform the same operations on two apps, for
platforms simultaneously, and to reveal which platform is more example, closing one app while keeping the other one running.
of a driver’s favor. We exemplify these attacks on Uber and
Lyft whose data is collected on O’ahu Island, Hawai’i, from
April 13th, 2018 to May 10th, 2018. Drivers Preferences. In addition, our analysis also revealed
interesting elements about drivers’ preferences: 48% of Lyft
drivers is also on the Uber platform, whereas only 30% of
Drivers Employment Status. This attack is to reveal whether Uber drivers is on the Lyft platform. We detailed this aspect
a driver is employed by different RHSes simultaneously. The by looking at the number of days a driver prefers exclusively
main challenge is to compare data points of Uber and Lyft working with one RHS or the other. Figure 6 shows the
drivers and look for matches. To reduce the scope of possible result of this analysis. It indicates that drivers using these two
matches, we first remove obvious contradictions. For example, platforms prefer using Uber over Lyft. Because, more than
drivers that are in two different areas in the same time interval 64% of drivers working for both prefer using exclusively Uber
cannot be the same driver. Afterwards, we select all pairs against only 33% drivers prefer Lyft for at most 14 days, i.e.,
of paths and count the number of points are closer both in half of the time considered for this analysis.
space (i.e., 60 meters) and time (i.e., two seconds). In total,
we identified 401 drivers that are at the intersection of the
835 Lyft and 1, 328 Uber full-time drivers. To validate this Takeaway. Overall, our analysis showed that the Nearby Cars
results, we randomly selected 100 drivers and plotted their API can be used to snoop on drivers using different platforms
paths on the map for visual verifications. We did not notice simultaneously. Interestingly, our analysis showed that drivers
any contradiction against the hypothesis that these drivers are operating in O’ahu Island, Hawai’i tend to prefer the Uber
working for both platforms. platform.
10200 500
500 150 400
400 100 300
20 300 50 20 200 Lyft Drivers Ave Idle Time
200 100 14 Lyft Drivers Ave Rides 14
20
100
150 Uber Drivers Ave Idle Time
15 100 15 12 Uber Drivers Ave Rides 12
20 50
15
Hour
Hour
Hour Hour
10 10 10 10
15
10
Minute(s)
Rides
5 5 8 8
10
5
6 6
0 0
5
0 0 1 2 3 4 5 6 0 1 2 3 4 5 6
0 1 2 3 4 5 6 4 4
(a) (b)
0
2 2
0 1 2 3 4 5 6
Figure 7: (a) Contour lines of Lyft active drivers; (b) Contour
lines of Uber active drivers. On the X axis, 0 is for Sunday 0
2018-04-13 2018-04-20 2018-04-27 2018-05-04
0
and 6 is for Saturday. Date
Figure 8: Ave idle time and rides per day of Lyft and Uber
D. Attack #3: Business Information Leakage
4000
In this attack, we show that the collected data can be 3500 eCab
used by attackers to extract business information of RHSes. 3000
2500
In particular, we focus on RHSes that are operating in the 2000
Number of Drivers
same city, i.e., eCab and Taxify in Paris, Uber and Lyft in 1500
1000
O’ahu Island, Hawai’i, though, it can be conducted between 500
RHSes of different areas for espionage as well. Specifically, 450
400 Taxify
for each pair of competitors, we extract and compare the 350
300
metrics and statistics of their operations with each other, which 250
200
includes the number of drivers, number of rides, distribution 150
100
of active drivers over weekdays and time of the day, and 50
0
waiting time. This analysis is not meant to be a complete 0 5 10 15 20
comparison between organizations; however, it intends to show Hours
the feasibility of such an attack. Figure 9: Active drivers in eCab and Taxify.
Lyft vs. Uber. Consider, for example, that one of the two
RHSes would like to know the number of cars used by the
other competitor as well as the hours and days of activity. The observed in the State of Hawaii which falls on the 1st of May
first part of the analysis answers this question by extracting the (vertical orange bar in Figure 8). In addition, Figure 8 also
distribution of number of drivers over weekdays and time of shows that Lyft has a higher average number of rides and a
the day from our dataset. Figure 7 shows the average number of lower average waiting time than Uber, which indicates that
drivers for each weekday and hour using contour lines. In the Lyft manages to match demand and supply more efficiently
X axis, we use “0” for Sunday and “6” for Saturday. It shows than Uber, despite of the lower number of cars.
that, from Monday to Friday, drivers from both platforms are
more active between 10:00 AM and 5:00 PM, and less active at eCab vs. Taxify. eCab and Taxify are two emerging European
night from 1:00 AM to 5:00 AM. Over weekends, the activity organizations. Basically, eCab is an alliance of traditional taxi
of drivers shifts to later hours. Second, we observe that, at companies whereas Taxify is a more recent company with a
each given time, Uber has more active drivers than Lyft, i.e., business model similar to Uber and Lyft. These two organiza-
about a factor of 2X. Also, we notice a peak of Uber drivers on tions may have interest in the number of cars owned by the
Mondays. We did not observe a similar peak for Lyft. We could competitor to make decides on the business development. To
not find a reasonable explanation for this observation. Based this end, our analysis discovered 7, 973 cars are operated under
on this analysis, we can conclude that Uber has a considerable eCab, who claims to have 7, 700 cars in Paris6 , and 3, 565 cars
advantage over Lyft on the O’ahu Island. are owned by Taxify that claims to operate 2, 000 to 5, 000 cars
An RHS may also be interested in comparing the per- in Paris [16].
formances of its own operations with its competitors. In The two organizations may also be interested in extracting
practice, RHSes deploy algorithms to match riders to drivers the type of clientele of the competitor. Figure 9 shows the
and indicate areas where there is a higher demand of rides. distribution of average active drivers from both eCab and
The efficiency and accuracy of these algorithms is crucial Taxify. The number of active drivers increases from 5:00 AM
to optimize the use of resources. Our dataset can also be to about 3:00 PM. After that, the number of eCab drivers drops.
used to answer this question. For example, Figure 8 shows However, Taxify does not show the same trend. Instead, it
the daily average number of rides and average waiting time, keeps a quasi-steady shape till midnight. The type of riders
which shows periodic patterns over four weeks except for the can explain the different evening/night pattern. For example,
third week between April 28th and May 2nd. This anomaly
is believed to be caused by the Lei Day, a public holidays 6 See eCab’s website https://www.e-cab.com/en/paris/
11You can also read