Marlborough District Council - Road Asset Activity Management Plan 2018-2021
←
→
Page content transcription
If your browser does not render page correctly, please read the page content below
Marlborough District Council - Road Asset
  Activity Management Plan 2018-2021

                   page 1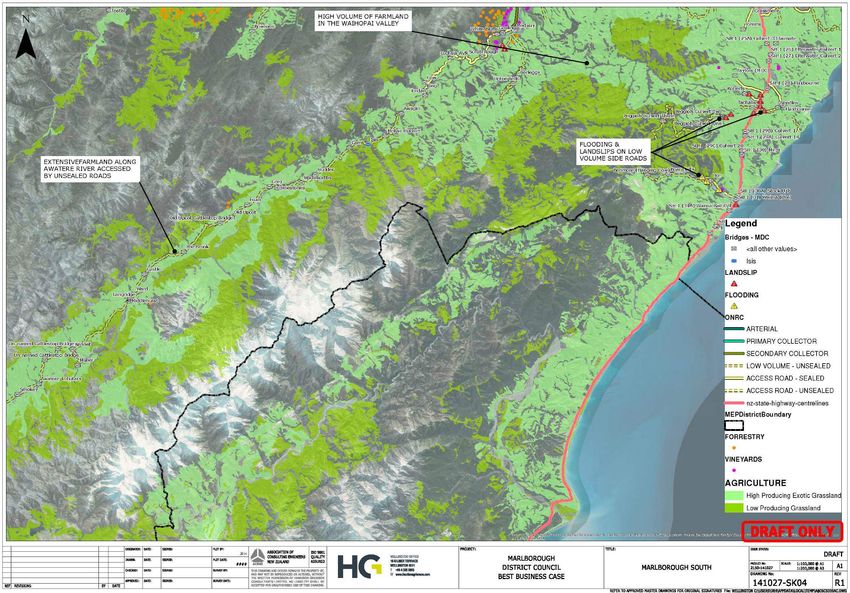
page 2
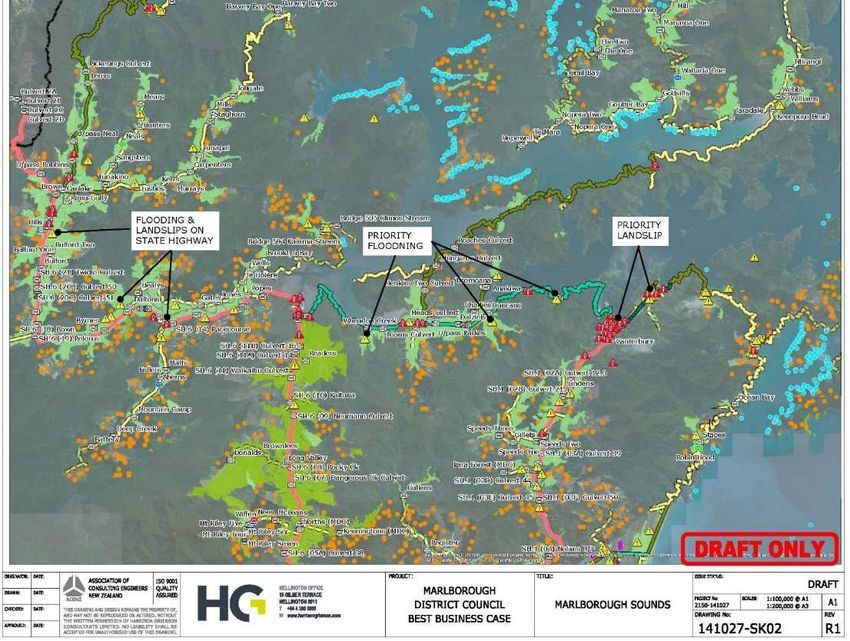
Table of Contents
1.0      Strategic Context ................................................................................................................................................. 6

  1.1         Purpose............................................................................................................................................................. 6

  1.2         Strategic Alignment with NZTA ............................................................................................................................ 6

  1.3         Strategic Direction............................................................................................................................................... 6

  1.4         Executive Summary............................................................................................................................................ 7

2.0      Overview .............................................................................................................................................................. 8

3.0      Economic and Population Growth .................................................................................................................... 10

  3.1         Primary Industry Sectors ............................................................................................................................. 11

  3.2         Secondary Industry Sectors ......................................................................................................................... 12

4.0      Demographics.................................................................................................................................................... 14

5.0      Stakeholder Engagement Process and Outcomes............................................................................................. 17

  5.1         Stakeholder Consultation process ............................................................................................................... 17

  5.2         Summary of Stakeholders Consulted .......................................................................................................... 17

  5.3         Customer Satisfaction.................................................................................................................................. 18

  5.4         Customer Outcomes - Levels of Service ...................................................................................................... 18

6.0      Summary of Current Land Transport Activities, Problems, Benefits, Outcomes and Priorities ..................... 20

  6.2         Description of Road Network Priority problems.......................................................................................... 23

  6.3         Identification of Road Network Priority Benefits and Outcomes ................................................................ 25

  6.4         Confidence in Delivery ................................................................................................................................. 26

  6.5         Minor IMPROVEMENTS ................................................................................................................................ 26

7.0      Links to the ONRC Customer Outcomes........................................................................................................... 27

8.0      Geospatial Representation of the ONRC, primary industries and Regions Problems...................................... 28

  8.1         One Road Network Classification ................................................................................................................ 28

  8.2         Primary Industries........................................................................................................................................ 28

  8.3         Bridges .......................................................................................................................................................... 28

  8.4         Unsealed Roads ............................................................................................................................................ 28

  8.5         Landslips and Flooding ................................................................................................................................ 28

9.0      Programme Case - Link to Strategic Case ......................................................................................................... 34

10.0     Deterioration of Bridges and Culverts Level of Service .................................................................................... 35

  10.1        The Problem Explained ................................................................................................................................ 36

  10.2        Benefit 1 - Improved Safety.......................................................................................................................... 37

  10.3        Benefit 2 – Increased AcCessibility .............................................................................................................. 37

  10.4        Benefit 3 – Increased Resilience ................................................................................................................... 37

  10.5        Benefit 4 – Increased Amenity ..................................................................................................................... 38

  10.6        Cost Efficiency .............................................................................................................................................. 38

  10.7        2018 – 2021 AMP Programme ....................................................................................................................... 38

11.0     Deterioration of Unsealed Roads Level of Servicepage   3
                                                          ............................................................................................ 40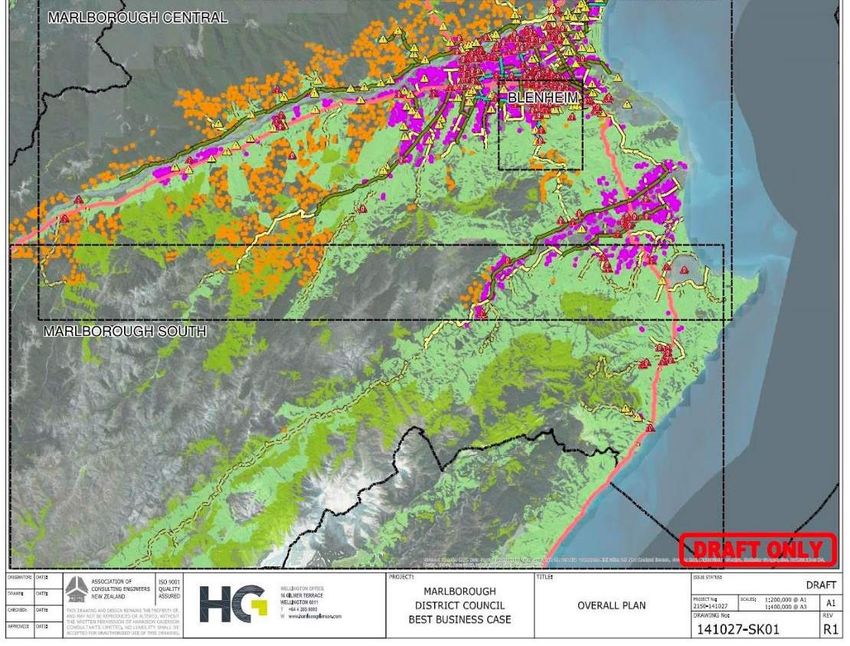
11.1       The Problem Explained ................................................................................................................................ 41

  11.2       Benefit 1 - Improved Safety.......................................................................................................................... 42

  11.3       Benefit 2 – Increased AcCessibility .............................................................................................................. 44

  11.4       Benefit 3 – Increased Resilience ................................................................................................................... 44

  11.5       Benefit 4 – Increased Amenity ..................................................................................................................... 44

  11.6       Cost Efficiency .............................................................................................................................................. 45

  11.7       2018 – 2021 AMP Programme ....................................................................................................................... 45

12.0     Landslips and Flooding...................................................................................................................................... 46

  12.1       The Problem Explained ................................................................................................................................ 47

  12.2       Benefit 1 - Improved Safety.......................................................................................................................... 48

  12.3       Benefit 2 – Increased AcCessibility .............................................................................................................. 48

  12.4       Benefit 3 – Increased Resilience ................................................................................................................... 48

  12.5       Benefit 4 – Increased Amenity ..................................................................................................................... 49

  12.6       Cost Efficiency .............................................................................................................................................. 49

  12.7       2018 – 2021 AMP Programme ....................................................................................................................... 49

13.0     Conflicting Road Network Use .......................................................................................................................... 51

  13.1       The Problem Explained ................................................................................................................................ 52

  13.2       Benefit 1 - Improved Safety.......................................................................................................................... 53

  13.3       Benefit 2 – Increased AcCessibility .............................................................................................................. 53

  13.4       Benefit 4 – Increased Amenity ..................................................................................................................... 53

  13.5       Cost Efficiency .............................................................................................................................................. 55

  13.6       2018 – 2021 AMP Programme ....................................................................................................................... 55

14.0     Activity Management Plan Overview ................................................................................................................ 56

  14.1       AMP Section 6.1 - Sealed Pavement ............................................................................................................. 58

  14.2       AMP Section 6.2 – Unsealed Roads .............................................................................................................. 59

  14.3       AMP Section 6.3 - Drainage Facilities .......................................................................................................... 60

  14.4       AMP Section 6.4 – Bridges and Culverts....................................................................................................... 61

  14.5       AMP Section 6.5 - Other Structures ............................................................................................................. 62

  14.6       AMP Section 6.6 - Environmental Monitoring ............................................................................................. 63

  14.7       AMP Section 6.7 - Footpaths ........................................................................................................................ 64

  14.8       AMP Section 6.8 - Vehicle Crossings ............................................................................................................ 65

  14.9       AMP Section 6.9 – Cycle ways ...................................................................................................................... 66

  14.10      AMP Section 6.10 - Traffic Services.............................................................................................................. 67

  14.11      AMP SectION 6.11 - Street Furniture ........................................................................................................... 68

  14.12      AMP Section 6.12 – Street Lighting .............................................................................................................. 69

  14.13      AMP SecTION 6.13 – Car Parks..................................................................................................................... 70

  14.14      AMP Section 6.14 – Wharves / Jetties........................................................................................................... 71

  14.15      AMP Section 6.15 – Legal Road .....................................................................................................................
                                                                  page 4                                                                                         72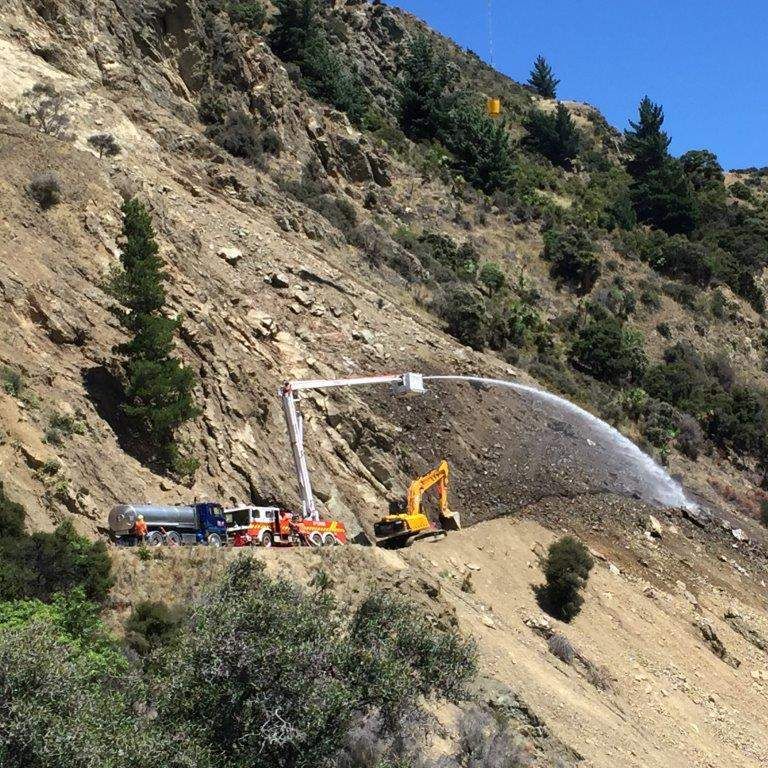
14.16       AMP Section 6.16 – Misc Activities............................................................................................................... 73

   14.17       AMP Section 6.17 – Minor Works ................................................................................................................. 74

   14.18       AMP Section 6.18 – Management ................................................................................................................. 75

   14.19       Public Transport ........................................................................................................................................... 76

   14.20       Emergency Works ........................................................................................................................................ 77

15.0      Improvement Plan ............................................................................................................................................. 78

Appendices ................................................................................................................................................................... 81

                                                                                   page 5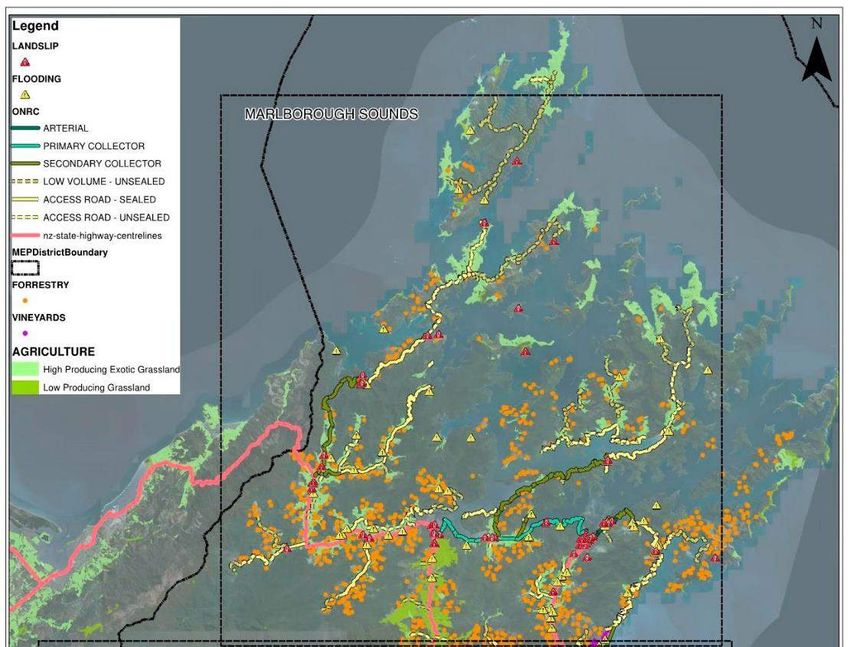
1.0 STRATEGIC CONTEXT

1.1   PURPOSE

As part of our statutory obligations, Marlborough District Council, must undertake a 3 year Strategic
and Programme Business Case review of our existing Road Asset Activity Management Plan. The
purpose of the exercise is to ensure that our region is strategically aligned with national transport
policy and that our investments achieve the requirements set out within the Government Policy
Statement on Land Transport and Regional Land Transport Plan. It provides us an opportunity to
reflect on how we are progressing with the current 10 year plan, what changes have occurred and
whether we need to re-prioritise our investment objectives.

This document aligns with the New Zealand Transport Agency’s purpose. Which is to contribute to an
effective, efficient and safe land transport system.
        “Put simply, we focus on building a better transport system for New Zealanders. This is because
        transport has a major part to play in the country’s economic growth and productivity, the smooth
        functioning of our communities, and the quality of life of our citizens.”
The current Regional Land Transport Plan states: “The Top of the South vision is of an efficient and resilient
network that is well able to bounce back from unplanned events.”
The overall objective of the current Roading Infrastructure Asset Management Plan 2015-2018 is:
        “To meet the existing and future communities required levels of service through the creation, operation,
        renewal or replacement and disposal of road assets in the most cost-effective way using the most efficient
        management techniques.”
In the 2017/18 year Council has budgeted, in its subsidised roading programme, to spend a total of
$11.5million with $6.04 million on the maintenance and management of the network and a further
$5.46 million on renewals. The operating costs of this activity represent approximately 20% of
Council’s total activity revenues (2012-2022 LTP).

The level of expenditure on roads, the demands of growth and the increasing age of the infrastructure
means that is vitally important that sound practices and systems are in place to ensure investment in
the road network provides value for money.

1.2   STRATEGIC ALIGNMENT WITH NZTA

NZTA Has developed a Long Term Strategic View for Planning and Investment.

A key point of alignment with Marlborough Roads will be the “Inter-regional journeys” where SH1 is
identified as a nationally significant journey connecting regions that sustain our economy. It links
major urban areas and production centres to the port of Picton.
Inter-regional journeys aim to provide a safe, reliable and resilient network, which is needed to
support economic growth and to provide confidence for investment. The Road Asset Activity
Management Plan will support the strategic objective for SH1 in Marlborough.

1.3   STRATEGIC DIRECTION

There are currently no known transforming drivers that would affect the current strategic direction of
activity management planning for transport in Marlborough.
Transforming drivers would be external pressures that require significant intervention to sustain the
current levels of service. These could be external pressures that would contribute to a change of use
or result in a cost effect change that is greater than 10% of current activity management costs.

                                                     page 6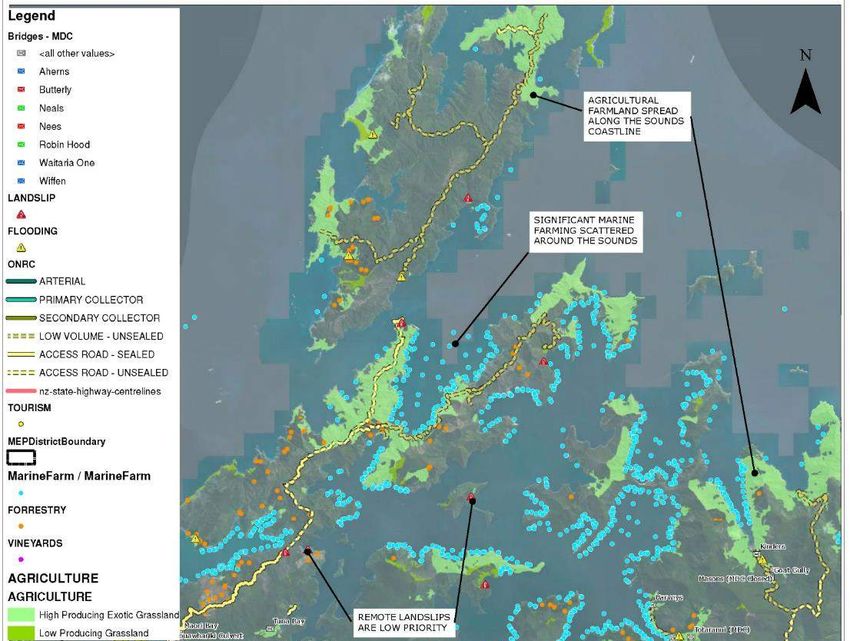
1.4   EXECUTIVE SUMMARY

                                                                    Marlborough District Council land
                                                                    transport activities are based
                                                                    around Resilience, Safety and
                                                                    Mobility and Environment.

                                                                    Our priority problems are
                                                                    associated with bridge
                            Resilience                              deterioration, unsealed road
                                                                    deterioration and dust control,
                                                                    landslips and flooding, and
                                                                    conflicting road network use.
                                                                    Our critical bridge assets, linking
                                                                    communities, industries and
                                                                    recreational activities are
                                                                    deteriorating meaning that safety
                                                                    and access is at risk.

                                                                    Parts of our unsealed roading
                                              Safety &              network, supporting our primary
        Environment
                                              Mobility              industries, tourism and local
                                                                    communities, are negatively
                                                                    affecting safety and ease of
                                                                    movement through the region.
                                                                    Our road network is susceptible to
                                                                    closures by slips and flooding
                                                                    meaning that accessibility, mobility
                                                                    and resilience is unreliable.
 The increases in viticulture, forestry, tourism and people retiring in the area is resulting in parts of
 our network now being used by many different people for many different purposes, creating
 conflicts on the network.

 Our investment programme is targeted towards raising our levels of service for our customers, as
 defined in the One Network Road Classification, by increasing resilience, improving safety and
 increasing accessibility.

                                                   page 7
2.0 OVERVIEW
Marlborough is situated in the north-east corner of the South Island, accessible by ferry, train, air, or
road. The road network administered by Marlborough District Council, (Council) as at July 2016
consists of 1,535 kilometres of formed road and is Council’s largest infrastructure asset with an
optimum depreciated replacement value of $513 million excluding land (June 2016).

The transport network consists of the following key elements:
•     1,535 km of formed road
      - 899 km sealed,
      - 635 km unsealed
•     234 km of footpath
•     332 km of kerb and channel
•     367 bridges
•     9 footbridges
•     18 wharves
•     7,058 m of retaining walls
•     6,058 culverts
•     2,936 m guard rail
•     7,544 m sight rail
•     4,759 streetlights
•     13 off street car parks
•     9,386 traffic signs street furniture and features

                                                  page 8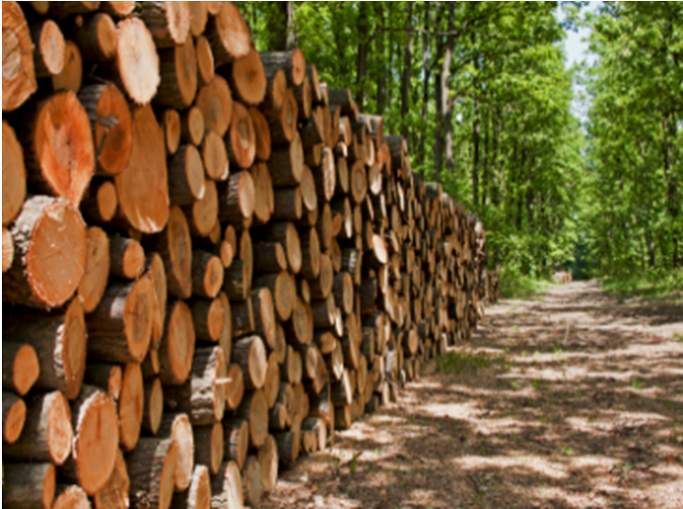
The One Network Road Classification
(ONRC) is a major shift in the road
management framework at national
and regional levels. It divides New
Zealand’s roads into six categories
based on how busy they are, whether
they connect to important destinations,
or are the only route available. These
categories are identified in the graphic
on the right.
The most important concept behind the
ONRC is that it places the customer at
the heart of every investment decision.
Consequentially, once a road has been
classified under the ONRC, it should be
maintained to the Customer Level of
Service (CLoS) for roads of its type. The
CLoS are:

     •   Mobility
     •   Safety
     •   Amenity
     •   Accessibility

The focus of the ONRC shifts from
technical solutions to customer
outcomes, and because of this the
performance measures do not prescribe
specific operational tasks – but rather
an appropriate solution and work
programme for the region, providing it
demonstrates good customer focus
(specifically including road users and
tax/rate payers). There are three types
of ONRC performance measures:

     •   Customer Outcome
     •   Technical Output                                 Marlborough Roads
     •   Cost Efficiency                                   by Classification
Value-for-money is a key consideration, with an                  1%   6%
opportunity for smarter activity management
and greater collaboration.
                                                                           20%   Arterial
Within the context of these road classifications,
there are regional requirements and priorities
                                                                                 Primary
that reflect the nature and makeup of the local
                                                                                 Collector
community and associated economy, within the
geographic context of Marlborough.                                               Secondary
                                                                                 Collector
                                                           73%
Marlborough’s roads have been classified, with
                                                                                 Access
the following distribution shown in the graph
opposite.

                                                 page 9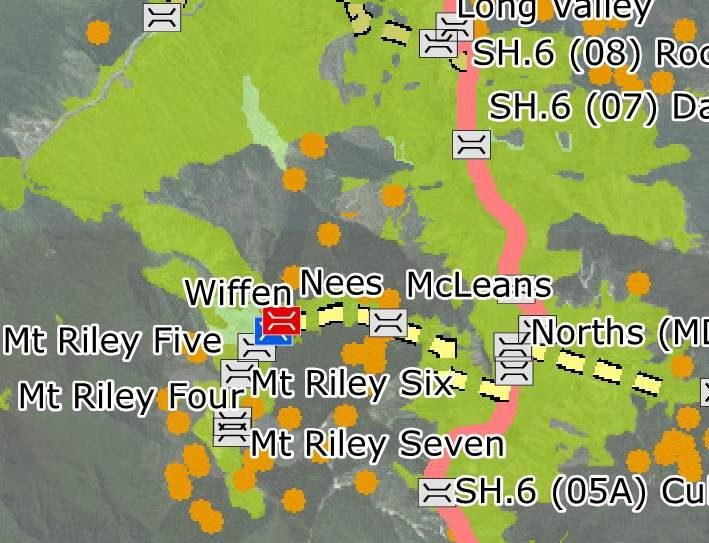
3.0 ECONOMIC AND POPULATION GROWTH

                                                             We recognise the important role that local
                                                             roads have in connecting communities,
                                                             businesses and markets and that our
                                                             transport network enables economic growth
                                                             for the region in our primary and secondary
                                                             sectors.
                                                             The Infometrics 2016 publication of the
                                                             regions GDP statistics prove the area is
 Source:
                                                             continuing to grow overall, albeit with some
 https://ecoprofile.infometrics.co.nz/Marlborough+Region
                                                             industries increasing and others decreasing.

Primary sector industry associated with viticulture, forestry, aquaculture, agriculture, salt
manufacturing and aviation equates to approximately 34% of the regional GDP. Secondary sector
industry associated with construction, utilities, tourism related services, professional services, and
public services required to support the primary sectors also equates to approximately 39% of the
regional GDP.
Our road network is key infrastructure that supports our GDP. Our Primary Industries use the whole of
the network whilst our supporting secondary industries are generally focused around our townships
and villages.

                                                   page 10
3.1 PRIMARY INDUSTRY SECTORS
Viticulture
Viticulture has seen significant growth over the past 15 years
and now dominates the lowland sections of the Wairau and
Awatere Valley. Over the last decade the Marlborough
District has successfully converted most of the land formerly
dedicated to cropping and stone fruit orchards into
viticulture so that it is now New Zealand’s largest grape
growing region producing 77% of New Zealand’s total wine
production.
Forestry
Forestry is another industry that has seen significant growth
in the last decade. The movement of logs is heavily
dependent on road transport. The forestry harvest in the
Marlborough Region is expected to increase significantly once
economic factors improve.
The forestry sector in the region has reached a sustainable
yield of 1,000,000 cubic metres of raw product per annum
(requiring transporting over the Council’s Roading Network),
which is likely to continue for the foreseeable future. (Source:
Merrill and Ring, Forestry Consultants/Farm Forestry Assn.)
Aquaculture
The Marlborough Sounds has a significant mussel and
salmon farming industry with farms located throughout the
Sounds and manufacturing and distribution facilities located
around the region. Marlborough currently produces more
than 90% of New Zealand’s green shell mussel exports.
Salmon farming is also well established within the Sounds
with current production around 7,500 tonnes a year it is
expected to continue to grow.
Agriculture
The requirement for land for vineyard development has seen
a significant reduction in both pastoral and horticultural land
use within Marlborough. Most remaining orchard and
cropping land is located within the lower Wairau Valley.
Dairy farming is mainly located within the Kaituna and Rai
Valley areas whilst sheep and deer farming is generally
confined to the upper Wairau Valley, upper Awatere Valley
and south of Seddon. No growth in dairy farming is expected
and some conversion to viticulture use may occur.
Salt Manufacturing
The salt works at Lake Grassmere on the coast south of
Seddon produces 60,000 to 70,000 tonnes of salt per year
predominately for the domestic markets. The majority of the
harvested salt is transported to Picton for shipping.
This production cartage is all via SH 1 (Grassmere to Picton)
and has a minimal impact on the Council’s roading network.
page 11Aviation
The Top of the South is home to Air Nelson, HNZ Global and
the NZ Defence Force facility at Marlborough Airport.
Aviation makes a considerable contribution to the Top of the
South’s economy, with a combined contribution to the Top of
the South’s GDP of $98 million in 2012.
Both airports are served by SH6 and the adjoining local road
network which are identified as key journey routes.
Marlborough also is home of the Aviation Heritage Centre,
attracting national and international visitors.
3.2 SECONDARY INDUSTRY SECTORS
As the ferry transit point for Wellington and entrance to the
Marlborough Sounds, Picton is geared for tourism. Port
Marlborough, in the Marlborough Sounds, is the main portal
for freight and tourists travelling between the North and
South Islands.
The Marlborough region, in particular the Marlborough
Sounds, is renowned as an area of natural beauty in New
Zealand. The Sounds are approximately 20% of New Zealand’s
total coastline length with numerous bays and waterways.
The other main focus of tourism is the viticulture development and associated wineries and
restaurants. Marlborough promotes itself as “the gourmet province”.
Other tourism related activities include high profile rural accommodation and access to the Nelson
Lakes National Park for fishing, skiing, hunting and other alpine pursuits.
Tourism is predicted to continue as a growth industry, the marine farming industry may expand
with legislative change, forest harvests are predicted to increase, although the timing of this
increase will be influenced by wider external economic factors, and although grape growing in
conjunction with wine production has experienced challenges in the past years it is at this stage
predicted to continue to grow.
Owner Occupied Property Operation
The demand for additional office space is growing in the
region, especially in Blenheim. Initiatives being considered to
help meet this demand include the Small Business Incubator
and Community and Small Business Support Centre. The
Incubator initiative is to incubate and grow local start-up and
home based businesses, whilst the Business Centre focuses on
time-share use by Marlborough small businesses, local
community groups, after school tutoring, and visiting public
and private advice agencies.
Rental, Hiring and Retail Services
People relocating to the area, as a function of the primary
industry growth, retirement and tourism is increasing
demand for rental, hiring and retail services.
page 12Electricity, Gas, Water and Waste Services
The Council provides Marlborough's urban areas and main
townships with the essential utility services of sewerage
reticulation and treatment, water supply and stormwater
disposal.
The levels of service provided depend on the size of the urban
population and the cost of servicing the particular area.
Generally, standards are being improved throughout the
district. However, urban growth is creating some funding
challenges.
Healthcare and Social Assistance
A comprehensive range of health services is available in the
region including a hospital in Blenheim. Community
organisations and services are available in the region,
provided by both smaller local groups and larger national
organisations such as the Plunket Society to support
children’s development and an hospice which provides to
those with life-limiting illness.
Construction
The construction sector is largely driven by the primary
industries in the region. The Marlborough economy is strong,
creating hundreds of new jobs which is attracting more
people to the region, consequently putting pressure on
housing demand.
There are about 2200 construction workers in Marlborough at
present, another 500 could be needed. Building companies
reported being fully booked for up to 18 months in advance,
and many companies are struggling to find skilled workers to
meet demand.
Retail Trade
Consumer confidence is high and new businesses to
Marlborough are "coming in and trying new things". An influx
of new residents to the region has had a positive effect to the
revival of new businesses.
page 134.0 DEMOGRAPHICS
The resident population of the Marlborough region, at the time of the 2013 census was 43,416. There
are 17,943 households with the majority of these located in the larger towns and serviced settlements
with the balance in un-serviced settlements and rural areas.
The main population of Marlborough is centred in the town of Blenheim (24,183), followed by Picton
(4,056), which is 25km north of Blenheim.
The following chart shows the demographic composition of Marlborough District for 2013 and 2006.
One feature of this comparison is the increase in those aged 60 and above.
Source: https://ecoprofile.infometrics.co.nz/Marlborough+Region
The district’s population is expected to increase over the next ten years as a result of the employment
opportunities created primarily in the viticulture, forestry and tourism industries. This increase will
impact on the roading network both in demands for increased levels of service and network capacity
(e.g. increased seal width).
It is anticipated that approximately 75% of new development will be in and around the existing towns
and serviced settlements and the balance in rural areas and small un-serviced villages. There is
increasing pressure for development of commercial complexes in the district that is placing pressure
on the development rules under the existing District Plan. This is affecting urban fringe areas and can
have an impact on the roading infrastructure as demand in these areas can alter significantly in a
relatively short period of time.
In order to help plan for growth the Council have identified the following key factors:
• Demographic/Population Trends
• Being “Smart and Connected”
• New Residential Dwellings and Subdivision Activity
• Vehicle Usage Trends
• Modal shift including Public Transport and Walking and Cycling
page 14The following population projection graph shows high medium and low forecasts out to 2043. The
current perception is that high growth will continue to increase into the future over the short to
medium term.
Marlborough District Council has developed a number of strategies and studies for the future
development of the Region including;
• Marlborough Townships and Small Settlements Growth Study, July 2007
• Blenheim Urban Strategy
• Northern Marlborough Growth Strategy
• Southern Marlborough Growth Strategy
• Parking studies
• Network Accessibility Plans
The existing road network in the study area is generally in reasonable condition both from a safety
and capacity perspective. There are however significant actions and opportunities that can assist in
achieving a sustainable transport system into the future.
page 15The following chart shows the means of travel to work within Marlborough District for 2013 and 2006.
One feature of this comparison is the increases in those who drive a private or company car/truck/van
to work, or who worked from home. Public transport usage is showing a decline, as are those who
walk to work.
Source: https://ecoprofile.infometrics.co.nz/Marlborough+Region
In addition to private and commercial road use, the following modes of transport also need to be
considered in support of the community:
Public Transport
The Blenheim area currently has one 44 seat passenger bus
operating in Blenheim on weekdays and Saturday mornings. This
service completes a series of loops around the town’s suburban
area and provides a school run service in the mornings and
afternoons. This service is operated by the Council and subsidised
by the NZTA. The service commenced 9 years ago on a 2 day per
week basis and has grown to the current service. Council monitors
the occupancy rates of the service and is reviewing the future
strategy.
Walking and Cycling
The vision of the Marlborough District Council Walking and Cycling
Strategy is that Marlborough people and visitors walk and cycle safely for
travel, health and enjoyment. The objectives of the Strategy are to
encourage and support people in Marlborough to choose walking
and cycling for an active and healthy lifestyle, and to develop a
safe, convenient and attractive travel network for walking and
cycling.
page 16Mobility
The ageing population within the area require better mobility in
and around the area. Designated mobility routes need to be
carefully planned within the context of other road users within the
transport network. Due to the growth of the different modes of
transport, modifications will be required to accommodate the
requirements of mobility scooters.
Blenheim town centre has good parking capacity, however
improvements in disabled parking placement and facilities may be
required.
Campervans
The tourism industry brings a significant amount of campervans to
our region and they are a key mode of transport for our visitors.
Scenic look outs, beaches and other naturally beautiful places are
often off the ‘beaten track’. Transport challenges associated with
access roads and current customer levels of service need to be
considered to ensure the safety of all road users including tourists.
5.0 STAKEHOLDER ENGAGEMENT PROCESS AND OUTCOMES
5.1 STAKEHOLDER CONSULTATION PROCESS
The customers, road users, are important to the Council. They take a proactive approach in engaging
with them and regularly attend regional and local work group meetings. The Council has a hotline for
any reactive incidents that need resolving so that they can respond quickly and efficiently in the event
of unforeseen activities occurring on the network.
5.2 SUMMARY OF STAKEHOLDERS CONSULTED
Marlborough Roads have consulted with the following key stakeholders over the past three years:
• Road Transport Association • D’urville Island Roading • Port Underwood roading
• Marlborough ratepayers committee committee
• Top of South Roading • Access and mobility forum • Picton Smart and
Advisory Group • French Pass Roading Connected
• Okiwi Bay Rate Payers committee • Ngakuta Bay rate payers
• Police • Flaxbourne settlers • Wairau valley community
• Wood group (forestry) • Rural Advisory Group • Ports of Marlborough
• Top of South Freight Forum
• Sounds Advisory Group • Cissy Bay Roading • Picton business association
Committee
• Seddon rate payers • Havelock Community • AA
• Tennison Inlet /Duncan Bay • Anikiwa / Tirimoana rate • Marlborough District
• Renwick Smart payers Council staff and customer
services
• Wine growers group • Kenepuru and Central • Awatere Valley roading
Sounds Rate Payers committee
This Strategic Case has been consulted with, and endorsed by, the Regional Transport Committee.
page 175.3 CUSTOMER SATISFACTION
The Marlborough District Council 2016 Annual Residents Survey provides customer satisfaction
evidence across the roading network. Our residents perceive the roading and footpath networks as a
high priority (8.2 out of 10) with a reasonable level of performance (6.7 out of 10).
Regarding Roads and Footpaths, in most instances, the provision of Street lighting and sealed roads
gained the highest satisfaction ratings across the district (79.2% and 71.5% respectively). Footpaths at
62.2% was up a little from 60.6% in 2015. Unsealed roads at 50.0% was down from 51.3% in 2015.
Negative comments for the unsealed roads included poor maintenance or lack of maintenance. Over
time, the overall satisfaction with road and footpaths has increased slightly.
Note: This does not apply to State Highways. Unsealed roads are located mainly in Awatere,
Marlborough Sounds and some in Western Wairau.
5.4 CUSTOMER OUTCOMES - LEVELS OF SERVICE
The introduction of the ONRC system by the Transport Agency nationally has allowed us
standardise our roading classification.
All national and regional roads in the region are part of the state highway network and are the
responsibility of the New Zealand Transport Agency. This activity management plan focuses on
the remaining road classifications as expanded on below.
page 18Arterial roads are in generally good condition but do experience capacity issues at peak times, especially around intersections. Some intersections are not ideal with regards to safety. Cycling and walking communities are growing and more requests for improved cycling and pedestrian facilities at crossing points are being submitted. Primary Collector roads are generally perceived to be in good condition. In urban environments there are ongoing requests received for the road surfacing to be improved. In rural environments there are ongoing requests to improve signage, reduce road deterioration, and provide seal widening. Secondary Collector roads need to be constantly monitored, maintained and renewed to ensure our primary industry sectors are supported. Viticulture, forestry and aquaculture sectors are requesting increased seal widening and the rehabilitation of pavements. Resilience issues from flooding and slips are experienced across all Secondary Collector roads. Access roads in rural areas are typically unsealed and we see a significant customer demand for increasing the level of service on these routes. Access roads in urban areas are in generally good condition but can experience challenges with trees, vegetation, drainage which can result in resilience issues. page 19
6.0 SUMMARY OF CURRENT LAND TRANSPORT ACTIVITIES,
    PROBLEMS, BENEFITS, OUTCOMES AND PRIORITIES

                                                      The 4 Regional Objectives as stated in the
                                                      current Regional Land Transport Plan are still
                                                      valid for the region and are as follows:
                 Resilience                           •     A sustainable transport system that is
                                                            integrated with well planned
                                                            development, enabling the efficient and
                                                            reliable movement of people and goods to,
                                                            from and throughout the region
                                                      •     Supporting economic growth through
                                                            providing better access across the Top of
                              Safety &                      the South’s key journey routes
    Environment
                              Mobility
                                                      •     Communities have access to a resilient
                                                            transport system
                                                      •     Communities have access to a reliable
                                                            transport system

These objectives can be grouped under three headings – Resilience, Environment and Safety and
Mobility.

                                 Resilience is the ability of a network to withstand, recover, and
                                 operate at the desired level of service, when subjected to
                                 significant disruptions and shifting circumstances.
                                 The roading network becomes particularly critical in a natural
                                 disaster. Access of emergency response, the delivery of ongoing
       Resilience                community support and access for the reinstatement of lifeline,
                                 communications etcetera are critical functions which must be
                                 maintained or reinstated as soon as practical.

                                 The first stage of resilience is reducing risk by ensuring the
                                 network is:
                                 •     Kept operational through timely and appropriate
                                       maintenance intervention
                                 •     Kept in sound condition through timely and appropriate
                                       renewals
                                 •     Regularly undertake preventative maintenance
                                 •     Ensure all design of roading renewals and upgrades take
                                       account of possible future conditions.

 The second stage is being prepared for when the inevitable happens. Emergency Management
 Plans should be well understood, kept up to date and that the key contacts are aware of the
 responsibilities and processes required.

 The third and final stage of resilience is recovery, how the network is returned to a required level
 of service once the dust has settled. The key elements of this stage are to follow the set processes
 for the management of recovery. The recent storm and earthquakes experienced in the region
 have been a timely reminder of the importance of resilience and why our successful activity plan
 programmes are crucial to the regions success.

                                                 page 20
Environment
The ability to protect the natural and built environment, including
quality and aesthetics.
Environment The Marlborough Region enjoys being New Zealand’s sunniest
climate, receiving almost 2,500 hours of bright sunshine per
annum. Summers in Blenheim are warm and dry. Winters are
sunny and generally pleasant, although frosts and chilly nights
are more common in Blenheim than in most North Island
locations.
The dry weather however brings environmental challenges to the
roading network associated with dust and severe thunderstorms
resulting in flash flooding, landslides which all pose a risk to the
health and safety of our users and condition of our network.
Safety and Mobility
The ability to safely access and reliably move throughout the
network.
Safety &
The land transport network allows for the movement of freight
Mobility and visitors, both of which are essential to our economic well-
being. Access and/or mobility restrictions can impact on an
individual’s, or a community’s, ability to participate in commerce
and any other activities.
Development pressure, due to primary industry, tourism and
elderly retirees, will result in continued growth in the region. As
such the transport network will need to adopt to meet the
demand.
The Marlborough Regional Land Transport Committee have
determined the vision for the Marlborough RLTP to be:
The Top of the South vision is of an efficient and resilient network that is
well able to bounce back from unplanned events.
page 21The common activities within Marlborough District have been categorised accordingly, where
applicable, and are listed below.
Activities relating to environment being Activities relating to resilience being undertaken
undertaken on the network are : on the network are:
• Erosion and Sediment Control • Bridge and culvert maintenance and
• Flood Protection Works renewals
• Weed Control, • Unsealed road maintenance and dust control
• Unsealed road maintenance and dust control • Intersection upgrades
• Flooding repairs • Flood Protection Works
• Landslip repairs • Landslip Prevention Work
• Drainage maintenance and renewals • Wharves maintenance
Resilience
Priority
Safety and
Environment
Mobility
Activities relating to safety and mobility being
undertaken on the network are:
• Unsealed road maintenance and dust control • Public transport improvements
• Landslip prevention work • Footpath maintenance and upgrades
• Flood prevention works • New traffic lights for crossings and
intersections
• Pavement renewals and maintenance
• LED Street light upgrades
• Bridge and culvert maintenance and
renewals • Roundabout renewals and maintenance
• Road safety promotional campaigns • General streetscape amenity improvements
• Cycleway maintenance and improvements
Identified external problems on the network
include:
• Lack of general non car based mobility • Pedestrian and cycle safety in townships
• Peak time ring road congestion • Potential new high school access conflicts
• Limited town access for elderly due to • Urban spread with migration of business and
walking distance from parking communities
• New vineyards
page 226.2 DESCRIPTION OF ROAD NETWORK PRIORITY PROBLEMS
The priority problems associated with Safety and Mobility, Resilience, and Environment are
summarised below:
• Deterioration of Bridges and Culverts
• Deterioration of Unsealed Roads and Dust Control
• Landslips
• Flooding
• Conflicting Road Network Use
These problems and their significance are described in more detail below.
Deterioration of Bridges and Culverts
In a sparsely populated, large region like Marlborough, bridges
and culverts are integral to linking roads across waterways and
fundamental in allowing people to connect.
The Marlborough District Council has more than 360 bridges on its
transport network. Currently 28 bridges are posted for not meeting
Class 1 criteria, of which all are posted for restricted speeds, and
seven are also posted for restricted weight.
When bridges fail to meet transportation needs, they become a major focal point for community
concern. It is important that maintenance and renewal programmes continue to build in resilience,
improve customer levels of service across the region and ensure they meet the relevant classification
for the needs of those crossing.
Consequences of bridge failures can be significant and costly. There can be long diversions. Where no
alternative access is in place communities can be cut off for days or weeks until a temporary crossing
can be created.
Given the large number of bridges in Marlborough, conditions assessments will take a reasonable
time. Deferring maintenance costs for bridges will increase risks associated with safety and resilience.
Deterioration of Unsealed Roads and Dust Control
With some 700km of unsealed roads in the region, around 45% of
the overall network, there is a significant investment programme
required to maintain and ensure road users are safe and remain
connected.
Access associated with the forestry industry is one of the main
drivers for the region’s transport investment. Eleven percent of the
region’s GDP is generated from the industry, which is heavily reliant
on the unsealed transport network and on some approved routes,
has to cater for High Productivity Motor Vehicles (HPMV).
Tourist and locals frequently use the unsealed road network as they provide access to remote places
of natural outstanding beauty and rural homes. The unsealed network also services the rural
businesses such as farms, vineyards and forestry.
Unsealed roads require more frequent maintenance as they deteriorate rapidly when exposed to
increased traffic such as logging truck. This rapid deterioration from increased traffic is exacerbated
during wet weather though rills and/or scouring.
When maintenance is deferred the road can become impassable for standard two wheel drive
vehicles, they can cause damage to vehicles and become inherently less safe to drive.
Consequences of this are increased crashes, damage to vehicles from flying gravel, rutting and
potholes, dust nuisance to vehicle occupants and adjacent residents. In the wet there can be
aquaplaning and damage/loss of control from unseen potholes.
page 23Landslips
Where transport networks and landslides meet, is a significant
safety concern and can present significant access issues.
The geology, soils, topography and climate in some parts of
Marlborough combine to create the potential for land instability.
The most obvious example is the land in the Marlborough Sounds
where much of the geology is fractured schist with limited topsoil.
This type of land is naturally unstable where it occurs on steep slopes and especially in times of
intense rainfall as well as earthquake events.
It is difficult to determining the locations and likelihood of landslips as well as an accurate
understanding of the level of risk. Consequently, this makes investment in proactive measures
difficult to justify and results in a much greater reactive programme of work with maintenance
programmes identified for areas of known previous slips.
Landslips have the same connectivity issues as bridges and as they happen in steep terrain there is
much less opportunity for adjacent temporary alternative routes.
As with bridges consequences of landslips can be significant and costly. Long diversions are likely to
be required and if there is no alternative access communities can be cut off for days or weeks until
the slip is removed and road established again.
Flooding
Residents and visitors to Marlborough typically enjoy a sunny and
warm climate. However, sudden and sometimes severe storms do
occur. The road network is needed to provide access to
communities in need of help during these events.
Flooding often results in the need to close roads due to them being
submerged and from the damage caused by erosion from moving
flood water. It can take considerable effort to bring the network
back to an acceptable level of service following a significant rainfall
event.
Flooding where roads are washed out are costly to repair and as with other events, temporary
diversions or alternative routes are likely to be required. Without them communities will be isolated
until the road is reopened, or a temporary link is established.
Where flooding and scour is likely, preventative measures can be used to reduce the risk of road
erosion. As with landslips preventative works are difficult to identify and are usually incorporated
into the repair of areas where flooding has occurred in the past.
Where flood erosion measures have been implemented, they must be maintained in order to be
effective. Otherwise the benefit will be literally washed away.
Conflicting Road Network Use
The increases in viticulture, forestry, tourism and an aging
demographic is resulting in the transport network being used
for many different purposes.
Commercial road use is increasing due to substantial growth in
viticulture and a sustained forestry industry.
Personal road use is increasing from growth in tourism and
population growth that includes people retiring to the region.
Personal mobility uses a range of transport modes that have
conflicting requirements on road space and their own safety
needs.
A key challenge is providing a safe transport network that affordably meets the needs of those that
use it. Changing demographics can alter the focus of investment. Financial pressure could result in
the remoter parts of the network being under funded from a focus on higher priority roads.
page 246.3 IDENTIFICATION OF ROAD NETWORK PRIORITY BENEFITS AND OUTCOMES
The Investment Logic Map below has been developed through informed discussion. Its purpose is to communicate the investment story in a simple
diagram, using plain language.
page 256.4 CONFIDENCE IN DELIVERY
Marlborough District Council has recently had a low delivery compared to programme. This has
primarily been due to recent earthquake events and the impact this has had on the availability of
contractors. Prior performance has been very high.
The Core programme of works is where there is no adjustment to the level of service required. Where
a positive adjustment is made, could be considered Enhanced.
A key part of delivery is procurement for the infrastructure services. Smart procurement practices are
expected to be the norm. Marlborough Council would consider itself to have embraced ‘smart buyer’
principles, with a self-assessment score of 59, Appendix 12, and will seek to improve through
demonstrating greater alignment with the key attributes of smart buyers. These being;
• An improved understanding of costs that better inform their decision making process
• An understanding of the impact delivery models and supplier selection criteria can have on the
value of contracts
• Robust forward work programmes that are communicated to the industry and supported by
budgets that allows the work to be completed
• Knowledge of the network to determine treatments required based on physical evidence and
supported by knowledge of the costs involved
• In house expertise that aids the decision making process and allows acceptance of innovative
solutions possibly with or without the involvement of consultants
• A clear understanding of risk and how it is allocated and managed
• An understanding that lowest price will not always deliver desirable outcomes
• An understanding of whole-of-life value-for-money.
By driving intelligent investment in maintaining the district’s transport network, Marlborough District
will deliver on customers’ expected levels of service. They will ensure that key industry sectors and
communities have access to a transport system that aligns with the strategic policy direction set by
national government and as directed by the Regional Land Transport Plan.
There is a risk that an extension of earthquake reconstruction works in Kaikoura, and other locations,
will have a negative impact on the availability and cost efficiency of design/construction services over
the short-term, and which could result in under-delivery of the transport programme until the market
supply of resources normalises. Due to the rapid, concentrated focus on reconstruction works, it is
expected that the risk of under-delivery is low. It is further expected that any reduction in work over
the next year, could be offset by increases in market capability in following years.
6.5 MINOR IMPROVEMENTS
In Principle these are prioritised small projects up to $1,000,000 which align with governing
documents, expected expenditure and, apart from funding authorizations, otherwise follow standard
processes. The Policy linkage is with Safer Journeys, the One Network Road Classification,
Marlborough Regional Land Transport Plan, and parent documents. The Process is based on a ‘live’
prioritised list where potential projects are evaluated and ranked accordingly. These projects are
identified through the various Marlborough Roads network management routines and safety
processes. Data inputs come from routine driveovers and audits by contracting partners; feedback
from Councillors and Council staff; stakeholder and community feedback; safety inspections; Strategy
Studies; Crash Reduction Studies; Safety Performance Reviews; and the Forward Work Plan. Priorities
are:
1. Sites with repeated Fatal or Serious Injuries over a 10 year period.
2. Sites of Fatal or Serious Injuries, with priority to roads with higher volumes.
3. Other projects with maintenance, capacity, or efficiency benefits, with priority to sites
with highest Social Cost, and/or best value-for-money.
The prioritised list is regularly reviewed. Lower scoring projects are monitored, such that fringe
projects do not get perpetually ignored, to the detriment of the wider network. The list is reviewed
annually by the Council’s Assets and Services Committee and then confirmed by full Council.
page 267.0 LINKS TO THE ONRC CUSTOMER OUTCOMES
The four central problems identified, directly
link back to the three broad categories of Safety
and Mobility, Resilience, and Environment, and
provide measurable improvements in these
areas.
• The Safety and Mobility category ties
directly back into two ONRC CLoS with
respect to Mobility, which also includes
Resilience, and Safety.
• As noted, Resilience is a subset of the
ONRC CLoS with respect to Mobility.
• The third category, Environment, ties
back into the ONRC through CLoS for
Resilience of the route, Amenity and
Accessibility.
More specifically:
• Improving the Bridges and Culverts Level
of Service will increase mobility,
resilience, safety and accessibility of the
network.
• Improving the unsealed roads Level of
Service will increase the mobility,
amenity, safety and the accessibility of
the network.
• Addressing areas prone to Flooding
increase the resilience, safety and
accessibility of the network
• Addressing areas prone to Landslips will
increase mobility, resilience, safety, and
accessibility of the network.
• Providing for customers changing uses of
the network will increase the mobility,
safety and accessibility of the network.
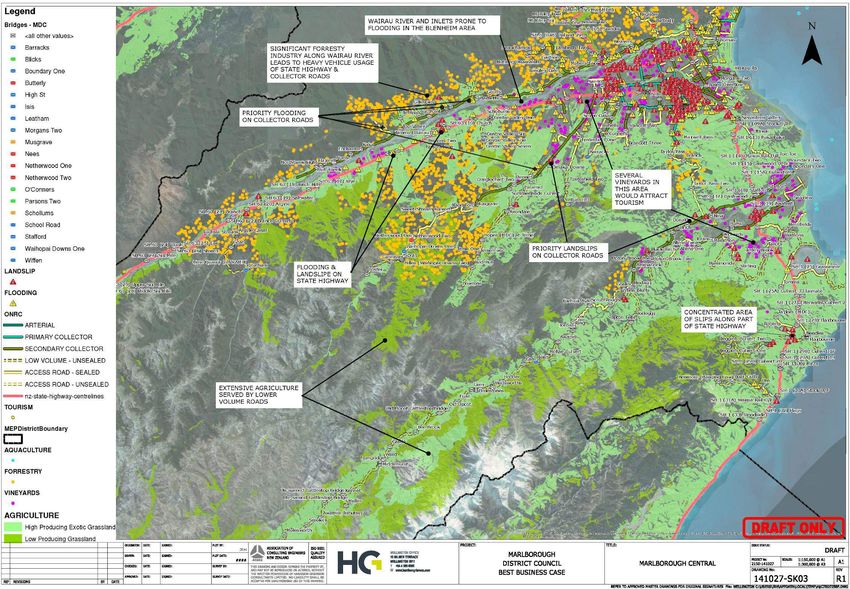
page 278.0 GEOSPATIAL REPRESENTATION OF THE ONRC, PRIMARY
INDUSTRIES AND REGIONS PROBLEMS
A digital geospatial mapping exercise has been undertaken to spatially present the ONRC, primary
industries, bridges, unsealed roads and areas of landslips and flooding. The data has been obtained
from a number of databases including LINZ, NZTA RAMM GIS and Marlborough District Council.
During the process duplication and errors in the data were evident and should be cleansed and
verified into a ‘single source of truth’. It is recommended that this is undertaken as part of the
improvement plan (Refer to Section 17.0).
The maps are presented below the following summary of each category:
8.1 ONE ROAD NETWORK CLASSIFICATION
The data has been obtained from the NZTA RAMM GIS Database and modified to reflect the unsealed
and sealed proportions of the low volume and access roads. Following review of the data it was
evident that the metadata had duplication on naming conventions, in particular National and Low
Volume roads. These need to be checked and the metadata amended to reflect actual outputs. It is
important that this work is done as it sets the Customer Level of Service required for the particular
element of the road network.
8.2 PRIMARY INDUSTRIES
Primary Industries associated with the vineyards, forestry, aquaculture and agriculture were obtained
from the Marlborough Council database. No data was available for Aviation or Salt Manufacturing and
it is recommended that these primary industries be mapped, as part of the improvement plan (Refer
to section 16.0) to complete the data set.
In respect to tourism, the data available mainly related to ‘areas of beauty’ which would suggest an
area that may see tourists visiting. As part of the improvement plan we recommend that a detailed
analysis of tourist movements is aligned with different categories of tourism to provide a better
understanding of the geospatial road network use (Refer to Section 17.0).
In respect to growth across the primary industries sector and tourism it was unclear if growth in the
individual sectors had been considered. It is recommended that this be checked and the data set
modified to suit (refer to Section 16.0).
8.3 BRIDGES
The bridge and culvert data has been colour coded to reflect the current replacement programme
which is explained in more detail in section 10.0. An initial alignment of the ONRC to the bridges was
attempted as part of the strategic case review. Unfortunately the Metadata provided some evidence
that the information had errors and will need to be verified as part of the improvement plan (Refer to
section 17.0). The maps do however give a visual representation of which bridges are on what roads
and is a powerful way to demonstrate the customer levels of service for each bridge on the ONRC
8.4 UNSEALED ROADS
An initial alignment of the ONRC to the bridges was attempted as part of the strategic case review.
Unfortunately the Metadata provided some evidence that the information had errors and will need to
be verified as part of the improvement plan (Refer to section 17.0). The maps do however give a visual
representation of the unsealed and sealed roads.
8.5 LANDSLIPS AND FLOODING
Data was obtained from the Marlborough District Council GIS database. It is evident that the data
needs to be assessed to align the outcomes to the roading network. For example the data shows a
significant number of landslips in Blenheim, however landslips are known to be prevalent in the
Sounds instead. Additional data should be obtained to identify the different types of landslips and
flooding events classifications and then be aligned to the roading network (Refer to section 17.0).
page 28You can also read