Broxbourne Borough Council Local NO2 Plan - Outline Business Case Status Review & Next Steps
←
→
Page content transcription
If your browser does not render page correctly, please read the page content below
Broxbourne Borough Council Local NO2
Plan – Outline Business Case Status
Review & Next Steps
Broxbourne Borough Council

Project number: 60563501

26th February 2021
Broxbourne Borough Council

                                                                                                  Project number: 60566564

Quality information
Prepared by                       Checked by                  Verified by                     Approved by

Chris Wood                        Jonathan Morrow             Jonathan Morrow                 Siamak Khorgami
Principal Consultant              Associate Director          Associate Director              Regional Director

Revision History

Revision      Revision date        Details                          Authorized     Name             Position

V1.0          2020-06-22           AECOM Draft                      Yes            Siamak           Regional
                                                                                   Khorgami         Director
V2.0          2020-07-01           Final
V3.0          2020-11-27           Final incorporating analysis of Yes             Siamak           Regional
                                   softer measures                                 Khorgami         Director
V3.1.1        2021-01-06           Final incorporating TIRP         Yes            Hannah Smith     Senior Air
                                   feedback (BV update)                                             Quality
                                                                                                    Consultant
V3.2          2021-02-05           Final incorporating next steps   Yes            Hannah Smith     Senior Air
                                   (BV update)                                                      Quality
                                                                                                    Consultant
V3.3          2021-02-26           Updated measures valuation       Yes            Antony Wiatr     Technical
                                   in Annex B (BV update)                                           Director

Prepared for:
Broxbourne Borough Council

Prepared by:
Chris Wood

AECOM Limited
AECOM House
63-77 Victoria Street
St Albans
Hertfordshire
AL1 3ER
UK

T: +44(0)1727 535000
aecom.com

Supporting inputs from:

© 2021 AECOM Infrastructure & Environment UK Limited. All Rights Reserved.

Prepared for: Broxbourne Borough Council                                                                          AECOM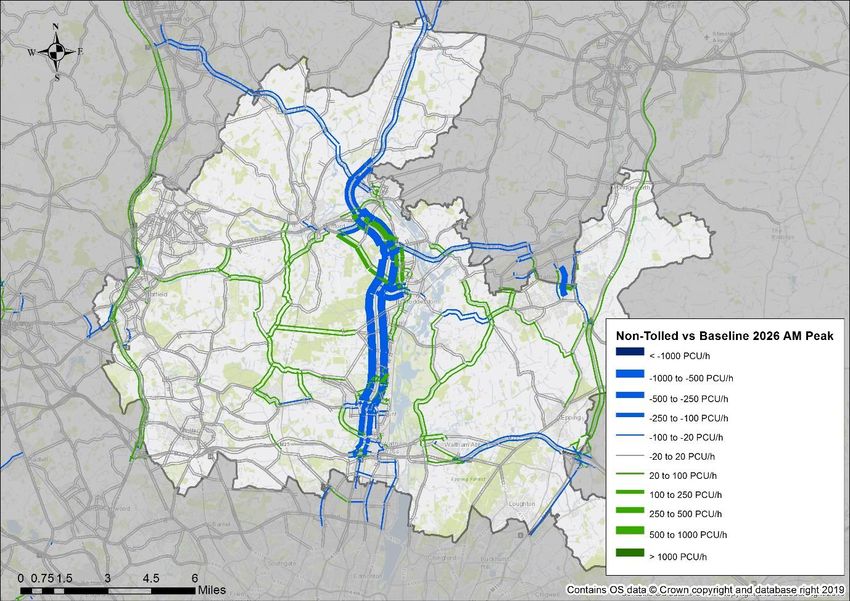
Broxbourne Borough Council

                                                                                     Project number: 60566564

This document has been prepared by AECOM Infrastructure & Environment UK Limited (“AECOM”)
for sole use of our client (the “Client”) in accordance with generally accepted consultancy principles,
the budget for fees and the terms of reference agreed between AECOM and the Client. Any
information provided by third parties and referred to herein has not been checked or verified by
AECOM, unless otherwise expressly stated in the document. No third party may rely upon this
document without the prior and express written agreement of AECOM.

Prepared for: Broxbourne Borough Council                                                             AECOM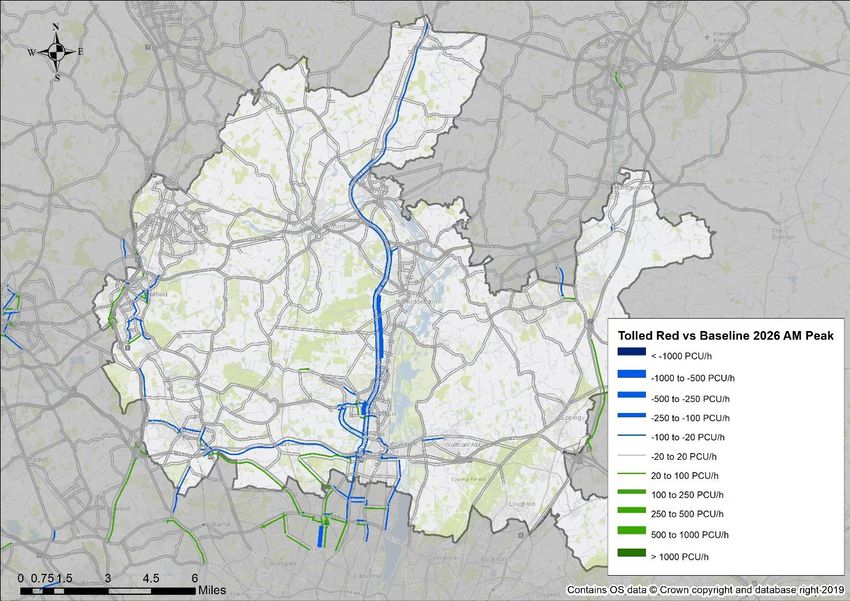
Broxbourne Borough Council

                                                                                                                              Project number: 60566564

Table of Contents
1.          Introduction .............................................................................................. 6
The A10 PCM Exceedance Stretch ........................................................................................................ 6
COVID-19 Caveat ................................................................................................................................... 7
Work Undertaken to Date ........................................................................................................................ 7
Scheme Identification Background ......................................................................................................... 8
Ministerial Direction – May 2020 ............................................................................................................. 8
Purpose of This Document ...................................................................................................................... 9
2.          The Existing & Future Situation ............................................................. 10
The A10 Study Area .............................................................................................................................. 10
Current Traffic Conditions ..................................................................................................................... 10
ANPR Data Summary ........................................................................................................................... 11
COMET Transport Modelling and Natural Compliance ......................................................................... 15
Defining the Scale of Change Required ................................................................................................ 15
Section Summary .................................................................................................................................. 17
3.          Wider Scheme Constraints/Issues ........................................................ 18
M25 Junction 25 .................................................................................................................................... 18
HCC Major Road Network (MRN) Bid ................................................................................................... 18
London Ultra Low Emission Zone (ULEZ) ............................................................................................ 19
Timescales ............................................................................................................................................ 19
Conflicting Project Guidance ................................................................................................................. 19
Section Summary .................................................................................................................................. 20
4.          Previous Scheme Options ..................................................................... 21
Major Schemes Discounted .................................................................................................................. 21
Summary of Modelling Undertaken to Date .......................................................................................... 21
Section Summary .................................................................................................................................. 25
5.          New Scheme Parameters (CSFs) ......................................................... 26
New Critical Success Factors ............................................................................................................... 26
Primary Critical Success Factors .......................................................................................................... 26
Secondary Critical Success Factors ..................................................................................................... 26
Tertiary Evaluation of Soft Measures .................................................................................................... 27
Revised OBC Timescale ....................................................................................................................... 27
6.          Remaining Scheme Options.................................................................. 28
Caveat ................................................................................................................................................... 28
Discounted Scheme Options ................................................................................................................ 29
Possible Scheme Options (if OBC deadline extended) ........................................................................ 32
Remaining Scheme Options ................................................................................................................. 34
Non-Transport Scheme Options ........................................................................................................... 34
7.          Initial Conclusions ................................................................................. 36
Recommendations/Next Steps.............................................................................................................. 36
JAQU Response ................................................................................................................................... 36
8.   Softer Measures Analysis ...................................................................... 37
9.   Final Conclusions and Next Steps ........................................................ 47
Appendix A – EFT Traffic Signal Control Analysis ........................................... 49
Appendix B – Details of Softer Measures to be Pursued ................................ 60

Prepared for: Broxbourne Borough Council                                                                                                          AECOM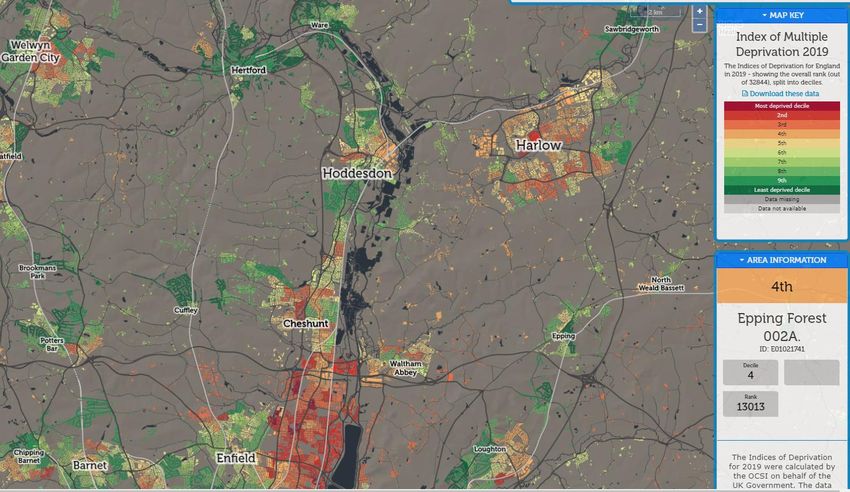
Broxbourne Borough Council

                                                                                                                               Project number: 60566564

Figures
Figure 1.1: A10 Exceedance Location in Broxbourne ............................................................................. 6
Figure 1.2: Department for Environment, Food & Rural Affairs / Department for Transport Business
Case Guidance Flow Chart ..................................................................................................................... 8
Figure 2.1: Typical Traffic Conditions on the A10 – AM Peak (Source: Google Maps, copyright Google
2019) ..................................................................................................................................................... 10
Figure 2.2: Typical Traffic Conditions on the A10 – PM Peak (Source: Google Maps, copyright Google
2019)) .................................................................................................................................................... 11
Figure 2.3: Postcodes of cars recorded by the ANPR survey............................................................... 13
Figure 2.4: Postcodes of LGVs recorded by the ANPR survey ............................................................ 13
Figure 2.5: A10 Study Area Index of Multiple Deprivation 2019 (Source: Consumer Data Research
Centre Maps) ........................................................................................................................................ 14
Figure 4.1: Scheme Options CAZ Boundaries ...................................................................................... 22
Figure 4.2: 2026 Non-charge option compared with 2026 Baseline (AM peak) ................................... 23
Figure 4.3: 2026 CAZ-D(2) option compared with 2026 Baseline (AM Peak) ...................................... 23

Figure A.1 – Maps of Road Links. Left to Right: College Road Junction, Church Lane Junction, Larger
Scale A10 Exceedance Stretch ............................................................................................................. 59

Tables
Table 2.1: Vehicle Fleet Composition on/around the A10 Exceedance Stretch – all ANPR Sites
(national figures in brackets) ................................................................................................................. 12
Table 2.2 – High Level Investigation to Quantify the Reduction of Vehicles Required to Bring Forwards
Compliance ........................................................................................................................................... 15
Table 2.3 – NOx Emissions at BB28 Following Reduction in AADT ...................................................... 16
Table 4.1: Range of One-Way Hourly Flow Difference Compared to the Baseline Scenarios of each
Scenario Assessed ................................................................................................................................ 24
Table 4.2: Predicted Compliance Year for Each Measure Option ......................................................... 24
Table 4.3: Maximum NO2 Concentration Increase in Local Authorities Surrounding Broxbourne
Relative to 2022 Base Year, Categorised by Measure Option (µg/m3) ................................................. 25
Table 5.1: Secondary Critical Success Factors..................................................................................... 26
Table 6.1: Possible Traffic Volume Impacts of Softer Measures ........................................................... 28
Table 6.2: Discounted Scheme Options ................................................................................................ 29
Table 6.3: Possible Scheme Options (if OBC deadline extended)........................................................ 32
Table 6.4: Remaining Scheme Options ................................................................................................. 34
Table 8.1: Softer Transport Measures Requiring Further Assessment ................................................. 37
Table 8.2: Softer Transport Measures Detailed Commentary following Literature Review .................. 41
Table 8.3: Estimated Costs Associated with the Softer Measures ........................................................ 45

Table A.1 – Relative Speed Changes (%) and Actual Speed (kph) Applied to Each Road Link ........... 49
Table A.2 – Percentage Change of NOx Emissions Following Percentage Change of Speed, 2022 ... 51
Table A.3 – Percentage Change of NOx Emissions Following Percentage Change of Speed, 2023 ... 53
Table A.4 – Percentage Change of NOx Emissions Following Percentage Change of Speed, 2024 ... 55
Table A.5 – Percentage Change of NOx Emissions Following Percentage Change of Speed, 2025 ... 57

Table B.1 – Funding and Scheme Comments for Pursued Measures .................................................. 60
Table B.2 – Total Cost Summary for Pursued Measures ...................................................................... 61

Prepared for: Broxbourne Borough Council                                                                                                           AECOM
Broxbourne Borough Council FINAL
Project number: 60566564
1. Introduction
The A10 PCM Exceedance Stretch
1.1 The Pollution Climate Mapping (PCM) national model identified that Broxbourne Borough
Council (BBC) has one road link (Census ID 78365) projected to have an exceedance of the
annual mean EU Limit Value of 40µg/m3 for nitrogen dioxide (NO2). The road link under
consideration is a section of the A10, between its junction with B198 and the slip road leading
towards the A1170/ B156 roundabout. The road link is located within the district of Broxbourne
but managed by Hertfordshire County Council (HCC).
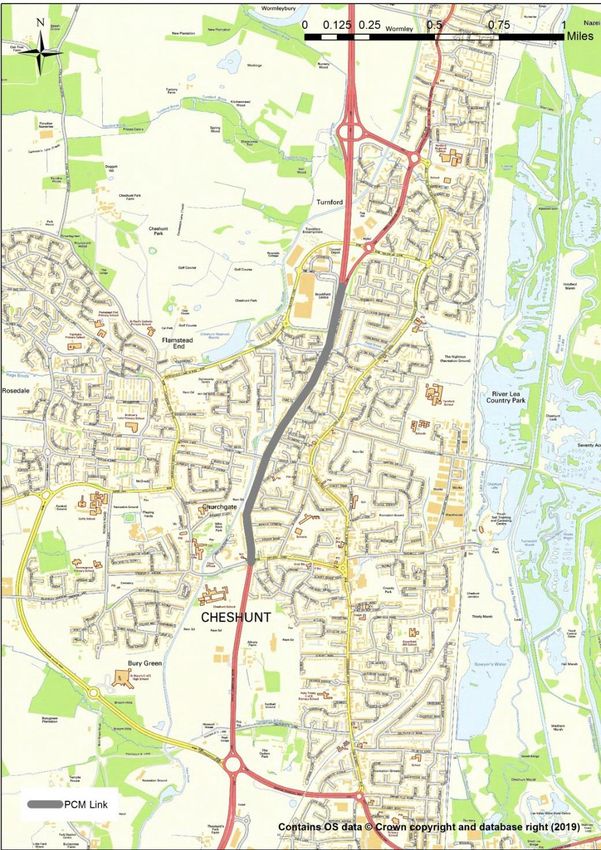
1.2 Figure 1.1 shows the location of the A10 PCM exceedance stretch. It broadly extends from
Turnford Interchange through the junction with Church Lane to the junction with College Road.
Figure 1.1: A10 Exceedance Location in Broxbourne
Prepared for: Broxbourne Borough Council AECOM
6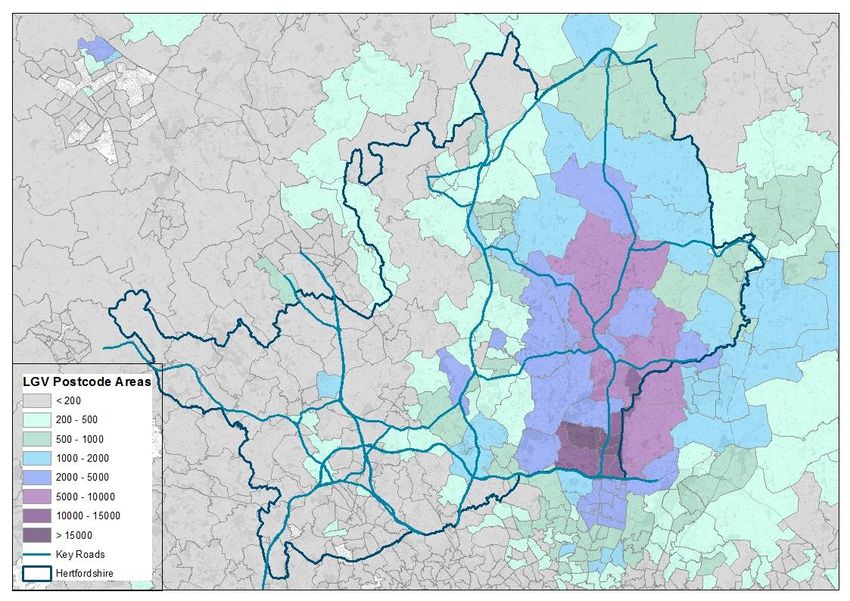
Broxbourne Borough Council                                  FINAL
                                                                                                       Project number: 60566564

COVID-19 Caveat
1.3     This document was drafted in November 2020 and the authors note the medium and longer-
        term impacts of the COVID-19 pandemic are largely unknown. Travel volumes, patterns and
        behaviours could alter as a result of the pandemic; however this report has been drafted
        assuming that all previous growth, economic, transport and air quality assumptions remain
        unchanged as per guidance received.

1.4     Guidance on considering the impacts of COVID-19 was received from the Joint Air Quality Unit
        (JAQU) on 04 May 20201. It stated: “Modelling of your future year “with measures” scenarios
        may be impacted by COVID-19 if there is a change to natural fleet turnover (how the population
        upgrades their vehicles naturally), traffic patterns or how the population responds to Clean Air
        Zones. You may have seen reports on the observed reduction in NO2 due to a decrease in
        road transport usage. Due to the nature of the impact of (and response to) COVID-19 any
        short-term reduction in measured NO2 concentrations during 2020 does not necessarily mean
        future years will see a reduction. To investigate these impacts JAQU are conducting Emissions
        Factor Toolkit (EFT) analysis2 and intend to send a further communication on this in mid-May.

1.5     We are also aware that some LAs have asked about the implications of COVID19 in relation to
        the economic assessments you are carrying out as part of your plan; we recognise that
        businesses are already being impacted, and these impacts could be prolonged. As such, we
        understand that there may be a desire to proactively reflect this in your analysis. However, we
        would like to caution against work being done on this prematurely. The enduring economic
        impacts of COVID-19 are not fully understood at present and we do not expect LAs to redo any
        economic analysis in the light of these uncertainties, and to continue analysis as planned.
        JAQU will continue to develop our understanding to inform LA plans. Where an authority is
        seeking to consider economic impacts, again please discuss and agree this with JAQU before
        proceeding.”

Work Undertaken to Date
1.6     Following the PCM modelling, a Targeted Feasibility Study (TFS)3 was undertaken to:

            •     Characterise the air quality issue along the A10 PCM exceedance stretch, as identified
                  in the national modelling; and
            •     Identify measures which could reduce the concentration of NO 2 along the A10 PCM
                  exceedance stretch as quickly as possible, with the principal objective of bringing
                  forward compliance with the statutory annual mean EU Limit Value.
1.7     The TFS report was prepared by BBC with consultancy support provided by Bureau Veritas UK
        Ltd. The local dispersion modelling results, as identified by the TFS, suggested that NO2
        concentrations were far greater along the PCM exceedance stretch than what was originally
        predicted by the PCM model. Natural compliance was predicted to be achieved by 2028, in
        comparison to a natural compliance year of 2019 as predicted by the PCM model. Furthermore,
        the 2017 and 2018 diffusion tube results (for BB09 and BB28, which are situated along the A10
        road link) reported concentrations significantly above those predicted by the PCM model.

1.8     It was deemed necessary that substantial intervention was necessary to bring forward
        compliance on the A10 road link. As instructed by the Joint Air Quality Unit (JAQU) a Local NO2
        Plan to identify measures that could bring forward compliance within the shortest possible time
        was required. Consequently, the Council was identified as one of eight ‘third wave’ Local
        Authorities that have more persistent long term exceedances, therefore being required under
        Ministerial Direction to develop a Local NO2 Plan to identify specific measures that could bring
        forwards compliance within the shortest possible time.

1.9     In late 2018 the project team broadened to include AECOM and Eunomia. AECOM have
        provided the transport scheme optioneering and modelling, whilst Eunomia have led the

1
  Email from Olawale Ladapo at JAQU
2
  Not available yet
3
  Targeted Feasibility Study to deliver Nitrogen Dioxide concentration compliance in the shortest possible time. Prepared by the
Council with consultancy support provided by Bureau Veritas UK Ltd.

Prepared for: Broxbourne Borough Council                                                                               AECOM
                                                                                                                           7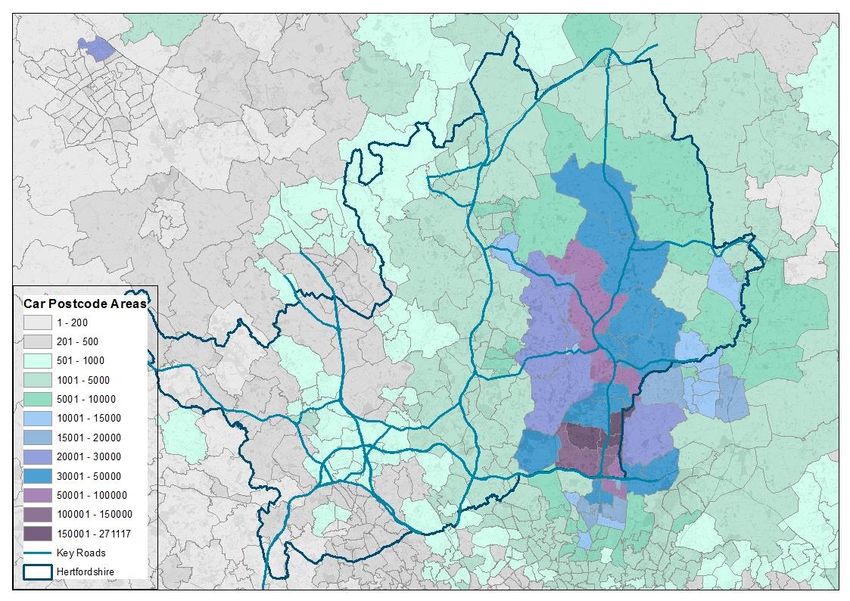
Broxbourne Borough Council                                FINAL
                                                                                                  Project number: 60566564

          economic assessment of the schemes proposed. Following completion of the TFS, the project
          started to progress through the phases of Business Case submission as outlined in Figure 1.2.
          A Strategic Outline Case was submitted in early 2019 with the Outline Business Case
          submitted in October 2019 and extended and re-submitted in June 2020.

Figure 1.2: Department for Environment, Food & Rural Affairs / Department for Transport
Business Case Guidance Flow Chart 4

Scheme Identification Background
1.10 During the preparation of the Strategic Outline Case, HCC and BBC advised that non-charging
     schemes were preferred. These were deemed to be more acceptable publicly, politically and
     implementation-wise by the Council. However, when reviewed by JAQU, they advised that a
     more significant measure would be required to bring forward compliance and creating a Clean
     Air Zone (CAZ) with charges for non-compliant vehicles should be prioritised.

1.11 The Outline Business Case focussed on a non-charging option which included a speed
     reduction along the A10 with enhanced bus services serving neighbouring areas and five CAZ
     options (see Section 4.4 for outline details). Full details and results can be found in the
     transport modelling, air quality and economic impact reports in Huddle. As expected, the results
     of any type of scheme on the A10 (a dual A-road approaching the M25) resulted in re-routeing
     and the displacement of some traffic onto adjacent or parallel routes.

Ministerial Direction – May 2020
1.12 Revised Ministerial Direction5 was received in May 2020 which confirmed that “There is often a
     risk that a scheme to reduce NO2 levels on a targeted area will have wider implications for
     surrounding areas, and this is something we have collectively recognised from the outset of our
     work with you considering the nature of the A10. However, it is a key criteria for local plan
     development that any scheme does not result in an unacceptable level of increase in NO 2
     elsewhere, particularly where there is the possibility this could result in the creation of new

4
    Presentation slide provided by JAQU on a Webinar held on 10 December 2018
5
    Letter sent by Ms Rebecca Row MP Parliamentary Under Secretary of State on 6 May 2020 to Broxbourne Borough Council

Prepared for: Broxbourne Borough Council                                                                          AECOM
                                                                                                                      8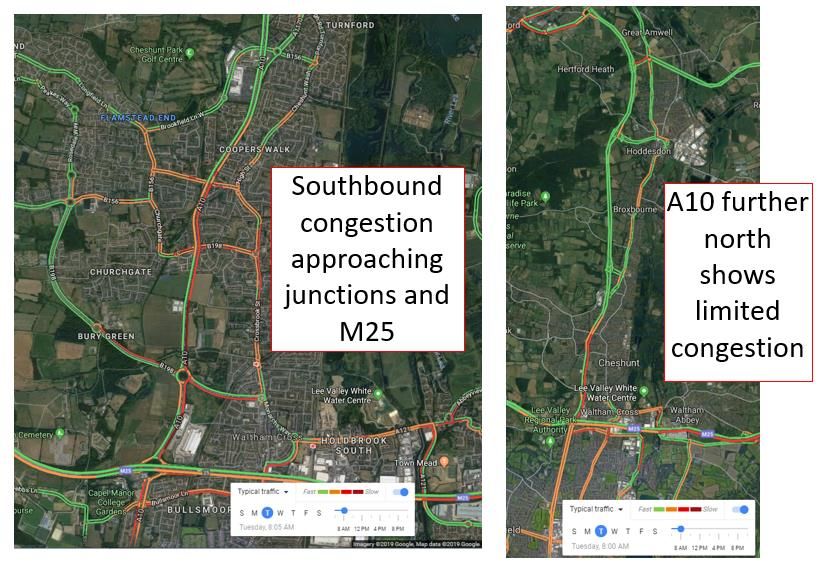
Broxbourne Borough Council                      FINAL
                                                                                  Project number: 60566564

        exceedances. The evidence you have provided is sufficient to now conclude that there is an
        unacceptable risk of this occurring as a result of your proposals.”

1.13 Wider clarification from JAQU was sought which confirmed that any scheme proposed could
     not result in a deterioration of air quality (to any degree) on any road. As such, any scheme
     which would result in traffic diverting on to other roads should not be considered.

1.14 A number of the non-charging and CAZ schemes that were originally proposed and assessed
     found that these schemes would improve air quality along the corridor, however these schemes
     have been discounted as they induce traffic re-routeing on to other roads and do not comply
     with the Ministerial Direction received.

1.15 JAQU have therefore confirmed that the project team should stop work on these measures and
     instead begin to consider alternative non-charging measures that can bring forward compliance
     in the shortest possible time (without the type of unintended traffic diversion consequences
     discussed above). The project team were requested to deliver a revised Outline Business Case
     by 31 October 2020. These timescales severely limit the scope of work which can be
     undertaken.

1.16 In order to comply with the Ministerial Direction the project team started to focus on schemes
     which will reduce NO2 levels on the A10 but won’t divert vehicular traffic on to other roads.

Purpose of This Document
1.17 Stakeholders including HCC, BBC, AECOM, Eunomia and Bureau Veritas UK have been
     working collaboratively to examine options to address the air quality on the A10 in Broxbourne
     since October 2018. A significant amount of work has been performed and knowledge gathered
     about the A10 corridor and its users including those with high emission vehicles who should be
     targeted in order to improve air quality and bring forward NO2 compliancy.

1.18 This document reiterates and presents the current challenges of reducing NO2 on the A10
     exceedance stretch including fleet composition and level of traffic demand. Data from the
     automatic number plate recognition (ANPR) surveys undertaken and transport modelling
     confirms who the users of the A10 corridor are that need to be targeted for an optimum
     reduction in NO2 levels.

1.19 Interdependencies with other schemes are outlined and constraints highlighted. The new
     Critical Success Factors (CSFs) for the scheme are confirmed considering the Ministerial
     Direction.

1.20 Finally, measures which would meet the Ministerial Direction are assessed considering the
     previous sections in order to focus decision-makers on how the project should proceed.

Prepared for: Broxbourne Borough Council                                                          AECOM
                                                                                                      9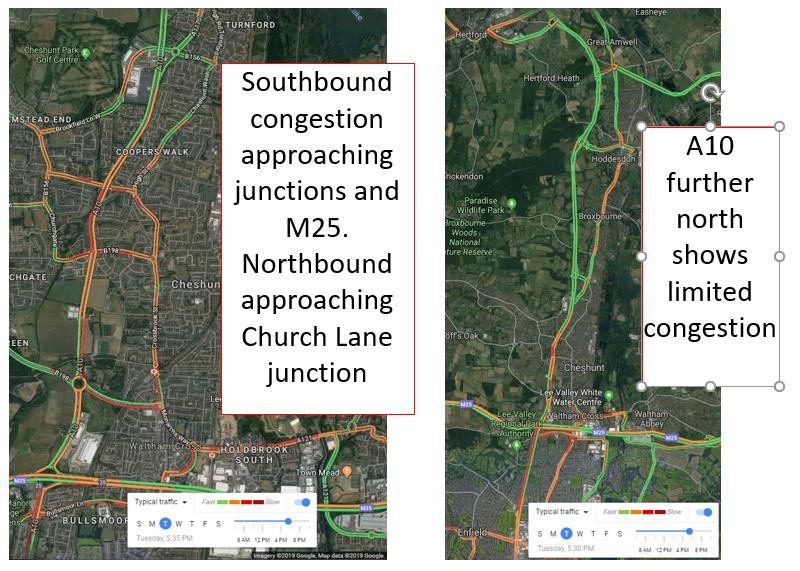
Broxbourne Borough Council                        FINAL
                                                                                     Project number: 60566564

2. The Existing & Future Situation
2.1     This section highlights the A10 PCM study area and the characteristics of vehicles movements
        on the A10. The current issues and movements are highlighted which helps focus the narrative
        on the types of movements which must be targeted by any scheme looking to address air
        quality.

The A10 Study Area
2.2     The A10 is a strategic corridor for north south movements and connects the City of London to
        the M11 motorway at Junction 11 south of Cambridge. The road travels through Inner and
        Outer London Boroughs, Hertfordshire and Cambridgeshire.

2.3     The road is a relatively free flowing dual carriageway interjected by roundabout junctions with
        key arterial A roads north of Broxbourne. Entering Broxbourne and travelling southbound
        towards London the traffic signalised junction with Church Lane is the first junction where
        vehicles may expect to experience congestion. There are further traffic signal and roundabout
        junctions approaching the A10/M25 junction 25 junction. Congestion and delays are expected
        in this area due to the nature of the road and at-grade junctions along it.

2.4     Whilst the A10 is a strategic route, it should be noted that the A1(M) and M11 running parallel to
        the A10 offer a quicker route for strategic journeys. Due to grade-separated junctions and
        higher speed limits (under normal traffic conditions) these routes would be preferred for
        journeys without origins or destinations along the A10 corridor.

Current Traffic Conditions
2.5     Figure 2.1 and Figure 2.2 highlight typical traffic conditions (pre COVID-19) on the exceedance
        stretch and further north on the A10. These highlight that the PCM exceedance stretch
        experiences congestion and delays as the junctions reduce traffic speeds along the A10.

Figure 2.1: Typical Traffic Conditions on the A10 – AM Peak (Source: Google Maps, copyright
Google 2019)

Prepared for: Broxbourne Borough Council                                                             AECOM
                                                                                                         10
Broxbourne Borough Council FINAL
Project number: 60566564
Figure 2.2: Typical Traffic Conditions on the A10 – PM Peak (Source: Google Maps, copyright
Google 2019))
2.6 Journey time reliability along the A10 corridor is poor particularly in AM and PM Peak hours.
Sample analysis using Google Maps identified 20 – 30 minute variations in north-south journey
times. Examples include:
• Broxbourne to Enfield in the AM peak ranged between 20 and 40 minutes and identified
3 different route options;
• Great Amwell to Enfield in the AM peak ranged between 30 and 55 minutes and
identified 2 different route options; and
• Great Amwell to South Mimms in the AM peak ranged between 30 and 50 minutes and
identified 3 route options.
2.7 These journey time variations and the congestion plots highlight there is a high demand for
movements in this corridor and delays/congestion are common-place. This helps explain the
poor air quality results recorded.
ANPR Data Summary
2.8 Automatic Number Plate Recognition (ANPR) surveys6 were undertaken in BBC for a week in
May 2019 to help support the project. The ANPR survey served 3 main purposes:
▪ To understand the current vehicle fleet on the A10 exceedance stretch to determine
how many vehicles may be impacted by an environmental charge (linked to vehicle
pollution euro-classification);
▪ To understand if assumptions regarding the number of compliant vehicles in the current
vehicle fleet were correct. Due to the natural upgrade of the vehicle fleet, new cars are
more environmentally friendly than older vehicles; and
6
Full details in the Broxbourne Borough Council Local NO2 Plan ANPR Survey Technical Note – Technical Annex to T3 issued
by AECOM on 12 August 2019
Prepared for: Broxbourne Borough Council AECOM
11Broxbourne Borough Council FINAL
Project number: 60566564
▪ To understand vehicle movements in the local area of the A10 exceedance stretch and
determine the number of local and strategic movements. This would form an important
input to the Strategic Case for any scheme proposed.
2.9 The ANPR survey revealed that the fleet of vehicles on the A10 passing through and around
the exceedance stretch was older than the national average. Table 2.1 highlights the fleet
composition compared to 2019 national figures sourced from the Emissions Factor Toolkit v9.1a
(consistent with the National Atmospheric Emissions Inventory (NAEI)).
Table 2.1: Vehicle Fleet Composition on/around the A10 Exceedance Stretch – all ANPR Sites
(national figures in brackets)
Category Vehicle Type Percentage of total vehicles recorded
Compliant Car – Petrol 37.9% (43.1%)
Compliant Car – Diesel 12.2% (16.2%)
Compliant LGV 5.3% (8.6%)
Compliant HGV 2.2% (1.1%)
Compliant Total 57.6% (69%)
Non - Compliant Car – Petrol 6.6% (2.1%)
Non - Compliant Car – Diesel 19.9% (17%)
Non - Compliant LGV 10.6% (7%)
Non - Compliant HGV 1.1% (0.3%)
Non - Compliant Total 38.2% (26.4%)
Unknown / Other Total 4.2% (2.8%)
2.10 Table 2.1 highlights that compared to national figures, the data in Broxbourne identified:
▪ The percentage of compliant petrol cars is lower than national estimations, whilst the
percentage of non-compliant diesel and petrol cars are higher than national
estimations;
▪ There are fewer compliant diesel cars and LGVs;
▪ There is a greater proportion of compliant HGVs; and
▪ There are a greater proportion of non-compliant LGVs, HGVs and unknown/other
vehicles.
2.11 Postcode data of vehicles recorded by the ANPR cameras was analysed. For the purposes of
this report, the postcode has been assumed to be the home or business address of the
vehicles recorded by the cameras, i.e. the origin.
2.12 The data for car users highlighted in Figure 2.3 illustrated that most cars were registered to
addresses along the A10 corridor and were bounded by the parallel A1(M) and M11 motorways.
The data also highlighted that there are a lot of local users of the A10 with the greatest
concentration of postcodes recorded in Broxbourne, East Herts and Welwyn & Hatfield Districts
which is to be expected. There are also origins in neighbouring West Essex, Harlow, Epping
and Enfield. North of Hertfordshire, origins near Milton Keynes, Bedford and Cambridge were
also observed. It is clear the issue of poor air quality is recorded in Broxbourne but generated
by vehicles registered in all the surrounding counties/boroughs.
2.13 The data also highlighted there was limited interaction with locations in west Hertfordshire such
as Hemel Hempstead, Watford and St Albans. Most origins outside of Hertfordshire were from
North London, Enfield, Epping and Harlow.
Prepared for: Broxbourne Borough Council AECOM
12Broxbourne Borough Council FINAL
Project number: 60566564
Figure 2.3: Postcodes of cars recorded by the ANPR survey
Figure 2.4: Postcodes of LGVs recorded by the ANPR survey
2.14 Figure 2.4 highlights that similar to cars, there were a lot of LGVs registered in Broxbourne,
East Herts and Welwyn & Hatfield Districts. There were also origins in neighbouring west
Essex, Harlow, Epping and Enfield. North of Hertfordshire, near Milton Keynes, Bedford and
Cambridge.
Prepared for: Broxbourne Borough Council AECOM
13Broxbourne Borough Council FINAL
Project number: 60566564
2.15 Generally, car trips are more strategic with approximately two-thirds of traffic passing through
the A10 corridor, and all show an interaction with the A10 and M25 north/south of the PCM
exceedance stretch These results help confirm that for most users, the A10 is the most direct
route between origins and destinations. A10 demand management schemes would very likely
result in displacement of traffic on to other routes (unless attractive alternatives by other modes
were provided) and this would be unacceptable as degreed in the Ministerial Direction.
2.16 Similarly, the ANPR results indicate the greatest impacts of demand management schemes
would be incurred by residents/business owners of Broxbourne and the surrounding area,
however impacts extend into north London boroughs and Essex. The air quality issues in
Broxbourne are not just a Hertfordshire issue.
2.17 Origins of HGVs in the study area are more dispersed but follow a similar pattern to LGVs.
2.18 Routeing/trip pattern information gathered by the ANPR surveys confirmed that the A10 through
the exceedance stretch is primarily used for north-south movements. Junctions around the
exceedance stretch (Church Road/College Lane) are used to access Cheshunt town centre,
retail areas or the stations; however the large majority is through traffic. Traffic originating or
travelling to the intermediate or outer areas does not tend to use the A10 and utilises local
roads to travel around the exceedance stretch and join at junctions north and south of the study
area. This is to be expected given the A10 experiences congestion at junctions along its length
which aren’t grade separated.
2.19 The fleet composition results from the ANPR surveys are supported by the Index of Multiple
Deprivation data for BBC and surrounding. As levels of deprivation are partly informed by
income, this will link to the cost, age and therefore environmental standards of vehicles
households in the study area will run. It is an assumption that poorer households will have less
disposable income to spend on their vehicle therefore will own cheaper, older, more polluting
vehicles.
Figure 2.5: A10 Study Area Index of Multiple Deprivation 2019 (Source: Consumer Data
Research Centre Maps7)
7
https://maps.cdrc.ac.uk/#/geodemographics/imde2019/default/BTTTFFT/12/-0.0449/51.7296/ accessed on 17 June 2020
Prepared for: Broxbourne Borough Council AECOM
14Broxbourne Borough Council FINAL
Project number: 60566564
2.20 Comparing Figure 2.3, Figure 2.4 and Figure 2.5 and Table 2.1 it can be recognised that many
of the users of the A10 originate from areas with low levels of Multiple Deprivation. This helps
inform the fleet results observed in Table 2.1.
COMET Transport Modelling and Natural Compliance
2.21 To forecast the influence of different transport policy measures, assess their impact on the
transport network, and consequently on emissions and air quality, the Hertfordshire Countywide
Model of Transport (COMET) has been used. This model suite has been enhanced to improve
the representation of traffic flows at and in the vicinity of the identified exceedance section, to
produce the necessary inputs required by emission and air quality modelling, and to better
represent the packages of measures that will be assessed to meet the study aims. Full details
of the modelling work undertaken are contained in the T2, T3 and T4 reports available on
Huddle.
2.22 Outputs from the COMET transport modelling informed the air quality modelling (all reports also
available on Huddle). A series of “Baseline” (i.e. do-nothing) scenarios were created to assess
the impact. Committed schemes not linked to this project were included, however the major
impact on the A10 corridor would be the rate at which the fleet is renewed as owners upgrade
their vehicles to newer, more environmentally-friendly vehicles.
2.23 Results from the Baseline scenarios confirmed that an expected compliance would be achieved
in 2025. It is worth re-iterating the impact of COVID-19 on these assumptions is currently
unknown.
Defining the Scale of Change Required
2.24 JAQU guidance states that measures should only be implemented if they can bring forward
compliance by 12 months or more. A high level investigation into the scale of change required
was carried out using the air quality modelling outputs. The vehicle flow and composition was
adjusted on the road links modelled within the PCM exceedance stretch to ascertain the level of
change that was required to bring forward compliance. The assessment estimated the minimum
reduction in Annual Average Daily Traffic (AADT) required to bring forwards compliance at the
worst case receptor (BB28), and whether this would be realistically achievable.
A fixed reduction has been applied to each vehicle type (Car, LGV, HGV) as well as a fixed percentage reduction
in the total AADT flow on the A10 PCM exceedance stretch, covering all vehicle types. The vehicle emissions
were recalculated using the Emissions Factor Toolkit (V9.1.a) and the dispersion model reran with the updated
flows for the years 2022, 2023 and 2024. A comparison of the predicted annual mean NO2 concentrations for
each year as well as the reduction when compared to the baseline concentrations are shown in Table 2.2. The
NOx emissions near to BB28, the worst case receptor, as a result of these reductions are presented in Table 2.2
Notes:
Reductions carried out are not step-wise, and therefore the results shown are for a direct reduction of the raw AADT for that
year.
2.25 Table 2.3.
Table 2.2 – High Level Investigation to Quantify the Reduction of Vehicles Required to Bring
Forwards Compliance
Year Baseline NO2 Vehicle Reduction Annual Mean Annual
Concentration Type Amount per NO2 Mean NO2
(µg/m3) at Road Link Concentration Difference
BB28 (AADT) (µg/m3) to
Baseline
(µg/m3)
2022 48.4 Car -10000 (55%) 41.8 -6.6
(Petrol &
Diesel)
2022 48.4 LGV -2000 (62%) 44.2 -4.2
2022 48.4 HGV -2000 (75%) 41.7 -6.7
Prepared for: Broxbourne Borough Council AECOM
15Broxbourne Borough Council FINAL
Project number: 60566564
Year Baseline NO2 Vehicle Reduction Annual Mean Annual
Concentration Type Amount per NO2 Mean NO2
(µg/m3) at Road Link Concentration Difference
BB28 (AADT) (µg/m3) to
Baseline
(µg/m3)
2022 48.4 Total Flow -7696 (30%) 39.8 -8.6
2023 45.6 Car -8000 (45%) 40.6 -5.0
(Petrol &
Diesel)
2023 45.6 LGV -2500 (77%) 40.6 -5.0
2023 45.6 HGV -2000 (76%) 39.5 -6.1
2023 45.6 Total Flow -5125 (20%) 40.3 -5.3
2024 42.6 Car -4000 (23%) 40.3 -2.3
(Petrol &
Diesel)
2024 42.6 LGV -2000 (61%) 39.0 -3.6
2024 42.6 HGV -850 (33%) 40.3 -2.3
2024 42.6 Total Flow -2587 (10%) 40.2 -2.4
Table 2.2 Notes:
Reductions carried out are not step-wise, and therefore the results shown are for a direct reduction of the raw AADT for that
year.
Table 2.3 – NOx Emissions at BB28 Following Reduction in AADT
Year Vehicle Type Bassline NOx NOx Emissions Reduction in Percentage
AADT Emissions at Post Reduction at NOx Difference in
Reduction BB28 (g/km/s) BB28 (g/km/s) Emissions NOx
(g/km/s) Emissions
2022 Car (Petrol & 0.11 0.06 -0.06 -51%
Diesel)
2022 LGV 0.06 0.02 -0.04 -64%
2022 HGV 0.09 0.02 -0.07 -76%
2022 Total Flow 0.26 0.18 -0.08 -30%
2023 Car (Petrol & 0.11 0.06 -0.04 -41%
Diesel)
2023 LGV 0.05 0.01 -0.04 -79%
2023 HGV 0.08 0.02 -0.06 -77%
2023 Total Flow 0.24 0.19 -0.05 -20%
2024 Car (Petrol & 0.10 0.08 -0.02 -21%
Diesel)
2024 LGV 0.05 0.02 -0.03 -63%
2024 HGV 0.07 0.05 -0.02 -33%
2024 Total Flow 0.22 0.20 -0.02 -10%
Table 2.3 Notes:
Emissions are the sum of the calculated NOx from northbound road links (source ID 4606), and the southbound road link
(source ID 4595) nearest to BB28. BB28 is located between two southbound road links (source IDs 4738 and 4595), which
have differing speeds. Source ID 4738 has a speed of 45.2kph, whereas 4595 has a speed of 20kph. Source ID 4595 was
selected as a worst case scenario.
Prepared for: Broxbourne Borough Council AECOM
16Broxbourne Borough Council FINAL
Project number: 60566564
2.26 The assessment identified that a significant reduction in AADT would be required in order to
bring forwards compliance by 12 months. At minimum, a measure that would focus on an
individual vehicle category would require approximately 23% of Cars, 61% of LGVs or 33% of
HGVs to be removed in 2024 to achieve compliance. If a measure was implemented to reduce
overall traffic flow, a 30% reduction (approximately 7600 vehicles) in 2022 would be required, a
20% reduction (approximately 5100 vehicles) in 2023 would be required, and a 10% reduction
(approximately 2500 vehicles) in 2024 would be required. Due to the scale of reductions
required in total vehicle flow, it is unlikely to be achievable in the time frames given to
implement a successful measure.
Section Summary
2.27 The key elements highlighted in this section are:
1. The A10 is a key strategic route through Broxbourne. It connects wider towns in
Hertfordshire to the M25 and beyond. The issue is not just generated by Hertfordshire
residents; however they would be impacted greatest by any scheme;
2. Delays and congestion exist along the PCM exceedance stretch as it is the first
incidence of at-grade junctions approaching/leaving London/the M25. Rat-running and
re-routeing currently exist due to these delays, varying journey times and limited parallel
routes;
3. The vehicle fleet composition on and around the exceedance stretch is lower than
national expectations – this is expected when viewing economic considerations around
the study area and confirms the scale of intervention would have to be significant; and
4. A significant amount of traffic would have to be removed from the A10 just to bring
compliance forward by one year.
Prepared for: Broxbourne Borough Council AECOM
17Broxbourne Borough Council FINAL
Project number: 60566564
3. Wider Scheme Constraints/Issues
3.1 Having defined the characteristics of the A10 corridor and users of the road, this section
outlines the key scheme constraints and conflicts in the local/wider area which need to be
considered when examining scheme options.
M25 Junction 25
3.2 South of the exceedance stretch the A10 intersects with the M25 at junction 25. Highways
England have been working to implement an upgrade scheme at junction 25 since 2017. This
will involve the signalisation of all arms and providing additional capacity. In addition they
propose to install a free flowing left turn filter from the eastbound M25 onto the A10 northbound
towards the exceedance stretch. Localised widening will also enhance capacity leading to and
from the junction.
3.3 This scheme is a committed scheme with funding of up to £50M confirmed. The implementation
date of this scheme has the potential to slip further into the future and it is currently scheduled
to be complete by Sept 2022, however, these programme delivery dates are yet to be agreed
with HCC Network Management, so currently remain in draft. Guidance from JAQU has
stipulated that any air quality scheme requiring works on street cannot be started until the
junction 25 works are complete. As works should only be considered if they bring forward
compliance by a minimum of at least a year (i.e. to 2024 or earlier) the timeframe for
implementing any scheme on street is minimal.
3.4 Any scheme to address air quality on the exceedance stretch would require the reduction of
flows on the A10. This requirement conflicts with the Junction 25 upgrade scheme which
provides additional capacity at the junction and to and from the A10. This could attract
additional traffic along the A10 corridor.
HCC Major Road Network (MRN) Bid
3.5 Separately to this JAQU project, The A10 /Church Lane, A10 / College Road and A10
/Lieutenant Ellis Way junctions in Broxbourne/Cheshunt have been identified as key congestion
hotspots and a constraint to future planned growth in the Broxbourne area. The A10 / Church
Lane and A10 / College Road junctions are within the exceedance stretch.
3.6 Design reviews and modelling work have been undertaken and a preferred design option has
been investigated for each of the locations with indicative costs and land take requirements.
Each preferred scheme option looks to enhance capacity leading to or through the exceedance
stretch. The junction schemes and supporting measures were submitted to England Economic
Heartland (EEH) as an application for the Major Road Network (MRN) fund. The application
was assessed using a Multi Criteria Assessment Framework against EEH priorities and the
MRN objectives and was subsequently shortlisted by the EEH for submission to the DfT.
3.7 HCC are now progressing with a Strategic Outline Business Case (SOBC) to support their MRN
bid proposals at the 3 junctions. The SOBC is still being drafted and an agreed submission date
with DfT is soon to be agreed. It is likely to not be until February/March 2021. A decision as to
funding or progression to next stage of the bid process will be made by the department once
the SOBC has been submitted.
3.8 It can be recognised that these schemes in conjunction with the M25 junction 25 scheme
conflict with the short-term requirements to improve air quality along the A10 by removing
traffic. These schemes (if implemented) would attract more traffic to the corridor as delays and
congestion would be reduced.
3.9 The combined schemes would also impact the public perception of what the A10 corridor
should be used for. The highways schemes not linked to the JAQU project are seeking to
address the current issues by improving capacity. However, providing more capacity would
adversely impact air quality as more vehicles would be attracted to the corridor. Similarly,
Prepared for: Broxbourne Borough Council AECOM
18Broxbourne Borough Council FINAL
Project number: 60566564
implementing road works on the same stretch of road over many years would generate local
frustration and negative publicity.
London Ultra Low Emission Zone (ULEZ)
3.10 The London ULEZ is due to expand to an area bounded by the north and south circular
(A205/A406) corridors in October 20218. The A10 connects to the A406 North Circular Road
approximately 10 kilometres south of the exceedance stretch. Some vehicular traffic on the A10
in the study area will route to/from south of the A406 North Circular Road (i.e. into the area the
ULEZ will expand into).
3.11 The project team believes that the expansion of the ULEZ in 2021 will lead to improvements in
air quality as vehicles travelling on arterial routes towards/from the North Circular (i.e. A10) and
beyond would consider upgrading their vehicle rather than paying a daily ULEZ charge. This is
also evident from the information shared by TfL on their highway modelling for LEZ/ULEZ
(September 2020) which considers that by 2021 all the HGV demand on the A10 is LEZ
compliant. It also shows an increase in the proportion of compliant LGVs on the A10 in all the
modelled years.
3.12 Due to time constraints, an in-depth analysis of the impact of the ULEZ expansion on traffic
travelling along the A10 could not be undertaken. However, the transport model has shown that
in 2018 8.6% of the total vehicle flows travelling southbound towards London along the A10
from Junction 25 (the edge of the model domain) were HGVs. We expect that a large proportion
of these will become compliant in response to the ULEZ expansion. This will not bring forward
compliance on its own, however when combined with a speed limit reduction it could reduce
concentrations along the A10. Nonetheless, it is difficult to quantify this without further
modelling and a speed limit reduction has already been discounted due to the impact of
rerouting on neighbouring roads.
Timescales
3.13 As detailed in the previous section, JAQU guidance states that measures should only be
implemented if they can bring forward compliance from 2025. As natural compliance is
assumed to occur in 2025, measures would have to, as a minimum, bring compliance forward
to 2024. This is due to compliance of NO2 concentrations being reported as an annual average,
therefore in order to bring forwards compliance the latest possible would be by 2024. Mid-year
concentrations cannot be accurately estimated due to constraints associated with temporal
resolution of the required modelling inputs.
3.14 As mentioned in Section 3.3, guidance from JAQU has stipulated that any air quality scheme
requiring works on street cannot be started until the Junction 25 works are complete. The
programme for this scheme has slipped to 2023 and it is feasible it could slip further,
constraining any opportunity to implement civil/physical scheme(s) on street to address air
quality.
3.15 Should the MRN funding be approved there is a very large risk that two schemes with
conflicting objectives could be scheduled on the exceedance stretch during the same
timescale.
Conflicting Project Guidance
3.16 Following submission of the Strategic Outline Case, BBC were encouraged by JAQU to
progress a charging scheme as their preferred option. This conflicted with the Council’s
preferred option of non-charging and softer measures as it was felt these would be more
politically acceptable.
8
https://tfl.gov.uk/modes/driving/ultra-low-emission-zone/ulez-where-and-
when#:~:text=ULEZ%20expansion%20%2D%20October%202021,or%20pay%20a%20daily%20charge. Accessed on 15 June
2020
Prepared for: Broxbourne Borough Council AECOM
19Broxbourne Borough Council FINAL
Project number: 60566564
3.17 The Ministerial Direction received in May 2020 conflicts with the advice provided by JAQU after
the Strategic Outline Case submission. This becomes even more restrictive when the
conflicting schemes and their timescales as detailed in this section are considered.
3.18 The project team have liaised with other JAQU (first and second wave) authorities in order to
gain insight and knowledge from previous schemes looking to address air quality exceedances.
A similar exceedance stretch was recorded on the A127 in Essex. It was noted from Essex’s
previous Strategic Outline Case submission to JAQU that:
“Whereas Charging CAZs can be effectively implemented in urban areas as these represent a
‘destination’ to which all traffic movements can be managed; a Charging CAZ cannot be
effectively implemented on areas of linear non-likely compliance, such as the Basildon and
Rochford links (A127), which provides a through-route for traffic, as traffic will simply switch to
alternative parallel routes and potentially move non-likely compliance to other locations.”
3.19 The project team feel the same limitations apply to the A10 exceedance stretch and the lessons
learnt from previous JAQU studies should be carefully considered for the A10 in Broxbourne.
Section Summary
3.20 The key elements highlighted in this section are:
1. The M25 junction 25 scheme will attract more traffic to the corridor and severely limits
the timeframe for any physical/civil schemes on street;
2. The MRN bid proposals will attract more traffic to the corridor and timeframes will
probably conflict with any scheme to improve air quality;
3. The project team believes that the expansion of the ULEZ in 2021 will lead to
improvements in air quality along the A10. This is supported by information shared by
TfL; and
4. Traffic re-routeing due to CAZ proposals is an anticipated affect and it is disappointing a
lot of work was undertaken before the Ministerial Direction was received.
Prepared for: Broxbourne Borough Council AECOM
20Broxbourne Borough Council FINAL
Project number: 60566564
4. Previous Scheme Options
4.1 Having defined the users on the exceedance stretch, their requirements and wider conflicting
scheme interdependencies, this section summarises the schemes assessed to date and the
results. (All modelling and results were undertaken prior to the Ministerial Direction received in
May 2020).
4.2 Wider, more ambitious schemes which would help improve air quality but could not be
progressed are detailed. The reasons why they could not progress are outlined to provide
reassurances to JAQU that all possible options have been considered.
Major Schemes Discounted
4.3 Several major schemes were discounted at the Strategic Outline Case stage. It was
acknowledged these schemes could contribute to improving air quality in the exceedance
stretch, however all were discounted due to the following reasons:
▪ Closing the at-grade junctions at the Church Lane / College Road junctions with the
A10. These were discounted as traffic would still need to cross the A10 which would
place increased pressure on other routes, generate significant re-routeing and
significantly increase severance generated by the A10;
▪ Provide grade separated junctions at the Church Lane / College Road junctions with
the A10. These were discounted due to the considerable cost involved, possible land
take and increased severance which would be generated; and
▪ Increase the frequency of parallel rail services or lobby for new rail routes. These were
discounted due to the considerable timeframes and cost involved in negotiating
changes to rail patterns. There are also very limited options to change rail services
once franchises are agreed.
Summary of Modelling Undertaken to Date
4.4 Scheme options modelled to date9 include:
• Non-charging: The Non-charging Option is a package of measures represented in a single
option designed to reduce private vehicular traffic using the A10. The measures represented in
the model include the following interventions: speed reduction to 40 MPH on the A10 between
the A414 and the M25, use of signals to ‘gate’ traffic away from the A10, new public transport
services and re-design of signalised junction at Church Lane.
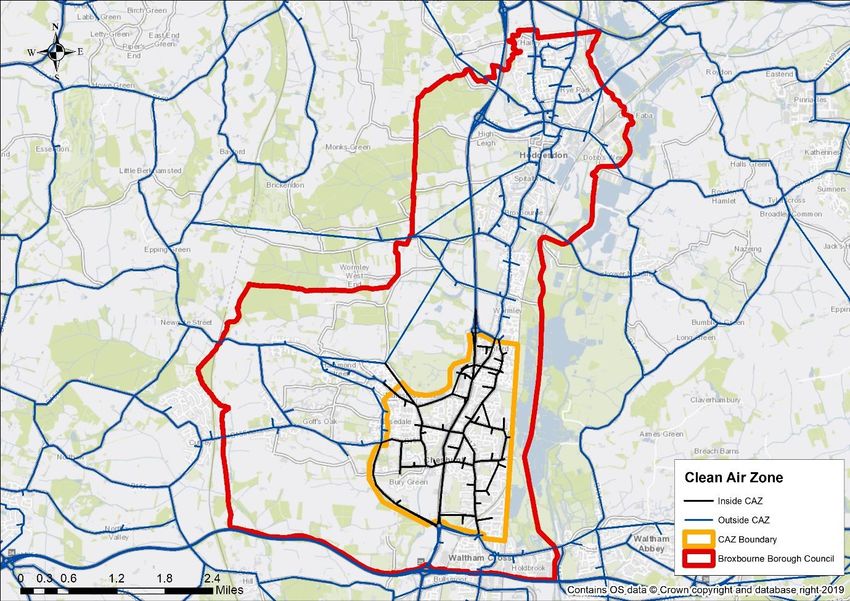
• CAZ-D(1) (larger exemption area): This charging option is a Class D CAZ and any non-
compliant vehicles crossing a defined cordon (see Figure 4.1) is subject to a charge unless it is
subject to either the vehicle exemption or area exemption. The area exemption covers the BBC
area and applies to residents and business registered in BBC.
• Combined: The Combined Option is an option that combined the Non-charging measures in
combination with CAZ-D(1).
• CAZ-D(2) (smaller exemption area): This charging option is a Class D CAZ and any non-
compliant vehicles crossing a defined cordon is subject to a charge unless it is subject to either
the vehicle exemption or area exemption. The exemption area covers the CAZ charging
boundary and applies to residents and business registered inside the CAZ.
• CAZ-C(1) (larger exemption area): This charging Option is a Class C CAZ and any non-
compliant LGVs or HGVs crossing the CAZ boundary is subject to a charge unless the area
exemption applies. The area exemption covers BBC and applies to residents and business
registered in BBC.
9
Full details contained in the Broxbourne Borough Council Local NO2 Plan- COMET-A10 Application, T4 - Transport Model
Forecasting Report issued by AECOM in February 2020
Prepared for: Broxbourne Borough Council AECOM
21Broxbourne Borough Council FINAL
Project number: 60566564
• CAZ-C(2) (smaller exemption area): This charging Option is a Class C CAZ and any non-
compliant LGVs or HGVs crossing the CAZ boundary is subject to a charge unless the area
exemption applies. The area exemption includes the CAZ charging boundary and applies to
residents and business registered in BBC.
4.5 Figure 4.1 details the boundaries of the modelling scenarios assessed.
Figure 4.1: Scheme Options CAZ Boundaries
4.6 The following figures illustrate the results observed across the model scenarios. Whilst each
scenario generated marginally different results, the results could be grouped into 2 categories:
1. The scenarios generate significant re-routeing which conflicts with the Ministerial
Direction; or
2. Impacts were not significant enough to meaningfully improve air quality along the
exceedance stretch and bring compliance forward.
4.7 Figure 4.2 details the flow differences in the non-charge option compared to the Baseline. Blue
represents flow decrease and green a flow increase. It can be recognised there is a significant
flow reduction on the exceedance stretch, however traffic reroutes onto parallel routes. Similarly
Figure 4.3 details the flow differences from the CAZ D(2) option compared to the Baseline. The
impacts are much less, however re-routeing still occurs.
Prepared for: Broxbourne Borough Council AECOM
22Broxbourne Borough Council FINAL
Project number: 60566564
Figure 4.2: 2026 Non-charge option compared with 2026 Baseline (AM peak)
Figure 4.3: 2026 CAZ-D(2) option compared with 2026 Baseline (AM Peak)
4.8 The headline flow impacts from the transport modelling are summarised in Table 4.1.
Prepared for: Broxbourne Borough Council AECOM
23Broxbourne Borough Council FINAL
Project number: 60566564
Table 4.1: Range of One-Way Hourly Flow Difference Compared to the Baseline Scenarios of
each Scenario Assessed
Forecast Forecast
Rail Flow Rail Flow Bus Flow Bus Flow
Highway Highway
(passengers, (passengers, (passengers, (passengers,
Option Flow (PCUs) Flow (PCUs)
average average average average
Diverted off Diverted off
hour): 2022 hour): 2026 hour): 2022 hour): 2026
the A10: 2022 the A10: 2026
Non-charging -600 to -700 -600 to -700 Less than -10 Less than -10 Less than 40 Less than 40
CAZ-D(1) -100 to -200 Less than -50 Less than -50 Less than -50 Less than 80 Less than 80
Combined -650 to -850 -600 to -700 Less than -50 Less than -60 Less than 90 Less than 100
CAZ-D(2) -150 to -200 -50 to -100 Less than -50 Less than -50 Less than 75 Less than 80
No material No material No material No material
CAZ-C(2) - 50 to -100 Less than -50
difference difference difference difference
No material No material No material No material
CAZ-C(1) Less than -50 Less than -50
difference difference difference difference
4.9 Table 4.1 illustrates that scenarios have differing impacts on the transport network however one
message is key; vehicle drivers impacted do not choose to switch to rail or bus for their journey.
Therefore, all results reported to date induce some re-routeing.
4.10 Results from the transport modelling informed the air quality modelling, which found that on
average, 2022 NO2 annual mean concentrations within Broxbourne for all the measure
scenarios listed above resulted in an overall improvement in air quality compared to the
baseline. The Combined measure option, followed by the CAZ-D(2) measure option, led to the
greatest reduction in NO2 concentrations predicted at the worst case receptor (BB28) located
on the A10 PCM exceedance stretch. In comparison, the CAZ-C(1) measure option resulted in
the lowest level of improvements in annual NO2 concentrations at BB28.
4.11 All measure options were shown to bring forwards compliance from 2025, as displayed in Table
4.2. However, assumed compliance when taking into consideration the M25 J25 works, would
likely result in the CAZ-C(1) measure option not bringing forward compliance from 2025. For all
other measure options, compliance would be brought forwards to at least 2024.
Table 4.2: Predicted Compliance Year for Each Measure Option
Measure Option 2022 Annual 2023 Annual Compliance Year Assumed
Mean NO2 Mean NO2 Compliance Year
Concentration at Concentration at with Junction
BB28 (µg/m3) BB28 (µg/m3) M25 Works
CAZ-D(1) 42.0 40.2 2023 2024
CAZ-C(1) 44.9 42.6 2024* 2025
Non-Charging 40.8 38.6 2023 2024
Combined 36.2 34.9 2022 2023
CAZ-D(2) 38.2 37.0 2022 2023
CAZ-C(2) 42.2 40.4 2023 2024
Table 4.2 Notes:
Predicted compliance year as no modelling has been undertaken for 2024.
4.12 All measure options were however shown to also cause an increase in annual mean NO2
concentrations, as a result of displacement, in the surrounding local authorities (Welwyn
Prepared for: Broxbourne Borough Council AECOM
24You can also read