PART B: ACTIVITY MANAGEMENT PLAN / PROGRAMME BUSINESS CASE - Land Transport Asset Management Plan 2021-31
←
→
Page content transcription
If your browser does not render page correctly, please read the page content below
Land Transport Asset Management Plan
               2021-31

PART B: ACTIVITY MANAGEMENT PLAN
  / PROGRAMME BUSINESS CASE
             Effective Date: 1 July 2021

             Prepared by: Roading Unit
              Waitaki District Council
Land Transport Asset Management Plan 2021-30
                                                                        Part B: Activity Management Plan

                                   Quality Assurance Statement

Waitaki District Council                            Project Director: Mike Harrison
Thames Street
Private Bag 50058
                                                    Project Manager: Gary Woock
Oamaru
New Zealand
Phone: +64 3 433 0300                               Approved for issue by:

                                           Document Control
 Rev.           Date              Status         Prepared by       Reviewed by         Approved by
  1.0       02/07/2020             Draft          M. Rodwell         G. Woock
  2.0       09/11/2020          Final Draft       M. Rodwell         G. Woock
                               Final for Audit
  3.0       08/03/2021                             G. Woock
                                     NZ

 Rev.                                               Details
  1.0     Pre-consultation draft for 2021-24 NLTP planning period and 2021-31 Council LTP
  2.0     Final Draft
  3.0     Final for Audit NZ

WAITAKI DISTRICT COUNCIL
                                                                                March 2021    Page B-i
Land Transport Asset Management Plan 2021-30
                                                                                                  Part B: Activity Management Plan

Contents
1    Introduction ................................................................................................................................. 1
     1.1      Scope .................................................................................................................................. 1
     1.2      Legal Authority and Key Legislation ................................................................................... 1
     1.3      Local Bylaws ....................................................................................................................... 3
     1.4      Asset Management Policy and Guiding Principles ............................................................. 4
     1.5      Assurance ........................................................................................................................... 5
     1.6      Asset Management Maturity ............................................................................................... 6

2    The Services we Provide and How they are Delivered ........................................................... 7
     2.1      Scope of the Activity and Description of Assets ................................................................. 7
     2.2      Scope of the Activity and Description of Assets ................................................................. 8
     2.3      Critical Assets ..................................................................................................................... 9
     2.4      Asset Valuation ................................................................................................................. 10
     2.5      Organisational Structure ................................................................................................... 11
     2.6      Managing Service Delivery ............................................................................................... 13
     2.7      Activity Programme Linkages ........................................................................................... 15

3    Levels of Service and Performance ........................................................................................ 16
     3.1      Customer Consultation and Expectations ........................................................................ 16
     3.2      Current Performance, Levels of Service (LoS) ................................................................. 18
     3.3      Overview of Current Asset Capacity, Performance and Risks ......................................... 23

4    Gap Assessment ....................................................................................................................... 26
     4.1      Gap Assessment Approach .............................................................................................. 26
     4.2      Transport Outcomes ......................................................................................................... 26
     4.3      Changes to Meet ONRC Function .................................................................................... 27
     4.4      Transport Planning ........................................................................................................... 28
     4.5      Peer Group ONRC Performance Gaps ............................................................................ 28
     4.6      Asset Lifecycle Management Gaps .................................................................................. 29
     4.7      Data Quality Gaps ............................................................................................................ 30
     4.8      Other Evidence Gaps ....................................................................................................... 31

5    Options Analysis....................................................................................................................... 33
     5.1      Investment Options ........................................................................................................... 33
     5.2      Investment Decision Making Criteria ................................................................................ 34
     5.3      Option 1: Baseline Strategy & Policy Approach ............................................................... 36
     5.4      Option 2 ............................................................................................................................ 38
     5.5      Option 3: Enhanced Strategy & Policy Approach ............................................................. 39

WAITAKI DISTRICT COUNCIL
                                                                                                                     March 2021           Page B-ii
Land Transport Asset Management Plan 2021-30
                                                                                                  Part B: Activity Management Plan

      5.6     Option 4: Enhanced Programme for Change ................................................................... 41
      5.7     Appraisal Summary Table ................................................................................................ 41

6     Preferred Programme ............................................................................................................... 44
      6.1     Operations, Maintenance, Renewal and Improvement Programmes .............................. 44
      6.2     Risks ................................................................................................................................. 50
      6.3     What It Will Cost ............................................................................................................... 52
      6.4     Programme Sustainability ................................................................................................. 53
      6.5     How We Will Pay for It ...................................................................................................... 53
      6.6     How It Will Be Delivered / Procurement Strategy ............................................................. 54
      6.7     Benefits of Investing ......................................................................................................... 54
      6.8     Consequence of Not Investing ......................................................................................... 56
      6.9     Residual Risk and Significant Negative Effects ................................................................ 56
      6.10 Meeting the Investment Assessment Criteria ................................................................... 58

List of Figures
Figure 1:     AM Document Hierarchy .................................................................................................... 2
Figure 2:     Asset Management Policy Framework ............................................................................... 3
Figure 3:     Performance Management Framework .............................................................................. 5
Figure 4:     Asset Management Advancement & Maturity Assessment ............................................... 6
Figure 5:     Waitaki District ONRC Road Classification ........................................................................ 7
Figure 6:     Transport Network in Waitaki ............................................................................................. 8
Figure 7:     Waitaki District Transportation Asset Valuation Summary ............................................... 11
Figure 8:     Council Procurement Strategy .......................................................................................... 14
Figure 9:     WDC Customer Satisfaction Survey Results ................................................................... 17
Figure 10:    Roading Customer Satisfaction Splits .............................................................................. 17
Figure 11:    Main Roading Issues from Customer Feedback .............................................................. 17
Figure 12:    Expenditure profile for the last 3-years ............................................................................. 25
Figure 13:    Transportation Level of Service Gap Assessment Criteria .............................................. 26
Figure 14:    REG Data Quality Dashboard – Waitaki RAMM Data ...................................................... 30
Figure 15:    Four Primary Options ....................................................................................................... 33
Figure 16:    Estimated Expenditure Forecasts..................................................................................... 34
Figure 17:    Investment Options Assessment criteria .......................................................................... 36
Figure 18:    Proposed Internal Business Unit Structure ...................................................................... 39
Figure 19:    Expenditure....................................................................................................................... 52
Figure 20:    Programme Sustainability ................................................................................................. 53
Figure 21:    Our Revenue Plan ............................................................................................................ 53
Figure 22:    How we will Spend the General Rate on Transportation Services ................................... 54

List of Tables
Table 1:      Description of Assets .......................................................................................................... 8
Table 2:      Critical Assets Schedule ..................................................................................................... 9
Table 3:      Waitaki District Transportation Asset Valuation Summary ............................................... 10
Table 4:      WDC Contract Schedule .................................................................................................. 13
Table 5:      Activity Programme Linkages ........................................................................................... 15
Table 6:      DIA Performance Measures & Results ............................................................................. 19
Table 7:      REG Performance Measures & Results ........................................................................... 19
Table 8:      Effectiveness of current work category programmes ....................................................... 23
Table 9:      Transportation Level of Service Gap Assessment Results .............................................. 26
Table 10:     ONRC Function Gap Assessment Results ....................................................................... 27
Table 11:     Demand Management & Transport Planning Gap Assessment Results ......................... 28

 WAITAKI DISTRICT COUNCIL
                                                                                                                     March 2021           Page B-iii
Land Transport Asset Management Plan 2021-30
                                                                                                Part B: Activity Management Plan

Table 12:   Peer Group ONRC Performance Gap Assessment Results ............................................ 28
Table 13:   Gaps Relating to the Optimised Lifecycle Management .................................................. 29
Table 14:   Data Quality Gap Assessment Results ............................................................................ 31
Table 15:   Other Evidence Gaps ....................................................................................................... 31
Table 16:   Option 1 Detailed Description ........................................................................................... 37
Table 17:   Option 3 Detailed Description ........................................................................................... 40
Table 18:   Criteria Used ..................................................................................................................... 41
Table 19:   Assessment Summaries ................................................................................................... 42
Table 20:   Operations, Maintenance, Renewal and Improvement Programmes .............................. 44
Table 21:   Risks ................................................................................................................................. 50
Table 22:   Benefits of Programme Investment .................................................................................. 55
Table 23:   Residual Risk .................................................................................................................... 57
Table 24:   Meeting the Investment Assessment Criteria ................................................................... 58

 WAITAKI DISTRICT COUNCIL
                                                                                                                   March 2021           Page B-iv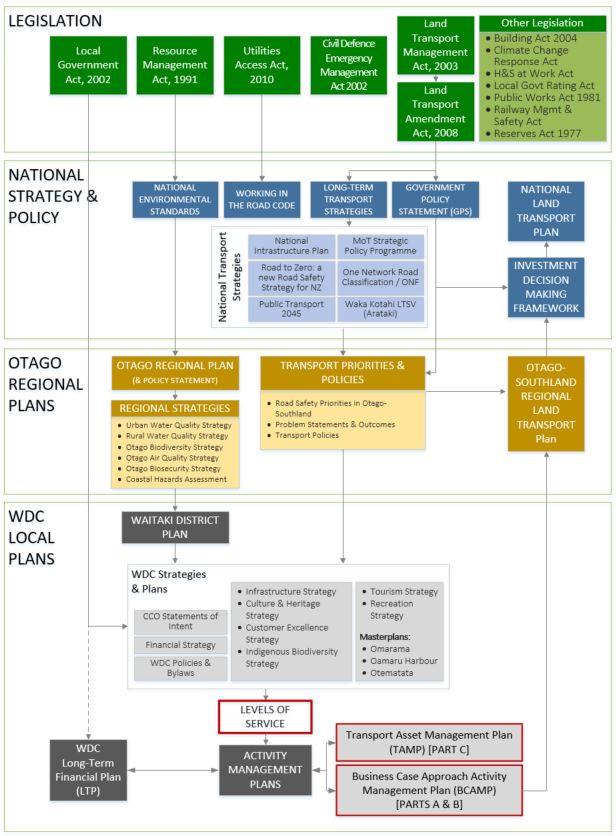
Land Transport Asset Management Plan 2021-30
                                                                   Part B: Activity Management Plan

Acronyms & Abbreviations
Acronym        Meaning                           Additional Notes

AM             Asset Management

CCO            Council Controlled Organisation

DIA            Department of Internal Affairs    Sets mandatory performance measures for
                                                 local government

dTIMS          Deighton Total Infrastructure     Modelling software used to forecast pavement
               Management System                 performance

GPS            Government Policy Statement
               on Transport

HPMV           High Productivity Motor Vehicle

IIMM           International Infrastructure      Internationally accepted good practice guide
               Management Manual                 for asset management

LGA            Local Government Act

LoS            Level(s) of Service

LTP            Long Term Plan

MCA            Multi Criteria Analysis

NOIC           North Otago Irrigation Company

OAG            Office of the Auditor General

ONF            One Network Framework             Replaces the ONRC for planning from 2024/27
                                                 LTP

ONRC           One Network Road Classification   National system for highway classification &
                                                 setting of levels of service

OSRLTP         Otago Southland Regional Land
               Transport Plan

RAMM           Road Assessment and               asset inventory database with functionality to
               Maintenance Management            manage work, perform inspections,
                                                 assessment, asset valuation, forward works
                                                 programming

REG            Road Efficiency Group             Industry advisory group established by Waka
                                                 Kotahi NZTA and Local Government New
                                                 Zealand

TAM            Transportation Asset
               Management

TAMP           Transportation Asset
               Management Plan

WDC            Waitaki District Council

WoLC           Whole of Life Cost

WAITAKI DISTRICT COUNCIL
                                                                           March 2021    Page B-v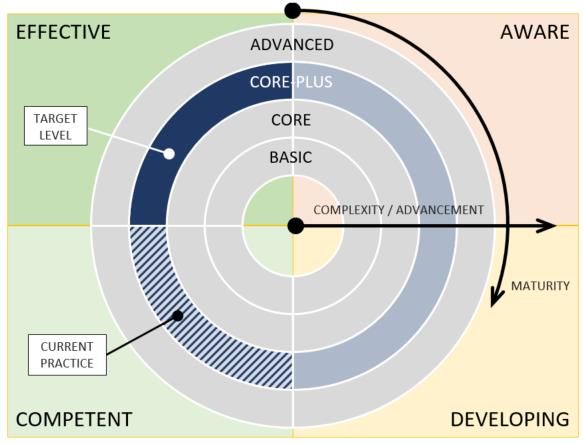
Part B: Activity Management Plan - Introduction

       PART B: ACTIVITY MANAGEMENT
       PLAN / PROGRAMME BUSINESS
                   CASE

1 Introduction
This part of the Land Transport Activity Management Plan sets out and explains the proposed
investment for the 2021-2031 period. It includes evidence to support the investment proposed, clearly
linking the investment back to service outcomes, including the key issues we are facing and
experienced Levels of Service. It explains what we are going to do and how we are going to do it.

The key audiences for this part of the AMP include:

•       Investors
•       Community
•       Council Reporting (Annual Plan, LTP)

1.1 Scope
       Our Purpose: Our road corridor networks connect people with destinations, are lines of
    communication and are used for vital underground infrastructure reticulations. Our roads also link
    goods and freight from our farms and high-country stations to far away markets. Without a reliable
       roading network, much of the economic activity within our district and country would not be
                                               possible.

Waitaki District Council manages Waitaki’s local road network, improving road safety and ensuring
people enjoy easy access to different modes of transport. The Council operates and maintains local
roads (including streetlights, bridges, footpaths, traffic signals, sumps, berms, bus shelters, parking
buildings and parking machines), and monitors crash statistics to identify problem areas and
determine solutions. Resilience of the transport network is supported by identifying the impacts of
land use, growth and development on the network and parking resource, and identification of where
future upgrades or control is required. The activity invests in walking and cycling projects and
education to encourage greater use of more sustainable transport modes.

1.2 Legal Authority and Key Legislation
Council has statutory responsibilities under the Local Government Act 2002 and Land Transport
Management Act 2003 to provide the services for this activity.

 WAITAKI DISTRICT COUNCIL
                                                                                   March 2021      Page B-1
Part B: Activity Management Plan - Introduction

In performing its role, Waitaki must have regard to the contribution that the following core services make
to the social, economic, environmental, and cultural well-being of communities, in the present and for
the future:

(a)      network infrastructure:
(b)      public transport services:
(c)      the avoidance or mitigation of natural hazards:

The hierarchy of instruments governing the practice of asset management is as follows:

                                            LEGISLATION

                     NATIONAL POLICY, STRATEGY & GUIDANCE

                                            STANDARDS
      ISO55001 - Asset Management       ISO31001 - Risk Management
                                                                           NZTA Standards & Guidelines
                Standard                         Standard

                       AM PRACTICES & SUPPORT ELEMENTS
       Bylaws &                         REG           Data Management                        Procurement
                        IIMM                                                District Plan
       Policies                       Guidelines          Systems                              Strategy

                                         BENCHMARKING
                                                                                     Investor Confidence
             OAG                    REG Tools              LGNZ CouncilMARK
                                                                                            Rating

Figure 1:    AM Document Hierarchy

The statutory requirements provide Council with a minimum level of service standard and have been
reflected in the levels of service shown in Section 4. Council is currently complying with all legislative
requirements and the operative strategies, plans and policies of the Regional Council.

Line of sight between the resulting planning documents and strategies that influence planning and
delivery of the local road transportation services in Waitaki, and this AMP is shown in the figure
below:

 WAITAKI DISTRICT COUNCIL
                                                                                    March 2021      Page B-2
Part B: Activity Management Plan - Introduction

Figure 2:   Asset Management Policy Framework

1.3 Local Bylaws
1.3.1 Roading Bylaw 2013 [currently under review]
      The purpose of this bylaw is to promote public safety and effectively regulate pedestrian,
      animal and traffic movements on roads, footpaths and public places within the Waitaki District.

 WAITAKI DISTRICT COUNCIL
                                                                                 March 2021      Page B-3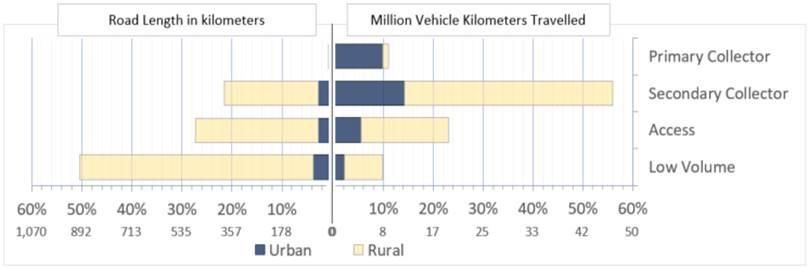
Part B: Activity Management Plan - Introduction

        The 2013 Bylaw introduced the Code of Practice for Stock Crossings and revised speed limits.
        It is due for update in 2020 and will be split into two bylaws: Roading Bylaw (including speed
        limits) and a separate Parking Bylaw.
        A speed limits review was completed in late 2018 with public consultation in 2019. A second
        round of consultation has been completed and implementation is now underway.

1.3.2 General Bylaw 2016 [to be reviewed in 2023]
        Public Spaces - This part of the bylaw controls a diverse range of activities to ensure that
        acceptable standards of convenience, safety, visual amenity and civic values are maintained
        for the well-being and enjoyment of citizens, visitors and businesses within the district. In
        particular, this part addresses damage to public facilities such as roads, grass verges, garden
        areas and reserves. It also addresses activities within public places and reserves which may
        have an adverse effect on other users of these facilities.

1.4 Asset Management Policy and Guiding Principles
Council’s AM Policy establishes responsible governance for the practice of asset management by the
Council, and commits to the continuous improvement of asset management practices.

    Our Mission: We are transport focussed, making lives better for our communities and visitors.
      We maintain and develop a safe, effective, efficient, accessible, affordable and fit for purpose
                                       transportation network.

The asset management objectives for the delivery of sustainable transportation services are:

1       To ensure we provide services so people want to stay and move here; maintain a Service
        Delivery Focus:
        i.    Manage and maintain assets sustainably to meet defined Levels of Service that balance
              customer expectations with risk, affordability and time considerations;
        ii.   consult actively, clearly and meaningfully with stakeholders where appropriate and be
              responsive to stakeholder inputs.
2       To ensure we meet the diverse needs of our community; implement integrated Decision-
        Making processes.
        i.   integrate the decision-making processes for assets to include corporate, financial,
             business, land-use, community, environmental, social, technical and budgetary plans
             and perspectives; and
        ii.  consider assets in a larger service delivery and “place” context using the ONRC
             framework, not just as an isolated asset.
3       To enable opportunities for new and existing businesses; undertake place based transport
        planning and incorporate mode neutrality within decision processes

4       To ensure Waitaki's distinctive environment is valued and protected; strive to manage
        assets to deliver services that are sustainable for the community and local environment, and
        that meet the anticipated challenges from climate change impacts, and future generations;
        i.    consider climate change impacts and how they may directly affect levels of service;
        ii.   consider future growth and demand requirements to ensure assets are adapted to meet
              demographic changes and the needs of future generations;
        iii.  embed the precautionary principle in our planning and decision making, and deliver a low
              carbon transport system that minimises harm.
5       To maintain the safest community we can; ensure that relevant legislation, regulations,
        engineering standards, consent conditions and bylaws followed, monitored and enforced
        i.    consider climate change impacts and how they may directly affect levels of service;
        ii.   design and manage the land transport network to be to be safe

 WAITAKI DISTRICT COUNCIL
                                                                                    March 2021      Page B-4
Part B: Activity Management Plan - Introduction
iii. systematically incorporate adaptive methods and technologies to improve infrastructure
resilience; and
iv. consider future growth and demand requirements to ensure assets are adapted to meet
demographic changes and the needs of future generations.
6 To keep our district affordable; make informed decisions by considering full lifecycle
revenues and costs (including operation, maintenance, replacement, and decommissioning);
i. recognize that that there are constantly changing financial constraints and challenges
that surround all services and assets delivered by the District and that asset
management practices must be proactive and responsive to changing environments and
short-term priorities;
ii. identify and adequately plan for required levels of operations, maintenance and
replacements associated with new infrastructure, and use available resources effectively
to minimize total life cycle costs of assets; and
iii. recognize that sustainable service delivery requires long-term financial planning.
1.5 Assurance
WDC sets goals and periodically monitors performance to manage programs, achieve targets, and
deliver on strategic goals and customer levels of service. A hierarchy of performance measures
allows Council staff and stakeholders to manage progress, identify improvements, and adjust
programmes to ensure achievement of the desired outcomes.
Achievement of Council Review and Infrastructure Strategy
Priorities & TAM Objectives Update
WDC Priorities
Achievement of Benefits Review and TAM Strategic Case
Framework Perf. Measures Update
TAM Problem Statements &
Objectives
Achievement of ONRC LoS AM Improvement TAM Programme Case
Goals Plan
ONRC LoS GOALS
REG TA Data, Performance ONRC Performance
& Achievement Reports Metrics; AM Maturity
Assessment
Achievement of Annual Annual Annual Plan
Plan Targets Achievement
Report Financial & Achievement
Performance Targets; DIA
Measures
Figure 3: Performance Management Framework
Note: TAM = Transportation Asset Management; ONRC = One Network Road Classification; LoS = Levels of
Service; DIA = Department of Internal Affairs; REG = Road Efficiency Group; TA = Territorial Authority
WAITAKI DISTRICT COUNCIL
March 2021 Page B-5Part B: Activity Management Plan - Introduction
1.6 Asset Management Maturity
WDC periodically commissions
independent reviews of AM
maturity within the
organisation. Our target level of
advancement is “Core-Plus”,
reflecting the scope, scale and
risk of the transportation
service and its criticality to the
wellbeing of Waitaki District.
The last review was completed
by Waugh Infrastructure in
2017 and showed a developing
level of maturity. Significant
improvements have been
made since 2017, assisted by
the REG programme and our
self-assessed maturity level is
“Competent”. An independent
review will be undertaken
during the first year of this plan.
Figure 4: Asset Management Advancement & Maturity Assessment
WAITAKI DISTRICT COUNCIL
March 2021 Page B-6Part B: Activity Management Plan - The Services we Provide and
How they are Delivered
2 The Services we Provide and How
they are Delivered
2.1 Scope of the Activity and Description of Assets
Council is responsible for most of the Land Transport system in the District other than state highways
which are owned and operated by the New Zealand Transport Agency (NZTA). Our transport system
includes:
• Road pavements and surfaces (both sealed and unsealed), and ownership of the corridor
• Drainage including culverts, water tables, kerb and channel and storm water systems
• Signs and pavement markings to provide information and improve road safety
• Bridges to carry traffic, including pedestrians and cyclists, over waterways
• Footpaths, walkways and cycle facilities
• Street lighting for safe and comfortable movement at night
Over 85% (1,800km) of the roads in the District are owned and operated by Council, with the NZTA
controlling the remaining 15% (306km). The Waitaki District is characterised by rural, low volume,
unsealed roads. Walking and cycling is comparatively small but an increasingly important part of the
transport system:
• 90% of roads are rural (i.e. have a speed limit of more than 70 km/h)
• 57% are unsealed
• Over 94% have traffic volumes of less than 500 vehicles per day
• Waitaki District's population is 22,200 (Jun 2017), of which 13,900 (63%) live in Oamaru.
• Most transport in Waitaki involves trucks and private motor vehicles on public roads.
The national adoption of the One Road Network Classification (ONRC) has allowed us to work
towards the standardisation of different levels of services for different roads, depending on use and
function. The distribution of roads in the District according to the ONRC is shown below:
• Primary Collector: locally important roads linking significant local economic areas or populations
• Secondary Collector: roads linking local areas of population and economic sites (may be the only route available)
• Access: all other roads but split further into the low volume subset below
• Low Volume: a further subset of access roads with less than 200 vehicles per day
Figure 5: Waitaki District ONRC Road Classification
Council holds comprehensive asset inventories for all components of the land transport network and
associated infrastructure. This information is retained in Council’s RAMM database, which is updated
monthly. As at July 2019, Council’s land transport network consists of approximately 1,800 kilometres
of roads. The land transport asset has an Optimised Replacement Cost (ORC) of $799.8M and an
Optimised Depreciated Replacement Cost (ORDC) of $612.8M.
WAITAKI DISTRICT COUNCIL
March 2021 Page B-7Part B: Activity Management Plan - The Services we Provide and How
they are Delivered
2.2 Scope of the Activity and Description of Assets
The Council-managed network consists of the following major components:
Table 1: Description of Assets
ASSET ASSET COMPONENT UNIT QUANTITY
Road Pavements Sealed Local Roads km 777
Unsealed Local Roads km 1,023
Bridges & other Bridges ea 171
structures Large Culverts ea 10
Fords ea 8
Railings m 7,360
Retaining Walls ea 90
Drainage Culverts ea 7,950
Subsoil Drains ea 73
Sumps & Catch Pits ea 1,143 & 41
Manholes ea 12
Drainage Flumes ea 6
Scour Protection ea 7
Soak Pits & Deep Well Shafts ea 16 & 24
Washover structure ea 34
Water Race ea 77
Vehicle crossing pipe ea 113
Surface Water Channel Dished Channel km 10.47
Kerb & Channel km 184.09
Roadside Drain km 3,151.06
Other m 861
Traffic Services Signs ea 5,389
Road Markings km 2,772
Sight Rails m 3,756
Street Lighting Street Lights ea 2,014
Footpaths & cycleways Footpaths km 166
Cycleways/Walkways km 7.39
Car Parks Off-Street Car parks m2 21,000
Figure 6: Transport Network in Waitaki
WAITAKI DISTRICT COUNCIL
March 2021 Page B-8Part B: Activity Management Plan - The Services we Provide and How
they are Delivered
2.3 Critical Assets
Risk Management continues to be an area of learning and growth for Council. We are focussed on developing a consistent organisational approach to
managing risk across Council services and projects.
Critical assets are those that may cause catastrophic failure and have the greatest effect on the network’s primary function, thereby impacting on the
customer should they fail or not be available. In broad terms, critical assets are bridges and lifeline routes (roads that provide key links or have high traffic).
Critical failure modes have been assessed as: coastal erosion, flooding, landslips, seismic, wind, and wildfire – in that order. Our principal management
objective is to prevent the deterioration of critical assets to “very poor” condition where major and urgent replacement is required. This ensures community
safety, service continuity and minimises disruption costs.
Table 2: Critical Assets Schedule
Asset Name Reason Asset Name Reason Asset Name Reason
STEWARD ST Helipad, Medical, ONRC WHITEROCKS RD ONRC, Fire Station DOUBLE HILL RD ONRC
THAMES ST WEST Helipad, ONRC, Welfare WESTON RD ONRC, Fire Station FORTIFICATION RD ONRC, Welfare
ROBERTSON RD Airport KAKANUI RD ONRC SETTLEMENT RD - KUROW ONRC, Welfare
LAKE OHAU RD Airstrip TIVERTON ST ONRC OTEMATATA STATION RD ONRC
WESTVIEW DR Fire Station, ONRC, Utility EAST RD ONRC NIMMO RD ONRC
ITCHEN ST ONRC, Utility KAKANUI RD ONRC BUSHY BEACH RD ONRC
MAIN ST (WESTON) ONRC, Fire Station HIGH ST ONRC HUMBER ST ONRC
BRINKBURN ST Utility, ONRC ORWELL ST Utility MAHENO ALL DAY BAY RD ONRC
TYNE ST Utility, ONRC REGINA LANE Utility SHAG POINT RD ONRC
REDCASTLE RD Utility, ONRC REDCASTLE RD Utility SANDAY ST ONRC, Fire Station
BEACH RD - KAKANUI (NORTH) Utility, ONRC RESERVOIR ROAD Utility LIMEKILN RD ONRC
Emergency procedures - Coastal Otago Network: Summary of key issues and detour routes identified as critical suitable for all vehicles (NZTA)
1. SH 1 and SH 83 between Pukeuri and the Waitaki River is noted as a known flood prone area. The only alternative route identified near Oamaru is the Weston Road-
Ngapara Road-Georgetown route from SH 1 to SH 83. There are few alternatives (at times this has required use of SH85 and SH8 via Alexandra and Fairlie).
2. Known flooding issue at the Alma rail over bridge highlights a detour via Weston Road and White Rocks Road.
3. There is no designated detour between Reidston and Maheno. This area includes a floodway for the Kakanui River. The alternative route is via Kakanui, which
includes the Kakanui Point Bridge (Posted to 80% Class 1, one lane, over 120 years old).
4. Alternative routes for SH8 and SH83 near Omarama include Prohibition Road.
5. A detour for SH 83 on the north side of Lake Aviemore includes the Aviemore Dam and Loch Laird Road (the rest is in Waimate District).
6. The alternative to part of SH85 is Macraes Road – Hyde Macraes Road to SH87
WAITAKI DISTRICT COUNCIL
March 2021 Page B-9Part B: Activity Management Plan - The Services we Provide and How
they are Delivered
2.4 Asset Valuation
The 2020 asset revaluation shows that the portfolio has an overall replacement cost of $800m and annual depreciation of $7.3m:
Table 3: Waitaki District Transportation Asset Valuation Summary
Mar-19 Jun-20
Asset Groups Work Category
Rep. Cost DRC Ann. Dep. Rep. Cost DRC Ann. Dep.
Land - $43,527,583 $43,527,583 $0 $43,545,140 $43,545,140 $0
Formation - $352,940,583 $352,940,583 $0 $354,248,943 $354,248,943 $0
Unsealed Pavement Structure 211_Unsealed Pavements $27,355,328 $26,168,094 $570,697 $28,804,450 $27,303,413 $712,969
Sealed Pavement Structure 212/214_Sealed Pavements $138,263,581 $75,121,357 $1,467,254 $200,097,112 $114,240,976 $1,994,269
Sealed Pavement Surface 212/214_Sealed Pavements $26,336,839 $9,536,877 $1,871,090 $28,879,282 $11,516,115 $2,087,837
Drainage 213_Drainage $28,614,075 $14,594,889 $563,659 $23,757,766 $9,099,823 $457,584
Footpaths 125_Footpaths $14,725,721 $9,346,903 $419,391 $18,844,917 $9,526,073 $539,517
Markings 222_Traffic Services $8,837 $4,418 $2,209 $8,934 $4,467 $2,234
Railings 215_Bridges & Structures $1,355,464 $491,316 $51,590 $2,361,190 $698,119 $68,205
Retaining Walls 215_Bridges & Structures $9,324,244 $4,408,538 $135,339 $7,986,199 $2,460,309 $114,762
Signs 222_Traffic Services $1,600,325 $718,307 $133,345 $1,427,978 $557,844 $118,983
Street Furniture 222_Traffic Services $383,410 $115,023 $38,341
Street Lighting 222_Traffic Services $2,446,649 $1,778,665 $89,627 $2,415,688 $1,677,977 $87,346
Surface Water Channels 213_Drainage $43,027,823 $23,525,144 $591,978 $43,212,959 $19,928,997 $553,959
Traffic Facilities 222_Traffic Services $263,278 $131,639 $21,940 $266,274 $133,137 $22,190
Bridges 215_Bridges & Structures $42,522,000 $17,684,000 $492,000 $43,563,171 $17,710,278 $503,838
TOTAL $732,312,330 $579,978,313 $6,410,119 $799,803,412 $612,766,635 $7,302,033
WAITAKI DISTRICT COUNCIL
March 2021 Page B-10Part B: Activity Management Plan - The Services we Provide and How
they are Delivered
Figure 7: Waitaki District Transportation Asset Valuation Summary
2.5 Organisational Structure
WDC operates an in-house roading professional services business unit to manage the road network. The figure below shows the members of our team, their
position and key functional responsibilities.
WAITAKI DISTRICT COUNCIL
March 2021 Page B-11Part B: Activity Management Plan - The Services we Provide and How
they are Delivered
WAITAKI DISTRICT COUNCIL
March 2021 Page B-12Part B: Activity Management Plan - The Services we Provide and How
they are Delivered
2.6 Managing Service Delivery
Our roading infrastructure is delivered through a combination of in-house staff, external professional
service consultants and external physical works contractors.
Transportation expenditure includes a
combination of:
• Operations & maintenance of assets
• Renewal of assets
• Construction of new infrastructure to
improve the level of service
• Network and Asset Management and
general services to support Council
functions
Council staff undertake the strategic
management of the asset and respond to
stakeholder queries. They also undertake
routine inspections of the network and manage
both the professional services and physical
works contracts. There are no changes
proposed to existing inhouse staff numbers.
We utilise professional services to provide technical skills and capacity that cannot be provided by
staff within Council. This approach has allowed the formal sharing of knowledge and experience
between both parties and the efficient delivery of services. This means of delivery has also allowed
access to a larger resource base than the Council could afford to retain.
Physical works contractors are appointed to undertake both maintenance and renewal works on
WDC's roads. Our current contract schedule is shown below:
Table 4: WDC Contract Schedule
Contract Contract Term 30/6/2020 30/6/2021 30/6/2022 30/6/2023
Roading Maintenance Awarded July 2017 Extension Extension
Initial Term New Contract
(c642/3) (3+1+1) awarded awarded
Streetlight maintenance Awarded July 2016
In Extension In Extension New Contract Initial Term
(c628/3) (2+3)
Pavement Marking Awarded July 2015
In Extension New Contract Initial Term Initial Term
(c753) (3+2)
Road Resurfacing Awarded July 2020 Possible
Initial Term Initial Term Initial Term
(c750/3) (3+1+1) Extension
Bridge Inspections Awarded July 2018 Extension
Initial Term Initial Term New Contract
(c704/1) (3+2) awarded
Awarded October
Footpath Resurfacing
2019 Initial Term Initial Term New Contract
(c723/3)
(3 years)
In-house Specialist services of professional providers direct appointed
RAMM/Asset Data
professional services where required. Open tender early in 2023
Pavement Annual
New Contract New Contract New Contract New Contract
Rehabilitation Contracts
Low Cost Low Risk Annual
New Contract New Contract New Contract New Contract
Improvements Contracts
WAITAKI DISTRICT COUNCIL
March 2021 Page B-13Part B: Activity Management Plan - The Services we Provide and How
they are Delivered
2.6.1 Value for Money
Council provides a high standard of services across an extensive District and affordability is a
key issue for the community, so achieving value for money is critical. Low population and
relatively weak socio-economic depravity indicators have a significant impact on affordability of
the transport activity, with limited ability for the ratepayers to finance any increases in road
maintenance and renewals costs.
Council’s endorsed procurement strategy is aimed at providing good quality local infrastructure,
local public services, and performance of regulatory functions in a way that is most cost-
effective for households and businesses:
Council Procurement Contract Administration
Policy Manual
Long Term Plan
Council Procurement Contracts and Supplier
30 Year Infrastructure Strategy Engagements
Strategy
Government Rules of NZTA Procurement
Sourcing Manual
Figure 8: Council Procurement Strategy
Key strategies for achieving this include:
i. Focus on outcomes – we make sure we are doing the right thing to meet our
community outcomes and national transport outcomes, including the GPS Strategic
Priorities and ONRC Customer Levels of Service
ii. Have a robust plan – to identify an effective Forward Work Plan (FWP) over the long
term so we can keep providing services for future generations
iii. Practice smart buying – simplified procurement to assist suppliers and simplified
supplier selection procedures help us make sure we get a quality outcome for the right
price
iv. Support local – maintaining capacity and competitiveness in the local market means we
have best access to the skills we need to do the work and are able to reinvest in our
community
2.6.2 Linkages with other RCAs
Waitaki District Council works with neighbouring authorities
where there is mutual benefit. In the Roading sector, Waitaki
District has opted to undertake planning through the Otago
Regional Council’s Regional Land Transport Plan, but also
collaborates with other territorial authorities and NZTA in
Canterbury as well.
2.6.3 Collaboration
Council has explored opportunities and associated benefits of
work with other entities. However, these opportunities are
limited as NZTA has long term network outcome contracts in
place and Waimate District is part of the Aoraki Roading
Collaboration in South Canterbury. Linkages with Central Otago
are limited, but some network management investigation modelling work has been shared.
WAITAKI DISTRICT COUNCIL
March 2021 Page B-14Part B: Activity Management Plan - The Services we Provide and How
they are Delivered
After a period of considering options to share professional services with Dunedin City, Council
has opted to grow its in-house resources to meet the increasing workload and rely less on
outsourcing.
2.7 Activity Programme Linkages
The table below shows how the problems identified will be addressed through the maintenance,
operations and renewals funding Work Categories (WC), to produce appropriate customer outcomes in
line with ONRC requirements.
Table 5: Activity Programme Linkages
Problems Identified Related ONRC Customer Key Components of the Programme that Address these
Outcomes Problems
Maintenance and Renewals Improvements
Operations
Better Travel Options: ACCESSIBILITY – Providing a WC111 – Sealed WC211 – Unsealed WC341 – Low
Inability to access, plan, transportation network that pavement maintenance road metaling Cost/Low Risk
fund and adapt to allows access for HCVs as well WC112 – Unsealed roads WC212 – Sealed road Improvements
changing environmental as appropriate wayfinding and maintenance resurfacing
and user demands, connectivity
WC113 – Drainage WC214 – Sealed road
constrains timely SAFETY - Maintaining the maintenance pavement
investment in a fit for road and roadsides in such a rehabilitation
purpose transport system WC122 – Traffic services
way as to ensure that people maintenance
now and in the future feel safe driving them
WC151 – Network and
Asset Management
Safety: Inconsistent SAFETY – Reducing numbers WC111 – Sealed WC211 – Unsealed WC341 – Low
attitudes and behaviours, of Fatal and serious crashes pavement maintenance road metaling Cost/Low Risk
and variable network SAFETY - Maintaining the WC112 – Unsealed roads WC212 – Sealed road Improvements
design and quality results road and roadsides in such a maintenance resurfacing
in deaths and serious way as to ensure that people WC113 – Drainage WC214 – Sealed road
injuries, congestion and feel safe driving them maintenance pavement
low confidence to use rehabilitation
alternative transport WC122 – Traffic services
maintenance WC222 -Traffic
modes
Services Renewals
Resilience and Better RESILIENCE – Limiting WC113 – Drainage WC213 – Drainage WC341 – Low
Freight Connections: disruption to traffic affected by Maintenance Renewals Cost/Low Risk
Parts of the network and unplanned events and the WC121 – Environmental WC221 – Improvements
service infrastructure lack impacts of closures that occur Maintenance Environmental
resilience and are renewals
WC141 – Emergency
vulnerable to disruption works
due to adverse events,
resulting in economic and WC151 – Network and
Asset Management
social disruption
ACCESSIBILITY – WC114 – Structures WC215 – Structures WC341 – Low
Providing a transportation Maintenance Component Cost/Low Risk
network that allows access for WC151 – Network and Replacement Improvements
HCVs (including 50Max Asset Management WC216 Bridge
vehicles) via key road transport Renewals
links
An important factor in the delivery of the maintenance, operations and renewals programmes will be
ensuring these activities are prioritised and optimised across the different road classifications and key
transport routes. This should ultimately facilitate cost-savings by adjusting the Levels of Service
across different ONRC. We aim to achieve this by:
• Ensuring funding requests are prioritised by ONRC where appropriate.
• Determining optimal timing of renewal treatments, which may mean ‘sweating’ the asset more
on lower classification roads.
• Ensuring that risk and consequence are proactively managed on higher classification roads and
identifying opportunities to accept more risk and consequence on lower classification roads.
WAITAKI DISTRICT COUNCIL
March 2021 Page B-15Part B: Activity Management Plan - Levels of Service and
Performance
3 Levels of Service and Performance
3.1 Customer Consultation and Expectations
Expectations in the community are very important in determining future levels of service and in
assessing how well Council is performing with respect to current levels of service.
The Council’s knowledge of customer expectations and preferences is based on:
• Public meetings;
• Feedback from elected members, advisory groups and working parties;
• Analysis of customer service requests and complaints;
• Annual community surveys
• Consultation via the 10-year Waitaki Long Term Plan and each year through the Annual Plan
process.
Council maintains a Customer Request Management System (CRM) database of customer comments
and requests. The CRM system and district surveys provide useful information on customer
satisfaction, expectations, and preferences relating to transportation services.
The most focused consultation is when Council discusses a proposal to provide new projects such as
seal extension, major safety, urban reconstruction or roading policies. The community involved is
consulted prior to adoption of policies and Strategies by Council. In the case of construction, Council
consults directly with affected parties and pro-actively ensures the public are informed through media
releases. This consultation includes those landowners directly affected by fence or access
relocations.
Council has consulted with the community about a range of specific roading issues. This provided a
focussed opportunity for the community to discuss its priorities for the land transport activity. Recent
significant consultation for the roading activity includes:
• The network hierarchy completed in 2008 will ultimately be replaced by One Network Road
Classification and One Network Framework once the road hierarchy in the current District Plan
review has been completed
• The extent of the network policy; revised and adopted by Council in 2012
• Development contributions updated for the 2021/31 LTP
• Seal widths and seal extensions policy revised and adopted by Council in 2008 and reaffirmed
in 2018
• Speed limits and Roading Bylaw review have been completed in 2020 and new Council
approved speed limits are due in implementation
• Consultation of Roading Improvements in 2017 for inclusion in the 2018-21 Regional Land
Transport Plan
• Review of Roading Policies in 2020/21
The legal requirements for consultation and a list of stakeholders is detailed in Local Government Act
2002 and its amendments.
3.1.1 Customer Satisfaction Surveys
Each year Council surveys residents through its customer satisfaction survey. These surveys
provide insight into the current customer expectations regarding the delivery of the land
transport activity. Since 2011, customer survey results have dropped markedly to an average of
32% for satisfied and very satisfied. The sealed and unsealed roading networks are
consistently the worst performing service areas in this annual survey, although slow
improvement:
WAITAKI DISTRICT COUNCIL
March 2021 Page B-16Part B: Activity Management Plan - Levels of Service and
Performance
Figure 9: WDC Customer Satisfaction Survey Results
Residents in Oamaru and Corriadale (higher volume & urban networks) are more likely to be
satisfied than those in Waihemo and Ahuriri (more remote, lower volume networks), and this
gap is growing:
Figure 10: Roading Customer Satisfaction Splits
This trend reflects the impact of implementing the ONRC in our maintenance programmes and
prioritisation processes and is an intended outcome of Waka Kotahi.
Some of the main issues highlighted in the latest 2020 customer satisfaction survey include:
• roads are rough and bumpy/uneven
• roads in poor condition, and there is a lack of maintenance
Sealed Roads • poor quality work, materials and patching is an issue
• Safety concerns - roads are too narrow & slippery
• Roads need widening
• roads in poor condition, and there is a lack maintenance
• roads have potholes, are rough, bumpy or uneven
Unsealed Roads
• roads suffer poor quality of work, need patching
• Safety Concerns - roads are too narrow
Figure 11: Main Roading Issues from Customer Feedback
WAITAKI DISTRICT COUNCIL
March 2021 Page B-17Part B: Activity Management Plan - Levels of Service and
Performance
This consultation provides good insight into the priorities of the community which need to be
considered when developing appropriate levels of service. However, as WDC is faced with
funding constraints, it must balance the needs of the community with its ability to pay for those
needs. The focus must be on maximising value for money whilst ensuring that the adopted
levels of service are appropriate and achievable given the reduced funding environment.
3.2 Current Performance, Levels of Service (LoS)
3.2.1 Mandatory Measures
DIA Mandatory Measures are reported on through the Long-Term Plan and Annual Reports.
Performance against these and other key Council measures against target for the last three
years is detailed below. The highlighted red, yellow and green cells indicate where Council has
performed worse or better than target. Red = worse, yellow = on/close to target, green = better
3.2.2 ONRC
ONRC LoS and performance measures are reported on through the Road Efficiency Group’s
(REG’s) Performance Measures Reporting Tool (PMRT). Reporting is completed both
individually for each Road Controlling Authority (RCA) and on a comparison basis against a
Peer Group of other similar RCAs. This reporting is summarised in the REG TA report (refer to
Appendix A), but is included here in tabular format with commentary on LoS gaps.
• The highlighted red, yellow and green cells indicate where Council is worse or better
compared to the peer group. Red = worse, yellow = average, green = better.
• Where no data has been collected for a particular performance measure, this is indicated
as Not Yet Assessed.
• Where there is no peer group comparison reporting available from the PMRT this is
represented with N/A (Not Applicable).
WAITAKI DISTRICT COUNCIL
March 2021 Page B-18Part B: Activity Management Plan - Levels of Service and Performance
Table 6: DIA Performance Measures & Results
Customer Asset Performance Measure Target 2017/18 2018/19 2019/20
Outcomes
*DIA mandatory measure, Road Safety: The change from the previous financial year in the number of Change is less than
Safety Network -1 -3 +2
fatalities and serious injury crashes on the local road network, expressed as a number or equal to 0
*DIA mandatory measure, Condition of footpaths: The percentage of footpaths in average condition or Not Not
Footpaths ≥ 96% measured
94% measured
Reliability / better (measured against WDC condition standards)
Quality *DIA mandatory measure, Average quality of ride on a sealed local road network: measured by
Sealed Roads ≥ 90% 92% 93% 91%
smooth travel exposure (average for total sealed roading network)
*DIA mandatory measure, Condition of sealed road network: The percentage of the sealed local road As programmed –
Sealed Roads 8% 5.8% 7.9%
Financial network that is resurfaced annually (by area). 7.5% per year
sustainability *DIA mandatory measure, Response to service requests: Percentage of customer service requests
Network ≥ 90% No data No data 87%
responded to within 5 days
Table 7: REG Performance Measures & Results
Council Current (19/20) Performance
ONRC Performance Measures
Urban Rural Combined Comments / LoS Gaps
Type No. Name PC SC Ac LV PC SC Ac LV PC SC Ac LV
The No. of Deaths and Increasing trend, especially
SCO1 Serious Injuries (DSI's) on 2 3 - - -→ 3 4 - 2 6 4 - on secondary collector roads
the network
Collective Risk (DSI rate per 0.051 0.027 0.012 0.005 0.030 0.012
SCO2 - 0.010 0.005 0.002 0.006 0.003
kilometre) → → →
Personal risk (DSI rate per 4.69 7.52 12.84 15.95 4.36
SCO3 - 6.70 12.18 33.11 6.92 12.30 29.18
kilometre) →
STO1 Permanent Hazards No data No data No data Additional staff required and
SAFETY
proposed in WC 151 for the
STO2 Temporary Hazards No data No data No data
development and collection
Sight Distances No data No data of data for ONRC
STO3 No data
Input Measures
Loss of Control on wet road Decreasing trend in
STO4 DSI's -→ -→ -→ -→ -→ - -→ - -→ - -→ - secondary and low volume
roads – zero in 2019/2020
Loss of driver control at Decreasing trend in
STO5 night DSI's -→ -→ -→ -→ -→ - -→ - -→ - -→ - secondary and low volume
roads – zero in 2019/2020
WAITAKI DISTRICT COUNCIL
March 2021 Page B-19Part B: Activity Management Plan - Levels of Service and Performance
Council Current (19/20) Performance
ONRC Performance Measures
Urban Rural Combined Comments / LoS Gaps
Type No. Name PC SC Ac LV PC SC Ac LV PC SC Ac LV
Intersection DSI's Increasing trend in
secondary collector roads
STO6 - 1 -→ - -→ - 1 -→ - 1 1 -
and decreasing trends in
Access roads.
STO7 Hazardous Faults No data No data No data Additional staff required and
proposed in WC 151 for the
Cycle Path Faults No data No data
development and collection
STO8 No data of data for ONRC
Input Measures
Data for 2019/2020 is not
STO9 Vulnerable user DSI's - - - - -→ - -→ -→ - - - -
available
Roadside Obstructions No data No data No data Additional staff required and
proposed in WC 151 for the
STO10 development and collection
of data for ONRC
Input Measures
Smooth Travel Exposure Deteriorating trend on urban
AMCO1 89 80 71 84 88 97 96 → 92 89 92 90 87
(STE) % network
Peak Roughness - 85th 130.8 134.5 134.0
AMCO2 173 166 → 155 98 112 → 119 113 125 → 139
%ile
Peak Roughness - 95th 130.8 134.5
AMCO2 173 166 155 98 112 119 134 113 125 137
%ile
Amenity
The median Roughness of
AMTO1 94 117 121 113 84 69 77 84 85 73 83 92
your Roads (95TH %ile)
The Average Roughness of
AMTO1 94 124 126 119 95 73 82 90 94 81 89 101
your roads
Aesthetic Faults Additional staff required and
proposed in WC 151 for the
AMTO2 No data No data No data development and collection
of data for ONRC
Input Measures
% of network not available Additional staff required and
essi
Acc
bilit
ACCO1 No data No data No data
y
to Class 1 HCV proposed in WC 151 for the
WAITAKI DISTRICT COUNCIL
March 2021 Page B-20Part B: Activity Management Plan - Levels of Service and Performance
Council Current (19/20) Performance
ONRC Performance Measures
Urban Rural Combined Comments / LoS Gaps
Type No. Name PC SC Ac LV PC SC Ac LV PC SC Ac LV
development and collection
of data for ONRC
Input Measures
Additional staff required and
proposed in WC 151 for the
No. of instances markings
ACTO1 No data No data No data development and collection
are NC with TCD/MOTSAM
of data for ONRC
Input Measures
No. of journeys impacted by Additional staff required and
RCO1 No data No data No data
unplanned events proposed in WC 151 for the
development and collection
No. of instances where road of data for ONRC
RCO2 No data No data No data
Resilience
access is lost Input Measures
Additional staff required and
proposed in WC 151 for the
Throughput at indicator
TTR1 No data No data No data development and collection
sites
of data for ONRC
Input Measures
Pavement Rehabilitation Data to be sourced from
CE1 No data No data No data
Cost ($) ONRC Data Quality Reports
Pavement Rehabilitation Data to be sourced from
CE1 No data No data No data
Average life achieved ONRC Data Quality Reports
Cost is lower – data not
Chipseal resurfacing cost 40,106 49,703 58,485 337,512 427,300 138,370 377,618 477,003 196,855
CE2 - - - available for Primary
Cost Efficiency
($)
collector
Chipseal resurfacing 10.8 10.8 10.8
CE2 13.7 13.9 16.7 14.2 15.9 14.6 14 15.1 15.8
Average Life achieved
Data to be sourced from
CE3 Asphalt resurfacing cost ($) - - - - - - - - - - - -
ONRC Data Quality Reports
Asphalt resurfacing Average
CE3 6.1 8.7 7.6 7.3 - 25.2 - - 6.1 16.9 7.6 7.3
life achieved
CE4 Unsealed Metalling Cost ($) No data No data No data
WAITAKI DISTRICT COUNCIL
March 2021 Page B-21You can also read