Property Activity Management Plan 2021-2051 - Tasman ...
←
→
Page content transcription
If your browser does not render page correctly, please read the page content below
Property Activity Management Plan 2021-2051
Quality Assurance Statement

                                Version:                         February March 2021

                                                                 Draft for Consultation for
  Tasman District Council       Status:
                                                                 Approval

  189 Queen Street
  Private Bag 4                 Project Manager:                 Mark Johannsen

  Richmond 7050
  Telephone: (03) 543 8400      Prepared by:
                                AMP Author                       Martin Sutton

                                Approved for issue by:
                                Corporate and Governance
                                                                 Mike Drummond
                                Services Manager

PAGE 2                                                   PROPERTY ACTIVITY MANAGEMENT PLAN
Contents
       Executive Summary ...................................................................................................... 4

       Introduction ................................................................................................................... 7

       Strategic Direction ........................................................................................................ 9

       Key Linkages................................................................................................................ 14

       Levels of Service .......................................................................................................... 16

       Our Customers and Stakeholders ............................................................................ 2019

       Current and Future Demand .................................................................................... 2322

       Lifecycle Management ............................................................................................2625

       Financials ................................................................................................................. 3331

       Sustainability ........................................................................................................... 3735

       Risk Management and Assumptions ........................................................................ 4139

       Asset Management Processes and Practices ...........................................................5048

Appendix A: Detailed Operating Budgets ........................................................................ 5654

Appendix B: Detailed Capital Budgets ............................................................................. 5957

Appendix C: Property Assets ............................................................................................ 6159
Executive Summary
1.1      What We Do
The Property activity encompasses the provision and maintenance of the Council administration
offices and libraries at Richmond, Motueka, Takaka and Murchison, plus the Council property assets,
which are not associated with any other Activity Management Plan (AMP).

Other Council properties are associated with their respective Activity Management Plans. E.g. halls
and recreation centres are part of the Community Facilities AMP, and water treatment buildings are
part of the Water AMP. This AMP includes the properties associated with libraries but does not
include the Libraries activity which has its own AMP.

1.2      Why We Do It
The Council is the owner or custodian of a substantial property portfolio. It has identified the need
for quality property services and professional expertise within the Council, to meet its ongoing
property requirements. Property has a public value and the Council’s ownership and management
ensures the assets are retained for the community.

The property activity is treated as a Council overhead. Direct costs identified for a specific Council
activity is allocated to those activities accounts.

  To provide management of the Council property assets that contributes toward the enhancement of our
  District, at the level of service that the customer wants, and is prepared to pay for and in a manner, which
  minimises conflict with the community.

1.3      Levels of Service
The Council aims to provide the following levels of service for the Property activity:

                                                                                 Property and building assets
   All Council-owned buildings            All Council-owned buildings            are functionality appropriate
   are safe.                              are fit-for-purpose.                   and meet the needs of users
                                                                                 and customers.

   Leases and licenses for the
                                          Management systems and
   Council properties are                                                        Site health and safety is
                                          strategic planning are up-to-
   current and reviewed on                                                       managed effectively.
                                          date.
   time.

For the duration of this AMP, the Council will focus on maintaining existing levels of service and is
not planning to make a significant investment in improvements. For further detail, including
measures and targets for the levels of service, refer to Section 5.

1.4      Key Issues
The most important issues relating to the activity are shown below in Table 1Table 1.

PAGE 4                                                             PROPERTY ACTIVITY MANAGEMENT PLAN
Table 1: Key Issues
Key Issue Discussion
Community satisfaction The Council will ensure that its operational properties continue to
satisfy the requirements of the community and tenants.
Value to the community The Council will ensure that its properties are managed in an efficient,
economic and effective manner.
1.5 Operational Programme
The operational programme covers all daily activities that are required to manage the activity. We
will spend approximately $11 million over the next ten years to operate and maintain our properties
efficiently.
Our operational programme over the next ten years covers the following key aspects and annual
expenditure:
Maintenance (routine and reactive) $3,127,000
Cleaning $3,419,000
Rates and Insurance $1,087,000
1.6 Capital Programme
We plan to invest approximately $7.7 million, over the next ten years to address the key issues.
There are no major projects planned save for a provisional sum for addressing our Richmond office
accommodation. A strategic taskforce was established in 2021 to analyse our future needs and to
develop a solution. That solution may involve leasing, rather than owning Council offices so no
provision has been made in the current capital budget for a replacement of the Richmond Offices.
1.7 Key Changes
There have been no major changes in this activity since the previous 2018 AMP.
1.8 Key Risks and Assumptions
The Council has made a number of assumptions in preparing this AMP. The most significant
assumptions for this activity are:
1.8.1 Timing
The timing of many projects can be well defined and accurately forecast because there are few
limitations on the implementation, other than community approval through the Long Term Plan
(LTP) /Annual Plan (AP) processes. However, the timing of some projects is highly dependent on
some factors, which are beyond the Council’s ability to fully control such as funding approvals,
subsidies, securing the land etc.
PAGE 5 PROPERTY ACTIVITY MANAGEMENT PLAN1.8.2 Funding When forecasting projects that will not occur for a number of years, a number of assumptions have to be made about how the project will be funded. Examples of this are the qualification for subsidies, community funding, development contributions etc. The correctness of these assumptions has major consequences especially on the affordability of new projects. The Council has considered each new project and concluded a funding strategy for each. The funding strategy will form one part of the consultation process as these projects are advanced toward construction. 1.8.3 Accuracy of Budgets The financial forecasts have been estimated from the best available knowledge. The level of uncertainty inherent in each project is different depending on how much work has been done in defining the problem and determining a solution. 1.8.4 Land Availability The Council has assumed that it will be able to purchase land, and/or secure access to land to complete projects within reasonable timeframes. 1.8.5 Main Office Replacement We are assuming that we will not own the Richmond Office main building and therefore do not expect to incur earthquake-strengthening costs, and have not budgeted for these in the LTP. The reasons for making this assumption are that based on known earthquake strengthening cost information, we will rebuild a new building on the current site or will have moved to an alternative site and disposed of the current site. PAGE 6 PROPERTY ACTIVITY MANAGEMENT PLAN
Introduction The purpose of this Activity Management Plan is to outline and to summarise in one place, the Council’s strategic management and long-term approach for the provision and maintenance of its property activity. 2.1 Rationale for Council Involvement The Council owns, manages and maintains buildings and property assets within the district, which support the Council and community activities. This includes libraries and administration offices, community fire stations and property assets, which are not associated with any other AMP, such as residential houses on land purchased for future infrastructure improvements. The AMP demonstrates responsible management of the District’s property activity on behalf of customers and stakeholders. It assists with the achievement of strategic goals and statutory compliance and ensures that the levels of service required by customers are provided at the lowest long-term cost to the community. 2.2 Description of Assets and Services The Council property assets covered under this AMP comprise: Office accommodation including service centres Libraries Property Services also manage the maintenance and facilities management of community buildings covered in separate AMPs. A list of the property assets is attached as Appendix C. 2.2.1 Main Richmond Office The main Council office complex comprises five structures, which are interconnected. The oldest was constructed in 1962 and was seismically strengthened to 80% NBS in 2012. Detailed structural assessments were made in 2020, based on the latest engineering standards. These have assessed the civic area at
2.2.4 Motueka Library
The Motueka Library no longer satisfies the requirements of the community, due to space
requirements and a lack of car parking. It has a seismic capacity of
Strategic Direction
The Council proposes to continue to maintain its buildings to be safe and fit-for-purpose. We will
review buildings that do not meet operational or community needs and provide a business case to
support the future needs of the activity.

3.1      Our Goal
   To have a portfolio of safe, compliant and functional buildings.

3.2      Contribution to Community Outcomes
Table 2 summarises how Property activity contributes to the achievement of the Council’s
Community Outcomes.
Table 2: Community Outcomes

                                    Does Our
                                    Activity
   Community Outcomes               Contribute to          Discussion
                                    the Community
                                    Outcome

   Our unique natural
                                                           All Property assets can be managed so that the
   environment is healthy,
                                    Yes                    impacts of any effects do not affect the health and
   protected and sustainably
                                                           cleanliness of the receiving environment.
   managed.

   Our urban and rural                                     The Property activity can be managed so that the
   environments are people-                                impact of any property development upon the
   friendly, well planned,          Yes                    environment is minimised and any future
   accessible and                                          developments have environmental sustainability as
   sustainably managed.                                    an expectation.

   Our infrastructure is
                                                           Our offices and libraries will be accessible for persons
   efficient, cost-effective
                                    Yes                    with disabilities and will provide a safe and
   and meets current and
                                                           welcoming environment.
   future needs.

   Our communities are
                                                           Our buildings provide a healthy and safe
   healthy, safe, inclusive         Yes
                                                           environment for users.
   and resilient.

   Our communities have
   opportunities to
   celebrate and explore            No                     Covered in other AMPs
   their heritage, identity
   and creativity.

PAGE 9                                                            PROPERTY ACTIVITY MANAGEMENT PLAN
Does Our
Activity
Community Outcomes Contribute to Discussion
the Community
Outcome
Our communities have
access to a range of
social, cultural,
No Covered in other AMPs
educational and
recreational facilities and
activities.
Our Council provides
leadership and fosters
partnerships, a regional No
perspective, and
community engagement.
Our region is supported
by an innovative and No
sustainable economy.
3.1 Financial Strategy
The Financial Strategy outlines the Council’s financial vision for the next 10 to 20 years and the
impacts on rates, debt, levels of service and investments. It guides the Council’s future funding
decisions and, along with the Infrastructure Strategy, informs the capital and operational spending
for the Long Term Plan 2021-2031.
Over the next 10 years, forecast rate income increases and debt levels are projected to be very near
the Council’s limits. The Council has had to work hard to prioritise and plan a work programme,
which addresses the most pressing key issues while staying within these limits. This means there is
very little scope to add further work to the programme within the next five years.
3.2 Key Issues
Table 3: Key Issues
Key Issue Discussion
Community satisfaction The Council will ensure that its operational properties continue to
satisfy the requirements of the community and tenants.
Value to the community The Council will ensure that its properties are managed in an efficient,
economic and effective manner.
PAGE 10 PROPERTY ACTIVITY MANAGEMENT PLAN3.3 Prioritisation
The Council provides many services on behalf of Tasman's residents and there are often competing
demands for the Council's investment across and within these services. The Council needs to decide
how much, and when, to invest in these services in a way that maintains affordability for customers
and ratepayers.
There are multiple factors that affect the priority of individual projects or work streams. These
include:
The need to protect public health and safety
The need to conserve and enhance the natural environment
Statutory compliance
Meeting the needs of tomorrow’s population
Readiness to implement works
Co-funding opportunities
Creating functional and attractive public places
Benefits and risks
District distribution
Strategic fit
The Council has applied the following principles when developing its programme of works:
To continue to meet its fiscal prudence, sustainability and environmental sustainability
obligations.
To keep the medium to long term in focus i.e. rather than being overly diverted by the shorter-
term recovery from the Covid-19 pandemic.
To understand the trade-offs or benefits across all of the well-being domains (social,
environmental, economic and cultural).
To capitalise on the economic environment (i.e. enhanced borrowing terms, and increased
labour and skills availability).
To make the most of the enhanced opportunities of Government funding, subsidies and other
incentives to advance the community outcomes.
To right-size the Council staffing and operational expenditure.
The Council has taken all of the above into consideration, in order to present a programme that is
achievable and affordable. Generally, mandatory requirements such as statutory compliance take
priority, and discretionary activities have been programmed second to this.
PAGE 11 PROPERTY ACTIVITY MANAGEMENT PLAN3.4 Climate Change
In 2019, the Council adopted the 'Tasman Climate Action Plan' (Action Plan). The Action Plan is the
Council’s initial response to the urgent need to take action on climate change, to build climate
resilience and reduce greenhouse gas emissions.
The Action Plan sets out goals, targets and actions relating to three key themes:
Mitigation – how we can reduce greenhouse gas emissions from the Council’s activities.
Adaptation – ways we can respond to our changing environment, including positive
opportunities.
Leadership – how we can lead by example, advocate and encourage others to take action.
The following goals are the long-term aspirations of the Council. They represent the first step
towards a cohesive package of activities that address climate change issues.
The Council contribute to New Zealand’s efforts to reduce greenhouse gas emissions (including
net carbon emissions).
The Tasman District becomes more resilient to the impacts of climate change.
The Tasman Community is informed of climate change actions and options for response.
The Council shows clear leadership on climate change issues.
Goals will be measured against targets, and achieved by implementing the actions set out in the
Action Plan. Targets and actions of direct relevance to this activity are listed below. Several other
actions are also relevant (e.g. those relating to information provision and leadership goals) - see the
online version of the Action Plan for details: www.tasman.govt.nz/climate-change.
PAGE 12 PROPERTY ACTIVITY MANAGEMENT PLANTable 4: Relevant targets and actions from the Tasman Climate Action Plan (2019)
Goal Targets Actions (short-term) Actions (medium-term) 2021 - 2024 Actions (long-term) 2024+
2019 - 2021
The Council contributes to New 1(i) The Council's emissions* of methane reduce by 10% below 2017 levels (ii) Identify and prioritise activities to reduce emissions (iii) Implement emissions reduction (iv) Implement emissions
Zealand’s efforts to reduce by 2030 and 47% by 2050 or earlier. The Council's net emissions* of all from the Council offices (e.g., refrigeration emissions programme. reduction programme.
greenhouse gas emissions other greenhouse gases reduce to zero by 2050. *from the Council's own from air conditioning, reduce travel by holding virtual
(including net carbon emissions). activities. Targets are based on Zero Carbon Bill. If necessary, revise meetings, working from home etc.)
targets once enacted.
(v) Investigate energy efficient design and renewable (vi) Implement energy efficiency and (vii) Monitor technology for
energy options for the Council’s buildings. renewable energy generation actions improvements to energy
(e.g. solar panel installation on the efficiency and implement these
Council’s buildings etc.). where feasible.
PAGE 13 PROPERTY ACTIVITY MANAGEMENT PLANKey Linkages
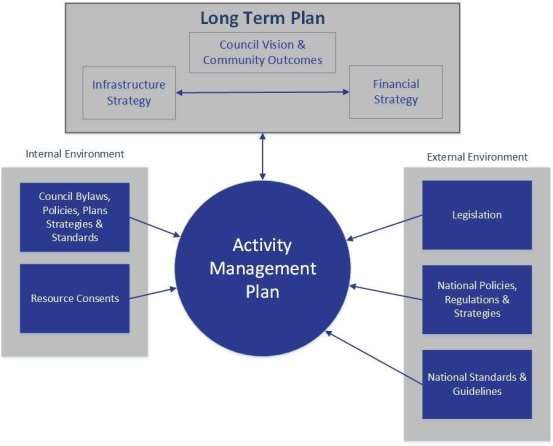
There are multiple factors that influence how the Council manages this activity. They can be internal
or external and include legislation, policies, regulations, strategies and standards. This section
summarises these key linkages.
4.1 Overview
Figure 1: How the Property Activity relates to other documents
4.2 Key Legislation
The Acts below are listed by their original title for simplicity, however, all Amendment Acts shall be
considered in conjunction with the original Act, these have not been detailed in this document. For
the latest Act information, refer to http://www.legislation.govt.nz/.
Table 5: Key Legislation
Legislation Affect on the River Activity
The Local Government Provides a framework and powers for local authorities to decide which
Act 1974 and 2002 activities they undertake, and the manner in which they will undertake
them.
PAGE 14 PROPERTY ACTIVITY MANAGEMENT PLANLegislation Affect on the River Activity
The Civil Defence and This Act requires that a risk management approach be taken when dealing
Emergency with hazards. In considering the risks associated with a particular hazard,
Management Act 2002 both, the likelihood of the event, occurring and its consequences must be
considered. As part of the comprehensive approach to Civil Defence
Emergency Management, all hazards, not only natural hazards, must be
taken into consideration.
Fire Service Act 1975 Relates to the protection of life and property from fire.
Health and Safety in Relates to the health and safety of employees and other people at work or
Employment Act 2015 affected by the work of other people.
Climate Change Provides for the implementation, operation, and administration of a
Response Act 2002 greenhouse gas emissions trading scheme in New Zealand that supports
and encourages global efforts to reduce the emission of greenhouse gases.
Te Tiriti o Waitangi – The Treaty of Waitangi is an agreement between Māori and the Crown.
Treaty of Waitangi Under Section 4 of the Local Government Act 2002, local authorities are
required to ‘recognise and respect the Crown’s responsibility to take
appropriate account of the principles of the Treaty of Waitangi, and to
maintain and improve opportunities for Māori to contribute to local
government decision-making processes’. Further sections of the Act,
particularly 77 and 81, detail the scale of the requirement for local
authorities to seek contributions and involvement from Māori in
consultation and decision-making processes.
Provides timelines and responsibilities for assessing and remediating
Building Act 2014
earthquake-prone buildings.
4.3 Key Planning, Policies and Strategies
Fire Safety and Evacuation of Buildings Regulations 1992.
Asbestos Management Procedure 2017.
Earthquake Prone, Dangerous, and Insanitary Buildings Policy 2006.
4.4 Bylaws
The following bylaw is of relevance to the activity:
Trade Waste Bylaw 2005.
PAGE 15 PROPERTY ACTIVITY MANAGEMENT PLANLevels of Service
A key objective of this plan is to match the levels of service provided by the activity with the agreed
expectations of our customers and their willingness to pay for that level of service. These levels of
service provide the basis for the lifecycle management strategies and works programmes identified
in this Plan.
Levels of service are attributes that the Council expects of its assets to deliver the required services
to stakeholders (e.g. other Council departments and lessees).
A key objective of this plan is to clarify and define the levels of service for property assets and the
property activity and then identify and cost future operations, maintenance, renewal and
development works required of these assets to deliver that service level. This requires converting
building and property use needs and other department’s expectations and preferences into
meaningful levels of service.
Levels of service can be strategic, tactical or operational, should reflect the current industry
standards, and should be based on:
Customer Research and Expectations: information gained from stakeholders on expected
types and quality of service provided.
Statutory Requirements: Legislation, regulations, environmental standards and the Council
bylaws that impact on the way assets are managed (e.g., resource consents, building
regulations, health and safety legislation). These requirements set the minimum level of service
to be provided.
Strategic and Corporate Goals: Provide guidelines for the scope of current and future services
offered and manner of service delivery, and define specific levels of service, which the
organisation wishes to achieve.
Best Practices and Standards: Specify the design and construction requirements to meet the
levels of service and needs of stakeholders.
5.1 Our Levels of Service
Table 6 summarises the levels of service and performance measures for the Council Enterprises and
Property activity. Blue shaded rows are the levels of service and performance measures to be
included in the Long Term Plan. Unshaded white rows are technical measures that are only included
in the Activity Management Plan.
5.2 Level of Service Performance and Analysis
Levels of service have been set to be realistic, appropriate for the function and measurable through
the Council systems.
Overall, no change in the levels of service will occur from existing levels.
PAGE 16 PROPERTY ACTIVITY MANAGEMENT PLANPAGE 17 PROPERTY ACTIVITY MANAGEMENT PLAN
Table 6: Levels of Service and Performance Measures

                                                                                                                     Future Performance Targets
 Levels of Service          Performance Measure            Current Performance               Year 1               Year 2           Year 3            Year 10
                                                                                             2021/22              2022/23          2023/24           2030/31

   All the Council-owned     All operational buildings      All buildings have a current      100%                 100%              100%             100%
   buildings are safe        (offices and libraries)        Warrant of Fitness.               compliance           compliance        compliance       compliance
                             comply with resource
                             and building consents
                             and any other legislative
                             requirements.

   All the Council-owned     All operational buildings      Service managers generally        80%                  80%               80%              85%
   buildings are fit-for-    (offices and libraries) are    confirm that buildings that
   purpose                   adequate for the service       they are responsible for
                             provision needs of the         meeting their service needs.
                             occupiers.

   Property and building     Customers and users are        Based on the 2019 annual          88% of               Not due to        Not due to       92% of
   assets that are           satisfied with the             residents` survey, at least       customers            being             being            customers
   functionality             buildings that they            87% of users were satisfied or    surveyed are         measured          measured         surveyed are
   appropriate and meet      occupy and the level of        very satisfied with the           satisfied or very                                       satisfied or very
   the needs of users and    service provided.              physical access, layout,          satisfied                                               satisfied
   customers.                                               ambience and maintenance
                             As measured by a three-
                                                            for various buildings.
                             yearly survey of selected
                             customers.

   Leases and licenses       Percentage of leases and       72% of leases and licences        80% of leases        85% of leases     90% of leases    100% of leases
   for the Council           licences for the Council       are current.                      and licences are     and licences      and licences     and licences are
   properties are current    properties that are                                              current              are current       are current      current
   and reviewed on time.     current (i.e. have not
                             expired).

PAGE 18                                                                                                                         PROPERTY ACTIVITY MANAGEMENT PLAN
Future Performance Targets
Levels of Service Performance Measure Current Performance Year 1 Year 2 Year 3 Year 10
2021/22 2022/23 2023/24 2030/31
Management systems Activity Management 100% compliance – all 100% 100% 100% 100%
and strategic planning Plan completed for building facilities are compliance compliance compliance compliance
are up-to-date. Property and the Council encompassed in an AMP
Enterprises.
Site health and safety 100% of site safety issues 100% compliance 100% 100% 100% 100%
is managed responded to within compliance compliance compliance compliance
effectively. required timeframes.
No serious harm 0 serious harm incidences 0 serious harm 0 serious 0 serious 0 serious harm
incidents are reported. incidences harm harm incidences
incidences incidences
Site health and safety All facilities that require 100% compliance 100% 100% 100% 100%
is managed them have a fire safety compliance compliance compliance compliance
effectively. plan, including
evacuation
Trial evacuation for each 100% compliance 100% 100% 100% 100%
facility with a fire plan compliance compliance compliance compliance
held six-monthly.
PAGE 19 PROPERTY ACTIVITY MANAGEMENT PLANOur Customers and Stakeholders The Council engages and consults with iwi partners, customers, and stakeholders to gain an understanding of their needs, expectations and preferences. This enables the Council to provide outcomes that meet the community’s needs. 6.1 Iwi Partners Māori are tangata whenua of Aotearoa / New Zealand. They have a long and rich association with Te Tauihu o te Waka-a-Māui (Te Tauihu) / the Top of the South Island. There are eight iwi that whakapapa and have Statutory Acknowledgements to places within Te Tauihu and Tasman District. They are represented by the following post-settlement governance entities: Ngāti Apa ki te Rā Tō Ngāti Koata Trust Te Rūnanga o Ngāti Kuia Trust Te Rūnanga a Rangitāne O Wairau Te Rūnanga o Ngāti Rārua Ngāti Tama ki te Waipounamu Trust Te Ātiawa o te Waka-a-Māui Te Rūnanga o Toa Rangatira Tasman District also covers the Northern-Western part of the Ngāi Tahu takiwā (tribal area/territory). Murchison is within the Ngāi Tahu takiwā and Ngāti Waewae is the Papatipu Rūnanga on this Northwestern side. Each iwi has its own unique history and association with places across Tasman District. These areas are not easily defined, and do not match, or stay entirely within the boundaries of the Tasman District. The Council staff aim to engage with iwi / Māori on matters that are of interest and importance to them. For the above projects, extra care will be taken to consider and apply the principles of the Tiriti o Waitangi / Treaty of Waitangi. The Council acknowledge that it is important to agree to the appropriate level of engagement with iwi / Māori at the outset of a project. This may range from informing through to opportunities for co-governance. More information about iwi of Te Tauihu can be found on the Council's website at https://www.tasman.govt.nz/my-region/iwi/ and their own websites and social media channels. PAGE 20 PROPERTY ACTIVITY MANAGEMENT PLAN
6.2 Stakeholders Many individuals and organisations have an interest in the management and/or operation of the Council’s assets and services. The Council has a Significance and Engagement Policy, which is designed to guide the expectations of the relationship between the Council and the Tasman community. The Council has made a promise to seek out opportunities to ensure the communities and people it represents, and provides services to have the opportunity to: Be fully informed Provide reasonable time for those participating to come to a view Listen to what they have to say with an open mind Acknowledge what we have been told and Inform contributors how their input influenced the decision the Council made or is contemplating. Engagement or consultation: Is about providing more than information or meeting a legal requirement Aids decision making Is about reaching a common understanding of issues Is about the quality of contact, not the amount and Is an opportunity for a fully informed community to contribute to decision-making. The key stakeholders, the Council consults with about the property activity are: Elected members (Community Board members) Regulatory (consent compliance, Public Health) Public Health Service (Nelson-Marlborough District Health Board) Heritage New Zealand Service providers/suppliers (Network Tasman, power companies) Affected or interested parties (when applying for resource consents) Neighbours. 6.3 Consultation The Council consults with the public to gain an understanding of customer expectations and preferences. This enables the Council to provide a level of service that better meets the Community’s needs. The Council’s knowledge of customer expectations and preferences is based on: Feedback from residents surveys Other customer/user surveys, such as Yardstick visitor measures Levels of service consultation on specific issues Feedback from staff customer contact PAGE 21 PROPERTY ACTIVITY MANAGEMENT PLAN
Ongoing staff liaison with community organisations, user groups and individuals Public meetings Feedback from elected members, advisory groups and working parties Analysis of customer service requests and complaints Consultation via the Annual Plan and Long-Term Plan processes. The Council commissions residents surveys on a regular basis to assess the levels of satisfaction with key services, including the provision of community facilities and the willingness across the community to pay to improve services. Other informal consultation is undertaken with community and stakeholder groups on an issue-by-issue basis, as required. PAGE 22 PROPERTY ACTIVITY MANAGEMENT PLAN
Current and Future Demand
The ability to predict future demand for services enables the Council to plan and identify the best
way of meeting that demand. That may be through a combination of demand management and
investing in improvements. This section provides an overview of key drivers of demand and what
demand management measures the Council has planned to implement.
7.1 Demand Drivers
Key activity drivers include the following factors:
population growth
ageing population
The Council prefers to own its offices and libraries
The Council will continue to provide offices and library services in Richmond, Murchison,
Golden Bay and Motueka.
7.2 Assessing Demand
7.2.1 Growth Model
Tasman District Council has developed a Growth Model to inform the Council planning to provide
for growth with sufficient infrastructure and zoned land in the right location at the right time. The
Growth Model is a District-wide, long term planning tool which is updated every three years to
inform the Long Term Plan. The Model provides 30-year projections of new residential dwellings and
new business properties, for 15 Settlement Areas and 5 Ward Remainder Areas.
The Long Term Plan 2021-2031 assumes that Tasman District’s population is projected to grow by
almost 20,000 between 2021 and 2051. This is based on the medium scenario of updated population
projections, which the Council commissioned in 2019 from Natalie Jackson Demographics Ltd.
The key demographic assumptions affecting future demand are:
Ongoing population growth over the next 30 years with the rate of growth slowing over time.
An ageing population, with population increases in residents aged 65 years and over.
A decline in average household size, mainly due to the ageing population with an increasing
number of people at older ages who are more likely to live in one or two-person households.
The overall population of Tasman is expected to increase by 7,700 residents between 2021 and
2031, to reach 64,300 (assuming the medium scenario). Most of the overall population growth
will be driven by net migration gains (more people moving to Tasman District than leaving).
Under the medium scenario, all age groups in Tasman are projected to experience growth. However,
the highest growth continues to be in the 65+ age group, whose proportion is projected to increase
from 21% in 2018 to 34% in 2048. The ageing population is driving a change in the average
household size, projected to decrease from 2.5 residents per household in 2018 to 2.4 in 2028 and
2.3 in 2038. The number of one-person households and couple-without-children households are
projected to increase.
PAGE 23 PROPERTY ACTIVITY MANAGEMENT PLAN7.2.2 Changes in Technology
Changes in the technology used in the systems to manage facility assets and, in the systems
affecting the delivery of services have an effect on the demand and the use of the assets. Significant
changes in technology identified are:
Wireless networks (impact on cabling and inbuilt systems within facilities.
Environmental sustainability (changes in energy sources, technology and utilising lifecycle
costing analyses.
Heating, ventilation and air conditioning (HVAC) delivery systems, demand and customer
expectations and
Building Management systems
Improved energy efficiency, use of photovoltaic cells
Sustainability initiatives
Use of advanced GIS mapping and GPS to assist in planning and management of property
assets.
7.2.3 Workforce Planning
The Council assess its future office accommodation requirements based on a workforce planning
exercise. This approach uses a range of metrics that assist the Council in determining its likely future
workforce. This projection of the future workforce is used to aid in both assessing the property
requirements for office accommodation and in considering alternative work options.
7.3 Demand Management
7.3.1 Introduction to Demand Management
Demand management as a comprehensive, integrated and long-term approach seeks to improve
the standard of the facilities provided in this AMP and deliver services to match the needs of the
users on an affordable basis.
The Council works to provide facilities that are safe and accessible for staff and the public. Improving
our demand management will:
Provide better services in offices and libraries
Provide facilities for staff that enable them to work in better conditions and provide a platform
for efficiencies and productivity gains; and
Provide facilities that meet user requirements.
7.3.2 The Council’s Approach to Demand Management
The Council will implement the following demand management strategies for the provision and
rationalisation of property assets:
PAGE 24 PROPERTY ACTIVITY MANAGEMENT PLAN Community involvement: Involve property users in developing needs requirements through
consultation to ensure ‘fit for purpose’ buildings are created.
Strategic planning: The Council will monitor and assess changes in population structure and
preferences to enable provision to be related to varied and changing needs.
Multiple uses: The Council will actively promote the development of flexible, multi-use facilities
and the use of open space office environments.
Non-asset solutions: The Council will consider the advantages of leasing property instead of
purchasing or building and other options such as Remote working to reduce staff demand for
space; and
Fees and charges: To charge market rentals for the occupation of property and buildings unless
there are mitigating factors.
PAGE 25 PROPERTY ACTIVITY MANAGEMENT PLANLifecycle Management Lifecycle cost is the total cost to the Council of an asset throughout its life including, creation, operations and maintenance, renewal, and disposal. The Council aims to manage its assets in a way that optimises the balance of these costs. This section summarises how the Council plans to manage each part of the lifecycle for this activity. 8.1 Asset Condition and Performance 8.1.1 Asset Condition Overall, the condition of the Councils building portfolio is good and our buildings are generally fit-for purpose. All buildings have been inspected for seismic safety and remedial actions have been implemented. Some remedial actions will occur over the medium to long term as provided for with in statutory framework. 8.2 Operations and Maintenance 8.2.1 Key Maintenance and Operational Themes There are no major changes foreseen in the way properties will be managed over the next ten years. It is envisaged that the Council will continue to manage building operations in-house supported by local contractors and consultants. 8.2.2 Maintenance Contracts The asset management contracts applicable to this AMP include painting, electrical, fire alarm testing, fire protection, air conditioning, automatic door servicing, building maintenance, lock maintenance, closed circuit television cameras, lift maintenance and building compliance. Contracts or service agreements are in place with preferred suppliers which ensures a consistency of approach and the opportunity to build relationships with contractors. Facilities management contracts are in place for cleaning services and security. 8.2.3 Maintenance Strategies 8.2.3.1 Non-Scheduled Maintenance (Reactive) Non-scheduled maintenance encompasses callouts and reactive maintenance caused by vandalism and asset failures. 8.2.3.2 Scheduled / Cyclic Maintenance Scheduled or cyclic maintenance includes regular operating maintenance such as: Heating, ventilation and air conditioning systems Lift maintenance and inspections Fire protection services Cyclical cleaning Building Warrant of Fitness assessments; and PAGE 26 PROPERTY ACTIVITY MANAGEMENT PLAN
Maintenance of painted surfaces. PAGE 27 PROPERTY ACTIVITY MANAGEMENT PLAN
8.2.3.3 Planned Maintenance
Planned maintenance is the long-term planned items undertaken to maintain an asset to ensure it is
able to achieve its targeted useful life. This includes regular lifecycle asset management items, such
as full painting and carpet replacement etc.

Maintaining building components on a regular basis extends their life and provides better
knowledge of life expectancy. The improvement and updating of condition assessments will allow
more accurate replacement of components.

8.2.4 Forecast Operations and Maintenance Expenditure
The forecast operations and maintenance costs for the next 10 years are shown in Figure 2Figure 2.
The annual costs over the life of this plan are predicted to remain relatively constant for the
properties listed in this AMP, although this is dependent upon the completion and updating of
condition assessments.
 1,400,000

 1,200,000

 1,000,000

   800,000

   600,000

   400,000

   200,000

          0
              2031/32

              2043/44
              2021/22
              2022/23
              2023/24
              2024/25
              2025/26
              2026/27
              2027/28
              2028/29
              2029/30
              2030/31

              2032/33
              2033/34
              2034/35
              2035/36
              2036/37
              2037/38
              2038/39
              2039/40
              2040/41
              2041/42
              2042/43

              2044/45
              2045/46
              2046/47
              2047/48
              2048/49
              2049/50
              2050/51

Figure 2: Operations and Maintenance Expenditure Excluding Inflation

8.3     Asset Renewal/Replacement
8.3.1   Key Renewal Themes
The Council offices are maintained to a standard that allows staff working in those facilities to be
able to perform their functions in comfort with modern up-to-date features. Renewal projects are
estimated to be required every eight years.

The standards that we aspire to are based on the MBIE`s office best practice guidelines which relate
to best practice and workplace design for government office accommodation. We are transitioning
to these standards.

PAGE 28                                                      PROPERTY ACTIVITY MANAGEMENT PLAN
The standards for New Zealand Public Libraries are used as a guide to identify space requirements
for library renewals. Library statistics are maintained to compare current usage against previous
years plus identifying demand factors. Other standards are those, which relate to the Building Act
and Resource Management Act.
8.3.2 Renewal Strategies
Assets are considered for renewal when:
They near the end of their effective useful life
The cost of maintenance becomes uneconomical and the whole-of-life costs are less to renew
the asset than keep up maintenance
The risk of failure of critical assets is unacceptable.
The renewal programme has generally been developed by the following:
Taking asset age and remaining life predictions, calculating when the remaining life expires and
converting that into a programme of replacements based on valuation replacement costs.
Reviewing and justifying the renewals forecasts using the accumulated knowledge and
experience of asset operations and asset management staff. This incorporates the knowledge
gained from tracking asset failures and performance through the asset management system.
The renewal programme is reviewed in detail every three years and cross-referenced with other
activities to determine if other projects are occurring in the same location. Every year the
annual renewal programme is reviewed and planned with the input of the maintenance
contractor.
The renewals programme has been developed to ensure that our facilities continue to supply
services that meet the requirements of the users of those facilities. With heavy reliance on HVAC for
heating and cooling, funds have been set aside on a regular basis to ensure systems can be replaced
as required.
Currently the renewals programme is based on the asset manager’s knowledge of the property
assets in conjunction with the building occupiers, contractors and consultant’s inputs.
8.3.3 Delivery of Renewals
Suitably experienced contractors procured under the Councils Procurement Policy deliver renewals.
8.3.4 Deferred Renewals
Deferred renewal is the shortfall in renewals required to maintain the service potential of the assets.
This can include:
Renewal work that is scheduled but not performed when it should have been and which has
been put off for a later date (this can often be due to cost and affordability reasons).
An overall lack of investment in renewals that allows the asset to be consumed or run-down,
causing increasing maintenance and replacement expenditure for future communities.
PAGE 29 PROPERTY ACTIVITY MANAGEMENT PLAN60,000,000 Formatt
50,000,000
40,000,000
30,000,000
20,000,000
10,000,000
0
2029/30
2021/22
2022/23
2023/24
2024/25
2025/26
2026/27
2027/28
2028/29
2030/31
2031/32
2032/33
2033/34
2034/35
2035/36
2036/37
2037/38
2038/39
2039/40
2040/41
2041/42
2042/43
2043/44
2044/45
2045/46
2046/47
2047/48
2048/49
2049/50
2050/51
Cumulative Renewal Cumulative Depreciation
Figure 3
60,000,000
50,000,000
40,000,000
30,000,000
20,000,000
10,000,000
0
2029/30
2021/22
2022/23
2023/24
2024/25
2025/26
2026/27
2027/28
2028/29
2030/31
2031/32
2032/33
2033/34
2034/35
2035/36
2036/37
2037/38
2038/39
2039/40
2040/41
2041/42
2042/43
2043/44
2044/45
2045/46
2046/47
2047/48
2048/49
2049/50
2050/51 Cumulative Renewal Cumulative Depreciation
Figure 3 compares the Council’s cumulative renewal expenditure and cumulative depreciation for
this activity. If the renewals expenditure starts falling behind the accumulative depreciation it can
indicate that, the assets may not be being replaced or renewed at the rate at which they are being
consumed. If this continues unchecked for too long, future communities will inherit a rundown
asset, high maintenance costs and high capital costs to renew failing infrastructure.
When renewal work is deferred the impact of the deferral on economic inefficiencies and the
property`s ability to achieve the required service will be assessed. Although the deferral of some
renewal works may not impact significantly on the operation of the assets repeated deferral will
create a liability in the longer term.
PAGE 30 PROPERTY ACTIVITY MANAGEMENT PLANThe graph depicts that renewal expenditure falls away to less than the calculated depreciation
allowances. This is reflective of the stepped nature of renewal works for buildings. In addition,
depreciation rates are based on allowable financial asset provisions rather than reflecting the actual
physical condition of the component assets.
60,000,000
50,000,000
40,000,000
30,000,000
20,000,000
10,000,000
0
2029/30
2021/22
2022/23
2023/24
2024/25
2025/26
2026/27
2027/28
2028/29
2030/31
2031/32
2032/33
2033/34
2034/35
2035/36
2036/37
2037/38
2038/39
2039/40
2040/41
2041/42
2042/43
2043/44
2044/45
2045/46
2046/47
2047/48
2048/49
2049/50
2050/51
Cumulative Renewal Cumulative Depreciation
Figure 3: Cumulative Depreciation vs Renewal Including Inflation
8.3.5 Forecast Renewal Expenditure
2,500,000
2,000,000
1,500,000
1,000,000
500,000
0
2041/42
2044/45
2047/48
2050/51
2021/22
2022/23
2023/24
2024/25
2025/26
2026/27
2027/28
2028/29
2029/30
2030/31
2031/32
2032/33
2033/34
2034/35
2035/36
2036/37
2037/38
2038/39
2039/40
2040/41
2042/43
2043/44
2045/46
2046/47
2048/49
2049/50
Figure 4: Renewals Expenditure Excluding Inflation
8.4 Asset Development
New capital expenditure is used to create new assets, expand or upgrade existing assets, or increase
the capacity of existing assets beyond their original design capacity or service potential. This section
summarises future new capital work requirements for this activity. This AMP identifies the only
major expenditures in the next three years are for the Richmond Council Offices. There are no
taxation advantages to be enjoyed by the Council through not having ownership of its Property
Assets used for its offices and libraries and it is the Council’s preference to own these assets.
PAGE 31 PROPERTY ACTIVITY MANAGEMENT PLAN8.4.1 Key Asset Development Themes
The main drivers for property upgrades are:
Population growth and changing demographics requiring increased resources such as increased
library floor space. This in turn may create the need for additional staff resources.
As the population increases the demand for the Council’s services increases thus creating a
demand for additional workspace.
8.4.2 Key Projects to Support Increasing Levels of Service and Growth
The work projected for the Richmond Office is to enable reconfiguration of the ground floor for the
Council Chamber area to accommodate additional numbers of the community at the Council
meetings and to create open plan offices for the better space efficiency due to staff growth.
A strategic workplace taskforce has been established in 2021 to investigate the future requirements
for Richmond Office accommodation. This group will consider a wide range of issues including
national political directions, suitable office sites, buying verse leasing, potential colocation
opportunities and staff requirements.
8.4.3 Forecast New Capital Expenditure
12,000
10,000
8,000
6,000
4,000
2,000
0
2040/41
2021/22
2022/23
2023/24
2024/25
2025/26
2026/27
2027/28
2028/29
2029/30
2030/31
2031/32
2032/33
2033/34
2034/35
2035/36
2036/37
2037/38
2038/39
2039/40
2041/42
2042/43
2043/44
2044/45
2045/46
2046/47
2047/48
2048/49
2049/50
2050/51
LOS Growth
Figure 5: New Capital Expenditure Excluding Inflation
8.5 Asset Disposal
Where demand analysis identifies that a building is surplus to the Council and community
requirements, disposal options may be explored. Disposal of built assets generally only occurs when
they have reached the end of their useful life and/or are not considered safe for ongoing public use
and/or the cost of restoring a facility is not cost effective. Disposal options include removal from
site, demolition, subdivision and subsequent sale, and sale.
PAGE 32 PROPERTY ACTIVITY MANAGEMENT PLANThe Council has a policy on significance and engagement pursuant to Section 76AA of the Local Government Act 2002. This policy establishes criteria, which could be used to consider the level of significance of issues, proposals or decisions. The individual assets listed in this AMP are not defined as strategic assets, although a decision or proposal that affects the assets and activities within this AMP may be regarded as being highly significant if it meets certain criteria. In other cases, a decision or proposal may be considered of low or moderate significance. The Council has not signaled any intention of disposing of any land or facilities during the term of this AMP but will consider property disposal on a case-by-case basis as situations arise. PAGE 33 PROPERTY ACTIVITY MANAGEMENT PLAN
Financials
The Council has planned a prudent financial approach to managing its assets and services. This
section provides a summary of the total value of the activity and the investment that the Council has
planned to make over the next 30 years.

9.1       Funding Policy, Fees and Charges
The Property activity is currently funded through a mixture of the following sources shown in Figure
6 below:
                            4% 0% 3%
                                                                            Development or
                                                                            Financial Contributions

                                                                            Fees and Charges

                                                                            General Rates

      38%
                                                                            Debt

                                                                            Other

                                                       55%
                                                                            Subsidies and Grants

                                                                            Targeted Rates

Figure 6: Funding Sources

9.1.1     Financial/Development Contributions
There are no development contributions applicable to the Property activity. However, the Council
property developments may require the payment of Development Contributions for water,
wastewater, transportation or stormwater and will be required like other developers to pay the fees
specified in the Development Contributions Policy.

9.2       Asset Valuation and Depreciation
The Local Government Act 1974 and subsequent amendments contain a general requirement for
local authorities to comply with Generally Accepted Accounting Practice ("GAAP").

The Council requires its asset register and valuation to be updated in accordance with Financial
Reporting Standards and the AMP improvement plan.

The valuations summarised below have been completed in accordance with the following standards
and are suitable for inclusion in the financial statements for the year ending June 2018.

New Zealand International Public Sector Accounting Standard 17; Property, Plant and Equipment
(PBE IPSAS 17) and PBE IPSAS 21 (Impairment of Non-Cash Generating Assets)

PAGE 34                                                      PROPERTY ACTIVITY MANAGEMENT PLAN
9.2.1 Overview of Asset Valuations
The Property assets were last valued in June 2018. Key assumptions in assessing the asset valuations
are described in detail in the valuation report.
The information for valuing the assets was obtained from the Council’s asset registers, based on
excel spreadsheets. Economic lives and residual lives have been defined for all properties. As
structures near the end of their theoretical lives, minimum residual lives have been adopted to
reflect the remaining base value still existing prior to any renovation or upgrading. The asset-
depreciated value applying to each group of building assets is summarised in Table 7 below.
Table 7: Property Asset Valuation Summary (as at 30 June 2018)
Asset Depreciated Value
Asset-Buildings Only
($)
Housing 1,747,000
Libraries 6,907,000
Offices and Service Centres 11,759,000
TOTAL 20,403,000
9.3 Financial Summary
9.3.1 Funding Impact Statement
The Council’s Funding Impact Statement (FIS) does not apply to this activity as it is treated as an
overhead.
9.3.2 Project Drivers
All expenditure must be allocated against at least one of the following project drivers.
Operation and Maintenance: operational activities that do not involve the renewal or upgrade
of assets, or work that is necessary in order to provide on-going services at the agreed levels.
Renewals: significant work that restores or replaces an existing asset towards its original size,
condition or capacity.
Increase Level of Service: works to create a new asset, or to upgrade or improve an existing
asset, beyond its original capacity or performance.
Growth: works to create a new asset, or to upgrade or improve an existing asset, beyond its
original capacity or performance to provide for the anticipated demands of future growth.
This is necessary for two reasons as follows.
Schedule 13(1) (a) and section 106 of the Local Government Act requires the Council to identify
the total costs it expects to have to meet relating to increased demand resulting from growth
when intending to introduce a Development Contributions Policy.
Schedule 10(2)(1)(d)(l)-(iv) of the Local Government Act requires the Council to identify the
estimated costs of the provision of additional capacity and the division of these costs between
changes to demand for, or consumption of, the service, and changes to service provision levels
and standards.
PAGE 35 PROPERTY ACTIVITY MANAGEMENT PLANAll new works have been assessed against these project drivers. Some projects may be driven by a
combination of these factors and an assessment has been made of the proportion attributed to each
driver.
9.3.3 Total Expenditure
The estimated expenditure needs for the Property activity has been prepared for the next 10 years.
5,000,000
4,500,000
4,000,000
3,500,000
3,000,000
2,500,000
2,000,000
1,500,000
1,000,000
500,000
0
2021/22 2022/23 2023/24 2024/25 2025/26 2026/27 2027/28 2028/29 2029/30 2030/31
Year 1 Year 2 Year 3 Year 4 Year 5 Year 6 Year 7 Year 8 Year 9 Year 10
Opex Capex
Figure 7: Total Expenditure Year 1 to 10 Including Inflation
9.3.4 Total Income
The estimated income for the Property activity have been prepared for the next 10 years.
4,500,000
4,000,000
3,500,000
3,000,000
2,500,000
2,000,000
1,500,000
1,000,000
500,000
0
2021/22 2022/23 2023/24 2024/25 2025/26 2026/27 2027/28 2028/29 2029/30 2030/31
Year 1 Year 2 Year 3 Year 4 Year 5 Year 6 Year 7 Year 8 Year 9 Year 10
Rates Development or Financial Contributions Fees and Charges Other Subsidies and Grants
Figure 8: Total Income Year 1 to 10 Including Inflation
PAGE 36 PROPERTY ACTIVITY MANAGEMENT PLAN9.3.5 Operational Expenditure
The estimated operational expenditure for the Property activity has been prepared for the next 10
years.
3,000,000
2,500,000
2,000,000
1,500,000
1,000,000
500,000
0
2021/22 2022/23 2023/24 2024/25 2025/26 2026/27 2027/28 2028/29 2029/30 2030/31
Year 1 Year 2 Year 3 Year 4 Year 5 Year 6 Year 7 Year 8 Year 9 Year 10
Direct Indirect
Figure 9: Total Operational Expenditure Year 1 to 10 Including Inflation
9.3.6 Capital Expenditure
The estimated capital expenditure for the Property activity have been prepared for the next 10
years.
3,000,000
2,500,000
2,000,000
1,500,000
1,000,000
500,000
0
2021/22 2022/23 2023/24 2024/25 2025/26 2026/27 2027/28 2028/29 2029/30 2030/31
Year 1 Year 2 Year 3 Year 4 Year 5 Year 6 Year 7 Year 8 Year 9 Year 10
Renewal LOS Growth
Figure 10: Total Capital Expenditure Year 1 to 10 Including Inflation
PAGE 37 PROPERTY ACTIVITY MANAGEMENT PLANSustainability
Sustainability means that we effectively balance the needs of present and future communities. From
an asset management perspective, sustainability is critical, as many assets have a long lifespan and
must be ‘future-proofed’. The Council has a responsibility to manage this activity in a way that
supports the environmental, social, cultural and economic wellbeing of current and future
generations. This section focuses on social, cultural and environmental sustainability.
The Local Government Act 2002 requires local authorities to take a sustainable development
approach while conducting their business, taking into account the current and future needs of
communities for good-quality local infrastructure, and the efficient and effective delivery of
services.
Sustainable development is a fundamental philosophy that is embraced in the Council’s Vision,
Mission and Objectives, and is reflected in the Council’s community outcomes. The levels of service
and the performance measures that flow from these inherently incorporate the achievement of
sustainable outcomes
10.1 Negative Effects
Significant negative effects associated with the Property AMP include:
Table 8: Negative Effects
Effect Description Mitigation Measures
Cost of Economic – Costs of upgrading or The Council will endeavour to work within
providing for extending Council buildings to existing building envelopes where possible
growth cater for growth can place a and will look at reconfiguring workspaces to
financial burden on ratepayers. avoid substantial expenditure.
Seismic Economic – Costs of upgrading The Council has assessed the buildings which
failure of buildings, which do not satisfy the it considers may be a seismic risk and will
buildings minimum requirements for consider mitigation measures on a case-by-
earthquake standards. case basis. There are still other buildings to be
assessed.
10.2 Positive Effects
Significant positive effects associated with the Property AMP include:
Table 9: Positive Effects
Effect Description
Environmental The Council aims to achieve environmental sustainability whilst managing the
sustainability properties activity.
Economic efficiency The Council’s management of the Property AMP using best practice and
competitive tendering aims to provide economic efficiency (i.e., best value for
money) for ratepayers.
PAGE 38 PROPERTY ACTIVITY MANAGEMENT PLANYou can also read


