Sustainable Asset Valuation (SAVi) of Agroforestry Nature-Based Infrastructure in Welkenraedt (Belgium) - International Institute for ...
←
→
Page content transcription
If your browser does not render page correctly, please read the page content below
Copernicus Climate Change Service

             Sustainable Asset Valuation (SAVi) of
             Agroforestry Nature-Based Infrastructure
             in Welkenraedt (Belgium)

             Issued by: IISD-EU / David Uzsoki

             Date: April 2021

             Ref: D428h.2.5.1

             Official reference number service contract: 2019/C3S_428h_IISD-EU/SC1
Copernicus Climate Change Service

This document has been produced in the context of the Copernicus Climate Change Service (C3S). The activities leading to
these results have been contracted by the European Centre for Medium-Range Weather Forecasts, operator of C3S on behalf
of the European Union (Delegation Agreement signed on 11/11/2014). All information in this document is provided "as is"
and no guarantee or warranty is given that the information is fit for any particular purpose. The user thereof uses the
information at its sole risk and liability. For the avoidance of all doubts, the European Commission and the European Centre
for Medium-Range Weather Forecasts has no liability in respect of this document, which is merely representing the authors
view.

 A Sustainable Asset Valuation (SAVi) of Welkenraedt’s Nature-based Infrastructure l Page 2 of 77
Copernicus Climate Change Service

               The International Institute for Sustainable Development (IISD) and KnowlEdge
               Srl have worked on integrating climate data from the Copernicus Climate Data
               Store (CDS) to improve the analysis of infrastructure projects performed with
               SAVi. The project serves to demonstrate the importance and usability of climate
               data generated through the CDS products in deploying sustainable infrastructure
               projects to contribute to a climate-resilient, low-carbon economy.

               The assessment of the Paterson Park’s Building Infrastructure is one of the use
               cases for demonstrating the value of integrating climate data of the Copernicus
               database into SAVi.

               Acknowledgements

                                          We are grateful for the support of the Municipality of
                                          Welkenraedt and would like to thank, in particular,
                                          Jonathan Leruth for engaging with us and providing us
                                          information about the agroforestry project. We would
               also like to thank the Groupe d’Actions Local (GAL) for providing data. Finally, we
               are grateful for discussions with Olivier Baudry of the Association pour
               l’agroforesterie en Wallonie et Bruxelles (AWAF).

               About the Sustainable Asset Valuation (SAVi)
               SAVi is a simulation service that helps governments and investors value the many
               risks and externalities that affect the performance of infrastructure projects.

               The distinctive features of SAVi are:

                 •    Valuation: SAVi values, in financial terms, the material environmental,
                      social, and economic risks and externalities of infrastructure projects. These
                      variables are ignored in traditional financial analyses.
                 •    Simulation: SAVi combines the results of systems thinking and system
                      dynamics simulation with project finance modelling. We engage with asset
                      owners to identify the risks material to their infrastructure projects and then
                      design appropriate simulation scenarios.
                 •    Customization: SAVi is customized to individual infrastructure projects.
               For more information on SAVi: www.iisd.org/savi

A Sustainable Asset Valuation (SAVi) of Welkenraedt’s Nature-based Infrastructure l Page 3 of 77
Copernicus Climate Change Service

               About Copernicus Climate Data Store
               The European Commission has charged the European Centre for Medium-Range
               Weather Forecasts (ECMWF) to implement the Copernicus Climate Change
               Service (C3S). The main goal of C3S is to deliver high-quality data to support
               climate change adaptation and mitigation policies (ECMWF, 2017). One of the
               main features of C3S is the Climate Data Store (CDS), which delivers current, past,
               and future climate indicators. The CDS contains historical climate observations,
               Earth observation datasets, global and local climate projections, seasonal
               forecasts, and global and local climate analyses (ECMWF, 2017).

               Data obtained from the CDS Toolbox include location-specific, historical, and
               future weather indicators, such as precipitation and temperature. Historical data
               (ECMWF Reanalysis 5th generation [ERA5]) and projections (Coupled Model
               Intercomparison Project Phase 5 [CMIP5]) are available for consultation and
               download in the CDS. Selected indicators are also accessible through a dedicated
               online app created to facilitate the exchange of information between the CDS and
               several SAVi models. The SAVi tool uses climate information to estimate damage
               resulting from extreme weather events and climate trends, establish the value
               addition resulting from improved adaptive capacity, and calculate the supply and
               demand of ecosystem services (Bassi et al., 2020). For example, through the
               integration of data on precipitation, evaporation, and crop water requirements
               into the SAVi model, it is possible to evaluate current and future water supply in
               a specific landscape and inform planning for irrigation infrastructure (Bassi et al.,
               2020).

               The Integration of Climate Data into the SAVi Model (Bassi et al., 2020) outlines
               the integration of authoritative Copernicus climate data from the CDS into the
               SAVi tool. It describes how several climate indicators obtained from the CDS were
               integrated into SAVi and how its analysis has improved as a result. In light of this
               integration, the International Institute for Sustainable Development can generate
               sophisticated SAVi-derived analyses on the costs of climate-related risks and
               climate-related externalities.

               Authors
               Andrea M. Bassi
               Liesbeth Casier
               Marco Guzzetti
               Abigail Schlageter
               David Uzsoki

A Sustainable Asset Valuation (SAVi) of Welkenraedt’s Nature-based Infrastructure l Page 4 of 77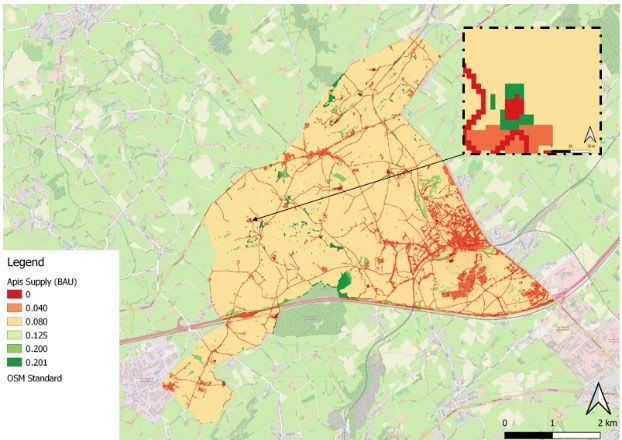
Copernicus Climate Change Service

Executive Summary
This report describes the Sustainable Asset Valuation (SAVi) assessment of an agroforestry
project in the Municipality of Welkenraedt, Belgium. Agroforestry is nature-based
infrastructure (NBI) that aims to maintain and restore soil productivity, combat erosion,
maintain high water quality, and strengthen climate resilience in the area. Agroforestry is
included in the municipality’s climate plans.

This SAVi assessment makes use of the climate data from the Copernicus Climate Data Store
(CDS); more specifically, it includes data on precipitation, temperature changes, evaporation,
and wind speed parameters from different climate scenarios (Representative Concentration
Pathways [RCP] 4.5 and RCP 8.5). Each of these has a significant impact on soil erosion, water
quality and availability, agricultural productivity and revenues.

The SAVi assessment on the agroforestry project in Welkenraedt includes:

    •    An economic valuation of the investment cost, externalities (added benefits/avoided
         costs), and direct (revenues) benefits from the agroforestry.
    •    An assessment of the climate impacts on the performance of the agroforestry project.
    •    A financial assessment of the agroforestry project, assessing how additional revenue
         streams improve the overall financial performance of investments in agroforestry.
The key messages from this analysis are:

    •    The net benefits of the agroforestry project are estimated at EUR 3.9 million over a
         20-year lifetime period for an investment cost of EUR 607,629. This is due to positive
         externalities, avoided costs, and additional potential revenue streams, such as, for
         example, fodder and wood pellet production.
    •    Due to climate change, these benefits will only increase further and make agroforestry
         projects even more economically attractive. For example, agroforestry has a cooling
         effect that reduces heat stress on livestock, improving their milk production and thus
         farmers’ revenues.

A Sustainable Asset Valuation (SAVi) of Welkenraedt’s Nature-based Infrastructure l Page 5 of 77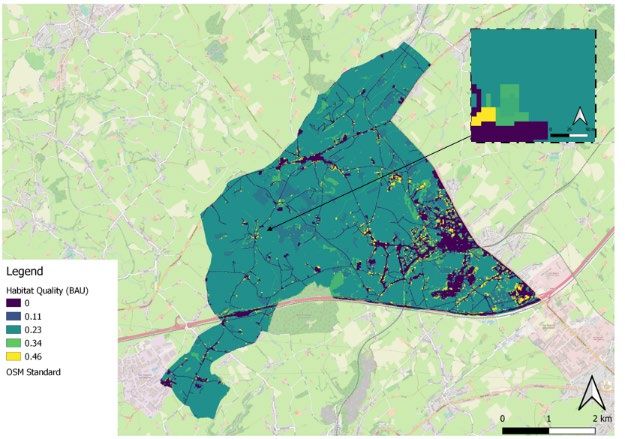
Copernicus Climate Change Service

Table ES1. How can decision-makers and stakeholders use this analysis?

 Stakeholder              Role in the project           How will the stakeholder use the results of the
                                                        assessment with Copernicus Climate Change Service
                                                        (C3S) data?
 Municipality of          Design,                            •    Policy-makers can use it to make
 Welkenraedtn             implementation,                         decisions on climate adaptation planning,
                          and finance of                          biodiversity and forest conservation,
                          projects                                sustainable agriculture, and economic
                          Design and                              development.
                          implementation of                  •    Public budget holders can use the
                          climate adaptation                      analysis to appreciate the value
                          strategy                                generated by natural capital and the
                                                                  extent to which it generates additional
                                                                  co-benefits and avoided costs.
                                                             •    The Welkenraedt municipality can use
                                                                  the results of the analysis to inform
                                                                  concrete activities as part of their climate
                                                                  change adaptation plan. This plan is
                                                                  currently under development.
                                                             •    The municipality also plans wider
                                                                  outreach, engagement, and awareness
                                                                  raising for citizens on nature-based
                                                                  solutions. They can use the results of the
                                                                  analysis to increase citizens’ awareness
                                                                  of the benefits of investing in nature.
 Global Covenant          Best practice                      •    The network will benefit from sharing the
 of Mayors for            sharing on nature-                      use cases with climate-related data to
 Climate &                based solutions for                     expand outreach and identify
 Energy network           climate adaptation                      applications for other local governments.
 Local civil              Consultation with                  •    CSOs can use the economic valuations of
 society                  the municipality on                     ecosystem services to fine-tune forest
 organizations            the design,                             restoration that supports climate
 (CSOs)                   implementation,                         resilience and sustainable agriculture,
                          and monitoring of                       and conduct more targeted advocacy.
                          climate resilience                 •    CSOs can use the economic valuation of
                          and biodiversity                        ecosystem services from trees to call for
                          benefits of                             investments in tree planting and
                          agroforestry                            sustainable agriculture.
                          projects
                                                             •    The Groupe d’Action Locale (GAL) Pays
                                                                  d’Herve, a local civil society stakeholder,
                                                                  seeks to use the analysis to inform and
                                                                  promote different uses of NBI, in

A Sustainable Asset Valuation (SAVi) of Welkenraedt’s Nature-based Infrastructure l Page 6 of 77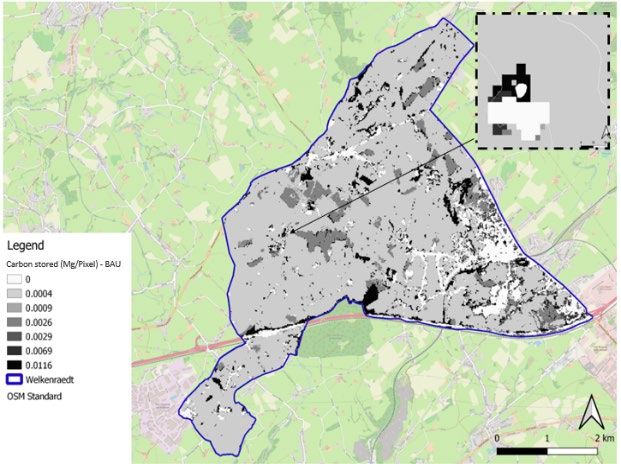
Copernicus Climate Change Service

                                                                  particular the use of biomass for heating.
                                                                  The CSO also provides data and
                                                                  intelligence for the analysis.
                                                             •    The Association pour la promotion de
                                                                  l’agroforesterie en Wallonie et à
                                                                  Bruxelles (AWAF) and Natagriwal have
                                                                  provided input and data into the analysis.
                                                                  They can use the results of the analysis
                                                                  for further promotion of agroforestry
                                                                  projects, especially in their outreach to
                                                                  farmers.
 Project                  Implementation                     •    Project developers and sponsors can use
 developers and           and financing of NBI                    the valuations to design nature-based
 sponsors of NBI          projects                                financing solutions, potentially raising
                                                                  capital from private investors.
                                                             •    Donors and stakeholders from the
                                                                  private sector can utilize the analysis as a
                                                                  baseline to call for green investments in
                                                                  different sectors, like agriculture or
                                                                  water treatment.
 Local farmers            Consultation with                  •    Farmers can help advocate for nature-
                          the municipality on                     based solutions when the economic
                          the design,                             value of the conservation and restoration
                          implementation,                         of the ecosystem services is understood.
                          and monitoring of                  •    The Municpality of Welkenraedt has
                          the benefits of                         indicated that farmers require a better
                          agroforestry                            understanding, especially in monetary
                          projects                                value, of the benefits of NBI. The analysis
                                                                  responds to this need as well by including
                                                                  additional yield and revenue that can be
                                                                  generated through agroforestry.

A Sustainable Asset Valuation (SAVi) of Welkenraedt’s Nature-based Infrastructure l Page 7 of 77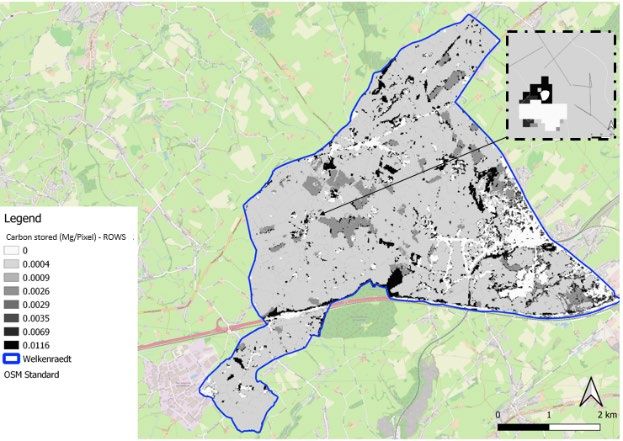
Copernicus Climate Change Service

Table of Contents
1 Introduction ........................................................................................................................14

2 Methodology: SAVi Welkenraedt - Agroforestry .................................................................16

   2.1 Causal Loop Diagram................................................................................................................... 16

   2.2 Climate Data and the Climate Impact of Agroforestry Projects ................................................. 18

   2.3 Spatially Explicit Analysis ............................................................................................................ 25

   2.4 Assumptions and Data Inputs for the SAVi Assessment ............................................................. 29

3 Results: SAVi Welkenraedt – Agroforestry ..........................................................................33

   3.1 Integrated CBA ............................................................................................................................ 33

   3.2 Project Finance Model ................................................................................................................ 35

4 Conclusions .........................................................................................................................37

References .............................................................................................................................38

Annex A. Assessing Ecosystem Services Supply in Belgium by applying the Invest Tool ........42

A Sustainable Asset Valuation (SAVi) of Welkenraedt’s Nature-based Infrastructure l Page 8 of 77
Copernicus Climate Change Service

List of Figures
Figure 1. CLD for agroforestry in Welkenraedt ..................................................................................... 17
Figure 2. Predicted change in precipitation under RCP 4.5 .................................................................. 19
Figure 3. Predicted change in precipitation under RCP 8.5 .................................................................. 19
Figure 4. Predicted runoff volume under RCP 4.5 ................................................................................ 20
Figure 5. Predicted runoff volume under RCP 8.5 ................................................................................ 20
Figure 6. Changes to air temperature under RCP 4.5 ........................................................................... 22
Figure 7. Changes to air temperature under RCP 8.5 ........................................................................... 22
Figure 8. Predicted changes to evaporation under RCP 4.5 ................................................................. 23
Figure 9. Predicted changes to evaporation under RCP 8.5 ................................................................. 23
Figure 10. Predicted changes to wind speed under RCP 4.5 ................................................................ 24
Figure 11. Predicted changes to wind speed under RCP 8.5 ................................................................ 25
Figure 12. Map of Belgium and Welkenraedt (in red) .......................................................................... 26
Figure 13. Map of Welkenraedt, BAU scenario for carbon sequestration ........................................... 27
Figure 14. Map of Welkenraedt, ROWS scenario for carbon sequestration ........................................ 27
Figure 15. Map of Welkenraedt, BAU scenario for habitat quality ...................................................... 28
Figure 16. Map of Welkenraedt, ROWS scenario for habitat quality ................................................... 28
Figure A1. Location of Welkenraedt ..................................................................................................... 42
Figure A2. Tree rows considered in this analysis .................................................................................. 44
Figure A3. LULC map – BAU scenario .................................................................................................... 45
Figure A4. LULC map – ROWS scenario................................................................................................. 46
Figure A5. Carbon stored (Mg/Pixel) – BAU scenario ........................................................................... 49
Figure A6. Carbon stored (Mg/Pixel) – ROWS scenario ....................................................................... 50
Figure A7. Scores of habitat quality (BAU) ............................................................................................ 54
Figure A8. Scores of habitat quality (ROWS) ........................................................................................ 55
Figure A9. Habitat Quality – difference between ROWS and BAU scenarios ....................................... 56
Figure A10. Apis supply per pixel (BAU) ................................................................................................ 60
Figure A11. Apis supply per pixel (ROWS) ............................................................................................ 61
Figure A12. Watershed around the Municipality of Welkenraedt ....................................................... 65
Figure A13. Total sediment export – BAU and ROWS Scenario ............................................................ 69
Figure A14. Nitrogen export (kg/pixel) ................................................................................................. 74
Figure A15. Phosphorus export (kg/pixel) ............................................................................................ 76

A Sustainable Asset Valuation (SAVi) of Welkenraedt’s Nature-based Infrastructure l Page 9 of 77
Copernicus Climate Change Service

List of Tables
Table ES1. How can decision-makers and stakeholders use this analysis? ............................................ 6
Table 1. Carbon sequestration .............................................................................................................. 27
Table 2. Habitat quality ......................................................................................................................... 29
Table 3. Project information ................................................................................................................. 29
Table 4. Explanation of the assumptions and data references............................................................. 30
Table 5. Integrated CBA on agroforestry in Welkenraedt .................................................................... 34
Table 6. IRR and NPV for the agroforestry project in Welkenraedt ..................................................... 35
Table A1. Carbon pools ......................................................................................................................... 48
Table A2. Carbon pool statistics ............................................................................................................ 50
Table A3. Table of threats (maximum distance, weighted value, and decay function)
for InVEST simulation ............................................................................................................................ 51
Table A4. Habitat Quality model – references “threat table” .............................................................. 51
Table A5. Habitat Quality model – references “threat sensitivity table” ............................................. 52
Table A6. Table of Sensitivity of land cover types to each threat for InVEST simulation ..................... 53
Table A7. Habitat quality statistics ....................................................................................................... 55
Table A8. Guild table used in this analysis ............................................................................................ 58
Table A9. Biophysical table – crop pollination ...................................................................................... 59
Table A10. Crop pollination statistics ................................................................................................... 61
Table A11. Biophysical table (Water Yield) ........................................................................................... 64
Table A12. Water yield results .............................................................................................................. 65
Table A13. Biophysical table annual sediment delivery ratio ............................................................... 67
Table A14. Annual sediment delivery ratio statistics ............................................................................ 69
Table A15. Biophysical table – Annual Nutrient Delivery Ratio ............................................................ 72
Table A16. Nitrogen Delivery Ratio statistics ........................................................................................ 75
Table A17. Phosphorus Delivery Ratio statistics ................................................................................... 76

A Sustainable Asset Valuation (SAVi) of Welkenraedt’s Nature-based Infrastructure l Page 10 of 77
Copernicus Climate Change Service

Glossary
Causal loop diagram: A schematic representation of key indicators and variables of the
system under evaluation that shows the causal connections between them and contributes
to the identification of feedback loops and policy entry points.

Discounting: A finance process to determine the present value of a future cash value.

Feedback loop: “A process whereby an initial cause ripples through a chain of causation
ultimately to re-affect itself” (Roberts et al., 1983).

Indicator: Parameters of interest to one or several stakeholders that provide information
about the development of key variables in the system over time and trends that unfold under
specific conditions (United Nations Environment Programme [UNEP], 2014).

Internal Rate of Return (IRR): An indicator of the profitability prospects of a potential
investment. The IRR is the discount rate that makes the net present value of all cash flows
from a particular project equal to zero. Cash flows net of financing give us the equity IRR.

Methodology: The theoretical approach(es) used for the development of different types of
analysis tools and simulation models. This body of knowledge describes both the underlying
assumptions used as well as qualitative and quantitative instruments for data collection and
parameter estimation (UNEP, 2014).

Model transparency: The degree to which model structure and equations are accessible and
make it possible to directly relate model behaviour (i.e., numerical results) to specific
structural components of the model (UNEP, 2014).

Model validation: The process of assessing the degree to which model behaviour (i.e.,
numerical results) is consistent with behaviour observed in reality (i.e., national statistics,
established databases) and the evaluation of whether the developed model structure (i.e.,
equations) is acceptable for capturing the mechanisms underlying the system under study
(UNEP, 2014).

Net benefits: The cumulative amount of monetary benefits accrued across all sectors and
actors over the lifetime of investments compared to the baseline, reported by the
intervention scenario.

Net Present Value (NPV): The difference between the present value of cash inflows net of
financing costs and the present value of cash outflows. It is used to analyze the profitability
of a projected investment or project.

Optimization: A stream of modelling that aims to identify the policy or set of policies that
deliver the best possible outcome from a set of alternatives, given a set of criteria (i.e.,
parameters to optimize) and/or constraints (i.e., available budget) (UNEP, 2014).

A Sustainable Asset Valuation (SAVi) of Welkenraedt’s Nature-based Infrastructure l Page 11 of 77
Copernicus Climate Change Service

Scenarios: Expectations about possible future events used to analyze potential responses to
these new and upcoming developments. Consequently, scenario analysis is a speculative
exercise in which several future development alternatives are identified, explained, and
analyzed for discussion on what may cause them and the consequences these future paths
may have on our system (e.g., a country or a business).

Simulation model: Models can be regarded as systemic maps in that they are simplifications
of reality that help to reduce complexity and describe, at their core, how the system works.
Simulation models are quantitative by nature and can be built using one or several
methodologies (UNEP, 2014).

Stock and flow variables: “A stock variable represents accumulation and is measured at one
specific time. A flow variable is the rate of change of the stock and is measured over an
interval of time” (UNEP, 2014, p. 51).

System dynamics: A methodology developed by Forrester in the late 1950s (Forrester, 1961)
to create descriptive models that represent the causal interconnections between key
indicators and indicate their contribution to the dynamics exhibited by the system as well as
to the issues being investigated. The core pillars of the system dynamics method are feedback
loops, delays, and non-linearity emerging from the explicit capturing of stocks and flows
(UNEP, 2014).

Vertical/horizontal disaggregation of models: Vertically disaggregated models contain a high
level of detail on the sectoral level (i.e., energy), while horizontally disaggregated models
focus on capturing the interconnections between several sectors and contain less detail on
the sectoral level (UNEP, 2014).

A Sustainable Asset Valuation (SAVi) of Welkenraedt’s Nature-based Infrastructure l Page 12 of 77
Copernicus Climate Change Service

List of Abbreviations
 BAU                   business as usual
 C3S                   Copernicus Climate Change Service
 CBA                   cost–benefit analysis
 CDS                   Climate Data Store
 CLD                   causal loop diagram
 CMIP5                 Coupled Model Intercomparison Project Phase 5
 CO2e                  carbon dioxide equivalent
 CSO                   civil society organization
 DEM                   Digital Elevation Model
 ECMWF                 European Centre for Medium-Range Weather Forecasts
 ERA5                  ECMWF Reanalysis 5th generation
 GDP                   gross domestic product
 InVEST                Integrated Valuation of Ecosystem Services and Tradeoffs
 IPCC                  Intergovernmental Panel on Climate Change
 IRR                   internal rate of return
 LULC                  land use and land cover
 N                     nitrogen
 NBI                   nature-based infrastructure
 NPV                   net present value
 O&M                   operation and management
 P                     phosphorus
 PAWC                  plant available water content
 RCP                   Representative Concentration Pathways
 SAVi                  Sustainable Asset Valuation tool
 THI                   Temperature Humidity Index
 UNEP                  United Nations Environment Programme
 USLE                  Universal Soil Loss Equation

A Sustainable Asset Valuation (SAVi) of Welkenraedt’s Nature-based Infrastructure l Page 13 of 77
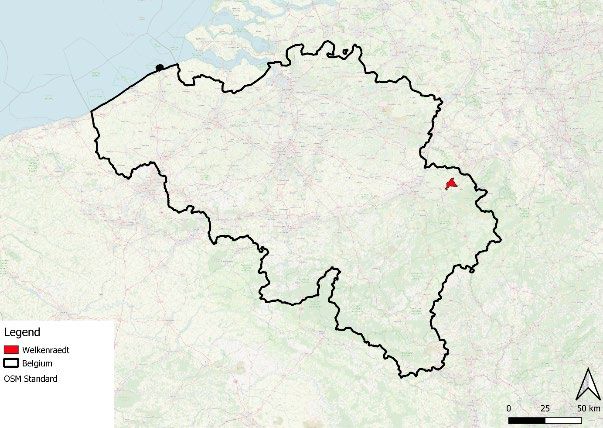
Copernicus Climate Change Service

1 Introduction
The Municipality of Welkenraedt (Belgium) requested a SAVi assessment to provide an
estimation of the value-added of agroforestry projects for climate adaptation.

Welkenraedt is located in the Pays de Herve, an area in the southeast of Belgium close to the
Dutch and German borders. At the heart of the Meuse–Rhine region, in the cross-border area
called Parc des Trois Pays, the Pays de Herve and the Municipality of Welkenraedt are
recognized for their peaceful environment and agriculture, which over the centuries has
shaped the landscape: meadows surrounded by hedges and trees called “bocage.” The
municipality has around 10,000 inhabitants (2021).

Welkenraedt, and by expansion the Walloon region in the south of Belgium, is promoting
agroforestry projects as a cost-effective solution for the climate and biodiversity challenges
that the region faces. The municipality included agroforestry in its climate adaptation strategy
and seeks to promote it not only for climate resilience but also other co-benefits.

Thanks to the work of the Groupe d’Actions Local (GAL) Pays de Herve, the municipality also
mapped out the areas where additional hedges and trees can be planted, and the SAVi
analysis has taken this data as the starting point for the development of spatial maps and an
economic analysis.

Hedges (low and high) and trees provide a number of important functions: they provide
shade, act as wind- and snow breakers, provide overall protection for cattle from extreme
weather events, protect against soil erosion, contribute to biodiversity, and fulfill a generally
important function in the ecosystem. Agroforestry projects are complex, and their benefits
also depend on the different compositions of species of hedges and trees (Association pour
l’agroforesterie en Wallonie et Bruxelles [AWAF], 2020). This document provides an overview
of the different species’ compositions and their benefits to the area. The SAVi assessment is
customized based on the information in this document and on discussions with the
municipality on how to best reflect the complexity of the performance of different trees and
hedges.

The simulated agroforestry project comprises an area of approximately 100,000 m2 of low and
high hedges and trees.

As is common with nature-based infrastructure (NBI) providing these multiple benefits, they
are not being accounted for or valued. This makes it easier to discard maintenance for
agroforestry projects and more difficult to demonstrate that investing in agroforestry is
worthwhile.

The municipality has been looking for further evidence on the costs, revenues, and co-
benefits that agroforestry projects can bring. In addition, the municipality has been looking
for more accurate information on climate variables that could potentially impact the projects.
In response, we proposed a customized assessment with the SAVi methodology.

A Sustainable Asset Valuation (SAVi) of Welkenraedt’s Nature-based Infrastructure l Page 14 of 77
Copernicus Climate Change Service

The SAVi analysis provides the municipality with a diverse range of information—from spatial
maps, climate data, and an economic valuation—that can be used to further advocate for the
use of agroforestry projects as a worthwhile investment for citizens, farmers, and the
municipality. It provides a first insight into the opportunities that NBI brings, especially in light
of the climate and biodiversity crises. The information can also be used to further advance
and implement the climate adaptation strategy of the municipality.

Welkenraedt is an active member of the Global Covenant of Mayors for Climate & Energy
network and will also be able to share information on the investment case for NBI through
that network.

A Sustainable Asset Valuation (SAVi) of Welkenraedt’s Nature-based Infrastructure l Page 15 of 77
Copernicus Climate Change Service

2 Methodology: SAVi Welkenraedt - Agroforestry
2.1 Causal Loop Diagram
The SAVi Nature-Based Infrastructure (NBI) model provides a blueprint for discussions on the
risks, benefits, and climate impacts of agroforestry projects (Bassi et al., 2019). For this
assessment, we have adjusted and customized the causal loop diagram (CLD) for NBI to the
agroforestry project in Welkenraedt.

A CLD is an analytical tool that is part of the SAVi assessment and helps to capture the local
dynamics around the agroforestry project. It was designed together with the Municipality of
Welkenraedt and an agroforestry expert from the Walloon region. The CLD is the first step in
customizing the assessment to the local context. The CLD presented in Figure 1 shows the
interconnectedness of socio-economic and environmental key indicators. It allows for a
greater understanding of the potential impacts of sustainable agroforestry investments and
climate change and how these impacts would unfold through the system.

Figure 1 presents the CLD of the basic dynamics that underlie the analysis of the agroforestry
project.

How to read a CLD:

    •    “A causal link from variable A to variable B is positive if a change in A produces a
         change in B in the same direction.
    •    A causal link from variable A to variable B is negative if a change in A produces a change
         in B in the opposite direction” (Bassi et al., 2016).

A Sustainable Asset Valuation (SAVi) of Welkenraedt’s Nature-based Infrastructure l Page 16 of 77
Copernicus Climate Change Service
Figure 1. CLD for agroforestry in Welkenraedt
The starting point of the CLD is green variables that refer to the agroforestry project: hedges
and trees increase vegetation in the area. These have a variety of impacts. The direct services
provided by additional vegetation are presented directly around the vegetation variable.
Specifically, vegetation can create bioenergy, produce fodder, absorb nutrients, contribute to
water percolation and absorption capacity, increase flow regulation, and reduce heat stress.
More specifically:
• More vegetation means more water absorption capacity in the area and better
regulation of water flows. Better water absorption has a positive impact on
groundwater recharge as well as on overall water balance. Flow regulation also
contributes to the water balance, which in turn reduces floods. Fewer floods has a
positive impact on damages to water infrastructure, which in this way has a positive
impact on the viability of agroforestry projects from a socio-economic perspective. A
better water balance also has a positive impact on land productivity, which in turn
increases agricultural production and revenues, providing another positive argument
for the investment case in agroforestry from a societal perspective.
• More vegetation also means less heat stress for cows, which has a direct impact on
agriculture revenues.
• More vegetation has a positive impact on the natural habitat and biodiversity of the
area. This also contributes to land productivity and, ultimately, agriculture revenues.
• More vegetation leads to more potential for bioenergy (wood pellets), resulting in
lower costs for energy from other sources and a positive impact on the societal
economic viability of agroforestry projects.
A Sustainable Asset Valuation (SAVi) of Welkenraedt’s Nature-based Infrastructure l Page 17 of 77Copernicus Climate Change Service
• More vegetation has a positive impact on fodder production, leading to a reduction in
fodder costs for farmers and adding to a positive societal return for agroforestry
projects.
• Higher potential for bioenergy and fodder production results in the creation of more
local employment, as opposed to purchasing biomass and fodder elsewhere. Jobs are
also created from tree planting.
• Agroforestry has a direct carbon sequestration benefit captured in the CLD, as well as
a nutrient absorption benefit. The latter is also impacted by temperature changes.
Nutrient absorption impacts the nutrient concentration (also impacted by the size of
the water body) and that in turn has impacts on the water quality of the area,
impacting tourism and tourism-related economic activity, all of which influences the
societal economic viability of the project.
The pink variables are climate variables that we link to the CDS and have an impact on
different variables in the CLD. While agroforestry is linked to economic benefits, climate
change can have a notable effect on project outcomes. Precipitation and temperature have
an impact on the water balance and groundwater recharge, which are both eventually linked
to floods and increased damage to infrastructure. Temperature has an impact on heat stress
in cattle. An increased number of months of heat stress due to climate change has an eventual
impact on farmers’ revenues. Agroforestry projects have a significant impact on reducing heat
stress, and thus, under climate change scenarios, agroforestry projects also become
economically more attractive.
2.2 Climate Data and the Climate Impact of Agroforestry Projects
The Copernicus CDS provides data to forecast how different climate variables will change in
Welkenraedt over the project timeline. Figures 2 through 11 show how precipitation, runoff,
air temperature, evaporation, and wind speed will change in Welkenraedt over the next 40
years. Two climate scenarios are included:
• The Representative Concentration Pathways (RCP) 4.5 climate scenario assumes that
emissions peak in 2040 and begin to decline thereafter.
• The RCP 8.5 scenario assumes that fossil fuel-intensive forms of energy generation
continue to be used heavily through the remainder of the century.
RCPs are trajectories of the concentration of carbon dioxide equivalent (CO2e) greenhouse
gas emissions used by the Intergovernmental Panel on Climate Change (IPCC) to determine
the policy ambition required to realize different global warming outcomes. Originally, four
main pathways were used, each considering different radiative forcing values in the year
2100. For instance, the RCP 4.5 scenario corresponds to the 4.5 W/m2 radiative forcing value.
Three additional trajectories have been added since the IPCC Fifth Assessment Report (AR5) 1.
1
See the report here: https://www.ipcc.ch/report/ar5/syr/
A Sustainable Asset Valuation (SAVi) of Welkenraedt’s Nature-based Infrastructure l Page 18 of 77Copernicus Climate Change Service
The blue line represents the historical data (ECMWF Reanalysis 5th generation [ERA5]
database), and the red line represents the climate projection (Coupled Model
Intercomparison Project Phase 5 [CMIP5]) based on different data sets with results from
different global circulation models.
The ERA5 is a database of global climate indicators from January 1950 until now. 2 CMIP5 is
the database consisting of future projections of global climate indicators.
Figure 1. Predicted change in precipitation under RCP 4.5
Figure 2. Predicted change in precipitation under RCP 8.5
High precipitation events will be more frequent under both climate scenarios, but this is more
evident under the emission-intensive RCP 8.5 climate scenario. The spikes in both figures
represent events with high levels of precipitation. These spikes tend to become greater over
time under the RPC 8.5 scenario.
2
https://www.ecmwf.int/en/forecasts/dataset/ecmwf-reanalysis-v5
A Sustainable Asset Valuation (SAVi) of Welkenraedt’s Nature-based Infrastructure l Page 19 of 77Copernicus Climate Change Service Figure 4. Predicted runoff volume under RCP 4.5 Figure 5. Predicted runoff volume under RCP 8.5 Increased levels of precipitation will lead to a higher volume of surface runoff during heavy rain events. Changes to runoff volumes in Welkenraedt are also included in the Copernicus CDS. The results show that runoff volumes are expected to increase over the coming decades under RCP 8.5, while the changes are less obvious under RCP 4.5. These changes in runoff are in line with what we would expect, given the predicted changes to precipitation under the same scenarios. If runoff and precipitation increase, the benefits of the agroforestry project that are captured in the integrated cost–benefit analysis (CBA) will be impacted. Runoff from agricultural land is responsible for carrying nutrients, such as nitrogen and phosphorus, to local waterways. These nutrients then need to be removed by a wastewater treatment facility. Thus, with additional runoff expected over the rest of the century, we can expect higher nitrogen and phosphorus concentrations to be found in local waterways. In fact, one study of Jialing River A Sustainable Asset Valuation (SAVi) of Welkenraedt’s Nature-based Infrastructure l Page 20 of 77
Copernicus Climate Change Service

Watershed, China, found that “the effects from runoff increment leads to approximately
28.6% and 22.5% increases of TN and TP pollution load, respectively” (Wu et al., 2012). As a
result, water treatment costs will be higher, with increases in runoff volume expected over
the next 40 years.

As agroforestry projects have a natural capability of removing nitrogen and phosphorus, the
economic viability for agroforestry increases. Agroforestry avoids wastewater treatment
costs by preventing some of these nutrients from ending up in waterways. According to one
study conducted at Glensaugh in Scotland, “forest[s] ha[ve] the capacity to not only reduce
surface runoff but also to ‘soak up’ runoff generated further up the hillslope” (Chandler et al.,
2017).

For this assessment, we do not have location- or project-specific data that would allow us to
quantify the extent of the impact of the climate variable on the nitrogen and phosphorus
removal potential of agroforestry. However, the literature suggests that the agroforestry
project becomes even more economically attractive because runoff will increase in
Welkenraedt over the next 40 years. And agroforestry can mitigate some of the additional
negative impacts of increased precipitation and runoff.

In addition to avoiding water treatment costs, agroforestry is also associated with avoiding
flood damage. Increased runoff has been associated with increased flooding and flood
damage costs. It has been shown, however, that “by intercepting rainfall, enhancing soil
infiltration and removing water from the soil, trees help regulate storm-water and mitigate
local flooding events” (Hirons & Sjöman, 2018). Thus, agroforestry can reduce flooding and
resulting flood damages from increased precipitation and runoff.

If levels of precipitation do increase in Welkenraedt in the coming decades, the agroforestry
project will become even more economically attractive due to avoided water treatment costs
and avoided flood damage.

A Sustainable Asset Valuation (SAVi) of Welkenraedt’s Nature-based Infrastructure l Page 21 of 77
Copernicus Climate Change Service

Figure 6. Changes to air temperature under RCP 4.5

Figure 3. Changes to air temperature under RCP 8.5

Figure 6 and Figure 7 both show an increasing trend in air temperature; however, this increase
is larger under the RCP 8.5 scenario. Temperature changes will impact the effectiveness of
the agroforestry project in several ways, which affects the values in the integrated CBA.

The literature indicates that temperature changes impact the carbon sequestration potential
of agroforestry projects. One study conducted in China’s Yunnan province found that “a
temperature increase of 2°C resulted in sharp decreases in the [carbon sequestration
potential] of coniferous forest vegetation” (Zhou et al., 2018). Thus, if the agroforestry project
is not pursued in Welkenraedt, we can expect the temperature increases to reduce the carbon
sequestration potential of the vegetation in the area. However, if the proposed agroforestry
project is implemented, some of these negative effects can be avoided or offset. Thus, the
project appears even more valuable in the long term if we assume, per the Copernicus CDS,
that air temperature will increase in the coming years.

A Sustainable Asset Valuation (SAVi) of Welkenraedt’s Nature-based Infrastructure l Page 22 of 77
Copernicus Climate Change Service

Another benefit of agroforestry is that trees have a cooling effect that can reduce heat stress
on both humans and livestock. As seen in the results of the CBA, reduced heat stress for dairy
cows improves milk yields. With temperatures expected to increase even more in the coming
years, the benefits of reduced heat stress that are attributable to the agroforestry project will
be even greater under both climate scenarios.

Additionally, the cooling effect of trees may also increase labour productivity and have a
positive effect on health. In fact, it has been shown that the cooling effect of trees is especially
beneficial to the health of “the elderly, the sick, and children” (Hirons & Sjöman, 2018). Again,
with temperatures expected to increase under both climate scenarios, the benefit of cooling
provided by the agroforestry project will be even greater than is estimated in the CBA by
mitigating lost carbon sequestration, improving cow milk yields, increasing labour
productivity, and improving human health.

Figure 8. Predicted changes to evaporation under RCP 4.5

Figure 9. Predicted changes to evaporation under RCP 8.5

A Sustainable Asset Valuation (SAVi) of Welkenraedt’s Nature-based Infrastructure l Page 23 of 77
Copernicus Climate Change Service

Under the RCP 4.5 scenario, evaporation seems like it may increase slightly over the
remainder of the decade. On the other hand, under the RCP 8.5 scenario, evaporation seems
to be relatively unchanged, if not decreasing slightly, over the coming years. As with changes
in the other climate variables, changes in evaporation may change the economic
attractiveness of the agroforestry project.

Increased levels of evaporation may have damaging effects on the environment. It has been
shown that “evaporation causes the upper levels of soil to become dry and hard. When rain
or irrigation water then falls onto the soil, a significant portion of the water runs off of the soil
instead of soaking into the ground. When the ground is too dry, plants may fail to grow, and
the soil is more susceptible to wind erosion” (Motes, 2019). Thus, if evaporation increases in
Welkenraedt, as predicted by RCP 4.5, agricultural yields in the region will suffer. In addition,
the negative effects of increased runoff will be amplified.

Agroforestry can prevent these negative climate impacts. One study conducted in Kenya
found that “trees could reduce annual soil evaporation directly beneath their canopy by an
average of 35%” (Wallace et al., 1999). Thus, if evaporation does increase over the coming
years, the agroforestry project will help to mitigate these negative effects. The resulting
avoided costs will increase the investment case for the agroforestry project.

Figure 10. Predicted changes to wind speed under RCP 4.5

A Sustainable Asset Valuation (SAVi) of Welkenraedt’s Nature-based Infrastructure l Page 24 of 77
Copernicus Climate Change Service

Figure 11. Predicted changes to wind speed under RCP 8.5

Under the RCP 4.5 scenario, it seems as if wind speed will decrease slightly over the remainder
of the century. On the other hand, it seems like wind speed may increase slightly under the
RCP 8.5 climate scenario. It also seems like there will be more intense high-wind events under
the RPC 8.5 scenario, which is evident by the several spikes toward the end of the century.

While a reduction in wind speed and high-wind events, as is predicted under the RCP 4.5
scenario, is not likely to reduce the expected benefits of the agroforestry project, an increase
in wind speeds and high-wind events are likely to make the project more economically
attractive. The agroforestry project in Welkenraedt will be even more economically attractive
if wind increases since it has been shown that when agroforestry projects are implemented
near agricultural land, yields tend to increase due to the windbreak provided by the trees.

According to Jude Hobbs, a hedgerow specialist, “when a hedgerow is planted perpendicular
to the prevailing winds, it can reduce wind speeds by up to 75% at distances up to ten times
the height of the hedgerow on flat land” (Stross, 2020). Further, one study conducted in
Canada conservatively estimates that when trees are planted, they can increase crop yields
by 5% (Alam, 2014). It is evident, then, that increased wind speed can lead to a reduction in
agricultural yields. However, agroforestry can prevent this by protecting crops from climatic
changes.

2.3 Spatially Explicit Analysis
Spatial maps generated with the Integrated Valuation of Ecosystem Services and Tradeoffs
(InVEST) model were used as a part of this analysis to precisely estimate the extent to which
different ecosystem services in Welkenraedt will be affected by the agroforestry project. The
InVEST model generates land use and land cover (LULC) maps to estimate the impact of land-
use changes on different ecosystem services.

For each model, we used two different LULC maps depending on the two different scenarios
that have been considered in this analysis:

A Sustainable Asset Valuation (SAVi) of Welkenraedt’s Nature-based Infrastructure l Page 25 of 77
Copernicus Climate Change Service
• Business as usual (BAU): the original LULC map has been used.
• Tree Rows (ROWS): we added tree rows to the original LULC map that separate crop
fields and can be found in the study area.
We include here the results for carbon sequestration and habitat quality, but the full scope
of the analysis, which has been used to feed into the results of the integrated CBA, is available
in the Annex to this report
Specifically, we found that the agroforestry project will result in an increase in carbon
sequestration, pollination, and habitat quality in the region. It will also reduce phosphorus
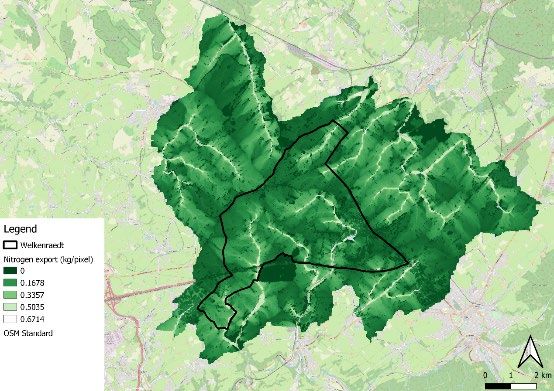
and nitrogen exports in the region. Additionally, spatial analyses were performed to estimate
the agroforestry project’s impact on habitat quality, water yield, and sediment delivery.
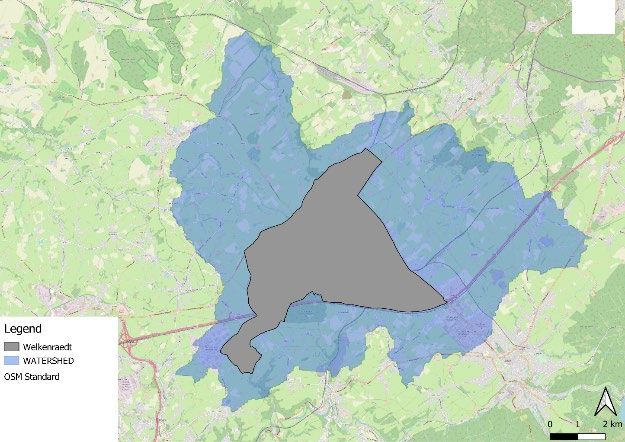
Figure 12. Map of Belgium and Welkenraedt (in red)
Figures 13 and Figure 14 illustrate the changes in carbon sequestration from agroforestry: the
analysis demonstrates that the specific agroforestry project in Welkenraedt will lead to 0.5%
more carbon sequestration.
A Sustainable Asset Valuation (SAVi) of Welkenraedt’s Nature-based Infrastructure l Page 26 of 77Copernicus Climate Change Service
Figure 13. Map of Welkenraedt, BAU scenario for carbon sequestration
Figure 14. Map of Welkenraedt, ROWS scenario for carbon sequestration
Table 1. Carbon sequestration
Sum (Mg) Change from the current
scenario %
BAU Scenario 85,789
0.5
ROWS Scenario 86,198
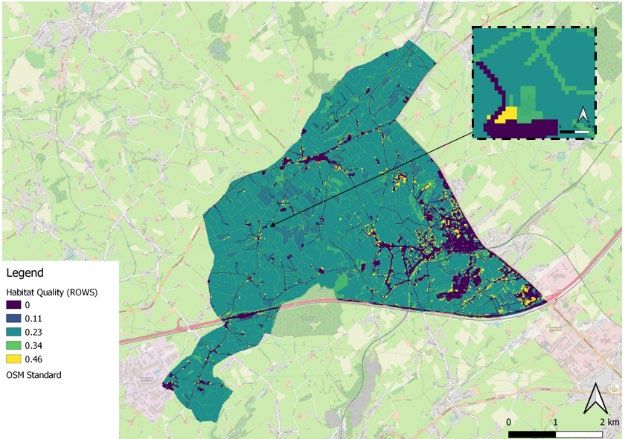
Figures 15 and 16 represent changes in habitat quality due to the agroforestry projects: the
analysis demonstrates that the specific agroforestry project in Welkenraedt will lead to an
improvement of 1.8% in habitat quality.
A Sustainable Asset Valuation (SAVi) of Welkenraedt’s Nature-based Infrastructure l Page 27 of 77Copernicus Climate Change Service Figure 15. Map of Welkenraedt, BAU scenario for habitat quality Figure 16. Map of Welkenraedt, ROWS scenario for habitat quality A Sustainable Asset Valuation (SAVi) of Welkenraedt’s Nature-based Infrastructure l Page 28 of 77
Copernicus Climate Change Service

Table 2. Habitat quality

                                                          Mean                         Change from the current
                                                                                             scenario %
            BAU Scenario                                   0.211
                                                                                                    1.896%
           ROWS Scenario                                   0.215

2.4 Assumptions and Data Inputs for the SAVi Assessment
Tables 3 and 4 provide an overview of the data inputs, assumptions, and calculation of the
items in the integrated CBA.

Table 3. Project information

                             Area (simulated with InVEST model)
 Tree rows area (total)                          98,916.30                                          m2
 Tree rows area (total)                          9.89                                               ha
 Tree area (single tree)                         0.42                                               m2
 Trees (pixels)                                  235,515                                            unit
                        Costs (based on Van Raffe & De Jong, 2014)
 Plant purchase                                  28,262                                              €
 Planting                                        357,983                                             €
 Plant protection                                221,384                                             €
 Total                                           607,629                                             €

A Sustainable Asset Valuation (SAVi) of Welkenraedt’s Nature-based Infrastructure l Page 29 of 77
Copernicus Climate Change Service
Table 4. Explanation of the assumptions and data references
Investment and operation and management (O&M)
Capital cost Capital costs include investments in plant purchase and planting activities.
We calculated the number of pixels representing planted trees, where 1
pixel is equal to a single tree. The number of expected trees in our
simulation is 235,515 units. Next, using the data retrieved from Van Raffe
and De Jong (2014), we assumed that the cost of plant purchasing and
planting is EUR 0.12 for tree-1 and EUR 1.52 for tree-1, respectively. We
estimate that the total capital costs will amount to EUR 386,245.
O&M cost Using the O&M cost of EUR 0.94 for tree-1, retrieved from Van Raffe and
De Jong (2014), we estimate that the total costs will amount to EUR
221,384. This O&M cost is for protecting the hedges and maintaining
them.
Externalities
Labour income: Labour income in agriculture and other industries was calculated using an
Agriculture and estimate from Mills (2002), indicating that the total (indirect and direct)
other industries income impact from GBP 1 million spent on hedge restoration amounts to
GBP 1,364,436. From there, we assumed that the total labour income
would amount to EUR 749,612, considering the total investment and
O&M costs of the project.
Nitrogen (N) Avoided costs of N removal over 20 years were calculated starting from
removal the outputs of the Annual Nutrient Delivery Ratio InVEST model, which
shows that planted trees will decrease N exports by 377 kg in the study
area. Next, we multiplied that value by the cost of removing N in waste
treatment plants from three different studies, which amounts to EUR
4.44/kg, EUR 7/kg, and USD 8.5/Kg (Alam et al., 2014; Preisner et al.,
2020; Tamburini et al., 2020). Finally, we calculated the average value of
the avoided cost of N removal in the study area, based on the average of
those three values, which amounts to EUR 46,857 in avoided cost over 20
years.
Phosphorus (P) Avoided costs of P removal over 20 years were calculated starting from
removal the outputs of the Annual Nutrient Delivery Ratio InVEST model, which
shows that planted trees will decrease P exports by 102 kg in the study
area. Next, we multiplied that value by the cost of removing P in
wastewater treatment plants from two different studies, which amounts
to USD 61.20/kg and EUR 24.46/kg (Alam et al., 2014; Preisner et al.,
2020).
A Sustainable Asset Valuation (SAVi) of Welkenraedt’s Nature-based Infrastructure l Page 30 of 77Copernicus Climate Change Service
Water supply According to the Annual Water Yield InVEST model, the newly planted
trees will increase water yield volume by 10,000 m3. Assuming that the
water price is EUR 0.1/m3, total avoided costs of water supply will amount
to EUR 1,000 per year, or EUR 20,000 over a period of 20 years.
Carbon According to the Carbon Sequestration InVEST model, carbon
sequestration sequestration in the study area will amount to 4.6 tC/ha/year, which
corresponds to 16 tCO2/ha/year. By multiplying that value for the number
of ha covered by planted trees (9.89 ha) and by the sequestered carbon
value (USD 10/tonne or USD 9/tonne) (Lewandrowski et al., 2004), we
obtain that the benefits of carbon sequestration will amount to EUR
27,495 over 20 years.
Biological control Tree-based intercropping ecosystem services amount to CAD 75/ha/year,
according to Alam et al. (2014). By multiplying that value with 9.89 ha,
which is the number of ha that will be covered by planted trees, we obtain
that the benefits of biological control in the study area will amount to EUR
9,496 over 20 years.
Revenues
Tourism and According to Rosenberger et al. (2017), the median value estimate of
landscape picnicking is USD 23.62 per person per day. Assuming that planted trees
will attract 40 people per weekend over 20 years, the added value of
tourism will be EUR 832,705.
Milk production Temperature Humidity Index (THI) is a measure that combines the impacts
(additional of environmental temperature and relative humidity and is a useful way to
revenues from assess the risk of heat stress in livestock (TermotecnicaPericoli, 2018). The
reduced heat formula to calculate THI is the following:
stress) THI =0.8*T + RH*(T-14.4) + 46.4
Where T = ambient or dry-bulb temperature in °C and RH = relative
humidity expressed as a proportion.
In this analysis, we first calculated additional milk production by
estimating THI in July in an area without trees (T=30°C, RH=0.78) and with
them (T=27.85°C, RH=0.78), considering that areas with trees are cooler
by 2.15˚C (Copernicus Climate Change, 2020). This value is equal to 0.16
kg of milk/cow/day. We then multiplied it by the number of hot days in a
year, by 20 (years considered), by 2,762 (number of cows in the study
area), and by EUR 0.267/kg (farm-gate prices for milk in Belgium)
(European Milk Board, 2016). We deduced that the additional revenues in
milk production from planted trees will amount to EUR 139,845.
Fodder Starting from the number of trees, 235,515 units, we multiplied that value
production by the fodder production (kg) of the species Fraxinus excelsior.
A Sustainable Asset Valuation (SAVi) of Welkenraedt’s Nature-based Infrastructure l Page 31 of 77You can also read