GREENHOUSE GAS MANAGEMENT PLAN - City of Edmonton 2019 - 2030 Civic Operations
←
→
Page content transcription
If your browser does not render page correctly, please read the page content below
GREENHOUSE GAS
MANAGEMENT PLAN

City of Edmonton
2019 - 2030 Civic Operations
City of Edmonton Greenhouse Gas Management Plan                                                          Page 2
2019-2030 Civic Operations

Report prepared by:                               Energy Transition, City Environmental Strategies

                                                  Integrated Infrastructure Services
                                                           Facility Engineering
                                                           Facility Planning and Design
                                                           Lifecycle Management
                                                           Office of Energy Management

                                                  Urban Form and Corporate Strategic Development
Technical support from:
                                                           Safety Codes Permits and Inspection

                                                  City Operations
                                                           Client and Vendor Services (Fleet Services)
                                                           Signals and Street Lighting
                                                           Special Projects (Edmonton Transit)
                                                           Technical Services (Waste Services)

External Subject Matter Support and Reviewer:     Stantec Inc.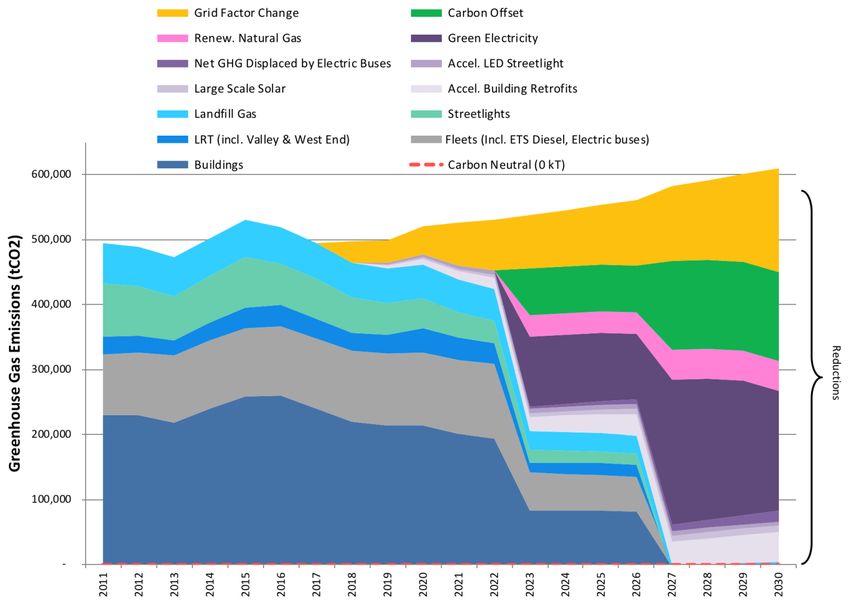
City of Edmonton Greenhouse Gas Management Plan                                                                  Page 3
2019-2030 Civic Operations

Table of Contents
List of Tables                                                                                                          5
List of Figures                                                                                                         7
Executive Summary                                                                                                       9
1.     Purpose                                                                                                      12
     1.1.       Background, Mandate and Strategic Alignment for Developing the Plan                                 12
2.     Principles & Approaches Used to Develop This Plan                                                            15
3.     The Cost of Carbon                                                                                           16
4.     Description of the City’s reporting program                                                                  18
5.     Review of the City of Edmonton’s Civic Operations Energy Assets                                              19
6.     Baseline Greenhouse Gas Emissions Forecast                                                                   21
7.     Cost Benefit Analysis Findings                                                                               23
     7.1.       A Consistent Cost Benefit Approach                                                                  23
       7.1.1.      Cost Benefit of Building Energy Retrofits                                                        23
       7.1.2.      Comparative Lifecycle Cost Benefit between various Carbon Abatement options                      25
     7.2.       Limitations of Cogeneration                                                                         28
     7.3.       Uncertainty of future cost of electric buses                                                        28
     7.4.       Uncertainty in availability of incentives                                                           29
     7.5.       Sensitivity Analysis                                                                                29
8.     Greenhouse Gas Reduction Target Scenarios                                                                    31
     8.1.       Background on green electricity procurement                                                         31
     8.2.       Scenario 1: 30% below 2005 by 2030                                                                  32
     8.3.       Scenario 2: 50% below 2005 by 2030                                                                  34
     8.4.       Scenario 3: Carbon Neutral                                                                          37
       8.4.1.      Discussion on viability of Renewable Natural Gas and Carbon Offsets and Preliminary Cost Estimates
                   40
9.     Enabling Change                                                                                              42
     9.1.       Electrification of City fleets                                                                      43
10.         From Concept to Implementation – Steps Towards Implementation of An Action Plan                         45
Appendix A: EPCOR 2016 Inventory                                                                                    49
Appendix B: Asset-specific Forecasts under Business As Usual                                                        50
Appendix C: Guiding Procurement Principles and Operationalization Considerations for Green Electricity              56
Appendix D: Greenhouse Gas Reduction Target Scenarios – Data Tables                                                 58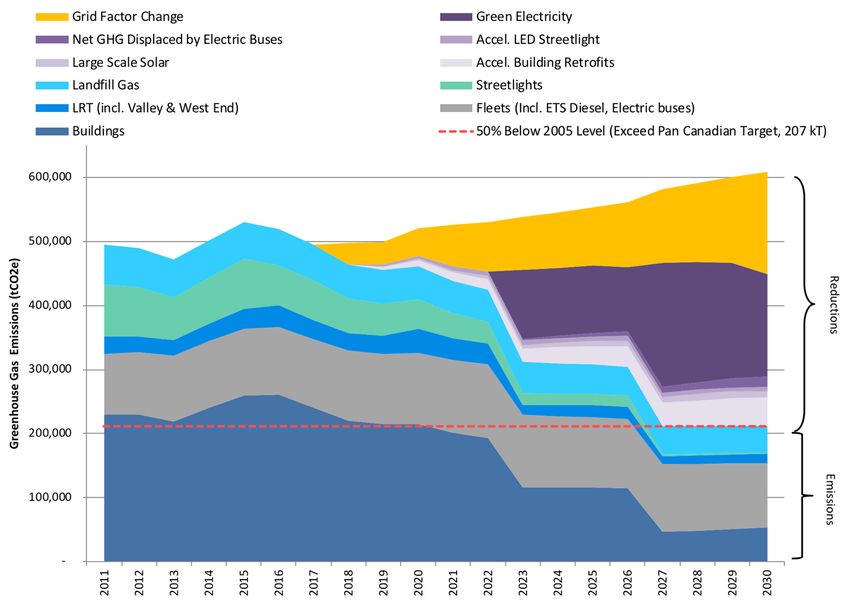
City of Edmonton Greenhouse Gas Management Plan               Page 4
2019-2030 Civic Operations

Appendix E: Lifecycle Cost Benefit Methodology and Findings      60
Appendix F: Sensitivity Analysis                                 80
Appendix G: Glossary and Equations                               84
Appendix H: Social Cost of Carbon                                86
City of Edmonton Greenhouse Gas Management Plan                                                               Page 5
2019-2030 Civic Operations

List of Tables
Table 1: Energy Use by Fuel Type Consumed and City of Edmonton Asset Type (2016)                                 19

Table 2: GHG Emissions and Reductions by Fuel Type Consumed and City of Edmonton Asset Type, tCO2e (2016) 20

Table 3: Anticipated Business As Usual Greenhouse Gas Reductions from City of Edmonton Civic Operations          21

Table 4: Summary of Findings from Review of Recent Building Energy Audits                                        24

Table 5: Proposed Initiatives to Achieve a Reduction of 30% Greenhouse Gas Emissions below 2005 levels by 2030
     from City of Edmonton Civic Operations                                                                  32

Table 6: Budgetary Requirements and Lifecycle Cost Benefit of Additional Initiatives to Achieve a 30% Reduction in
     GHG Emissions below 2005 levels by 2030                                                                     33

Table 7: Additional Initiatives to Achieve a GHG Reduction of 50% Below 2005 Levels by 2030 (Scenario 2)         34

Table 8: Budgetary Requirements and Lifecycle Cost Benefit of Proposed Incremental Greenhouse Gas Reduction
     Initiatives to Achieve a 50% below 2005 Levels by 2030 (Scenario 2)                                    35

Table 9: Green Electricity Purchase - Potential Phased Approach goal 100% Coverage of 2030*                      36

Table 10: Proposed Incremental Greenhouse Gas Reduction Initiatives to Achieve Carbon Neutrality by 2030         37

Table 11: Budgetary Requirements and Lifecycle Cost Benefit of Proposed Incremental Greenhouse Gas Reduction
     Initiatives to Achieve Carbon Neutrality for City operations by 2030                                  38

Table 12: Green Electricity, Renewable Natural Gas, & Carbon Offsets- Phased Approach*                           39

Table 13: City Fleet Composition, 2016                                                                           43

Table 14: 2016 Emissions by Asset Type                                                                           49

Table 15: 2016 Emissions by Business Area                                                                        49

Table 16: 2016 Energy Use Raw Data by Asset Type                                                                 49

Table 17: Forecast of Annual Civic Operations Greenhouse Gas Emissions– Business-As-Usual Scenario               50

Table 18: Building Emissions                                                                                     51

Table 19: Fleet Emissions                                                                                        52

Table 20: Street Light Emissions                                                                                 53

Table 21: Landfill Gas Degradation                                                                               54

Table 22: Forecast of Annual Greenhouse Gas Emissions Reductions– 30 Percent Reduction Scenario                  58

Table 23: Forecast of Annual Greenhouse Gas Emissions Reductions– 50 Percent Reduction Scenario Increased
     Green Electricity Purchase                                                                                  58

Table 24: Forecast of Annual Greenhouse Gas Emissions Reductions – Carbon Neutral Scenario                       59

Table 25: EDC Associates Price Forecast for Energy Cost and Estimated Total Electricity Price (Energy and Delivery)
     Forecast for City of Edmonton                                                                                62

Table 26: Total Natural Gas and Vehicle Fuel Price Forecast                                                      63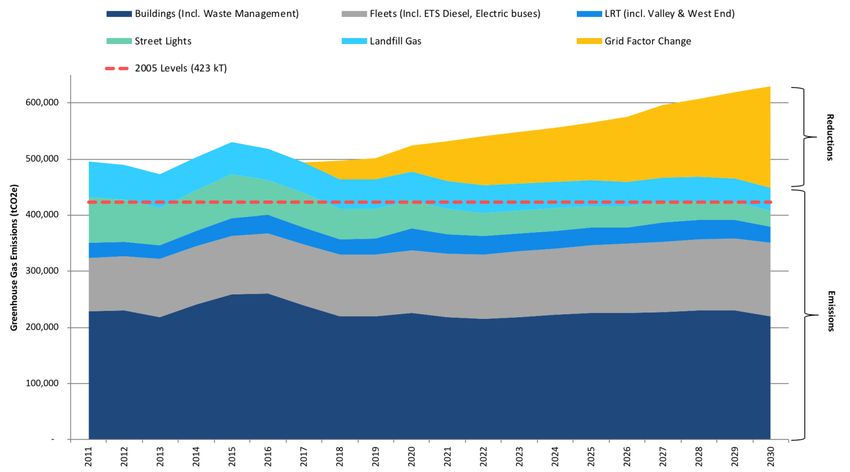
City of Edmonton Greenhouse Gas Management Plan                                                                 Page 6
2019-2030 Civic Operations

Table 27: Forecasted Emissions of Electricity Grid                                                                 64

Table 28: Carbon Levy Rates                                                                                        65

Table 29: Carbon Levy Impact on Fuel Price for 2017 vs 2018                                                        65

Table 30: Average Percent breakdown of GHG Reduction Between Electricity and Natural Gas Based on
     Recommended Measures from the Building Audits                                                                 67

Table 31: Building Energy Retrofit Energy Audit Extrapolation Summary                                              67

Table 32: Summary of Findings From Recent Energy Audits of City Buildings                                          68

Table 33: Cogeneration Energy Greenhouse Gas Savings Percentage                                                    72

Table 34: Cogeneration Energy Greenhouse Gas Savings                                                               72

Table 35: LED Streetlight Energy Greenhouse Gas Savings Percentage                                                 73

Table 36: LED Streetlight Energy Greenhouse Gas Savings                                                            73

Table 37: Solar PV Carbon Reductions Calculations                                                                  74

Table 38: Electric Bus Assumptions                                                                                 75

Table 39: Electric Bus Carbon Reductions Calculations                                                              75

Table 40: Discounted Payback Period (Note: in case of blank value, payback exceeds life of measure)                80

Table 41: Rate of Return (Based on Discounted Payback) (Note: in case of blank value, payback exceeds life of
     measure)                                                                                                      80

Table 42: FROI Net Present Value to Cost Ratio                                                                     81

Table 43: Net Present Value per tCO2e Over 20 Years                                                                82

Table 44: Social Cost of Carbon (Modified from: Environment and Climate Change Canada)                             86
City of Edmonton Greenhouse Gas Management Plan Page 7
2019-2030 Civic Operations
List of Figures
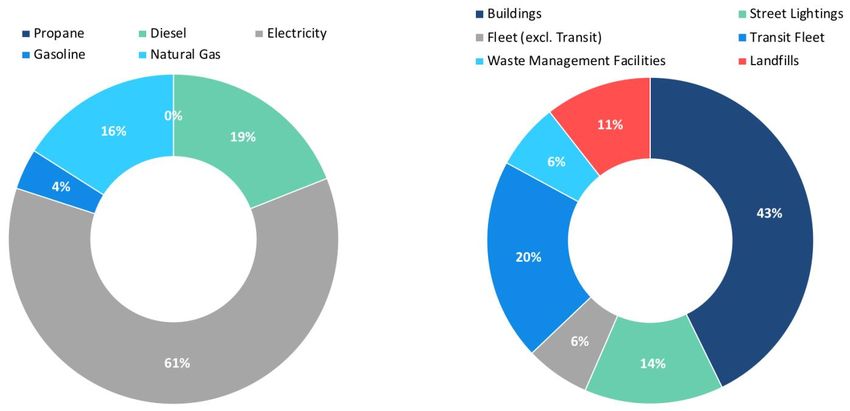
Figure 1: Percent Breakdown of Energy Use by Fuel Type and by GHG by Asset Type (2016) 19
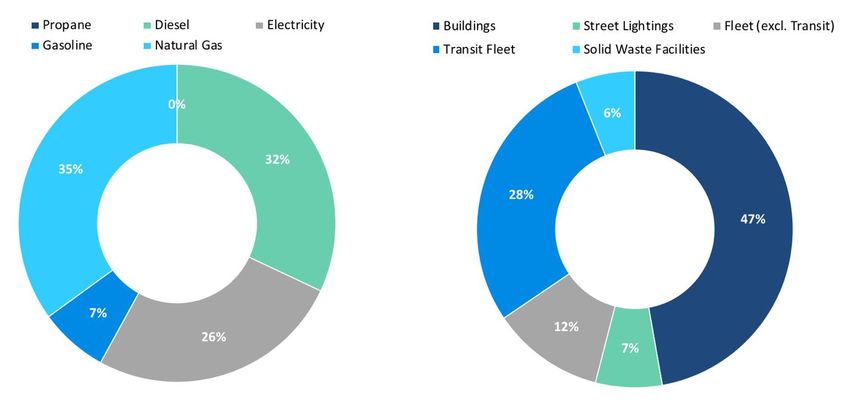
Figure 2: GHG Emissions Percent Breakdown by Fuel Type and by Asset Type (2016) 20
Figure 3: Forecast of Annual Greenhouse Gas Emissions – Business-As-Usual Scenario 22
Figure 4: Lifetime Greenhouse Gas Reduction Potential of Various City Buildings Based on Audit Recommended
Energy Upgrades 25
Figure 5: Simple Payback Periods of various Carbon Abatement Options 26
Figure 6: Rate of Return (based on discounted payback) of Various Carbon Abatement Options 26
Figure 7: Net Present Value Benefit to Cost Ratio of Various Carbon Abatement Options 27
Figure 8: Unit Lifecycle Cost Benefit (NPV) of Various Carbon Abatement Options versus Social Cost of Carbon 28
Figure 9: Sensitivity Analysis Results for Net Present Value Benefit to Cost Ratio 30
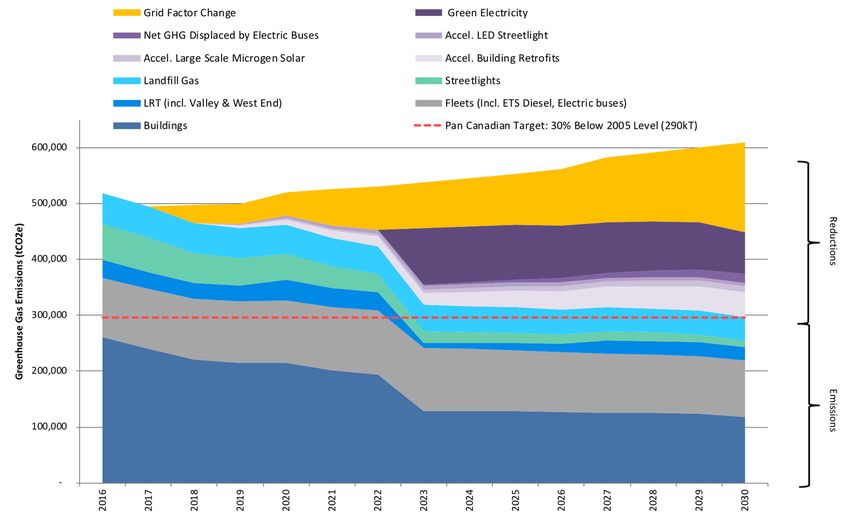
Figure 10: Forecast of Annual Greenhouse Gas Emissions – 30 Percent Reduction Scenario 34
Figure 11: Forecast of Annual Greenhouse Gas Emissions – 50 Percent Reduction Scenario 2: Increased Green
Electricity Purchase 37
Figure 12: Forecast of Annual Greenhouse Gas Emissions – Carbon Neutral Scenario 40
Figure 13 - Building Emissions 50
Figure 14: Fleet Emissions 52
Figure 15: Street Light Emissions 53
Figure 16: Landfill Gas Degradation 54
Figure 17: Total Electricity Price (Energy and Delivery) Forecast for City of Edmonton 62
Figure 18: Emissions Intensity of Grid Factor Over Time 64
Figure 19: Frequency of Suggested Energy Conservation Measure in Energy Studies Analyzed 69
Figure 20: Energy & Reduction potential based on Study Recommended ECMs 69
Figure 21: Simple Payback Period of Suite of Measures in Each Facility Studied 70
Figure 22: FROI Benefit to Cost Ratio of Suite of Measures in Each Facility Studied 70
Figure 23: Unit Net Present Value Benefit Over 20 Years of Suite of Measures in Each Facility Studied 71
Figure 24: Carbon Abatement Costs 76
Figure 25: Simple Payback Periods of Various Carbon Abatement Options 77
Figure 26: Discounted Payback of Various Carbon Abatement Options 77
Figure 27: Net Benefit over 20 Years of Various Carbon Abatement Options 78
Figure 28: NPV Benefit to Cost Ratio Over 20 years of various Carbon Abatement Options 78
Figure 29: Rate of Return of Various Carbon Abatement Options 79City of Edmonton Greenhouse Gas Management Plan Page 8
2019-2030 Civic Operations
Figure 30: Discounted Payback Period (Note: in case of blank value, payback exceeds life of measure) 80
Figure 31: Rate of Return (Based on Discounted Payback) (Note: in case of blank value, payback exceeds life of
measure) 81
Figure 32: Net Present Value to Cost Ratio 82
Figure 33: Unit Net Present Value Benefit Over 20 Years 83
Figure 34: Social Cost of Carbon 87City of Edmonton Greenhouse Gas Management Plan Page 9
2019-2030 Civic Operations
Executive Summary
Scientific evidence shows that Earth’s climate is changing, with the primary cause being the surge in greenhouse
gas (GHG) emissions from human activity. In response to this challenge, countries and cities around the world are
setting targets and developing plans to reduce their GHG emissions. Most notably, G7 countries have
recommended that all developed countries should reduce emissions by 80 per cent or more by 2050. This City of
Edmonton Greenhouse Gas Management Plan 2019-2030 Civic Operations is a response to the global threat of
climate change. Its mandate comes from a number of City Council directives including: (a) a goal in The Way We
Green for Edmonton to become “a carbon-neutral city”; (b) Strategic Action 6.10.1 contained in The Way We Green
that directs the City of Edmonton to establish, implement and maintain “a [civic operations] Greenhouse Gas
Management Plan aimed at significantly reducing greenhouse gas emissions from City operations”; and (c)
Strategic Direction 4 contained in Edmonton’s Community Energy Transition Strategy (C585) that the City of
Edmonton will take a lead role in supporting Edmonton’s energy transition efforts, including leading-by example in
its own civic operations; (d) alignment with the Pan Canadian Framework on Clean Growth and Climate Change, a
comprehensive, multi-sectoral plan to meet interim 2030 targets of 30% reduction below 2005, as a part of
demonstrating Canada’s commitment to The Paris Agreement and its 2050 targets; and (e) alignment with the
Edmonton Declaration’s commitments for Greenhouse Gas planning and reporting. This plan “leads by example”
— adopting and demonstrating high standards of sustainable, energy conserving, climate change mitigation
practices that are encouraged throughout the community.
This plan proposes three GHG reduction scenarios by 2030, each with accompanying conceptual capital and
operating budgetary requirements covering the next three 4-year budget cycles:
Scenario One: Achieve 30% below 2005 levels by 2030. This target scenario is the minimum
acceptable scenario and would align with the Government of Canada’s Pan Canadian Framework for
Clean Growth and Climate Change’s 2030 target; (a 153,000 tonne reduction by 2030);
Scenario Two: Achieve 50% below 2005 levels by 2030. (a 237,000 tonne reduction by 2030);
Scenario Three: Achieve carbon neutrality for all of City operations, a highly conceptual scenario. (a
449,000 tonne reduction by 2030)
For each target scenario, the plan proposes different levels of deployment of the following greenhouse gas
mitigation options above and beyond business as usual. These options include:
Accelerated building energy retrofits;
Accelerated deployment of microgeneration solar photovoltaics on City buildings and sites;
Accelerated LED street lights replacements;
Replacement of diesel buses with electric; and
The purchase of renewably generated (green) electricity.
The recommended portfolio of options are supported by best available data and information on capital
requirements, lifecycle cost benefit analysis, and further informed by extensive input and advice from corporate
project planning, design, engineering, and project delivery staff. The recommended options reflect ambitious but
achievable rates of increased deployment that considers various constraints and minimization of impacts and
disruptions to City services and programming.
The rigorous analysis and consultation used in developing this report found that the business case actions from a
Financial Return on Investment (FROI) standpoint, ranging from strongest to weakest, were building energyCity of Edmonton Greenhouse Gas Management Plan Page 10 2019-2030 Civic Operations retrofits, LED street lights, electric buses, large microgeneration solar photovoltaics, and renewable (green) electricity investment. All of the options related to investing in City assets have positive net present value benefits over a 20 year period from a FROI standpoint. Only green electricity, green natural gas and carbon offsets have negative NPVs, as they are simply premiums paid over a specific period. These premiums were estimated based on the key principles outlined in Appendix C. Analysis and consultation determined that building retrofits, although having a very strong lifecycle cost benefit, has a deployment rate that is largely impacted and constrained by the need to minimize building shutdown periods and disruption to City services and programming. Secondly, the analysis showed that the average building energy retrofit can only reasonably achieve a 35% GHG reduction. The same types of issues (e.g., scalability, deployability, impact on internal capacity and resources) are true for solar photovoltaics, electric buses, and to a lesser extent LED street lights. The purchase of green electricity from off-site wind and solar farms was the best option for aggressive reductions in the City’s GHG emissions, and the least impacted by the above mentioned constraints. It cannot be emphasized enough that a portfolio of options is needed to achieve even the minimum acceptable GHG reduction target of 30% below 2005 levels by 2030. Of all of the carbon abatement options proposed, the future cost of electric buses is considered the most uncertain due to this technology being in the early stages of market transformation. This is as compared to building retrofits, LED street lights and even solar photovoltaics which are considered mature technologies (e.g., soft project or labour costs becoming more of a dominant cost driver than hard costs of the technologies) and for which hard prices are not expected to experience substantial decreases in future years. The incremental difference in capital between electric and diesel buses will narrow and eventually reach parity. But it is uncertain how quickly this will happen. The current incremental capital estimates in the cost analysis is quite conservative in that future decreases in incremental cost have not been incorporated.
City of Edmonton Greenhouse Gas Management Plan                                                                                        Page 11
2019-2030 Civic Operations

                TOTALS OVER
   GHG
                    THREE                                     LED                                      GREEN
REDUCTION                          BUILDING      SOLAR                 ELECTRIC       GREEN                          CARBON
                   BUDGET                                   STREET                                    NATURAL                       TOTAL
  TARGET                           RETROFIT        PV                    BUS        ELECTRICITY                      OFFSETS
                    CYCLES                                   LIGHT                                      GAS
 SCENARIO
                  (2019-30)
                 Tonnes GHG
                                    45,000       10,000      5,500      17,800         72,900              -             -         151,200
                   reduced
 Scenario 1
                 Capital Costs      $80M          $46M       $20M      $194M               -               -             -          $340M
                                  Minimal with respect to ongoing operating of
 30% below                                                                            Starting in                                 Starting in
                  Operating       assets. 15 to 25% internal resource needs on
    2005                                                                                2023:              -             -          2023:
                   Cost*          PM side already accounted for within Capital
  (153,000                                                                             3.9M/yr                                    $3.9M/yr
                                                      Costs
   tonnes)
                  FROI NPV
                                    $105M         $9M        $25M        $52M          -$61M               -             -          $130M
                    Benefit
                 Tonnes GHG
                                                                                       169,000             -             -         247,000
                   reduced
 Scenario 2
                 Capital Costs                                                             -               -             -          $340M
 50% below
                                                                                                                                   By 2030:
    2005          Operating              Same as 30% reduction scenario               By 2030:
                                                                                                           -             -        $9.75M/yr
  (237,000         Costs**                                                           $9.75M/yr
   tonnes)
                  FROI NPV
                                                                                       -$115M              -             -          $76M
                    Benefit
                 Tonnes GHG
                                    60,000       15,000      5,500      17,800         159,000         49,000        136,000       442,300
                   reduced
                 Capital Costs      $106M        $69M                                      -               -             -          $389M
 Scenario 3
                                  Minimal with respect
                                  to ongoing operating
   Carbon                                                       Same as 50%
                                   of assets. 15 to 25%
 Neutral***       Operating                                  reduction scenario       By 2030:                      By 2023:       $19.1M-
                                     internal resource                                               By 2030:
  (449,000         Costs**                                                           $9.75M/yr                      $6.8M/yr      $30.5M/yr
                                    needs on PM side                                                 $4.8M-
   tonnes)
                                  already accounted for                                              $8.7M/yr
                                   within Capital Costs
                   FROI NPV                                     Same as 50%                            -$95 to                    -$154M to
                                    $140M        $13M                               -$115M                            -$98M
                    Benefit                                  reduction scenario                        -$171M                       -$78M

Assumptions based on one conceptual Green Electricity Purchase example:
*One 20 year contract starting in 2023, electricity consumption coverage of ~40% assumed to be a 50/50 split of wind and solar. Operating costs
include existing $1.5M base budget for green electricity purchases.
**Multiple 20 year electricity contracts. The first with incrementally increasing funds up until 2023. The second two in 2023 and 2027 are
constant amounts each year. Operating costs include existing $1.5M base budget for green electricity purchases.
*** Carbon neutral refers to the overall scenario target not a specific aspect of the plan such as carbon neutral buildings.
***Multiple (three) 20 year electricity contracts. The first with incrementally increasing funds up until 2023. The second two in 2023 and 2027
are constant amounts each year; One 20 year renewable natural gas contract starting in 2027, 100% coverage; One 20 year carbon offset
contract starting in 2027; coverage of all remaining greenhouse gas emissions.
City of Edmonton Greenhouse Gas Management Plan Page 12
2019-2030 Civic Operations
1. Purpose
The purpose of this plan is to propose a comprehensive strategy and action plan for reducing greenhouse gas
(GHG) emissions from The City of Edmonton’s civic operations and contributing to Edmonton’s long-term goal of
carbon-neutrality. The various initiatives proposed in this plan (and their underlying assumptions) have been
reviewed and verified by an external consultant — Stantec Inc.
1.1. Background, Mandate and Strategic Alignment for Developing the
Plan
Since approval of the City of Edmonton’s Strategic Plan - The Way Ahead by City Council in 2009, climate
change mitigation through reduction of civic operations and community GHG emissions has been a part of the
City Administration’s mandate. Since July 2010, GHGs from City operations has been one of the performance
measures reported under Corporate Outcome 8: The City of Edmonton’s Operations is Environmentally
Sustainable.
Furthermore, on July 20, 2011, Edmonton City Council approved The Way We Green plan which included: a) a
goal for Edmonton to become “a carbon-neutral city” and b) Strategic Action 6.10.1 directing the
Administration to establish, implement and maintain “a City Operations Greenhouse Gas Management Plan
aimed at significantly reducing greenhouse gas emissions from City operations.”
Implementation of The Way We Green led to development of a detailed strategic framework and action plan
to mitigate climate change and reduce community greenhouse gas emissions between 2012 and 2014. The
result was Edmonton’s Community Energy Transition Strategy, community targets in terms of greenhouse gas
emissions reductions, energy efficiency and resilient energy systems for 2035, and a detailed 8 Year Action
Plan - approved by City Council in April 2015.
Both The Way We Green and Edmonton’s Community Energy Transition Strategy instruct the City to “lead by
example” to achieve its sustainability and resilience goals, and recognizes that the City must model the way for
sustainable living that it wants to encourage in the community.
The city has “lead by example” by developing the Change for Climate Edmonton Declaration (2018) which
commits to “establishing, implementing, and maintaining GHG inventories, targets, action plans and reporting
mechanisms consistent with the Paris Agreement and commitments made through the Global covenant of
Mayors for Climate and Energy”.
The city has also lead by example in development of transformational initiatives including:
Development of Blatchford which will turn 535 acres in the heart of Edmonton into one of the world’s
largest sustainable communities. The neighbourhood will create an opportunity for 30,000 residents
to live a unique and sustainable lifestyle. The community will incorporate best practices for
sustainable urban design including increasing density; prioritizing design that promotes walking,
cycling or transit; creating a mix of housing, retail, commercial and public spaces; and incorporating
significant park and green spaces.
Support for a Downtown District Energy system. In 2017, ENMAX released a Design Basis DocumentCity of Edmonton Greenhouse Gas Management Plan Page 13
2019-2030 Civic Operations
that outlines the design, construction, and operation of a potential Downtown District Energy System
(DES), which would provide cost-effective and environmentally responsible thermal energy to
individual buildings in the downtown core. City Council has approved additional funding to further
advance the design of this system in order to make informed decisions on the potential future
construction of this system. Additional work being conducted in 2018 will also include assessment of
City buildings, in the area of the District Energy system, for deep green retrofits that would
compliment a possible district energy system.
The new City of Edmonton Greenhouse Gas Management Plan (2019-2030 Civic Operations) was developed in
accordance with the implementation of the Edmonton’s Community Energy Transition Strategy and 8 Year
Action Plan, specifically under Tactic 4.7.15B: Update the City Operations Greenhouse Gas Management Plan.
The main drivers for the need to update the 2012 Plan include:
Changes in inventory and reporting best practices recommends the inclusion of GHG emissions from
public transit assets and operations. These GHG emission sources were excluded in previous
municipal / public section greenhouse gas inventory protocols and therefore management plans. The
2012 Plan was developed based on the ICLEI International Local Government GHG Emissions Analysis
1
Protocol (IEAP) (Version 1.0, October 2009) . However, since the development of the 2012 Plan, the
older protocol has become obsolete and been replaced by The Climate Registry (TCR) General
2
Reporting Protocol (Version 2.1, January 2016) as the best practice for local government greenhouse
gas emissions quantification and reporting.
Strengthening the alignment with emerging federal and provincial policies and programs.
o Pan Canadian Framework: To demonstrate Canada’s commitment to the Paris Agreement,
the federal government led the collaborative development of The Pan Canadian Framework
for Clean Growth and Climate Change - a collective plan to grow the economy while reducing
emissions and building resilience to adapt to a changing climate. The plan aims to reduce
greenhouse gas emissions by 30% below 2005 by 2030 and was endorsed by eight provinces
(including Alberta) and three territories in fall 2016. The City’s 2012 Plan has a baseline year
of 2008.
o Alberta’s Climate Leadership Plan; and Renewable Electricity Plan (REP): Alberta’s Climate
Leadership Plan provides both a framework and funding sources through the introduction of
the carbon levey to accelerate climate change action in the province. The REP is expected to
add 5,000 megawatts of renewable electricity capacity by 2030, enable accelerated shut-
down of coal fired generation and will put Alberta on a path to achieve its target of 30%
renewable electricity by that time.
The Way Ahead Renewal: Includes review and update of corporate outcomes, performance
measures, and targets; an opportunity to affirm Council commitment to climate change mitigation;
1
ICLEI. 2009. International Local Government GHG Emissions Analysis Protocol (IEAP) (Version 1.0, October2009)
http://archive.iclei.org/fileadmin/user_upload/documents/Global/Progams/CCP/Standards/IEAP_October2010_color.pdf
2
The Climate Registry. 2016.General Reporting Protocol for the Voluntary Reporting Program. (Version 2.1, January 2016)
http://www.theclimateregistry.org/tools-resources/reporting-protocols/general-reporting-protocol/
The Climate Registry. 2010. Local Government Operations (LGO) Protocol for the Quantification and Reporting of Greenhouse Gas Emissions
Inventories (Version 1.1, May 2010). https://www.arb.ca.gov/cc/protocols/localgov/pubs/lgo_protocol_v1_1_2010-05-03.pdfCity of Edmonton Greenhouse Gas Management Plan Page 14
2019-2030 Civic Operations
Better data and information; changing technologies; improved internal processes: improved energy
management platform, routine building energy audits to support improved integration of energy
retrofits with routine capital rehabilitation program, greater understanding and industry capacity of
building energy modeling for existing buildings; emerging technologies like electric buses, along with
dramatic price decrease in technologies like solar photovoltaics, LED lighting, etc.
Based on the drivers outlined above and the Energy Transition Plan’s strategic direction of dynamic steering,
this compels Administration to review and revise dated assumptions and previous cost benefit results that no
longer apply.City of Edmonton Greenhouse Gas Management Plan Page 15
2019-2030 Civic Operations
2. Principles & Approaches Used to Develop This Plan
This plan applies the following approaches, including but not limited to those proposed in The Way We Green and
Edmonton’s Community Energy Transition Strategy:
Acknowledge that there is an environmental cost to emitting carbon dioxide that is not reflected in
traditional economic models and pricing systems; (Refer to Section 3: The Cost of Carbon)
Apply best management practices to ensure its investment and operating decisions are informed by
triple-bottom-line analyses, financial lifecycle analyses to understand cost and benefits of investment
options over their life spans including cost of carbon and other externalities in these analyses; and
application of consistent, conservative methodologies for estimating future energy prices.
Recommends a hierarchical investment approach that where possible, prioritizes in the following order
“Avoid” (avoiding wasteful energy and carbon-intensive practices and/or purchasing or construction of
new assets), “Reduce” (improve energy efficiency), “Replace” (replacing high carbon energy sources with
low carbon sources) and “Offset” (where action is taken to reduce GHG emissions in one place to offset
emissions that occur elsewhere).
Use a dynamic / adaptive steering approach. As we proceed with the civic operations GHG Management
Plan, we understand the need for flexibility. While the initiatives outlined in this Plan represent our best
solutions today, we expect the solutions will evolve over time as: (a) new technologies and information
emerge and/or (b) social, economic and environmental conditions change. As such, the Plan applies a
phased and flexible approach to GHG management, careful not to place all “eggs in one basket” nor take
high risk positions that could lock in sub-optimal solutions. Moreover, it calls for a dynamic steering
approach that includes: (a) continual surveillance of risks, opportunities and performance, (b) timely
feedback loops, (c) continual evaluation of next-steps and (d) ability to alter course quickly as new
information and opportunities emerge
Collaborative, integrated implementation approach. This plan was developed through a year long
collaborative process not only with those involved in planning, design and delivery of infrastructure
projects, but also with key internal City stakeholders involved in delivery of essential community building,
social / cultural / recreational programming as well as emergency services. This plan was developed in
recognition that GHG emissions reductions must be carried out in a balanced manner that considers and
addresses impacts to the quality and level of services and programming that the City provides to its
citizens.City of Edmonton Greenhouse Gas Management Plan Page 16
2019-2030 Civic Operations
3. The Cost of Carbon
How much should the City of Edmonton be willing to pay to reduce or avoid a tonne of GHG emission? This
complex question is being considered by organizations around the world. The key point of agreement is that GHG
emissions cause a wide range of damage that is not reflected or compensated for in the price of the fossil fuel
3
consumed. It is argued that these externalities should, in some way, be factored into the policy and investment
decisions made by organizations, including local governments. Incorporating a “social cost of carbon” into cost
benefit analysis is an approach that can be used to internalize these costs.
4
Environment Canada describes the concept and derivation of the Social Cost of Carbon:
“The Social Cost of Carbon (SCC) is a term used to describe an estimate of the monetary value in a given
year of worldwide damage that will occur over the coming decades and centuries from emitting one
additional tonne of carbon dioxide (CO2) emissions. Specifically, the SCC represents the marginal damage
of an additional tonne of CO2 emitted into the atmosphere in a given year, expressed in dollars, based on
an assumed global CO2 emissions path.
To calculate the SCC, it is necessary to project the impacts of the assumed global CO2 path on the climate
(e.g., temperature, precipitation and weather events). It is then necessary to determine the physical
impacts associated with those climate impacts (e.g., sea levels, agriculture, forests, water availability,
pests). An economic value then needs to be placed on the physical impacts to generate a monetary value
for the emission.
Once the SCC values are generated, multiplying the appropriate SCC value for a given year by the total
expected CO2 emissions reductions (or increases) for that year, and then summing the discounted values
over the time period considered for analysis, allows these GHG benefits (or costs) to be considered within
cost-benefit analysis…
The SCC values increase over time, as emissions accumulate in the atmosphere and the cost associated
with an additional tonne of CO2 emissions increases.”
Although an internal social cost of carbon has not been established and formally adopted by the City of Edmonton
for use in triple bottom line lifecycle cost benefit analysis and decision making processes, the concept of SCC is
applied to the cost benefit analysis supporting this Plan.
The Unit Net Present Value Cost or Benefit (per tonne of carbon abated over the lifespan of the abatement
th
measure) of various options is compared to the Net Present Value 50 (reflecting average probable climate change
th
impacts) and 95 percentile SCC values (reflecting lower probability, worst case, high-cost climate change impacts)
for 2019 and 2030 to indicate whether the investment makes sense from a Sustainable Return on Investment
perspective over those future 12 years. If the Unit Net Present Value Cost or Benefit of a particular option is less
costly than the SCC value, it makes sense to proceed. If the Unit Net Present Value Cost or Benefit of a particular
3
An externality is a cost or benefit conferred upon an agent who was not part to the transaction. The presence of externalities leads to a sub-
optimal allocation of resources as the full costs to society are not taken into account in agents’ decision making.
4
Environment and Climate Change Canada. 2016. Technical Update to Canada’s Social Cost of
Greenhouse Gas Estimates March 2016.City of Edmonton Greenhouse Gas Management Plan Page 17 2019-2030 Civic Operations option is more costly than the SCC value, it means it may not be the most appropriate to invest in that particular option at this time from a climate change mitigation perspective. That said the SCC does not consider other desired outcomes of advancing energy efficiency and clean growth such as promoting local economic diversification, improving economic productivity and competitiveness, etc.
City of Edmonton Greenhouse Gas Management Plan                                                                              Page 18
2019-2030 Civic Operations

4. Description of the City’s reporting program
To estimate GHG emissions, from corporate operations, the City applies the TCR Local Government Operations
(LGO) Protocol for the Quantification and Reporting of Greenhouse Gas Emissions Inventories (Version 1.1, May
2010) (the TCR Protocol). The TCR Protocol identifies a number of GHG emissions sources that should be included
in a municipal government’s GHG Inventory.

                                                                                                         5
              Buildings Emissions: Includes GHG emissions from owned and leased facilities where the City pays utility
              costs.

              Fleet Emissions: Includes emissions from all vehicles operated by City departments, including Transit
              operations.

              Streetlights Emissions: Includes greenhouse gas emissions from electricity used to power roadway lights,
              traffic lights and signals, lane lights, security lights, and miscellaneous lighting throughout Edmonton.

              Landfill Emissions: Includes emissions from three landfills that are owned by the City of Edmonton:
              Beverly Landfill (Rundle Park), South Side (Millwoods Golf Course) and Clover Bar Landfill.

              Water and Wastewater Treatment and Drainage Emissions: Emissions from water and water treatment,
              and drainage are not included in the City of Edmonton’s inventory given that responsibility for these
              operations resides with EPCOR. Based on legal review, EPCOR, although a corporation wholly owned by
              The City of Edmonton, has a governance structure that might not meet the protocol’s definition of
              “operational control”. EPCOR has reported its energy use and GHG emissions voluntarily to the City.
              EPCOR will establish a GHG Management Plan with associated policy, procedures, action plans, reduction
              targets, and performance metrics. The reduction targets and performance metrics associated with Water,
              Wastewater, and Drainage in the City of Edmonton will be brought forward to City Council for approval as
              part of the Performance Based Rates (“PBR”) application process. Capital projects and operating activities
              required to achieve the reduction targets will be brought forward in PBR applications or potentially as a
              Non-Routine Adjustment (“NRA”) when significant reduction opportunities are identified outside the PBR
              cycle. The various reduction scenarios presented in the management plan excludes emissions from
              EPCOR.

              Green Electricity: includes displacement of electricity consumed by the corporation through the purchase
              of renewable energy credits. Section 8.1 of this report provides greater detail on green electricity. The
              purchase of green electricity from off-site wind and solar farms is the single most cost efficient (from an
              intial cost perspective) and expedient option for aggressive reductions of the City’s GHG emissions, and
              the least impacted by the constraints of city operations noted throughout this report.

5
    This could include facilities where the City is the leasee (Scope 1 or 2 emissions) or the leasor (Scope 3 emissions).
City of Edmonton Greenhouse Gas Management Plan Page 19
2019-2030 Civic Operations
5. Review of the City of Edmonton’s Civic Operations Energy
Assets
Table 1 and Table 2, and Figure 1 and Figure 2 below present quantities and percent breakdowns of the energy use
and GHG emissions by fuel type and City asset type.
Table 1: Energy Use by Fuel Type Consumed and City of Edmonton Asset Type (2016)
GASOLINE
ASSET TYPE ELECTRICITY (KWH) NATURAL GAS (GJ) DIESEL (GJ) TOTAL (GJ)
(GJ)
Buildings 165,613,385 1,318,717 - - 1,914,925
Street Lights 76,611,562 - - - 275,802
6
Fleet 34,688,303 - 221,225 1,123,893 1,470,042
Waste Management
28,585,597 142,534 6,125 143,066 394,646
Facilities*
Water & Wastewater
Included in EPCOR’s energy use and GHG inventory (Appendix A)
Treatment
Drainage** 5,910,361 48,091 16,740 31,893 118,033
Total 311,409,208 1,509,342 244,090 1,298,852 4,173,448
*Includes all Waste Services buildings and fleet related to collections, processing and disposal.
**Drainage energy use and Greenhouse Gas Emissions will be transferred to EPCOR for the 2017 reporting year and are therefore not included in
forecasting and savings estimates.
Figure 1: Percent Breakdown of Energy Use by Fuel Type and by GHG by Asset Type (2016)
Table 2 identifies City assets that both created and reduced emissions in 2016. The City of Edmonton’s urban forest
includes trees and vegetation planted at City-owned properties and right of way, Renewable Energy Certificates
(RECs) are certificates that the City currently purchases to offset its electricity emissions. Further discussion is
provided on RECs in section 8.1 of this report.
6
LRT train operations onlyCity of Edmonton Greenhouse Gas Management Plan Page 20
2019-2030 Civic Operations
Table 2: GHG Emissions and Reductions by Fuel Type Consumed and City of Edmonton Asset Type, tCO2e (2016)
NATURAL CARBON
ASSET TYPE ELECTRICITY GASOLINE DIESEL METHANE TOTAL
GAS DIOXIDE
Emissions
Buildings 157,333 68,675 - - - - 226,008
Street Lightings 72,781 - - - - - 72,781
Fleet (excl. Transit) - - 12,364 19,993 - - 32,357
Transit Fleet 32,954 - 3,516 59,863 - - 96,333
Solid Waste
27,156 7,423 440 10,345 - - 45,364
Facilities
Drainage 5,615 2,504 1,194 2,350 - - 11,663
Landfills - - - - 36,242 - 36,242
Emissions Subtotal 295,839 78,603 17,515 92,551 36,242 - 520,750
Reductions
Urban Forest - - - - - (3,484) (3,484)
Renewable
- - - - - (72,891) (72,891)
Electricity Credits
Total 295,839 78,603 17,515 92,551 36,242 (76,375) 444,375
Figure 2: GHG Emissions Percent Breakdown by Fuel Type and by Asset Type (2016)City of Edmonton Greenhouse Gas Management Plan Page 21
2019-2030 Civic Operations
6. Baseline Greenhouse Gas Emissions Forecast
The Business-As-Usual Forecast assumes the following reductions are already in place through existing City policies
and programs:
Implementation of C532 Sustainable Building Policy;
Completion of $9Million of energy retrofit to City-owned buildings over 2015-18 budget and
Conversion of street light fixtures to LED (approx. 4,000 units/year).
Two other driving factors for decreasing greenhouse gas emission from City operations that are not directly related
to City interventions are the year over year decrease in landfill gas emissions from the City’s 3 closed landfills, and
7
the expected decrease in the carbon intensity of the provincial electricity grid or ‘greening the grid ’ due to the
phasing out of coal plants and developing more renewable energy.
The reductions from these ‘Business As Usual’ factors are summarized in Table 3 below.
Table 3: Anticipated Business As Usual Greenhouse Gas Reductions from City of Edmonton Civic Operations
FIRST YEAR OF RATE OF
TOTAL GHG REDUCED PER YEAR
PROGRAM OR WHEN DEPLOYMENT PER
GHG MITIGATING ACTIONS BY 2030 DUE TO
REDUCTIONS BEGIN TO 4 YEAR BUDGET
IMPLEMENTATION OF THE ACTION
BE REALIZED CYCLE
City Policy C532 Standard -
Minimum 40% better energy and
2021 10 to 15 buildings*; 11,000 tonnes
greenhouse gas savings as
8
compared to Code
1% for on-site energy generation 2021 10 to 15 buildings*; 3,400 tonnes
Energy retrofit of existing buildings 10 to 15 building
2017 10,000 tonnes
during 2015-18 cycle projects**
4,000 units /year of
various street light
LED Street Light Replacement 2012 types (e.g., arterial, 5,100 tonnes
collector, local,
alley)
Total GHG Reduced based on CoE
29,500 tonnes
initiatives
Emissions reduced from closed
8,300 tonnes
City-owned landfills
Emissions reduced from City’s
electricity consumption due to 140,400 tonnes
greening the grid.
Total Reductions not attributed to
148,700 tonnes
CoE initiatives
Total Reductions 178,200 tonnes
* Estimated based on 34 new buildings proposed in the 10 year capital plan; and approx. 50 buildings built between 2005 and 2016 that were
over 500 sq.m. It should be noted that these savings are reductions from the business as usual. New construction will increase the total carbon
emissions of the city however alignment with C532 will reduce these emissions to 11,000 tCO2e less than construction to code.
7
Climate Leadership Plan, https://www.alberta.ca/climate-leadership-plan.aspx
8
2011 National Energy Code for Buildings (as adopted by the Alberta Building Code)City of Edmonton Greenhouse Gas Management Plan Page 22
2019-2030 Civic Operations
**Based on extrapolation of the number of buildings covered by the energy audits, the GHG savings potential of those buildings, the capital cost
of achieving those savings and the 2015-2018 funding for energy retrofits. And confirmed by IIS in completion of the first retrofits that this
savings is reflective of actual savings. Refer to capital cost and carbon abatement potential from the ‘Modified Sample’ in Table 20.
Under the Business-As-Usual Scenario, Civic Operations GHG emissions by 2030 would be 6% higher than in 2005
(Figure 3). The modest increase in greenhouse gas emissions over the next 12 years is predominantly attributed to
the decrease in the carbon intensity of the provincial electricity grid from 1,000 g/kWhr in 2005 to what is
anticipated to be ~420g/kWhr by 2030, based on full implementation of the province’s Renewable Electricity
9
Program . Even under previous grid factor forecasts generated in 2014, prior to change in provincial government,
introduction of the Renewable Electricity Program and no accelerated shutdown of coal, the grid factor was still
expected to decrease to 520 g/kWhr. It should be noted that under this older or worst case scenario, the City’s
civic operations GHG emissions by 2030 would be ~16% higher than in 2005.
Figure 3 presents the emissions forecast based on the business-as-usual scenario.
Figure 3: Forecast of Annual Greenhouse Gas Emissions – Business-As-Usual Scenario
Appendix B provides the asset specific forecasts under the Business As Usual scenario and outlines the
assumptions used to support the projected energy and greenhouse gas emissions up to 2030.
9
Government of Alberta. Renewable Electricity Program. https://www.alberta.ca/renewable-electricity-program.aspxCity of Edmonton Greenhouse Gas Management Plan Page 23
2019-2030 Civic Operations
7. Cost Benefit Analysis Findings
7.1. A Consistent Cost Benefit Approach
In support of a portfolio approach to reducing Greenhouse Gas emissions across the corporation, a consistent
approach was developed and used to compare various GHG abatement options and their associated lifecycle
cost benefits.
The best available and most current capital costs, along with energy and GHG savings and cost savings, and
operations and maintenance savings data were compiled from recently commissioned building energy audits,
business cases, and or schematic design reports in regards to the following options:
Building energy retrofits;
Small scale (e.g., 20 kW on a fire hall) and large scale (e.g., 650 kW on a bus garage) microgeneration,
building-mounted solar photovoltaic systems;
Heat and power cogeneration for buildings;
Electric buses;
LED street lights;
Green electricity from new wind or solar farms.
Input parameters on current and future utility rates and carbon levy, current and forecasted electricity grid
factors, and discount rate were standardized to ensure “apples-to-apples” comparison of cost benefit outputs.
The cost benefit output parameters include: simple payback period, rate of return, unit carbon abatement
cost, net present value benefit to cost ratio, and unit net present value per tonne of carbon abated. Refer to
Appendix E for descriptions and equations of the various cost benefit output parameters.
7.1.1. Cost Benefit of Building Energy Retrofits
Table 4 summarizes the cost benefit results for building retrofits only. A sample of 17 buildings out of the
total of 24 recently commissioned energy audits were reviewed. The 17 buildings are a representative
sample of the City-owned real estate portfolio and covers firehalls, libraries, community centres (e.g.,
seniors centre), leisure centres (e.g., smaller neighbourhood pool and arena facilities), transit centres,
police stations, and industrial / operations facilities (e.g., ecostations, vehicle / bus storage and repair
shops). Seven of the 24 were excluded to prevent over representation of certain building types and size –
specifically ecostations, transit centres and firehalls).
The “All Samples” results shown in the following table covers the 17 buildings. The “Modified Sample”
10
consists of 11 buildings. It excludes the Mitchell bus garage and five buildings under 1,000 square
meters in gross floor area. The rationale was that an accelerated energy retrofit program would be
focused on the largest and most energy or greenhouse gas intensive buildings to realize higher absolute
energy and GHG savings, as evidenced by Figure 4, which indicates that there is up to a 100 times
difference in absolute GHG reduction potential between the largest of buildings (e.g., bus barn) as
compared to the smallest of buildings (e.g., transit centre, firehalls).
10
Mitchell Garage’s audit found an unusually high GHG reduction potential. It has been removed to prevent over-estimation of the GHG
reduction potential of the overall City-owned building portfolio.City of Edmonton Greenhouse Gas Management Plan Page 24
2019-2030 Civic Operations
The cost benefit results between the two different samples were fairly similar, but overall, the modified
sample which is intended to better reflect a focused energy retrofit program did provide slightly better
cost benefit outcomes.
Table 4: Summary of Findings from Review of Recent Building Energy Audits
ALL SAMPLES MODIFIED SAMPLE
PARAMETER AVERAGE MEDIAN AVERAGE MEDIAN
Start of Operation (year) 1974 1974 1973 1975
Square Meters 5004 2137 5618 2346
Energy Use Intensity (ekWh/m2) 1249 960 1388 1003
% Energy Savings Potential relative
37% 39% 36% 36%
to baseline (1st yr)
% GHG Reduction Potential
36% 35% 34% 37%
relative to baseline (1st yr)
Unit Carbon Abatement Cost $136 $123 $112 $116
NPV/tCO2e over 20 Years $111 $88 $118 $90
Simple Payback (years) 9.9 9.2 10.1 9.1
Discounted Payback (at 2.5%)
10.8 9.4 11.6 9.4
(years)
Cost Benefit Ratio (NPV Benefits /
2.0 0.6 2.5 0.6
Capital Cost)
Rate of Return (Based on
9.2% 10.6% 8.6% 10.9%
Discounted Payback)
Table 4 shows that on average building retrofits (based on the modified sample) can achieve
approximately 35% in both energy savings and greenhouse gas reduction, with simple payback periods of
about 9 years, net present value benefit to cost ratio over 20 years of 3 and rate of return of 9%.
Therefore, the business case for achieving GHG reductions from a financial return on investment is very
strong.
It should be noted that connection to any existing or future district energy system would be considered in
these types of energy retrofits. However development of the district energy system itself is not
considered in this report.City of Edmonton Greenhouse Gas Management Plan Page 25
2019-2030 Civic Operations
Figure 4: Lifetime Greenhouse Gas Reduction Potential of Various City Buildings Based on Audit Recommended Energy
Upgrades
7.1.2. Comparative Lifecycle Cost Benefit between various Carbon Abatement options
The following three figures provide a comparison of the lifecycle cost benefit outcomes for various carbon
abatement options. The analysis shows that heat and power cogeneration, building energy retrofits and
LED street lights are the top three options for carbon abatement, followed by large scale microgeneration
solar photovoltaics and electric buses. Small scale solar photovoltaics have the lowest lifecycle benefits.
Green electricity premiums are excluded from Figures 5 to 7 because they are simply premiums paid on
top of the base electricity rate, which no cost recovery component.City of Edmonton Greenhouse Gas Management Plan Page 26
2019-2030 Civic Operations
Figure 5: Simple Payback Periods of various Carbon Abatement Options
Figure 6: Rate of Return (based on discounted payback) of Various Carbon Abatement OptionsCity of Edmonton Greenhouse Gas Management Plan Page 27
2019-2030 Civic Operations
Figure 7: Net Present Value Benefit to Cost Ratio of Various Carbon Abatement Options
Figure 8 compares the Unit Net Present Value Benefit (per tonne of carbon abated over the lifespan of the
th
abatement measure) of various options with the Net Present Value 50 percentile (reflecting average
th
probable climate change impacts). The 95 percentile SCC values (reflecting lower probability, worst case,
high-cost climate change impacts) for 2019 and 2030 is $216/tonne and $291/tonne, respectively. They
were not shown on the figure as the Unit Net Present Values of the various options except for green
th
electricity purchased from new solar utilities exceeded the 2030 50 percentile SCC values. This figure
helps to show whether the investment makes sense from a Sustainable Return on Investment perspective
over those future 12 years. If the Unit Net Present Value Cost or Benefit of a particular option is less costly
than the SCC value, it makes sense to proceed. If the Unit Net Present Value Cost or Benefit of a
particular option is more costly than the SCC value, it means it may not be the most appropriate to invest
in that particular option at this time from a climate change mitigation perspective. The data below is able
to demonstrate that there is a strong Sustainable Return on Investment business case to invest in all of
the carbon abatement options proposed within the 2019-2030 timeframe under even the average
probable climate change impacts scenario, with the exception of small scale microgeneration and green
electricity purchased from new large scale utility solar. All options would be considered cost effective
th
when compared to the 95 percentile SCC values for 2019 ($216/tonne) and 2030 ($291/tonne)City of Edmonton Greenhouse Gas Management Plan Page 28
2019-2030 Civic Operations
Figure 8: Unit Lifecycle Cost Benefit (NPV) of Various Carbon Abatement Options versus Social Cost of Carbon
7.2. Limitations of Cogeneration
Generating electricity with natural gas through technology like cogeneration can substantially reduce carbon
emissions as compared to consuming electricity from the current electricity grid. Due to the relatively high
electricity prices compared to natural gas, this solution is also very effective at reducing utility costs.
Cogeneration is the most cost effective when implemented and sized to operate in facilities that have
consistently high year round heating loads, such as pools. For this reason, Cogeneration cannot be widely
applied throughout all City buildings. As well, as the grid gets cleaner, the ability for cogeneration to reduce
GHG emissions diminishes. Cogeneration equipment typically has a life of 15 years; therefore if implemented
in the near future, cogeneration could provide effective GHG reductions. For these reasons, it is
recommended that cogeneration be explored on a project by project basis as a part of the broader building
retrofit program, but the civic operations greenhouse gas management plan would not be recommending a
specific cogeneration program.
7.3. Uncertainty of future cost of electric buses
Of all of the carbon abatement options proposed, the future cost of electric buses is considered the most
uncertain due to this technology being in the early stages of market adoption. Building retrofits, LED street
lights and even solar photovoltaics, in comparison, are considered mature and prevalent technologies, where
soft project and labour costs are becoming or have become more of a dominant cost driver than hard costs of
the technologies. For these technologies, the hardware or equipment cost is not expected to experience
substantial decrease in future years. The incremental difference in capital between electric and diesel buses is
expected to dramatically narrow in future years. But it is uncertain how quickly this will happen. The Plan’sCity of Edmonton Greenhouse Gas Management Plan Page 29
2019-2030 Civic Operations
cost analysis is quite conservative in that future anticipated decreases in incremental cost have not been
incorporated.
7.4. Uncertainty in availability of incentives
Historically, provincial incentives or rebates for municipalities to carry out building energy upgrades or on-site
solar installations have been administered by the Municipal Climate Change Action Centre (MCCAC). For
instance, the currently (2017) active Alberta Municipal Solar Program offers between $0.55/W to $0.90/W
depending on total installed capacity of the system, and helps to cover up to 25% of eligible expenses.
However, these incentives are first come first serve. If available, they could help improve the business case of
a single or a small number of projects, but the City would not be able to depend on a 25% rebate over a large
portfolio of projects that cost several or tens of millions of dollars. More recently, the newly established
Energy Efficiency Alberta has rolled out a number of rebates for businesses, non-profit and institutional
sectors to upgrade their facilities’ lighting, and mechanical systems. But similar to the MCCAC programs, the
funding is not at levels where a large municipality such as Edmonton can depend on to offset capital costs for
large scale deployment of energy upgrades across its building portfolio in a significant way.
Despite uncertainty in availability of incentives the city should make every effort to use available incentives in
the work included in this plan, both to reduce capital costs of projects and to help lead by example. Appendix
E includes more information on incentive programs.
7.5. Sensitivity Analysis
Three different scenarios were evaluated as part of a sensitivity analysis to better understand the implications
of different parameters on lifecycle cost benefit.
Discount rate of 5%: this rate was determined by doubling the discount rate recommended by the
City of Edmonton Finance Department at the time of plan development.
Fuel escalation rate of 5%
Fuel escalation rate of 10%
For each scenario, only the specific parameter in question was changed in the base case, with all other input
parameters remaining the same.
Appendix F provides summaries of the effects these changing parameters have on discounted payback
period, rate of return, net present value benefit to cost ratio and unit net present value benefit per tonne of
carbon abated over 20 years. In general the various financial return on investment metrics for all carbon
abatement options will decrease slightly when the discount rate is increased from 2.5% to 5%, while the
metrics improved as the fuel escalation increased.City of Edmonton Greenhouse Gas Management Plan Page 30
2019-2030 Civic Operations
Figure 9: Sensitivity Analysis Results for Net Present Value Benefit to Cost RatioCity of Edmonton Greenhouse Gas Management Plan Page 31
2019-2030 Civic Operations
8. Greenhouse Gas Reduction Target Scenarios
Three greenhouse gas reduction scenarios were explored to identify ways that the City of Edmonton could reduce
its greenhouse gas emissions from civic operations:
30% below 2005 baseline by 2030, to align with the Pan Canadian Framework targets;
50% below 2005 baseline by 2030: Target achieved through implementation of Scenario 1 plus additional
green electricity purchase only;
Carbon neutrality by 2030.
Each scenario is accompanied by: greenhouse gas reduction initiatives across buildings, fleets, street lighting and
green energy procurement; the associated preliminary capital and operating budget requirements for the next
three budget cycles to achieve those initiatives; and the lifecycle cost benefits of meeting the specific target.
Detailed methodology and assumptions used to determine the cost benefits of various energy conservation and
greenhouse gas abatement options are found in Appendix E. Scenarios 1 and 2 were developed and supported by
the best available cost information on energy conservation and abatement options that are currently available and
technically feasible for large scale implementation. Scenario 3 is heavily dependent on access to significant
quantities of renewable or low carbon natural gas and alternative vehicle fuels that are not yet widely available
from local or even regional markets. For instance, in 2017 there was no market in Alberta to produce and sell
renewable natural gas or biodiesel with significantly lower carbon content. The technology might exist to produce
these products, but the local/regional market signals and supportive policy framework are not there to enable
deployment at a level that could even meet the City’s fuel consumption levels. Therefore scenario 3 is more
theoretical and highly conceptual at this time, requiring effort and investment by the City to catalyze development
of this emerging industry.
8.1. Background on green electricity procurement
Similar to other public sector organizations within Alberta (e.g., City of Calgary, Alberta Infrastructure), the
11
purchase of renewable energy certificates has been a significant component in the City of Edmonton’s
greenhouse gas emissions management framework to date. Under the 2012 City Operations Greenhouse
Management Plan, to achieve the targets set in the Plan to reduce greenhouse gas emissions to 50 percent of
2008 levels by 2020, approximately two thirds of the emissions reductions would be attained through the
purchase of renewable energy certificates. Between 2013 and 2016, annual purchases of renewable energy
certificates ranged between 20,500 tonnes to 72,900 tonnes (only accounts for approximately 5 to 15% of the
City’s total emissions), at an average unit cost of $9 to $10 per tonne per year.
The current criteria used by the City for buying renewable energy certificates include:
must be produced in Alberta;
rigorously verified and certified by a reputable organization; and
the least cost of the choices meeting criteria a and b.
Current renewable energy certificates are purchased year to year from wind, hydro, and biomass facilities
within the province. Although this procurement approach is very cost effective, it could be considered
insufficient for demonstrating true incremental greenhouse gas reductions that are above business as usual.
To demonstrate the City’s leadership and commitment to greening the electricity grid, a green electricity
11
Renewable energy certificates are the financial or transactional products that represent the quantity of renewable or green electricity that is
purchased by an organization. An organization must purchase the certificates from a renewable electricity facility(ies) in order to claim that its
organization uses renewable electricity.You can also read


