TAKE ACTION FOR A CARBON-EFFICIENT SINGAPORE - CLIMATE ACTION PLAN
←
→
Page content transcription
If your browser does not render page correctly, please read the page content below
1

       C L I M AT E A C T I O N P L A N

TAKE ACTION

FOR A CARBON-EFFICIENT SINGAPORE
2   CLIMATE ACTION PLAN

Singapore’s Climate Action Plan:
Take Action Today, For a Carbon-Efficient Singapore

Published By:
National Climate Change Secretariat
Prime Minister’s Office, Singapore
www.nccs.gov.sg

In Collaboration With:
Ministry of the Environment and Water Resources
Ministry of Foreign Affairs
Ministry of National Development
Ministry of Trade and Industry
Ministry of Transport
Building and Construction Authority
Economic Development Board
Energy Market Authority
Housing & Development Board
Land Transport Authority
National Environment Agency
National Research Foundation, Prime Minister’s Office, Singapore
PUB, Singapore’s National Water Agency

© COPYRIGHT 2016
All rights reserved. No part of this publication may be reproduced,
stored in a retrieval system, or transmitted in any form or by any
means, electronic or mechanical, without the prior permission of
the National Climate Change Secretariat.

ISBN: 978-981-11-0078-9

                003 - 012 - 0115
                Printing Paper From
                Sustainable Sources

Design and Production by Green House Design + Communications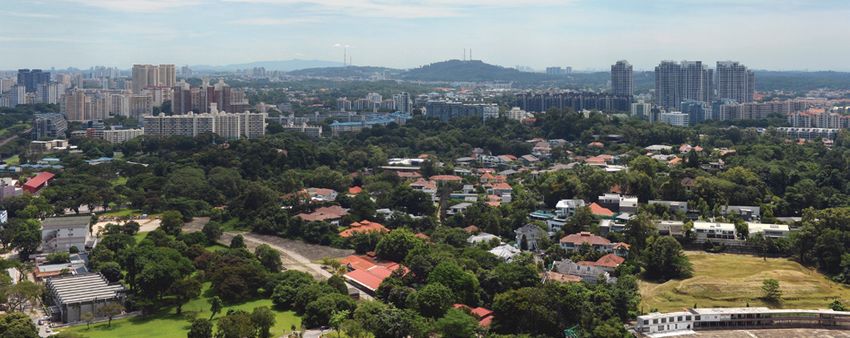
1

CONTENTS

          OVERVIEW                 02

CHAPTER
          CLIMATE CHANGE
01        AND SINGAPORE            03

CHAPTER
          IMPROVING ENERGY
02        AND CARBON EFFICIENCY    12

CHAPTER   REDUCING CARBON
03        EMISSIONS IN
          POWER GENERATION         26

CHAPTER   DEVELOPING AND
04        DEPLOYING LOW-CARBON
          TECHNOLOGY               32

CHAPTER
          ENCOURAGING COLLECTIVE
05        CLIMATE ACTION           41

          CONCLUSION               50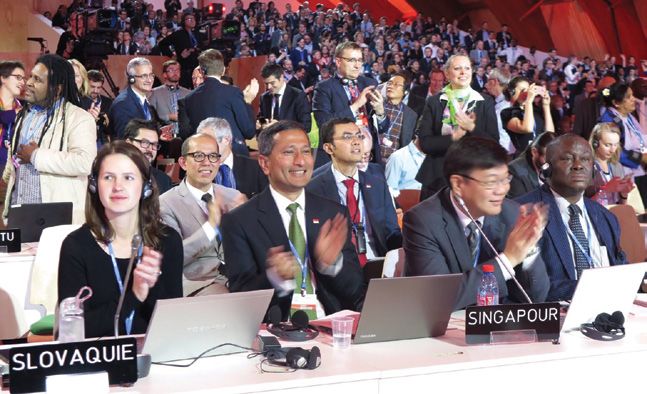
2 CLIMATE ACTION PLAN OVERVIEW
OVERVIEW
The climate is changing, and Singapore At the same time, we will reduce carbon
– a low-lying island state – is vulnerable. emissions from power generation.
The 2015 Paris Agreement on climate We will aim to adopt more efficient
change is a call to action for every technologies and increase the share of non-
country to mitigate climate change, and fossil fuels in our electricity mix.
Singapore will play its part. We aim to
reduce our emissions intensity by 36 per We will continue to develop and
cent below 2005 levels by 2030 and demonstrate cutting-edge low-
stabilise our emissions with the aim of carbon technologies as well as scale
peaking around 2030. up low-carbon solutions for deployment
in Singapore and export overseas. This
Climate Action Plan: Take Action Today, will position us well to tap on global and
For a Carbon-Efficient Singapore sets out regional green growth opportunities.
four strategies to achieve this. Improving
energy efficiency will remain our We must respond to the challenges of
key strategy for reducing emissions climate change as one nation, through
across the industry, transport, buildings, the collective action of government
household, waste, and water sectors. agencies, individuals, businesses,
Increased awareness building, enhanced and the community. Our efforts to
regulations, capability building, and mitigate carbon emissions, coupled with
government support will help Singapore steps taken to adapt to climate change1,
achieve this. will ensure that Singapore remains a
vibrant and liveable city for current
and future generations.
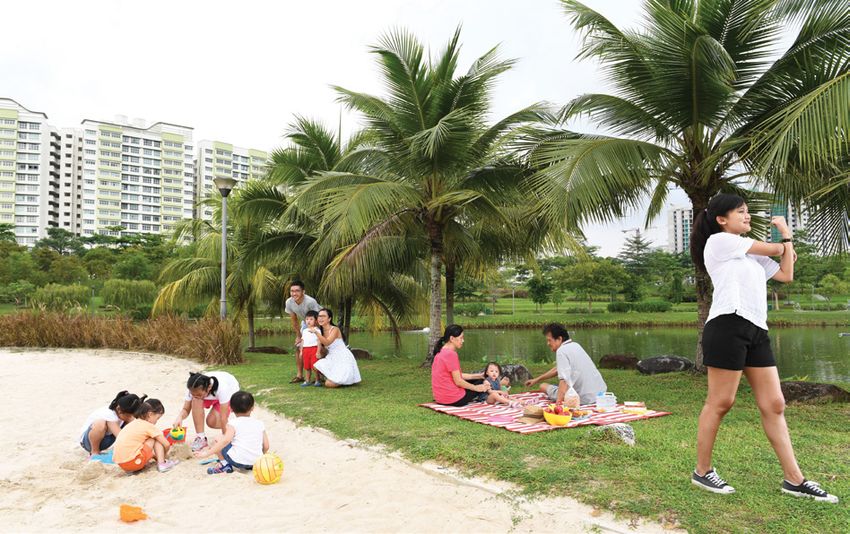
A bird’s eye view of Queenstown, one of Singapore’s oldest public housing estates
1 More information on Singapore’s plans to adapt to the impacts of climate change can be found in the Climate Action Plan: A Climate-Resilient
Singapore, For a Sustainable Future booklet.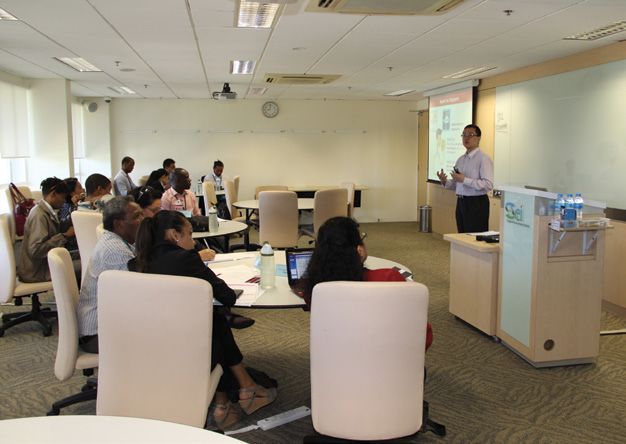
3

      CHAPTER

    01
  CLIMATE
   CHANGE
      AND
SINGAPORE
4       CLIMATE ACTION PLAN                                                                                          CLIMATE CHANGE AND SINGAPORE

CLIMATE CHANGE                                                    Singapore accounts for only about 0.11
AND WHY IT MATTERS                                                per cent of global emissions, we contribute
                                                                  to international efforts to address climate
Climate change, which refers to the                               change under the United Nations
large-scale, long-term shift in the earth’s                       Framework Convention on Climate
weather patterns, is caused by increasing                         Change (UNFCCC). Domestically, we are
levels of greenhouse gases (GHG)2 in                              reducing GHG emissions and making use
the earth’s atmosphere. The year 2015                             of innovative low-carbon solutions, while
was the warmest on record, with average                           enhancing our resilience to the impacts of
temperatures reaching about 1°C above                             climate change.
those in the pre-industrial era 3. Without
additional efforts to reduce GHG                                  SINGAPORE’S NATIONAL
emissions, temperatures could continue to                         CIRCUMSTANCES AND
rise to between 3.7°C and 4.8°C above                             EARLY ACTIONS
pre-industrial levels by 2100 4. Higher
temperatures, rising sea levels, and                              Singapore is an island city-state of only
changes in weather patterns can cause                             719km2 in size. Our small size, urban
significant damage to homes, businesses,                          density, low wind speeds, relatively flat
and livelihoods globally.                                         land, and lack of geothermal resources
                                                                  present serious difficulties 7 in pursuing
    In recent years, Singapore has seen bouts                     alternative energy options such as nuclear,
    of high temperatures and very intense                         hydro-electric, wind, or geothermal power.
    thunderstorms that have led to flash                          Our limited land resources also make it
    floods. Our annual mean temperature rose                      challenging to deploy solar power on a
    from 26.6°C in 1972 to 28.3°C in 2015,                        large scale. Despite this, Singapore has
    which was both the warmest year5 and                          made significant efforts in addressing
    the second-driest year ever recorded. In                      climate change.
    early 2014, Singapore also experienced
    its longest dry spell since records began                     We made early policy choices that
    in 1869. Phase 1 of the second National                       reduced our GHG emissions, for example
    Climate Change Study projected that our                       by switching from fuel oil to natural gas –
    temperatures could rise by between 1.4°C                      the cleanest form of fossil fuel – for
    and 4.6°C by the end of this century                          power generation. Today, about 95 per
    (2070 to 2099) 6, while mean sea levels                       cent of our electricity is generated from
    could increase by between 0.25m and                           natural gas.
    0.76m in the same period.
                                                                  We also price energy at market cost,
    Climate change is a global challenge                          without any subsidy, so that households
    that requires a global response. Although                     and businesses will use energy judiciously.

    2     Carbon dioxide accounts for a majority of GHG emissions globally and in Singapore. Other GHGs include methane, nitrous oxide, and
          fluorinated gases.
    3     Source: World Meteorological Organization
    4     Global mean surface temperature. Source: Intergovernmental Panel on Climate Change (IPCC) Fifth Assessment Report (AR5)
    5     Together with 1997 and 1998
    6     Compared to a baseline period from 1980 to 2009
    7     Singapore’s alternative-energy disadvantaged status is recognised by the United Nations Framework Convention on Climate Change (UNFCCC).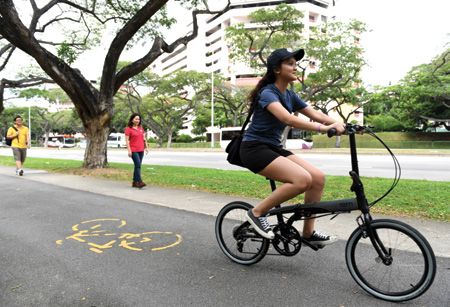
5
HOW IS SINGAPORE DOING TODAY?
Singapore has long emphasised environmental protection and sustainable development. From
2000 to 2012, Singapore’s economy grew at an annual rate of 5.7 per cent, while GHG
emissions grew at a lower rate of 2.1 per cent.
MT 2010$
CO2e (Billion)
GDP: Compounded
80 350.0
Annual Growth Rate
(CAGR) of 5.7%
70 300.0
60
250.0
50
200.0
40
GHG Emissions: CAGR of 2.1% 150.0
30
100.0
20
10 50.0 GHG Emissions (LHS)
2000
2001
2002
2003
2004
2005
2006
2007
2008
2009
2010
2011
2012
0 0.0 GDP (RHS)
Figure 1-1: GDP and GHG Emissions (2000-2012)
Due to our sustainability efforts, Singapore’s Carbon Intensity, or carbon dioxide (CO2)
emissions per dollar of economic output, is among the lowest in the world. We rank 123rd
out of 141 countries, placing us among the 20 best-performing countries 8.
CO2
Emissions per
US$GDP
2.00
1.60
123rd out of 141 countries
1.20
0.80
0.40
0.00
People’s Rep. of China
Russian Federation
India
Thailand
Malaysia
Indonesia
Brunei Darussalam
Philippines
Korea
Mexico
Australia
Canada
United States
Japan
Germany
Singapore
United Kingdom
France
Switzerland
Figure 1-2: Carbon Intensity Ranking
Singapore’s efforts are internationally recognised. We were ranked 14th out of 180 countries
in the 2016 Environmental Performance Index (EPI)9, making us the top-ranked country in Asia.
Singapore was also top among 22 major cities in the 2013 Asian Green City Index10.
8 Source: IEA Key World Energy Statistics, 2015. Comparisons based on available carbon emissions per US$GDP data
9 A joint project between the Yale Center for Environmental Law & Policy and the Center for International Earth Science Information Network at
Columbia University, in collaboration with the World Economic Forum
10 Produced jointly by the Economist Intelligence Unit and Siemens
6        CLIMATE ACTION PLAN                                                                                             CLIMATE CHANGE AND SINGAPORE

SINGAPORE’S COMMITMENTS TO ADDRESS
CLIMATE CHANGE

In 2009, Singapore pledged to reduce emissions
by 16 per cent from business-as-usual (BAU)
levels by 2020.

In 2015, building on our earlier commitment, Singapore
pledged to reduce our Emissions Intensity11 (EI)
by 36 per cent from 2005 levels by 2030, and
stabilise emissions with the aim of peaking
around 2030.

    SINGAPORE’S GHG EMISSIONS PROFILE12

Singapore’s GHG emissions in 2012 totalled 49 million                                         Deputy Prime Minister Teo Chee Hean at the National
tonnes (MT) CO2-equivalent. Figure 1-3 shows the share of                                     Climate Change Competition Award Ceremony 2015
direct emissions per sector, as well as the breakdown of
indirect emissions from each sector’s electricity usage. When
combined, these represent the total GHG emissions by
sector (For example, the industry sector accounted for about
59 per cent of Singapore’s overall GHG emissions in 2012,
                                                                                              “
                                                                                              Singapore plans to further reduce
of which 41 per cent was from direct emissions and 18 per                                     our emissions intensity as part of
cent from electricity use).                                                                   international efforts to address
                                                      PRIMARY EMISSIONS                       climate change. For a very small
                                                            Power 43%                         country with limited alternative
                                                            Industry 41%                      energy options, the stabilisation
                                                            Transport 15%                     of our emissions with the aim of
                           INDUSTRY
                                                            Buildings 0.9%                    peaking around 2030 requires
      TRANSPORT
                                                            Household 0.4%
                                                                                              serious efforts by everyone.
                                                            Waste 0.3%
                                                                                              We have to strive for higher
                      POWER
                                                      SECONDARY EMISSIONS                     levels of energy efficiency,
                                                                                              including deployment of
                                   BUILDINGS
    INDUSTRY
                                                            Industry 18%

                         HOUSEHOLD
                                                            Buildings 16%

                                                            Household 6%
                                                                                              best-in-class technologies.
                                                                                                                                             “
                                                            Transport 2%                                              DPM Teo Chee Hean,
                                                                                                    Chairman of the Inter-Ministerial Committee on
                                                            Others 0.4%                                                 Climate Change (IMCCC),
                   Figure 1-3: Singapore’s GHG Emissions Profile (2012)                        upon Singapore’s pledge submission on July 3, 2015

    11     Emissions Intensity refers to GHG Emissions per dollar of GDP, measured in CO2-equivalent per $.
    12     A detailed breakdown of Singapore’s 2012 GHG inventory will be published in end-2016 in the 2nd Biennial Update Report that will be submitted
           to the UNFCCC. The 1st Biennial Update Report is available at: https://www.nccs.gov.sg/sites/nccs/files/NCBUR2014_1.pdf.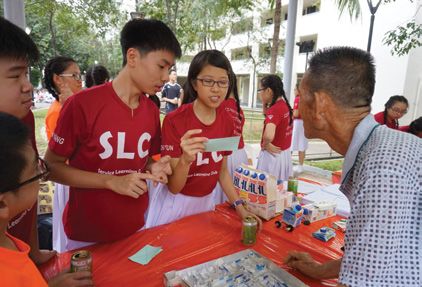
7

DEVELOPMENT OF
SINGAPORE’S PLEDGE
Under the guidance of the Inter-                     Inter-Ministerial Committee on Climate Change (IMCCC)

Ministerial Committee on Climate                                            Chaired by Deputy Prime Minister and
                                                                          Coordinating Minister for National Security
Change (IMCCC) chaired by Deputy                                                                   Members:
                                                    Minister for the Environment and Water Resources, Minister for Finance, Minister for Foreign Affairs,
Prime Minister Teo Chee Hean,                                     Minister for National Development, Minister for Trade and Industry (Trade),
                                                                      Minister for Trade and Industry (Industry) and Minister for Transport
numerous government agencies worked
together to develop Singapore’s pledge.                                       IMCCC Executive Committee
(Refer to Figure 1-4)                                          Chaired by Permanent Secretary (National Climate Change)
                                                                                               Members:
                                                         PS (Environment and Water Resources), PS (Finance) (Performance), PS (Foreign Affairs),
The discussion and analysis undertaken                PS (National Development), PS (National Research and Development), PS (Trade and Industry),
                                                                      PS (Transport) and Chairman (Economic Development Board)
by the IMCCC agencies was supported
by independent technical studies,
technology roadmaps (see Chapter 4 for               Resilience                       International                          Long Term
more information), and consultations               Working Group                      Negotiations                          Emissions and
                                                      (RWG)                          Working Group                            Mitigation
with stakeholders. More than 1,000                                                       (INWG)                             Working Group
comments and suggestions on measures                     Chaired by                                                             (LWG)
                                                        PS (National                       Chaired by
to mitigate emissions were received, and             Development) and                  PS (Foreign Affairs)               Chaired by PS (National
                                                    PS (Environment and                                                    Climate Change) and
more than 200 organisations participated             Water Resources)                                                     PS (Trade and Industry)
in the consultations. (Refer to Figure 1-5)
                                                             Figure 1-4: Inter-Ministerial Committee on Climate Change

                                                                                                                       Public Consultation
                                                                                                                       •   Online Consultation
                                                                                                                       •   Stakeholder/
        TECHNOLOGY ROADMAPS                                                                                                Sectoral Consultations

                                                                                                                     Singapore’s
 2012                  2013                      2014                                2015                               Pledge
                                                                                                                     Submission

                                                Energy Efficiency Studies
                                                •   Economy-wide
                                                •   Industrial Sector

        INTER-AGENCY ANALYSIS UNDER IMCCC

                       Figure 1-5: Development Process of Singapore’s Pledge
8        CLIMATE ACTION PLAN                                                                                               CLIMATE CHANGE AND SINGAPORE

    PARIS AGREEMENT ON                                               A five-yearly stocktake of global collective
    CLIMATE CHANGE                                                   progress will guide this process, while
                                                                     an enhanced reporting and monitoring
On December 12, 2015, at the 21st                                    framework will track the progress that
Conference of the Parties to the UNFCCC                              countries have made towards achieving
(COP-21) in Paris, all 196 Parties to the                            their pledges.
UNFCCC adopted a landmark agreement
to take the world in an ambitious new                                Singapore signed the Agreement on
direction in terms of global climate action.                         April 22, 2016 at the United Nations
The Paris Agreement will replace the Kyoto                           Headquarters in New York, along with 175
Protocol13 which expires in 2020. Unlike                             other Parties. The Agreement will enter into
the Kyoto Protocol, which required only                              force after at least 55 Parties accounting
developed countries to take on emissions                             for at least 55 per cent of global emissions
targets, the new treaty will be applicable                           have ratified it.
to all countries. It builds on the momentum
of the pledges14 submitted by over 185                               THE WAY FORWARD TO 2030
countries ahead of the Paris meeting.
Together, these countries account for 96                             Singapore has set ambitious targets under
per cent of global emissions and 99 per                              our 2030 pledge, and meeting them will
cent of the global population15.                                     require concerted efforts by the government,
                                                                     businesses, households, and individuals.
    AN AMBITIOUS, BALANCED, AND                                      Our strategies to achieve our 2030 pledge
    DURABLE AGREEMENT                                                are outlined in the next four chapters:
                                                                     •     Chapter 2: Improving Energy and
    The Paris Agreement reaffirms the long-                                Carbon Efficiency
    term global goal of keeping global                               •     Chapter 3: Reducing Carbon Emissions
    warming well below 2°C above pre-                                      in Power Generation
    industrial levels, and urges Parties to                          •     Chapter 4: Developing and Deploying
    pursue efforts towards a more ambitious                                Low-Carbon Technology
    1.5°C threshold. Under the Agreement,                            •     Chapter 5: Encouraging Collective
    Parties aim to achieve the peaking of                                  Climate Action
    global emissions as soon as possible.                            The above strategies will guide our work
                                                                     as we study the optimal mix of policies
    The Agreement will uphold the UNFCCC                             and technologies to achieve our 2030
    principle of “common but differentiated                          commitment. We will remain nimble
    responsibilities and respective capabilities,                    and responsive to local and global
    in the light of different national                               developments, to identify appropriate and
    circumstances”. Parties will be required                         effective measures that will reduce emissions
    to communicate or update their climate                           and increase our energy efficiency.
    pledges every five years. Successive                             Everyone will have a part to play, to make
    climate pledges must represent a                                 more climate-friendly choices in the way we
    progression beyond current ones.                                 lead our daily lives.

    13     The Kyoto Protocol was an international agreement linked to the UNFCCC, under which developed countries committed to setting internationally-
           binding emission reduction targets.
    14     Countries’ pledges are also known as Intended Nationally Determined Contributions (INDCs).
    15     Source: UNFCCC synthesis report on the aggregate effect of the INDCs
9 Minister for Foreign Affairs Dr Vivian Balakrishnan (second from left) and Chief Negotiator for Climate Change Ambassador Kwok Fook Seng (third from left) at the conclusion of COP-21 in Paris CONTRIBUTING TO MULTILATERAL NEGOTIATIONS Singapore supports the multilateral to all Parties that this agreement will negotiations under the UNFCCC, account for the historical responsibilities and has contributed proactively to the of developed countries while also process. We were the 17th country to encouraging developing countries to submit our pledge on July 3, 2015, well contribute more as they achieve greater ahead of COP-21. Singapore played progress. an active role in forging consensus on the Paris Agreement at COP-21. Singapore’s Chief Negotiator for Climate Minister for Foreign Affairs Dr Vivian Change Ambassador Kwok Fook Balakrishnan was invited by the French Seng led negotiations on an enhanced Presidency to co-facilitate discussions on transparency framework for the Paris differentiation, a contentious issue that Agreement to institute clear reporting could have scuttled the deal. Ultimately, and review processes in order to track the issue was about ensuring fairness the progress that countries have made – providing the necessary assurance towards achieving their pledges.
10       CLIMATE ACTION PLAN                                                                         CLIMATE CHANGE AND SINGAPORE

     STRATEGIES TO MEET
     SINGAPORE’S 2030 PLEDGE

 IMPROVE
 ENERGY AND
 CARBON
 EFFICIENCY

     Industry                    Buildings              Transport                Household                   Water and
                                                                                                             Waste
     •     Increase industrial   •   Achieve BCA        •   Achieve 75 per       •   Raise Minimum
           energy efficiency         Green Mark             cent use of public       Energy Performance      •   Reduce plastics
     •     Reduce non-CO2            standards for          transport by 2030        Standards (MEPS)            incineration
           GHGs from                 80 per cent of     •   Encourage cycling        for household           •   Improve energy
           industrial                buildings by           and walking              appliances and              efficiency in
           processes                 2030               •   Improve vehicle          introduce MEPS for          desalination
     •     Adopt cleaner         •   Improve energy         fuel efficiency          more appliances             and used water
           fuels                     efficiency of                               •   Encourage                   treatment
                                     building tenants                                adoption of efficient
                                 •   Improve energy                                  appliance models
                                     efficiency of                               •   Introduce smart
                                     data centres                                    home technology
11
SINGAPORE’S PLEDGE Emissions Intensity (kgCO2e/S$GDP)
To reduce our Emissions Intensity (EI)
by 36 per cent from 2005 levels by
2030, and stabilise emissions with the
2005
2030
aim of peaking around 2030. 0.176 36% 0.113
REDUCE
CARBON DEVELOP ENCOURAGE
EMISSIONS AND DEPLOY COLLECTIVE
IN POWER LOW CARBON CLIMATE
GENERATION TECHNOLOGY ACTION
• Adopt more • Develop • Build knowledge
efficient power Singapore’s and awareness
generation research and • Promote action on
technologies development climate change
• Increase capabilities • Support
deployment of • Scale and deploy international
solar photovoltaic technology in cooperation
systems Singapore’s
• Increase efficiency test-beds and
of waste-to-energy “Living Labs”
plants12 CLIMATE ACTION PLAN
CHAPTER
02
IMPROVING
ENERGY AND
CARBON
EFFICIENCY13
INTRODUCTION as exhaust gas heat recovery, combustion
optimisation for furnaces, and improved
Singapore’s geographical constraints limit catalysts. The implementation of energy
the extent to which alternative energy efficiency projects and good energy
can be deployed. Hence, increasing management practices can save energy
energy efficiency will continue to be a key and reduce costs for companies.
strategy to reduce our carbon emissions.
This will also help lower costs, increase Increasing Energy Efficiency
business competitiveness, and enhance
energy security. We will continue efforts The National Environment Agency
to improve energy efficiency and carbon (NEA) and Economic Development
efficiency16 by increasing awareness and Board (EDB) will work with the
enhancing incentives, as well as through manufacturing sector industries
regulation and capacity building. to achieve energy efficiency
improvement rates similar to the
INCREASING INDUSTRIAL ENERGY 1 to 2 per cent per annum being
AND CARBON EFFICIENCY achieved in leading developed
countries like Belgium and the
Potential for Energy Savings in Industry
Netherlands. Several schemes are
already in place to support greater
The industry sector accounts for more energy efficiency (see next page). The
than half of Singapore’s GHG emissions. Energy Conservation Act (ECA),
A 2014 study17 on industrial energy which covers energy-intensive
efficiency in Singapore estimated that industrial firms, will be reviewed
by 2030, energy savings of 20 per regularly so that it remains
cent could be achieved compared to effective in supporting energy
business-as-usual levels. Significant energy efficiency improvements. In the
efficiency opportunities were identified first half of 2016, NEA sought feedback
in the petroleum, petrochemical, and from companies on existing schemes and
semiconductor sub-sectors, in areas such on possible new initiatives, to improve
manufacturing sector energy efficiency.
EXCELLENCE IN ENERGY MANAGEMENT
Lumileds is a global company that develops, manufactures, and distributes advanced light-emitting
diodes (LEDs) and automotive lighting products. Lumileds Singapore’s manufacturing plant was awarded
the BCA Green Mark Platinum Award, and the NEA Excellence in Energy Management Award in
2015. Between 2011 and 2014, the company implemented 18 energy efficiency projects that reduced
its energy usage per unit product by 64 per cent, resulting in significant energy cost savings. Projects
included facility systems upgrades, LED lamp replacements, and chiller plant optimisation. Lumileds
Singapore targets to improve its energy efficiency by 5 to 8 per cent each year.
16 Beyond energy efficiency, carbon efficiency encompasses the use of cleaner fuels and processes that emit lower levels of GHGs for the same amount
of energy used or products processed.
17 The industry sector energy efficiency study was commissioned by NCCS, MTI and MEWR and conducted by ICF International with EDB and NEA as
lead agencies.14 CLIMATE ACTION PLAN IMPROVING ENERGY AND CARBON EFFICIENCY
SCHEMES TO HELP COMPANIES
ACHIEVE GREATER ENERGY EFFICIENCY
CAPABILITY DEVELOPMENT FINANCING
Singapore Certified Energy Manager (SCEM) EE Financing Pilot Programme
This is a training and certification programme in Under this programme, companies receive
energy management. The SCEM training grant financing for up to 100 per cent of the upfront
covers about 70 per cent of training costs. capital investment of energy efficiency projects.
Energy Conservation Act (ECA) Cost savings are shared between the financier
Energy-intensive users in the industrial sector are and the company.
required to appoint an energy manager, monitor
and report energy use and GHG emissions-related INCENTIVES
information annually. They also have to submit Resource-Efficient Design
an energy efficiency improvement plan and review NEA co-funds up to 50 per cent of the cost
this plan annually. of design workshops to integrate energy and
Energy Efficiency National Partnership (EENP) resource efficiency in the design of new facilities,
Programme capped at $600,000 per project.
This is a voluntary partnership programme for Energy Audits
companies that includes: NEA co-funds 50 per cent of the costs of an
• Promoting adoption of an energy management energy audit, which assesses energy consumption
system (For example, ISO 50001) and helps to develop energy efficiency
• Organising learning events such as the improvement plans for existing facilities, capped
National Energy Efficiency Conference at $200,000 per project.
• Providing recognition schemes to encourage Retrofit Projects
best practices in energy management EDB and NEA co-fund up to 20 per cent of
the investment cost of energy efficient equipment
or technologies.
Besides grants, tax incentive schemes are also
available. The Accelerated Depreciation
Allowance Scheme (ADAS) allows the write-
off or depreciation, within one year, of capital
expenditure on more energy efficient or energy-
saving equipment to replace existing ones. The
Investment Allowance – Energy Efficiency
Scheme (IA) allows an additional 30 per cent
investment allowance for energy efficiency
investments against taxable income, on top of
Participants at the National Energy Efficiency Conference 2015 normal capital allowances.15
Reducing Non-CO2 GHGs building rating system, tailored for the
tropics and sub-tropics. It evaluates
Although most of Singapore’s GHG and sets benchmarks for environmental
emissions consist of CO2, non-CO2 GHGs sustainability in buildings. Since the
also contribute a small percentage (2.1 launch of the Green Mark Scheme,
per cent in 2012). In Singapore, most of the number of green building projects
the non-CO2 GHG emissions are from has increased from 17 in 2005 to
the semiconductor sub-sector.18 EDB more than 2,700 in 2016, covering
and NEA will study policy options more than 31 per cent of buildings
to support the implementation in Singapore. To keep pace with
of appropriate measures and technological advancements and raise
technologies to reduce non-CO2 energy performance standards, BCA
GHG emissions from the introduced the revised Green Mark 2015
sub-sector. criteria. Enhancements include increased
recognition for energy efficiency and for
Adopting Cleaner Fuels in Industry adoption of renewable energy.
In the industry sector, fuels such as fuel oil
are directly combusted to meet heating GREEN MARK BUILDING PROJECTS IN
needs, for example in boilers. Switching SINGAPORE (CUMULATIVE)
to cleaner fuels such as natural
gas can decrease carbon emissions 81.8
from heating processes by about GFA (mil m2)
25 per cent. EDB and NEA will Number of Building Projects
2757
study further policy options to
facilitate this switch.
23.7
ACHIEVING GLOBAL LEADERSHIP
IN GREEN BUILDINGS 1.1
747
17
A Leading Rating System for the Tropics:
FY05 FY10 As of May 2016
Green Mark 2015
Figure 2-6: Number and Gross Floor Area (GFA)
The Green Mark Scheme is the Building of Green Buildings19 in Singapore
and Construction Authority’s (BCA) green
ENERGY EFFICIENCY FINANCING
Sustainable Development Capital LLP (SDCL) Asia Limited, EDB’s designated partner for the Energy
Efficiency Financing Pilot Programme, signed a contract with Panasonic Singapore in 2015 to replace
eight air compressor units with six new ones, enabling Panasonic to achieve a 23 per cent improvement
in energy efficiency. SDCL financed 100 per cent of the capital cost and also assisted Panasonic in
selecting partners for energy audits and equipment suppliers.
18 These include Hydrofluorocarbons (HFCs), Perfluorocarbons (PFCs), and Sulphur Hexafluoride (SF6).
19 Accounted based on the year in which a project first meets the standard equivalent to Green Mark Certified16 CLIMATE ACTION PLAN IMPROVING ENERGY AND CARBON EFFICIENCY
Building a Greener Tomorrow – The Infocomm Development Authority of
3rd Green Building Masterplan Singapore (IDA) has estimated that the
10 largest data centres in Singapore
BCA’s Green Building Masterplans aim consume as much energy annually as
to reduce carbon emissions and increase 130,000 households. Singapore is
sustainability in Singapore’s buildings. emerging as the region’s data centre
Recognising that tenants consume about hub. We host more than 60 per cent of
50 per cent of energy in a commercial the data centres in Southeast Asia as
building, the 3rd Green Building at 201522 and our data centre industry
Masterplan is focused on changing the is expected to grow. The Green Data
way building tenants and occupants Centre Technology Roadmap23 found that
consume energy. the sector has the potential to reduce
energy use by more than 50 per cent
Beyond the existing Green by 2030 compared to business-as-
Lease Toolkit20 and user-centric usual levels. Recognising this, IDA has
Green Mark schemes, BCA will implemented initiatives to encourage
step up efforts to encourage the energy efficiency in the design, operation,
retrofitting of tenanted spaces and management of data centres. This
with energy-efficient fittings, such includes the Green Data Centre Standard
as light fittings. To enhance current (Singapore Standard 564), the BCA-
efforts to green existing buildings, BCA IDA Green Mark for Data Centres, the
and Singapore Green Building Council Investment Allowance scheme for energy
(SGBC) have collaborated to develop efficiency projects and the Green Data
the Zero Capital Partnership21 scheme, Centre Programme (GDCP) that supports
which provides a “zero capital” solution high-impact research, development,
for building owners to carry out energy and demonstration projects on energy
efficiency retrofits for buildings. These efficiency in data centres. As one of
efforts will contribute to Singapore’s aim the projects under GDCP, Singapore
of making 80 per cent of all buildings is conducting trials on the world’s first
green by 2030. Tropical Data Centre (TDC), which could
reduce energy consumption of data
Energy-Efficient Data Centres centres by up to 40 per cent. The TDC will
test the operation of data centres under
Within the buildings sector, data temperatures of up to 38°C and ambient
centres are large energy consumers. humidity up to or exceeding 90 per cent.
20 The Green Lease Toolkit aids landlords and tenants in working together to improve environmental sustainability, for example, through an agreement
between both parties to adopt environmentally friendly procedures. User-centric Green Mark schemes include the Green Mark for office interiors,
restaurants, and supermarkets and retail.
21 The Zero Capital Partnership Scheme was launched in May 2016. Under the scheme, SGBC-accredited Energy Performance Contracting (EPC) firms
perform energy audits and retrofits, and facilitate financing and applications for relevant incentive schemes, in order to achieve building owners’
desired performance targets and Green Mark certification.
22 Source: Report by BroadGroup on Data Centres in Southeast Asia
23 The roadmap was commissioned by NCCS and NRF, and led by IDA. It can be found online at
http://www.nrf.gov.sg/docs/default-source/Publications/green-data-centre.pdf17
WORLD’S FIRST HIGH-RISE ROTATABLE
LABORATORY FOR THE TROPICS
The BCA SkyLab is part of BCA’s plans to accelerate
the pace of research, development, and application of
innovative energy-efficient building technologies. To be
launched in July 2016, it is equipped with state-of-the-
art features, including a fully-rotatable platform and
reconfigurable plug-and-play fittings, for comprehensive
tests to be carried out at any orientation to the sun and
wind in an urban high-rise setting. The BCA SkyLab
will be a key facility for test-bedding, demonstration and
knowledge-sharing of green building technologies.
SkyLab, the world’s first high-rise rotatable test facility
BCA-IDA GREEN MARK The Green Mark for Data Centres
encourages energy efficiency in the
FOR DATA CENTRES design, operation, and management
of data centres. Equinix’s SG3 Data
Centre was awarded the Green
Mark Platinum rating in 2015.
The facility saves energy and water
through initiatives such as rainwater
harvesting, temperature control, air
leakage prevention, and the use of
solar photovoltaic panels. This has
reduced the facility’s consumption
of potable water and lowered its
Power Usage Effectiveness (PUE)24
ratio to 1.35, saving an estimated
32.5 per cent of energy. Equinix
has a long-term goal of using 100
per cent clean and renewable
energy for its global platform.
Equinix’s Green Mark Platinum SG3 Data Centre in Ayer Rajah Crescent
24 PUE is a metric used to determine the energy efficiency of a data centre. It is the ratio of the total amount of energy used by a data centre facility to
the energy delivered to the computer equipment. The more efficient the data centre, the closer the value of the PUE is to 1.18 CLIMATE ACTION PLAN IMPROVING ENERGY AND CARBON EFFICIENCY
INCREASING TRANSPORT SECTOR into a model walking and cycling
CARBON EFFICIENCY town. From July 2016, LTA and the
Urban Redevelopment Authority (URA)
Encouraging Public Transport Use will require private developers to
consider the safety, convenience, and
In the 2013 Land Transport Master Plan, accessibility needs of pedestrians and
the Land Transport Authority (LTA) of cyclists in their development plans.
Singapore outlined its objective to make • Seven new integrated transport
public transport the preferred mode of hubs will be built by 2023 to make
transportation, and to promote active it convenient for people to access
mobility, such as walking and cycling different transport modes and to
for shorter commutes and to complement enjoy shopping and lifestyle services
public transport. Selected initiatives in at the same location. Additional
support of this vision include: integrated transport hubs will be
built for selected areas undergoing
• An ambitious plan to double the development or redevelopment.
rail network in 15 years. With the
opening of Downtown Line 2 in These measures collectively aim to
December 2015, Singapore’s rail increase the use of public transport
network increased by 10 per cent as a share of overall transport
from 183km in 2014 to some 200km during morning peak hours from
in 2015. This year, the Tuas West 66 per cent in 2015 to 75 per cent
Extension for the East-West Line by 2030. By 2050, the aim is to
will be completed, adding a further further increase this share to
7.5km. By 2030, the rail network will 85 per cent.
be 360km, and will be comparable in
rail density with developed cities like
London, New York and Tokyo. More
than 120 trains will also be added to
existing train lines, increasing the total
fleet size by more than 40 per cent.
• The Bus Service Enhancement
Programme, launched in 2012, aims
to grow the public bus fleet by 1,000
buses or about 25 per cent by 2017.
• To facilitate walking and cycling, our
sheltered walkway network will be
quadrupled from the existing 56km to
200km by 2018. Cycling paths will
double from 355km in 2015 to more
than 700km by 2030. Bicycle-sharing
will be piloted in various districts,
and Ang Mo Kio will be transformed By 2030, every HDB town will have a dedicated cycling network.19
Limiting Emissions from Private Transport Electric Vehicle (EV) Pilot Programme
(Phase 2)
The Certificate of Entitlement (COE) and
the Electronic Road Pricing (ERP) systems Various trials are underway to assess the
have been in place for many years to implementation of electric vehicles (EV) in
curb the growth of the vehicle population Singapore. In the first phase, 89 EVs were
and the use of private transport. This deployed between 2011 and 2013. In
is supplemented by high vehicle taxes, the second phase, the use of EVs will be
registration fees and fuel duties. trialled for fleet-based operations. An EV
car-sharing pilot programme for this phase
will introduce as many as 1,000 EVs and
an island-wide charging infrastructure
comprising up to 2,000 charging kiosks to
support the eventual proliferation of EVs.
ENHANCING EFFICIENCY
IN DOMESTIC LOGISTICS
Singapore is a leading logistics hub in Asia. It is estimated that 4,000 trucks make over 20,000 delivery
trips daily, occupying approximately 25 per cent of road space in Singapore. In 2015, IDA and
SPRING Singapore announced a $20 million pilot project to develop an integrated delivery system for
malls. If scaled to cover all of Singapore’s malls, such consolidation and coordination could reduce the
number of trucks on the road by 25 per cent, reduce waiting time for deliveries by 65 per cent, reduce
the manpower required for deliveries by 40 per cent, and result in lower carbon emissions from trucks.
ENCOURAGING THE SHIFT TO MORE
EFFICIENT VEHICLES
The Carbon Emissions-based Vehicle Scheme (CEVS) was introduced in January 2013. The scheme
applies to all new cars, taxis and newly-imported used cars that are registered in Singapore. Under the
CEVS, these vehicles are divided into categories based on their CO2/km performance. Low-emission cars
are given incentives, while high-emission cars incur a penalty in the form of a registration surcharge. The
rebate or surcharge for taxis is 50 per cent higher than cars as taxis generally clock a higher mileage and
thus typically emit more CO2 per year than cars. The rebates and surcharges are applied upfront at the
point of purchase, to have a more significant impact on consumers’ purchase decisions, and encourage
them to choose lower-emission car and taxi models. The CEVS will be reviewed in 2017.
The Fuel Economy Labeling Scheme (FELS) introduced in 2012 complements the CEVS by providing
information on the fuel performance of each car model. Together, the CEVS and FELS allow consumers
to choose fuel-efficient cars, which in turn leads to savings on fuel cost and lower carbon emissions.20 CLIMATE ACTION PLAN IMPROVING ENERGY AND CARBON EFFICIENCY
EMPOWERING HOUSEHOLDS TO Promoting and Increasing Awareness
MAKE BETTER ENERGY CHOICES about Energy Efficient Appliances
A growing population and rising To help households make more informed
household incomes are expected to purchasing decisions, NEA introduced
increase the demand for electrical the Mandatory Energy Labelling Scheme
appliances such as air-conditioners, (MELS) in 2008. It provides information
televisions, lamps, and refrigerators. that allows consumers to compare the
Households can reduce energy use energy efficiency of different appliances.
and save costs by choosing more MELS currently covers household
efficient appliances and adopting refrigerators, air-conditioners, clothes
energy-saving habits. dryers, televisions, and lamps. NEA will
consider including other appliances
Raising Minimum Energy Performance in the future.
Standards
For water heaters, NEA will raise public
Minimum Energy Performance Standards awareness of more energy-efficient models
(MEPS) remove the most energy-inefficient and encourage suppliers to bring more
appliance models from the market. MEPS high-efficiency heaters into the market.
were first introduced for air-conditioners For example, a heat pump water heater
and refrigerators in 2011 and have is highly efficient and consumes about
since been extended to clothes dryers one-third of the energy used by a gas or
and lamps. electric heater. NEA is currently studying
the technical, economic, and operational
MEPS for air-conditioners were raised feasibility of such water heaters.
in 2013, and will be raised again in
September 2016. As for lamps, MEPS Since the introduction of the MELS and
were introduced in 2015 to remove the MEPS, the average energy efficiency of
least efficient models, such as tungsten air-conditioners and refrigerators has
filament incandescent bulbs. improved by about 13 per cent and 26
per cent respectively.
The minimum standards for
appliances will be progressively In addition to schemes like MEPS
raised to increase the efficiency and MELS, NEA will continue to
of the appliances on the market, promote energy-efficient
while ensuring that product availability appliances through public
and consumer choice are not adversely messaging campaigns – such as
affected. This will also result in lower life- the “Save Energy Save Money”
cycle costs for consumers. initiative – at retail outlets, HDB void
decks, and through social media.21
ENERGY CONSUMPTION PROFILE
IN A TYPICAL HOUSEHOLD
In general, three appliances – air-conditioners, water heaters, and refrigerators – account for
75 per cent of energy consumption in households.
Air-conditioner
36%
Refrigerator
Fan 2%
18%
Lighting 4%
Others 1%
TV and
computer
11%
Water
heater
21%
Kitchen
applicances
4%
Washing
machine,
clothes
dryer, and
iron 3%
Figure 2-7: Energy Consumption Profile in a Typical Household22 CLIMATE ACTION PLAN IMPROVING ENERGY AND CARBON EFFICIENCY
Smart Home Technologies NEA is also conducting a pilot programme
to evaluate the economic viability and
Home Energy Management Systems feasibility of the district-level collection and
(HEMS) analyse real-time energy processing of food waste for anaerobic
usage and costs, alert residents to high co-digestion25 with used water sludge at
energy use, and offer energy-saving the Ulu Pandan Water Reclamation Plant.
tips. Overseas studies have shown that Anaerobic co-digestion could help meet
HEMS can potentially reduce energy up to 50 per cent of the treatment plant’s
consumption by up to 10 per cent. HEMS electricity needs, up from 20 to 25
are currently being piloted in per cent from used water sludge
selected households in the Yuhua digestion alone.
estate to assess the feasibility of
larger scale implementation. Increasing Energy and Carbon Efficiency
in the Waste Management Process
The Yuhua pilot programme, led by
Waste reduction and recycling can
HDB and IDA and in partnership with
reduce GHG emissions from waste
PUB, NEA, and MOH, will assess the
incineration. NEA aims to increase
usefulness and user-friendliness of HEMS.
the overall recycling rate from 61 per
This will enable agencies to better
cent in 2015 to 70 per cent in 2030, by
understand residents’ receptiveness
increasing awareness and implementing
towards smart solutions like HEMS and
other policy initiatives (see feature story).
the resultant changes in their household
energy consumption patterns. The pilot
programme will also allow agencies to
better understand the digital infrastructure
needed to accommodate such technology.
ENHANCING EFFICIENCY IN
WATER TREATMENT AND WASTE
MANAGEMENT PROCESSES
Increasing Efficiency of Water Treatment
PUB is pilot testing new technologies
such as electrochemical desalting, with
the aim of halving the energy used in the
seawater desalination process. Improved
technologies for reclaiming used water
could also reduce energy use. These
reductions in energy use would
decrease carbon emissions from
the water sector.
25 Anaerobic co-digestion is the process of breaking down multiple biodegradable materials without oxygen to produce biogas which is used to
generate electricity.23 ENHANCING ENERGY EFFICIENCY OF TUAS WATER RECLAMATION PLANT PUB is building a demonstration-scale Integrated Validation Plant within its Ulu Pandan Water Reclamation Plant (WRP) to test new technologies for potential implementation at the future Tuas WRP. The aim is to make the Tuas WRP more eco-friendly, enabling it to consume less energy than conventional plants and produce more biogas for power generation. INITIATIVES TO REDUCE WASTE AND INCREASE EFFICIENCY IN THE WASTE SECTOR The National Recycling Programme was launched by NEA in 2001 to make recycling more convenient for households. All new HDB developments launched from 2014 will be fitted with Centralised Chutes for Recyclables. NEA has also made it mandatory for large hotels and shopping malls to submit waste data and waste reduction plans. In addition, NEA has worked with the industry and non-governmental organisations to get various parties to sign the voluntary Singapore Packaging Agreement that aims to reduce packaging waste, which constitutes about one-third of Singapore’s domestic waste. From 2007 to 2015, the signatories cumulatively reduced about 26,000 tonnes of packaging waste, and saved more than $58 million in material costs. Residents at Treelodge@Punggol using the Centralised Chute for Recyclables
24   CLIMATE ACTION PLAN                                                                           IMPROVING ENERGY AND CARBON EFFICIENCY

       HOUSING & DEVELOPMENT BOARD
       (HDB) GREENPRINT IN YUHUA ESTATE
       From 2012 to 2015, the pilot HDB Greenprint programme transformed 38 blocks in Yuhua,
       consisting of around 3,200 households, into Singapore’s first green neighbourhood. It introduced
       new features including:

       •    Energy and Water Conservation: Solar panels, rainwater harvesting system
       •    Waste Management: Pneumatic Waste Conveyance System
       •    Greenery Enhancement: Green roofs, vertical greenery
       •    Eco-living: Green commuting, community outreach programmes

       The programme resulted in substantial energy savings. Lifts for 16 blocks were retrofitted with an
       energy regeneration system that reduced the lifts’ energy consumption by 20 per cent. Retrofitted LED
       street lights also reduced street light energy consumption by 50 per cent. Common services within the
       blocks such as lifts and lights are now powered by electricity generated by solar panels on housing block
       rooftops. With the completion of the pilot programme at Yuhua, the HDB Greenprint project was
       extended to Teck Ghee.

       In the next stage of development, Yuhua will be further transformed into a smart and sustainable estate
       through various initiatives. These include the introduction of smart home solutions as part of HDB’s
       Smart Enabled Home Initiative.

       HDB Greenprint Neighbourhood at Yuhua. Solar panels and greenery are visible on the rooftops of these blocks.
25
“
LOOKING AHEAD
Given Singapore’s reliance on Energy efficiency will continue to be
imported energy and the limited Singapore’s key strategy for reducing
options for alternative energy, carbon emissions across all sectors.
We will require everyone, including
improving energy efficiency is businesses and the community, to make
a key strategy that Singapore adjustments to their daily activities,
has adopted to mitigate our choices, and processes. To do so,
greater access to information on energy
greenhouse gas emissions, use and best practices will be provided
improve energy competiveness to guide businesses and individuals
“
and security. towards making informed decisions.
The government will also review and
enhance incentives, regulations, and
Dr Amy Khor, capability-building programmes in order
Senior Minister of State for the Environment and to drive energy efficiency improvements.
Water Resources, at the Opening Ceremony of
the National Energy Efficiency Conference on As part of this, we will be
October 6, 2015 studying the need to price
carbon to enhance efforts across
all sectors. A carbon price would
send appropriate price signals
to encourage changes in energy
consumption, provide market
incentives for the adoption of
energy-efficient technologies
and low-carbon solutions, and
stimulate growth in green
industries. However, a carbon
price will incur costs, including
affecting our competitiveness,
and its overall impact will have
to be studied.
In addition, we will invest in research
and development to study new
technologies that can boost energy
efficiency in the longer term (see
Chapter 4 for more details).26 CLIMATE ACTION PLAN
CHAPTER
03
REDUCING
CARBON
EMISSIONS
IN POWER
GENERATION27
INTRODUCTION reduce carbon emissions, enhance energy
security, improve cost competitiveness,
With limited access to alternative energy and promote environmental sustainability.
options, Singapore meets most of our
electricity needs through the combustion MORE EFFICIENT POWER
of fossil fuels, which generates carbon GENERATION TECHNOLOGIES
emissions. In 2012, electricity generation
accounted for 43 per cent of Singapore’s Power generation systems, such as
GHG emissions. Meeting our growing Combined Cycle Gas Turbines (CCGT),
electricity needs, while minimising our are expected to increase in efficiency over
carbon emissions, will be a challenge. time due to advancements in technology.
We have already switched from using fuel Higher efficiencies translate into lower
oil for electricity generation and now use costs of production of electricity. The
natural gas – the cleanest form of fossil Energy Market Authority (EMA)
fuel – for 95.3 per cent26 of our electricity. will work with power generation
This has reduced our Grid Emission companies to encourage them to
Factor27 (GEF), or the amount of CO2 adopt more efficient technologies.
emitted per unit of electricity produced, This will lower their production costs,
by 15 per cent28 between 2010 and 2015. reduce carbon emissions and keep prices
Increasing the efficiency of our power competitive for electricity consumers.
generation processes will help further
CO- AND TRI-GENERATION
Some companies in Singapore have taken the lead in deploying co- and tri-generation technologies,
which are highly efficient.
One example is the tri-generation plant at GlaxoSmithKline Vaccines in Tuas, which can supply
1.8MW of electrical power, hot water, steam, and chilled water. This investment, which has a payback
period of about five years, has helped GlaxoSmithKline Vaccines achieve annual savings of about
35.8TJ or $1.4 million.
ExxonMobil Asia Pacific has also adopted high-efficiency co-generation plants. A new 84MW plant will
be completed in 2017, which will generate both electricity and steam, and reduce carbon emissions by
about 140 kilotons per year. It will bring ExxonMobil’s total capacity to over 440MW across three
co-generation facilities in Singapore.
26 Source: Singapore Energy Statistics 2016
27 This refers to Singapore’s Operating Margin GEF.
28 Singapore’s GEF was 0.5083 kgCO2/kWh in 2010 and 0.4313 kgCO2/kWh in 2015 (Source: Singapore Energy Statistics 2016).
In comparison, the global average GEF in 2011 was 0.536 kgCO2/kWh (Source: International Energy Agency 2013).28 CLIMATE ACTION PLAN REDUCING CARBON EMISSIONS IN POWER GENERATION
INCREASING RENEWABLE
ENERGY: SOLAR PHOTOVOLTAIC
(PV) SYSTEMS
In Singapore, solar energy is the most SGD
cents/
promising renewable energy option. kWh LCOE Residential System
Although Singapore’s small land area 100 LCOE Commercial System
and high urban density constrain its use LCOE Industrial System
Residential Electricity Tariff
of renewable energy, the growth of solar 80
LCOE, Electricity Tariff
Contestable Client Average Electricity Price
PV installations in the country has been
60
significant: from 2MWp in 2009 to
60MWp in 2015.
40
This is largely due to the cost of solar 20
energy falling by about 60 per cent over
the last five years29. In 2015, the cost of 0
solar electricity in many new installations 2009 2010 2011 2012 2013 2014 2015
was below prevailing electricity tariffs.
Figure 3-8: Levelised Cost of Electricity30 for Solar Systems in
Singapore Compared to Electricity Tariffs31
Singapore plans to raise the adoption of
solar power in our system to 350MWp
by 2020, representing about 5 per
cent of peak electricity demand. A key Capacity
Number of Installations (Residential and Non-Residential)
(MWp)
initiative aimed at developing the solar 60 Non-Residential 900
industry in Singapore is the SolarNova Residential 800
programme. Falling prices and continued 50 Number of Installations
700
market demand are expected to 40 600
accelerate the adoption of solar energy. 500
Agencies like BCA, EMA, EDB, 30
400
and NEA will study ways to 20 300
support this development and 200
sustain the momentum generated 10
100
by the SolarNova programme, 0 0
through encouraging the
2009
2010
2011
2012
2013
2014
2015
deployment of solar PV
systems on buildings, continued
Figure 3-9: Cumulative Installed Solar PV Capacity and
investments in solar R&D, policy Number of Installations in Singapore32
enhancements, and engagement
efforts with various sectors to
promote solar adoption.
29 Source: Solar Energy Research Institute of Singapore (SERIS)
30 The Levelised Cost of Electricity (LCOE) is widely used to evaluate the cost of electricity generation of different technologies over the plant’s lifetime;
it includes initial construction costs, costs of operation and maintenance, cost of fuel, and the (opportunity) cost of capital.
31 Source: SERIS
32 Source: Energy Market Authority29
Solar energy generation is intermittent Waterworks, and plans to install more
as it is affected by variable factors such at Changi Water Reclamation Plant,
as cloud cover. To support an increasing and Bedok Waterworks and WaterHub
share of intermittent electricity generation, by 2017. PUB has also commenced a
Singapore will invest in research efforts feasibility study to determine the solar PV
in solar forecasting, energy storage, and deployment potential at its reservoirs and
smart grids. facilities. Findings from this study
will help determine the usable
Solar PV systems have been installed space for solar PV deployment
by several government agencies. PUB and guide PUB’s future efforts in
has installed them at Choa Chu Kang this area.
SOLARNOVA
The SolarNova programme led by EDB and HDB promotes
and aggregates solar demand across government agencies. It
aims to build up and support the solar ecosystem in Singapore,
in fields such as manufacturing, project development, system
integration, and financing so as to encourage greater adoption
of solar energy.
In December 2015, the first SolarNova tender was awarded,
covering 76MWp of solar PV panels on 831 HDB blocks and
eight government facilities. The bids received offered significant
savings off prevailing electricity tariff rates.
HDB will structure and call for solar leasing tenders of around
30 to 50MW approximately every nine to 12 months on behalf Solar panels installed atop HDB blocks
of various government agencies.
FLOATING SOLAR PV
Due to Singapore’s limited land space, most of the solar panels in the country are installed on rooftops.
Floating PV is an innovation that allows solar panels to be installed on water bodies, such as reservoirs,
to further increase our solar capacity.
PUB and EDB are test-bedding a floating solar PV system on Tengeh Reservoir which can generate up
to 3.3GWh of electricity per annum, equivalent to the average annual energy consumption of 750 HDB
households. At a cost of $11 million, the project will also assess the impact of solar PV deployment on
reservoir evaporation, biodiversity and water quality.30 CLIMATE ACTION PLAN REDUCING CARBON EMISSIONS IN POWER GENERATION
100 PER CENT RENEWABLE ENERGY
IN SINGAPORE
On November 16, 2015, Apple announced that it would power 100 per cent of its Singapore operations
with renewable energy, starting from January 2016 – a first for a company in Singapore.
The Offsite Power Purchase Agreement (PPA) between Apple and Sunseap, the first of its kind in
Southeast Asia, will allow Apple to attribute the power it consumes to electricity generated from solar
panels installed on more than 800 buildings in Singapore, including some on its own facilities.
2%
WASTE GENERATED
NON-INCINERABLE WASTE
21,023 TONNES/DAY COLLECTION LANDFILL
516 TONNES/DAY
RESIDENTIAL
38%
INCINERABLE WASTE
60% 7,886 TONNES/DAY
RECYCLABLE WASTE ASH
12,621 TONNES/DAY 1,766
TONNES/DAY
61%
TOTAL RECYCLED WASTE METALS RECOVERED
RECYCLE WASTE-TO-
INDUSTRIAL 12,739 TONNES/DAY 118 TONNES/DAY ENERGY
ELECTRICITY
2,702MWH/DAY
COMMERCIAL
Figure 3-10: Recycling and Waste-to-Energy in Singapore (2015)31
INCREASING EFFICIENCY OF This increases energy recovery
WASTE-TO-ENERGY PLANTS from waste and reduces carbon
emissions. Sembcorp Industries’
Incinerating waste is more new utility plant, expected to start
environmentally-friendly than landfilling. operation on Jurong Island at the end
The latter generates much higher of 2016, will generate steam from waste
emissions33, including methane gas, in an efficient, environmentally-friendly
which is a more potent GHG than CO2. manner to meet the steam demand of
In Singapore, waste that is not recycled surrounding facilities.
is incinerated in Waste-to-Energy (WTE)
plants, in a process that also produces NEA will also maximise resource and
energy. This reduces waste volume by 90 energy recovery in its new Integrated
per cent and generates enough electricity Waste Management Facility (IWMF),
to meet up to 3 per cent34 of Singapore’s which will be completed in 2024. It will
total electricity demand. The generation of be co-located with PUB’s Tuas Water
electricity from waste reduces the amount Reclamation Plant to further optimise
of fossil fuel used to generate electricity in efficiency. The IWMF will generate
our power plants. electricity for the water reclamation
plant, while the latter will provide the
NEA will work with companies IWMF with treated used water for
developing new WTE plants to help cooling and washing.
them harness new technologies
that optimise resource and energy LOOKING AHEAD
recovery. For example, the new WTE
plant under construction in Tuas will be Singapore will continue to study
Singapore’s largest, with the ability to technologies that can increase the
incinerate 3,600 tonnes of waste per efficiency of power generation and
day and generate 120MW of electricity. support increased adoption of alternative
This is about 80 per cent more electricity energy. Singapore conducted a nuclear
per tonne of waste than current WTE energy pre-feasibility study, which
plants. This will reduce dependence concluded that current nuclear energy
on conventional fossil fuel technologies were not yet suitable
power plants and reduce carbon for deployment in Singapore. We
emissions. will continue to monitor the progress
of nuclear technologies and build
The incineration of industrial and capabilities to understand nuclear science
commercial waste at utility plants and technology. The next chapter provides
can also generate electricity, an overview of Singapore’s energy and
steam, and other by-products. low-carbon research initiatives.
33 According to the IPCC, compared to landfilling, waste incineration avoids most GHG generation, resulting in only minor emissions of CO2.
Source: IPCC AR4 WG3, 10.3.4 CO2 from waste incineration
34 In 2015, a total of 1,265,567MWh of energy, or about 2.5 per cent of electricity generated, was produced from incineration.You can also read