Tandridge District Council Water Cycle Study - Phase 2 Outline Study
←
→
Page content transcription
If your browser does not render page correctly, please read the page content below

Tandridge District
Council
Water Cycle Study –
Phase 2 Outline Study

June 2018

www.jbaconsulting.com

Tandridge District Council

Council Offices
Station Road East
Oxted
Surrey
RH8 0BT

2018s0255 TDC WCS Phase 2 Outline v2.0   i
JBA Project Manager
Alistair Clark
8a Castle Street
Wallingford
Oxfordshire
OX10 8DL

Revision history
 Revision Ref/Date          Amendments                                      Issued to
 V1.0                       Draft Report                                    Mark Bristow
 04/06/2018
 V2.0                       Amendments in response to feedback from TDC     Mark Bristow
 28/06/2018                 and addition of Water Quality Assessment.

Contract
This report describes work commissioned by Tandridge District Council in February 2018.
Tandridge District Council’s representative for the contract was Mark Bristow. Alistair Clark and
Richard Pardoe of JBA Consulting carried out this work.

Prepared by .................................. Richard Pardoe MSc MEng

                                             Analyst

.................................................... Nathan Chapman BSc

                                             Assistant Analyst

Reviewed by .................................. Alistair Clark BSc MSc

                                             Senior Analyst

Purpose
This document has been prepared as a Final Report for Tandridge District Council. JBA
Consulting accepts no responsibility or liability for any use that is made of this document other
than by the Client for the purposes for which it was originally commissioned and prepared.
JBA Consulting has no liability regarding the use of this report except to Tandridge District
Council.

2018s0255 TDC WCS Phase 2 Outline v2.0                                                       i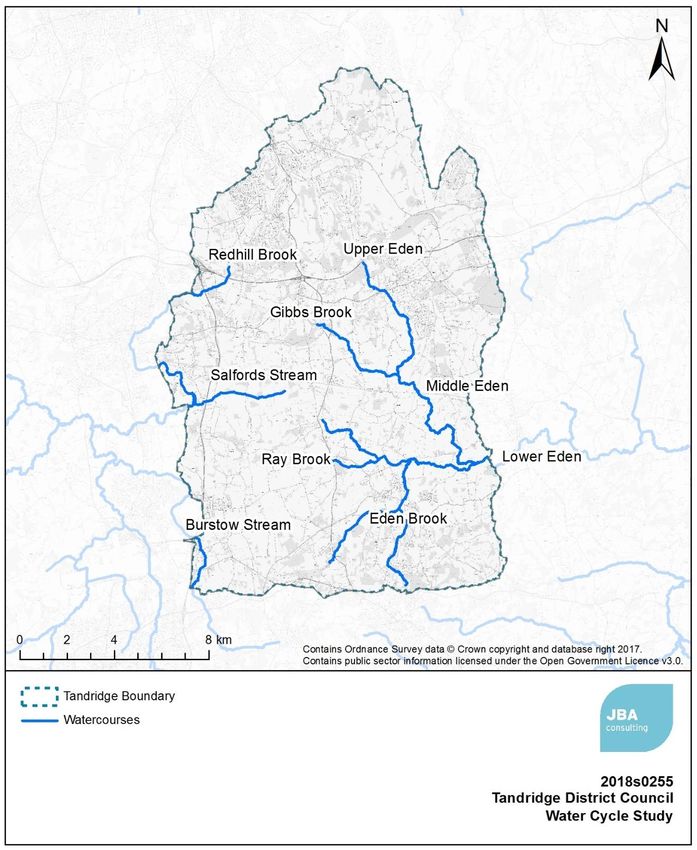
Acknowledgements
JBA Consulting would like to thank Mark Bristow of Tandridge District Council, Charlotte Mayall
of Southern Water, Alison Murphy of Sutton and East Surrey Water and Nicky McHugh of Thames
Water for their assistance in preparing this report.

Copyright
© Jeremy Benn Associates Limited 2018.

Carbon footprint
A printed copy of the main text in this document will result in a carbon footprint of 363g if 100%
post-consumer recycled paper is used and 462g if primary-source paper is used. These figures
assume the report is printed in black and white on A4 paper and in duplex.
JBA is aiming to reduce its per capita carbon emissions.

2018s0255 TDC WCS Phase 2 Outline v2.0                                                        ii
Executive summary
    In March 2018, JBA Consulting was commissioned by Tandridge District Council to
    undertake a Water Cycle Study (WCS). This study assesses the potential issues relating to
    future development within the Tandridge district and the impacts on water supply,
    wastewater collection and waste water treatment. The Water Cycle Study is required to
    assess the constraints and requirements that will arise from potential growth on the water
    infrastructure.
    New homes require the provision of clean water, safe disposal of wastewater and protection
    from flooding. The allocation of large numbers of new homes in certain locations may result
    in the capacity of existing available infrastructure being exceeded, a situation that could
    potentially cause service failures to water and wastewater customers, adverse impacts to
    the environment, or high costs for the upgrade of water and wastewater assets being
    passed on to the bill payers.
    In addition to increased housing demand, future climate change presents further challenges
    and pressure on the existing water infrastructure network, including an increased intensity
    of rainfall events and a higher frequency of drought events. Sustainable planning for water
    must now take this into account. The water cycle can be seen in the figure below and shows
    how the natural and man-made processes and systems interact to collect, store or transport
    water in the environment.
                                      The Water Cycle

                          Source: Environment Agency – Water Cycle Study Guidance

2018s0255 TDC WCS Phase 2 Outline v2.0                                                     iii
This study will assist the council to select and develop sustainable development allocations
    where there is minimal impact on the environment, water quality, water resources,
    infrastructure, and flood risk. This has been achieved by identifying areas where there may
    be conflict between any proposed development and the requirements of the environment
    and by recommending solutions to these conflicts.
    The phase 1 scoping study concluded that the following assessments were required as part
    of the outline study:

               •      Water resources
               •      Water supply infrastructure
               •      Wastewater collection infrastructure
               •      Wastewater treatment capacity
               •      Water quality
               •      Flood risk from additional foul flow
               •      Odour from WwTW
               •      Environmental opportunities and constraints

    The purpose of this phase 2 outline study is to build on the growth forecast developed in
    the phase 1 scoping study and carry out the assessments listed above, providing part of
    the evidence base for the Tandridge Local Plan.

    Water resources
    The phase 1 scoping study concluded that further assessment of water resources was
    required in phase 2 to understand the difference between the forecast in the water resource
    management plan (WRMP) and the objectively assessed need (OAN) for Tandridge, and to
    take a regional view of growth across the water resource zone (WRZ) to ensure growth is
    adequately provided for in the WRMP.
    It was shown that growth within Tandridge is broadly in line with the average across the
    WRZ. Sutton and East Surrey Water were asked to comment on the use of the econometric
    forecast in their WRMP and confirmed that it was chosen as it provides the best fit to historic
    growth data. They carry out uncertainty analysis that includes higher than predicted
    growth, and the forecast is reassessed annually with a complete revision every five years.
    Based on the comments from Sutton and East Surrey Water, and the evidence
    presented in their WRMP that there is a water resource surplus predicted until
    2047, there is sufficient time to adapt the term plan to include emerging trends in
    population and no further assessment of water resources is required in a phase
    three detailed study.

    Water supply infrastructure
    SESW carried out a modelling study of the impact of the development sites on the water
    supply network. This concluded that eight of the proposed sites WILL require network
    reinforcements, and a further fourteen MAY require reinforcement. There is capacity at the
    remaining sites to serve the proposed growth. No significant constraints to the provision
    of these upgrades have been identified, however extensive reinforcement will be required
    at the South Godstone garden community site including a new main to connect to the
    Blindley Heath trunk main.

2018s0255 TDC WCS Phase 2 Outline v2.0                                                         iv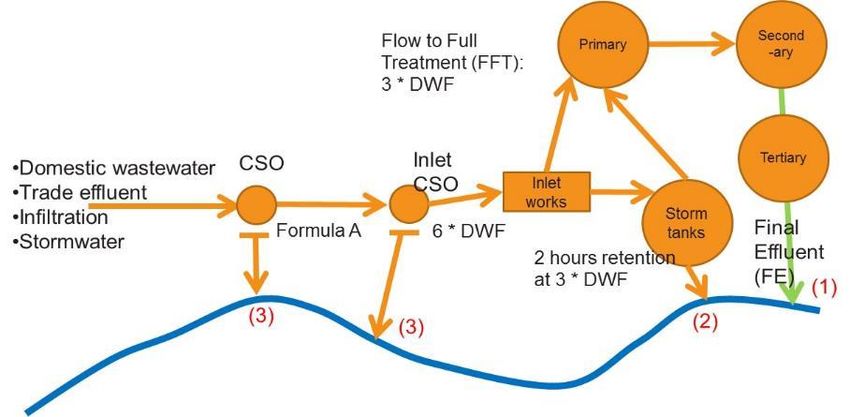
Early developer engagement with SESW is essential to ensure that, where
necessary, network reinforcement is delivered prior to developments becoming
occupied. No further assessment is required in a phase 3 WCS.
Wastewater collection infrastructure
Southern Water and Thames Water provided a site by site RAG assessment of wastewater
infrastructure within their catchments. The study concluded that upgrades to the sewerage
network were required in order to serve the potential garden community sites, and five
other potential development sites. No significant constraints to provision of this
infrastructure have been identified.
Sewerage Undertakers have a duty under Section 94 of the Water Industry Act 1991 to
provide sewerage and treat wastewater arising from new domestic development. Except
where strategic upgrades are required to serve very large or multiple developments,
infrastructure upgrades are usually only implemented following an application for a
connection, adoption, or requisition from a developer. Early developer engagement with
water companies is therefore essential to ensure that sewerage capacity can be provided
without delaying development.
No further assessment of wastewater sewerage network capacity is required as
part of a phase 3 detailed study.
Wastewater treatment capacity
A headroom assessment was carried out by JBA Consulting on the WwTW likely to serve
growth within Tandridge, and a RAG assessment with comments was provided by Southern
Water and Thames Water on their infrastructure.
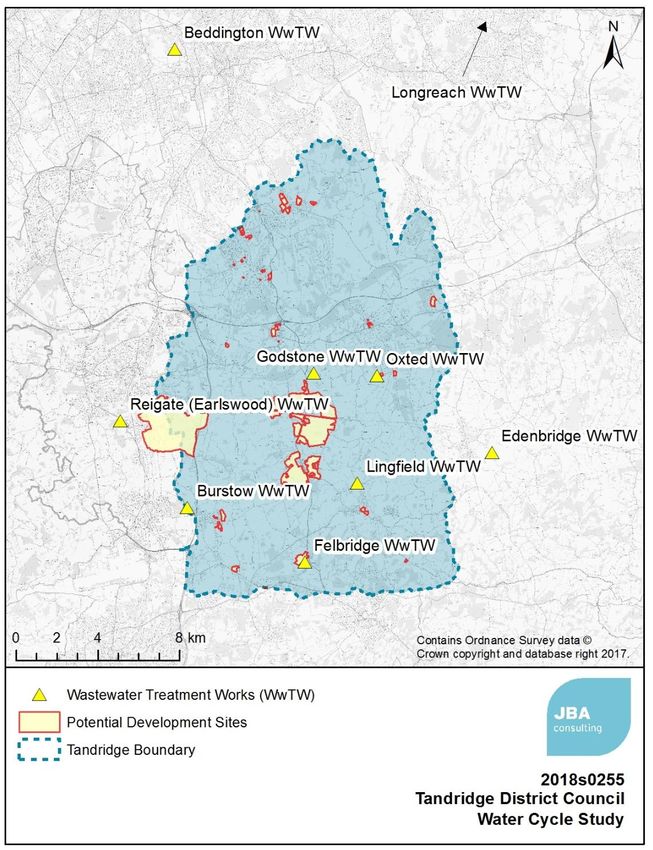
Nine wastewater treatment works (WwTW) are likely to serve growth within Tandridge.
Beddington and Longreach are very large works to the north of Tandridge, and planned
growth within Tandridge represents a negligible increase wastewater flows. No further
assessment was made of these works, and Thames Water confirmed that there is capacity
to receive additional flow. Edenbridge is predicted to receive only a small increase in flow
from two committed sites and is therefore not assessed.
Capacity is available at Felbridge and Godstone WwTW to serve proposed growth
throughout the Local Plan period. Burstow WwTW is currently close to its permit limit and
additional flow will cause its permit to be exceeded within the next five years. A new permit,
or upgrades to this WwTW are required.
Lingfield WwTW has the capacity to accept planned growth up to AMP10 (2035-2040) in
the scenario where one garden community site is provided (South Godstone). In the
unlikely event of two garden community sites being provided in this catchment, its permit
would be exceeded in AMP9 (2030-2035). Oxted is currently exceeding its DWF permit due
to infiltration and it is intended that an infiltration scheme is included in the draft PR19 plan.
This should enable Southern Water to meet the forecast growth in the Oxted catchment in
2020-2025. Any development in this catchment must be carefully phased with upgrades
to this works, and early engagement between the developer and Southern Water is
essential.
Reigate WwTW is currently close to its permit. Much of the growth in this catchment is
from outside Tandridge and is likely to be accommodated through a planned capacity
upgrade. Should the Redhill Aerodrome garden community site be adopted, a further
upgrade will be required to the WwTW at a potential cost of £20M. Clarity is therefore
required at an early stage to avoid sunk cost in Thames Water’s upgrade plans.
Further study of the schedule of upgrades at Burstow, Lingfield, Oxted and Reigate
WwTW is recommended as part of a phase 3 detailed study.
2018s0255 TDC WCS Phase 2 Outline v2.0 v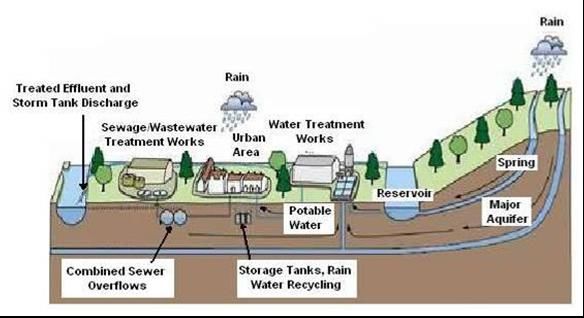
Water quality
      •   Proposed levels of growth to be treated by Burstow, Felbridge and Oxted WwTW's
          would not lead to a deterioration, either of 10% or of class in any of the measures
          determinands. Existing treatment permits are therefore suitable for these works.
      •   Increased effluent discharges due to growth at Lingfield WwTW is predicted to lead
          to deterioration of 10% or more, and/or of class. In all cases, deterioration could
          be prevented by a tightening of permits and possible infrastructure improvements
          for effluent to be treated at technically achievable limit (TAL).
      •   At Godstone WwTW, Ammonia is predicted to deteriorate by 10% or more and
          Phosphate, already classed as Bad, deteriorating by more than 3%. In both cases,
          deterioration can be limited through infrastructure improvements and tighter
          permit limits.
      •   At Godstone WwTW, assuming upstream water quality meets Good status and
          effluent is treated at TAL, BOD is still predicted to deteriorate from Good to
          Moderate status. The downstream sampling point WQ TH-E0000902, BOD class is
          predicted to remain at Good status, however, BOD has not been classified within
          the WFD 2016 classification for the Gibbs Brook therefore, it cannot be assessed in
          regard to class deterioration.
      •   None of the receiving watercourses currently meet Good class for Phosphorous
          downstream of the WwTW's investigated. In all cases current technology to treat
          Phosphorous is limited. Assuming that upstream water quality can be improved to
          meet Good, then Good class could be met downstream of Felbridge, Godstone,
          Lingfield and Oxted WwTWs. This is achievable through upgrading treatment
          technologies so that effluent is treated to the technically achievable limit and would
          not be compromised in the future by the proposed scale of development. At
          Burstow WwTW, Good class could not be met in the present day or through
          treatment at TAL. The Burstow Stream is currently Poor with the objective to meet
          Moderate by 2027.
      •   At Reigate (Earlswood) WwTW, based on SIMCAT results, all determinands
          currently are classed as 'Bad'. There is however, no deterioration greater than 3%
          when tested with future growth. Through treatment at TAL, both BOD and
          Phosphate can be improved to meet Good class, with Ammonia improving to
          Moderate class. The Earlswood Brook has not been classified within WFD waterbody
          classifications therefore, the Mole (Horley to Hersham) has been assigned for the
          reach. The reach currently meets Moderate ecological status, with Ammonia
          meeting Good and both BOD and Phosphate meeting Poor.
      •   An analysis of the potential impacts of reduced river flows (10% reduction in mean
          flow, and 20% Q95) as a result of climate change indicate that there is a significant
          risk of deterioration of water quality. It is expected that future River Basin
          Management Plans will investigate this risk further and consider how it can be
          mitigated. Wherever possible, plans should promote "no-regrets" decisions which
          enhance the resilience of river systems to climate change impacts, for example by
          promoting Catchment Based Approaches.
    The planned growth within Tandridge District and its neighbouring authorities can
    be accommodated without causing a deterioration in water quality for sanitary
    determinands and nutrients, so long as timely interventions to prevent
    deterioration are implemented by Thames Water, Southern Water and the
    Environment Agency. No additional assessment of water quality is recommended
    in a Phase 3 WCS.

2018s0255 TDC WCS Phase 2 Outline v2.0                                                      vi
Flood risk from additional foul flow
    A detailed assessment of flood risk can be found in the Tandridge District Council’s Level 1
    Strategic Flood Risk Assessment (December 2017). The impact of increased effluent flows
    due to planned growth is not predicted to have a significant impact on flood risk in any of
    the receiving watercourses.
    No further assessment is recommended in a phase 3 WCS.

    Odour from WwTW
    Three sites are close enough to a WwTW that a further odour assessment is recommended
    as part of the planning process. The cost for this should be met by the developer.
    No further assessment of odour is recommended in the phase 3 detailed study.
    Any future assessment should be carried out as part of the planning process.

    Environmental constraints
    A number of SSSIs exist within Tandridge, and a hydrological pathway exists to a SAC (Mole
    Gap to Reigate Escarpment) to the north west.
    WwTWs are considered to be point sources of pollution, but the water quality study has
    showed that the impact of additional discharge from WwTW can be mitigated by upgrades
    / improvements to treatments works and tightened permits. The impact on sites with
    environmental designations downstream is therefore likely to be minimal.
    Development sites within Tandridge could be sources of diffuse pollution from surface
    runoff, with some of the development sites having a direct surface water pathway to a SSSI.
    Runoff in these sites should be managed through implementation of a SuDS scheme with a
    focus on treating the water quality of surface runoff. The cumulative impact of all
    development within a catchment should be considered, and incorporation of SuDS
    encouraged on sites even where there is no direct pathway to a SSSI.
    No further assessment of environmental constraints and opportunities is
    recommended in a phase 3 detailed study.

2018s0255 TDC WCS Phase 2 Outline v2.0                                                      vii
Contents 1 Introduction 14 1.1 Terms of Reference 14 1.2 The Water Cycle 14 1.3 Impacts of Development on the Water Cycle 15 1.4 Objectives 15 1.5 Study Area 15 1.6 Record of Engagement 16 1.6.1 Introduction 16 1.6.2 Outline Study Engagement 16 2 Future Growth in Tandridge 17 2.1 Tandridge District 17 2.2 Growth in Tandridge 18 2.3 Components of development forecast 18 2.3.1 Garden community sites 18 2.3.2 Summary 19 2.4 Growth in Neighbouring LPAs 19 3 Legislative and Policy Framework 20 3.1 Introduction 20 3.2 Changes since Phase 1 Scoping study 20 4 Water Resources and Water Supply 21 4.1 Introduction 21 4.1.1 Surface Waters 21 4.2 Availability of Water Resources 22 4.2.1 Conclusions of phase 1 scoping study 22 4.2.2 Water Resource Assessment: Water Resource Management Plans 22 4.2.3 Population and Household Growth 22 4.2.4 Sutton and East Surrey Water assessment 25 4.2.5 Conclusions 26 4.3 Water Supply Infrastructure 27 4.3.1 Introduction 27 4.3.2 Methodology 27 4.3.3 Results 28 4.3.4 Conclusions 29 4.3.5 Recommendations 30 5 Wastewater collection 31 5.1 Sewerage Undertaker for Tandridge 31 5.2 Sewerage System Capacity Assessment 31 5.3 Methodology 32 5.3.1 Data Collection 32 5.4 Results 33 5.5 Conclusions 34 5.6 Recommendations 35 6 Wastewater Treatment 36 6.1 Wastewater Treatment Works in Tandridge 36 6.2 Wastewater Treatment Works Flow Permit Assessment 37 6.2.1 Introduction 37 6.3 Methodology 39 2018s0255 TDC WCS Phase 2 Outline v2.0 viii
6.4      Results                                                              39
6.4.1    Beddington WwTW                                                      39
6.4.2    Burstow WwTW                                                         39
6.4.3    Edenbridge WwTW                                                      40
6.4.4    Felbridge WwTW                                                       40
6.4.5    Godstone WwTW                                                        41
6.4.6    Lingfield WwTW                                                       42
6.4.7    Longreach WwTW                                                       43
6.4.8    Oxted WwTW                                                           43
6.4.9    Reigate WwTW                                                         44
6.5      Impact of higher than expected growth                                45
6.6      Conclusions                                                          45
6.6.1    Recommendations                                                      46
7        Water quality assessment                                             47
7.1      Introduction                                                         47
7.2      Methodology                                                          47
7.2.1    Data Collection                                                      49
7.3      Results                                                              50
7.4      Priority substances and other EU-level dangerous substances          52
7.5      Recommendations                                                      53
8        Flood Risk Management                                                54
8.1      Assessment of Additional Flood Risk from Increased WwTW Discharges   54
8.1.1    Introduction                                                         54
8.2      Methodology                                                          54
8.3      Results                                                              54
8.4      Impact of higher than expected growth                                55
8.5      Conclusions                                                          55
8.6      Recommendations                                                      55
9        Odour Assessment                                                     56
9.1      Introduction                                                         56
9.2      Methodology                                                          56
9.2.1    Data Collection                                                      56
9.2.2    Results                                                              56
9.3      Conclusions                                                          57
10       Environmental Opportunities and Constraints                          58
10.1     Introduction                                                         58
10.2     Sites with Environmental Designation                                 58
10.2.1   Sites protected by European designations                             58
10.2.2   Sites of Special Scientific Interest                                 60
10.3     Point source pollution                                               61
10.4     Diffuse sources of water pollution                                   61
10.5     Surface Water Drainage and SuDS                                      65
10.5.1   Use of SuDS in Water Quality Management                              66
10.5.2   Additional benefits                                                  68
10.6     Conclusions                                                          69
10.7     Recommendations                                                      69
11       Climate change Impact Assessment                                     71
11.1     Approach                                                             71
11.1.1   Wastewater collection and treatment                                  71
11.1.2   Water quality                                                        71
11.2     Results summary                                                      71

2018s0255 TDC WCS Phase 2 Outline v2.0                                        ix
11.3     Conclusions and Recommendations          72
12       Summary and overall conclusions          74
12.1     Summary of phase 2 outline study         74
12.2     Recommendations                          77
12.3     Requirement for phase 3 detailed study   83
12.3.1   A realistic approach                     83
12.3.2   Strategic schemes                        83
12.3.3   Safeguarding strategic sites             83

2018s0255 TDC WCS Phase 2 Outline v2.0            x
List of Figures
Figure 1.1 The Water Cycle                                                           15
Figure 2.1 Map of the water cycle study area and potential development sites         17
Figure 4.1 Watercourses within the study area                                        21
Figure 4.2 Local authorities within Sutton and East Surrey water resource zone       24
Figure 6.1 WwTWs serving Tandridge                                                   36
Figure 6.2 Overview of typical combined sewerage system and WwTW discharges          37
Figure 6.3 Headroom assessment for Burstow WwTW                                      40
Figure 6.4 Headroom assessment for Felbridge WwTW                                    41
Figure 6.5 Headroom assessment for Godstone WwTW                                     41
Figure 6.6 Headroom assessment for Lingfield WwTW                                    42
Figure 6.7 Headroom assessment for Oxted WwTW                                        43
Figure 6.8 Headroom assessment for Reigate WwTW                                      44
Figure 7.1 Water quality impact assessment following EA Thames West guidance         48
Figure 7.3: WFD Cycle 2 Water Quality Classifications of Watercourses in Tandridge
District                                                                             49
Figure 10.1 Sites with environmental designations within or close to Tandridge       59
Figure 10.2 SSSIs within Tandridge in relation to potential development sites        60

List of Tables
Table 2.1 Indicative figures for housing and employment in garden community sites    19
Table 2.2 Summary of housing development                                             19
Table 4.1 Summary of growth forecasts                                                23
Table 4.2 Growth within water resource zone by local authority                       25
Table 4.3 Summary of RAG score for water resources                                   26
Table 4.4 Summary of RAG score by site                                               28
Table 5.1 Southern Water and Thames Water RAG assessment of sewerage network
capacity                                                                             33
Table 5.2 Wastewater collection system assessment recommendations                    35
Table 6.1 Indicative growth served by each WwTW (realistic scenario)                 38
Table 8.1 Summary of DWF increase as a percentage of Q30 and Q100 peak flow          55
Table 8.2 Summary of Flood Risk Management Recommendations                           55
Table 10.1 WwTW relative to sites with environmental designations                    61
Table 10.2 Potential sources of diffuse pollution and receptors                      62
Table 11.1 Climate change pressures scoring matrix                                   71
Table 11.2 Scoring of climate change consequences for the Water cycle Study          72
Table 11.3 Climate change actions                                                    73
Table 12.1 Summary of phase 2 outline study conclusions                              74

Abbreviations
ALS                   Abstraction Licensing Strategy
AMP                   Asset Management Plan
AMR                   Automatic Meter Reading
AONB                  Area of Outstanding Natural Beauty
AP                    Assessment Point
ASNW                  Ancient Semi-Natural Woodland
BERR                  Department for Business Enterprise and Regulatory Reform
BIDS                  Business, Industrial, Distribution and Storage
BOD                   Biochemical Oxygen Demand

2018s0255 TDC WCS Phase 2 Outline v2.0                                                xi
BREEAM              Building Research Establishment Environmental Assessment
                    Methodology
CAMS                Catchment Abstraction Management Strategies
CAPEX               Capital Expenditure
CED                 Common End Date
CFMP                Catchment Flood Management Plan
CfSH                Code for Sustainable Homes
CSO                 Combined Sewer Overflow
DCLG                Department of Communities and Local Government
DWF                 Dry Weather Flow
DWI                 Drinking Water Inspectorate
DYAA                Dry Year Annual Average
DYCP                Dry Year Critical Period
EA                  Environment Agency
EC                  European Community
ECA                 European Communities Act
EDNA                Economic Development Needs Assessment
EFI                 Ecological Flow Indicator
EP                  Environmental Permit
EU                  European Union
FEH                 Flood Estimation Handbook
FFT                 Flow to Full Treatment
FWMA                Flood and Water Management Act
FZ                  Flood Zone
GES                 Good Ecological Status
GIS                 Geographic Information Systems
HOF                 Hands-Off Flow
HOL                 Hands-off Level
IDB                 Internal Drainage Board
IDP                 Infrastructure Delivery Plan
JBA                 Jeremy Benn Associates
LLFA                Lead Local Flood Authority
LPA                 Local Planning Authority
l/p/d               Litres per person per day
Ml/d                Mega (Million) litres per day
NE                  Natural England
NH4                 Ammonia
NPPF                National Planning Policy Framework
NYAA                Normal Year Average Annual
OAN                 Objectively Assessed Need
OfWAT               Water Service Regulation Authority
ONS                 Office of National Statistics
OPEX                Operational Expenditure
OS                  Ordnance Survey

2018s0255 TDC WCS Phase 2 Outline v2.0                                         xii
P Phosphorous PDL Previously Developed Land PE Population Equivalent p/h Person per house PPS Planning Policy Statement RAG Red / Amber / Green assessment RBD River Basin District RBMP River Basin Management Plan ReFH Revitalised Flood Hydrograph RNAG Reason for Not Achieving Good (Status) RQP River Quality Planning tool RZ Resource Zone SA Sustainability Appraisals SAC Special Area of Conservation SBP Strategic Business Plan SEA Strategic Environmental Assessment SEPA Scottish Environmental Protection Agency SESW Sutton and East Surrey Water SFRA Strategic Flood Risk Assessment SHELAA Strategic Housing and Economic Land Availability Assessment SHMA Strategic Housing Market Assessment SPA Special Protection Area SPD Supplementary Planning Document SPZ Source Protection Zone SS Suspended Solids SSSI Site of Special Scientific Interest SU Sewerage Undertaker SW Southern Water SuDS Sustainable Drainage Systems SWMP Surface Water Management Plan TCAMS Thames Catchment Abstraction Management Strategy TDC Tandridge District Council TW Thames Water UWWTD Urban Waste Water Treatment Directive WaSC Water and Sewerage Company WCS Water Cycle Study WFD Water Framework Directive WRMP Water Resource Management Plan WRZ Water Resource Zone WQA Water Quality Assessment WSZ Water Supply Zone WTW Water Treatment Works WwTW Wastewater Treatment Works 2018s0255 TDC WCS Phase 2 Outline v2.0 xiii
1 Introduction

1.1   Terms of Reference
      JBA Consulting was commissioned by Tandridge District Council to undertake a Water Cycle
      Study (WCS) for Tandridge district to inform the Local Plan. The purpose of the WCS along
      with the Strategic Flood Risk Assessment (SFRA) is to form part of a comprehensive and
      robust evidence base for the Local Plan which will set out a vision and framework for
      development in the district up to 2033 and will be used to inform decisions on the location
      of future development.
      Unmitigated future development and climate change can adversely affect the environment
      and water infrastructure capability. A WCS will provide the required evidence, together
      with an agreed strategy to ensure that planned growth occurs within environmental
      constraints, with the appropriate infrastructure in place in a timely manner so that planned
      allocations are deliverable.
      A phase one scoping study was completed in May 2018, and established that further
      assessment was required in the following areas:

                     •        Water resources
                     •        Water supply infrastructure
                     •        Wastewater collection infrastructure
                     •        Wastewater treatment capacity
                     •        Water quality
                     •        Flood risk from additional foul flow
                     •        Odour from WwTW
                     •        Environmental constraints

1.2   The Water Cycle
      National Planning Policy Framework Practice Guidance on Water Supply, Wastewater and
      Water Quality1 describes a water cycle study as:
      "a voluntary study that helps organisations work together to plan for sustainable growth. It
      uses water and planning evidence and the expertise of partners to understand
      environmental and infrastructure capacity. It can identify joined up and cost-effective
      solutions, that are resilient to climate change for the lifetime of the development.
      The study provides evidence for Local Plans and sustainability appraisals and is ideally done
      at an early stage of plan-making. Local authorities (or groups of local authorities) usually
      lead water cycle studies, as a chief aim is to provide evidence for sound Local Plans but
      other partners often include the Environment Agency and water companies."
      The Environment Agency's guidance on WCS2 recommends a phased approach:
          •    Phase 1: Scoping study, focussing on formation of a steering group, identifying
               issues for consideration and the need for an outline study.
          •    Phase 2: Outline study, to identify environmental constraints, infrastructure
               constraints, a sustainability assessment and consideration of whether a detailed
               study is required.

 —————————————————————————————————————————————
 1 Planning Practice Guidance: Water supply, wastewater and water quality, Department for Communities and Local Government (2014).
 Accessed online at: http://planningguidance.planningportal.gov.uk/blog/guidance/ on: 09/03/2018
 2 Water Cycle Study Guidance, Environment Agency (2009). Accessed online at:
 http://webarchive.nationalarchives.gov.uk/20140328084622/http://cdn.environment-agency.gov.uk/geho0109bpff-e-e.pdf on:
 09/03/2018
 2018s0255 TDC WCS Phase 2 Outline v2.0                                                                                     14
• Phase 3: Detailed study, to identify infrastructure requirements, when they are
required, how they will be funded and implemented and an overall assessment of
the sustainability of proposed infrastructure.
Figure 1.1 below shows the main elements that compromise the Water Cycle and shows
how the natural and man-made processes and systems interact to collect, store or transport
water in the environment.
Figure 1.1 The Water Cycle
1.3 Impacts of Development on the Water Cycle
New homes require the provision of clean water, safe disposal of wastewater and protection
from flooding. It is possible that allocating large numbers of new homes at some locations
may result in the capacity of the existing available infrastructure being exceeded. This
situation could potentially lead to service failures to water and wastewater customers, have
adverse impacts on the environment or cause the high cost of upgrading water and
wastewater assets being passed on to bill payers. Climate change presents further
challenges such as increased intensity and frequency of rainfall and a higher frequency of
drought events that can be expected to put greater pressure on the existing infrastructure.
1.4 Objectives
As a WCS is not a statutory instrument, Local Planning Authorities are advised to prioritise
the different stages of the WCS to integrate with their Local Plan programme. This outline
report is written as an interim report to support the development of the Local Plan and to
identify whether a detailed WCS is required. This study will apply the growth forecast
developed in phase 1 and assess its impact on water and wastewater infrastructure and the
environment.
1.5 Study Area
This WCS outline report has been written for Tandridge District Council. This Local Authority
area covers 248km2 and includes the towns of Caterham, Godstone, Lingfield, and Oxted
and has a population of approximately 87,000.
The area is located within the River Mole, and River Medway catchments to the west and
east respectively. The area north of the North Downs is in the catchment of the Caterham
Bourne.
Water supply services for Tandridge are provided by Sutton and East Surrey Water, and
wastewater serves are split between Thames Water and Southern Water.
2018s0255 TDC WCS Phase 2 Outline v2.0 151.6 Record of Engagement
1.6.1 Introduction
Preparation of a WCS requires significant engagement with stakeholders, both within the
Local Planning Authority, with water and wastewater utilities, with the environment agency,
and where there may be cross-boundary issues, with neighbouring local authorities. This
section forms a record of engagement for the WCS.
1.6.2 Outline Study Engagement
The preparation of the scoping study was supported by the following engagement:
Engaged TDC
Parties Southern Water
Sutton and East Surrey Water
Thames Water
Details Site by site assessment of water infrastructure, and
WwTW. Follow-up discussions to clarify scoring.
Engaged Natural England
Parties
Details Clarification of Impact Risk Zones (email exchange)
Engaged Environment Agency
Parties
Details Supply of water quality data and SIMCAT models
2018s0255 TDC WCS Phase 2 Outline v2.0 162 Future Growth in Tandridge
2.1 Tandridge District
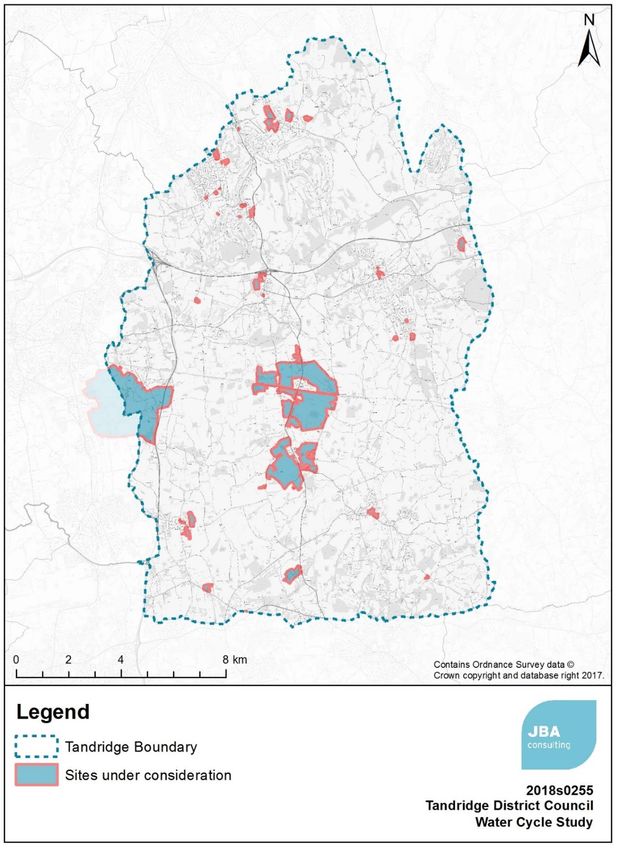
Figure 2.1 shows the location of potential development sites within the TDC boundary.
Figure 2.1 Map of the water cycle study area and potential development sites
2018s0255 TDC WCS Phase 2 Outline v2.0 172.2 Growth in Tandridge
The Strategic Housing Market Assessment (SHMA)3 carried out in 2015 provided a detailed
analysis of population demographics and the housing market within Tandridge and resulted
in the definition of the Objectively Assessed Need (OAN)4 for the district.
This assessment was based on the Department for Communities and Local Government
(DCLG) 2012-based household projections, updated with the 2014 mid-year estimates
released in June 2015 and the international migration statistics for the year up to March
2015.
The conclusion of the assessment was that a total of 9,440 houses were required during
the plan period (2013-2033) or an average of 470 / year.
2.3 Components of development forecast
For the purpose of the assessments within the WCS, a baseline growth forecast is defined
for development in Tandridge over the Local Plan period. This forecast is made up of the
following components:
• Housing and Economic Land Availability Assessment (HELAA)
• Garden community sites
• Commitments (development sites already in the planning system, but not yet built)
• Windfall
• Development from outside the Tandridge boundary, but served by infrastructure
within or shared with Tandridge (this forecast has not yet been received from
neighbouring LPAs so is not included in this report, however this will be
documented in the Phase 1 report and included in future assessments)
These have been collated into an overall forecast summarised in Table 2.2 below. The full
assessment of growth can be found in the Phase 1 Scoping study.
2.3.1 Garden community sites
The Spatial Approaches Topic Paper (2015)5 presented the concept of a new or extended
settlement as a route to deliver the growth required within the district. Three broad
locations are considered within the WCS:
• Redhill Aerodrome
• South Godstone
• Blindley Heath
Two scenarios for Garden community sites will be analysed, the first where one garden
community site is adopted, South Godstone has been chosen for this purpose. The second
tests the unlikely event of the Council being expected to provide three garden community
sites representing the most extreme case for water demand.
—————————————————————————————————————————————
3 Strategic Housing Market Assessment, TDC (2015). Accessed online at:
https://www.tandridge.gov.uk/Portals/0/Documents/Planning%20and%20building/Planning%20strategies%20and%2
0policies/Local%20plan/Evidence%20base%20and%20technical%20studies/Strategic-Housing-Market-Assessment-
2015-Front-Page.pdf on: 26/02/2018
4 The Objectively Assessed Housing Needs of Tandridge, NMSS (2015). Accessed online at:
https://www.tandridge.gov.uk/Portals/0/Documents/Planning%20and%20building/Planning%20strategies%20and%2
0policies/Local%20plan/Evidence%20base%20and%20technical%20studies/Strategic-Housing-Market-Assessment-
2015-Tandridge-Objectively.pdf on: 26/02/2018
5 Spatial Approaches Topic Paper, TDC (2015). Accessed online at:
https://www.tandridge.gov.uk/Portals/0/Documents/Planning%20and%20building/Planning%20strategies%20and%20policies/Local%
20plan/Evidence%20base%20and%20technical%20studies/Spatial-Approaches-Topic-Paper.pdf on: 27/02/2018
2018s0255 TDC WCS Phase 2 Outline v2.0 18Table 2.1 Indicative figures for housing and employment in garden community sites
Broad Location Housing Employment (no.
units of employees)
Redhill Aerodrome 7000 2822
South Godstone 4000 2615
Blindley Heath 3000 2619
Consideration of these broad locations is at a very early stage; the estimates of housing
units and employment land are indicative only. It is therefore prudent to consider the effect
on water infrastructure if the size of the development was increased, or the mix of housing
and employment land was changed such that the water demand increased. A further
scenario will therefore be considered where the garden community site water and
wastewater demand are increased by 10%.
2.3.2 Summary
Table 2.2 summarises the development within Tandridge. The most realistic scenario
includes just one garden community site (South Godstone has been chosen for this
analysis).
Table 2.2 Summary of housing development
Housing units (All Housing units
sites) (Realistic scenario)
Completions 2013 to 1,518 1,518
2017
Commitments 2017/2018 1,115 1,115
HELAA 1,806 1,806
Garden community 14,000 4,000
Windfall 2013-2033 540 540
Total 18,979 8,979
Objectively Assessed 9,440 9,440
Need
2.4 Growth in Neighbouring LPAs
In the phase 1 scoping study, neighbouring authorities were approached under a duty to
cooperate request to understand how growth in neighbouring authorities may impact water
infrastructure within or shared with Tandridge. This allows the full picture of growth to be
taken into account when carrying out flow capacity and water quality assessments.
Responses to the DTC request are documented in the phase 1 scoping study and have been
included in all the assessments within the phase 2 outline study.
2018s0255 TDC WCS Phase 2 Outline v2.0 193 Legislative and Policy Framework
3.1 Introduction
Several national, regional and local policies must be considered by the LPAs, water
companies, and developers during the planning stage. A summary of these policies can be
found in section 3 of the Phase 1 Scoping study.
3.2 Changes since Phase 1 Scoping study
No major changes to relevant legislation and policy have been made since publication of
the phase 1 scoping study. It should be noted that consultation on the draft revised National
Planning Policy Framework (NPPF) closed in May 2018 and publication of the updated
framework is expected in late summer 2018. The draft update to the NPPF included limited
changes that would directly impact the water cycle study, however it may need to be
revisited should significant changes be made to the NPPF when published.
2018s0255 TDC WCS Phase 2 Outline v2.0 204 Water Resources and Water Supply
4.1 Introduction
4.1.1 Surface Waters
Figure 4.1 shows the main watercourses within the study area, which is divided between
two catchments, the Mole to the west and the Medway to the east.
Figure 4.1 Watercourses within the study area
2018s0255 TDC WCS Phase 2 Outline v2.0 214.2 Availability of Water Resources
4.2.1 Conclusions of phase 1 scoping study
The phase 1 scoping study concluded that:
• Tandridge lies in an area classed by the EA as being under “serious water stress”.
Water resources are limited in this region, although Sutton and East Surrey’s WRMP
shows a supply surplus until 2047.
• Four Abstraction Licencing Strategies (ALS) apply to Tandridge and impose
restrictions on water abstraction from both groundwater and surface water sources.
Surface water abstractions are frequently limited by restrictions in the Thames
Catchment Abstraction Management (CAMs) region which takes precedence over
the Mole and London ALS.
• The econometric forecast has been used in SESW’s WRMP. This forecasts lower
growth than would occur if the OAN is delivered. SESW will be asked to comment
on this as part of the phase 2 outline study. A regional view, including forecasts
from all the authorities within the water resource zone also needs to be taken in
account in order to ensure that growth is adequately provided for in the WRMP.
• A water supply-demand deficit is forecast by 2047
• A PCC of 122 l/p/d and occupancy rate of 2.41 will be used in the water cycle study
• Opportunities should be taken to further reduce water consumption by adopting the
higher standard 110l/p/d for residential developments and adopting the BREEAM
standard to reduce consumption in new non-residential buildings.
A detailed review of water resources can be found in section 4 of the phase 1 scoping study.
4.2.2 Water Resource Assessment: Water Resource Management Plans
When new development within a Local Planning Authority is being planned, it is important
to ensure that there are sufficient water resources in the area to cover the increase in
demand without risk of shortages in the future or during periods of high demand, and
without causing a negative impact on the waterbodies from which water is abstracted.
The aim of this assessment was to compare the future additional demand as a result of
development proposed within the emerging Local Plan, with the demand allowed for by
Sutton and East Surrey Water in their Water Resource Management Plan.
At the time of writing the Draft 2019 WRMP6 was undergoing a public consultation, due to
end 25 May 2018. This is the version discussed below, however it should be noted that this
is subject to change pending the results of the consultation.
4.2.3 Population and Household Growth
Experian were commissioned by SESW to provide population and household growth
forecasts as part of a project including other water companies in the south east. Four
forecasts were prepared using different methods (Trend based – from ONS statistics, Plan
based – from LPA plans, Econometric – taking into account economic pressures, and Hybrid
– a combination of plan based and econometric). The econometric forecast was used to
project household demand in the WRMP. The forecast extrapolates to the end of SESW’s
planning period (2080) and shows a 70% increase in households and a 41% increase in
population (with declining occupancy rates predicted). For the local plan period, 17%
growth was predicted over the whole of the water resource zone.
The household growth forecast used is therefore less than will occur if the OAN is delivered
(Table 4.1).
—————————————————————————————————————————————
6 Draft Water Resources Management Plan 2019, Sutton and East Surrey Water (2018). Accessed online at:
http://www.waterplc.com/userfiles/file/DraftWRMP19mainreport.pdf on: 10/04/2018
2018s0255 TDC WCS Phase 2 Outline v2.0 22Table 4.1 Summary of growth forecasts
Forecast Percentage growth from base years
(2015) to end of local plan period (2033)
SESW – Econometric for WRZ 17%
DCLG - Tandridge 23%
OAN - Tandridge 26%*
* OAN base year is 2013, completions for 2013/14 have been
removed so percentage is based on 2015 base year.
Sutton and East Surrey Water were asked to comment on the difference between the
econometric forecast and the level of growth forecast if the OAN is delivered:
“We have selected the econometric forecast, which is between the trend and plan based
forecasts. We have chosen this based on historical evidence and also other factors. We
carry out uncertainty analysis and include this in the supply needs assessment – termed
headroom. Higher than predicted growth is a major factor in this analysis. We are planning
on significant demand management measures between 2020 and 2025 which will increase
the gap between supply and demand further despite population growth. We also re-assess
the forecasts each year, before a complete revision in 5 years’ time.”
The SESW water resource zone covers fourteen local authorities including Tandridge (shown
in Figure 4.2, and so a regional approach is required in order to ensure that the growth
within Tandridge is fully accounted for within the SESW WRMP.
2018s0255 TDC WCS Phase 2 Outline v2.0 23Figure 4.2 Local authorities within Sutton and East Surrey water resource zone
The spatial boundary for the Water Resource Zone was provided by SESW and used to
overlay the local authority boundaries. The Department for Communities and Local
Government (DCLG) February 2016 estimates of household growth up to 20397 were
collated for the fourteen local authorities which lie within the WRZ. The percentage of the
current population of each local authority within the WRZ was estimated from the OS Code
Point dataset and spatial data provided for the WRZ. The assessment has used DCLG
figures, because they are available for all LPAs within the water resource zone, and over a
consistent timescale. The resulting total number of households in the base year within the
WRZ is comparable with the figure quoted in the SESW WRMP.
Table 4.2 below shows the growth in each local authority area in comparison to the growth
forecast by SESW. Mean growth in households from 2015 to 2033 across all of the local
authorities is 24%, slightly higher than the figure for Tandridge (23%). Over the same
period SESW forecast household growth to be 17%.
—————————————————————————————————————————————
7 Department for Communities and Local Government (2016) 2014-Based Household Projections, 2012 - 2039. Accessed online at
https://www.gov.uk/government/statistical-data-sets/live-tables-on-household-projections on 01/05/2018
2018s0255 TDC WCS Phase 2 Outline v2.0 24Table 4.2 Growth within water resource zone by local authority
Local authority Estimated 2015 Estimated 2033 % Growth
Baseline Household over plan
household Projection period
population
Bromley Borough 19 23 25%
Crawley Borough 1,758 2,164 23%
Croydon borough 36,389 46,806 29%
Elmbridge District 8,664 9,956 15%
Epsom and Ewell 12,981 16,043 24%
District
Guildford District 1,497 1,757 17%
Horsham District 14 17 19%
Merton Borough 10,682 13,249 24%
Mid Sussex District 842 1,020 21%
Mole Valley District 35,369 40,889 16%
Reigate and 58,647 73,481 25%
Banstead District
Sevenoaks District 7,162 8,482 18%
Sutton Borough 81,537 103,652 27%
Tandridge District 34,005 41,953 23%
TOTAL 289,566 359,490 24%
SESW Water WRZ 286,660 340,240 17%
total from WRMP
4.2.4 Sutton and East Surrey Water assessment
Sutton and East Surrey Water provided comments and a Red/Amber/Green assessment of
the proposed development sites. This can be found in Appendix A and summarised below
in Table 4.3.
An “amber” rating was given to the three garden community sites, “Insufficient evidence in
adopted WRMP to confirm that the planned increase in demand can be met”. SESW stated
that further modelling was required once final property numbers confirmed. The remaining
sites were given a “green” rating confirming that “the adopted WRMP has planned for the
increase in demand, or there is sufficient time to address supply demand issues in the next
WRMP.”
2018s0255 TDC WCS Phase 2 Outline v2.0 25Table 4.3 Summary of RAG score for water resources
Water
resource
RAG score RAG Score description Site references SESW Comments
given by
SESW
GV3 (South Godstone Further modelling
garden community) required once final
Insufficient evidence in property numbers
adopted WRMP to confirm BH007 (Blindley Heath confirmed.
Amber garden community)
that the planned increase in
demand can be met NUT017 (Redhill
Aerodrome garden
community)
Adopted WRMP has All remaining sites N/A
planned for the increase in
Green demand, or sufficient time
to address supply demand
issues in the next WRMP.
4.2.5 Conclusions
• Growth within Tandridge is comparable in percentage terms with the average growth
across the other local authorities within the water resource zone.
• Forecast household growth used with SESW WRMP is lower (17%) compared with
the DCLG household projections (24%) and the OAN for Tandridge (26%).
• SESW carry out uncertainty analysis which includes higher than predicted growth,
and the forecast is reassessed annually with a complete revision every 5 years.
• Further modelling of garden community sites is required once final property numbers
are confirmed.
On the basis that there is a water resource surplus predicted until 2047, and there
is sufficient time to adapt the long-term plan to include emerging trends in
population, no further assessment of water resources is recommended in a phase
3 detailed study.
Action Responsibility Timescale
Continue to regularly review forecast and actual household SESW Ongoing
growth across the supply region through WRMP Annual
Update reports, and where significant change is predicted,
engage with Local Planning Authorities.
Take the latest growth forecasts into account in the
emerging 2019 WRMP.
Provide yearly profiles of projected housing growth to water TDC Ongoing
companies to inform the WRMP.
Use planning policy to require the 110l/person/day water TDC In Local
consumption target permitted by National Planning Policy Plan
Guidance in water-stressed areas and use the BREEAM
standard to require percentage improvement over baseline
building water consumption of at least 12.5%.
2018s0255 TDC WCS Phase 2 Outline v2.0 26Action Responsibility Timescale
Water companies should advise TDC of any strategic water SESW In Local
resource infrastructure developments within the council's Plan
boundary, where these may require safeguarding of land to
prevent other type of development occurring. At present,
none have been identified.
Further modelling of garden community sites is required SESW Once
once final property numbers are confirmed. Local
Plan
finalised.
4.3 Water Supply Infrastructure
4.3.1 Introduction
An increase in water demand adds pressure to the existing supply infrastructure. This is
likely to manifest itself as low pressure at times of high demand. An assessment is required
to identify whether the existing infrastructure is adequate or whether upgrades will be
required. The time required to plan, obtain funding and construct major pipeline works can
be considerable and therefore water companies and planners need to work closely together
to ensure that the infrastructure is able to meet growing demand.
Water supply companies make a distinction between supply infrastructure, the major
pipelines, reservoirs and pumps that transfer water around a WRZ, and distribution
systems, smaller scale assets which convey water around settlements to customers. This
outline study is focused on the supply infrastructure. It is expected that developers should
fund water company impact assessments and modelling of the distribution systems to
determine requirements for local capacity upgrades to the distribution systems.
All sites within Tandridge would be served by Sutton and East Surrey Water. Tandridge
District Council have engaged with Sutton and East Surrey Water at an early stage in their
local plan process to discuss the infrastructure required.
In addition to the work undertaken by water companies, there are opportunities for the
local authority and other stakeholders to relieve pressure on the existing water supply
system by increasing water efficiency in existing properties. This can contribute to reducing
water consumption targets and help to deliver wider aims of achieving water neutrality.
A cost-effective solution can be for local authorities to co-ordinate with water supply
companies and “piggy back” on planned leakage or metering schemes, to survey and retrofit
water efficient fittings into homes8. This is particularly feasible within property owned or
managed by the local authorities, such as social housing.
4.3.2 Methodology
Sutton and East Surrey Water were provided with a complete list of sites and the potential
/ equivalent housing numbers for each. Using this information, they were asked to
comment on the impact of the proposed growth on water supply infrastructure in the
Tandridge area. A RAG assessment was then applied using the following definitions to score
each site:
—————————————————————————————————————————————
8
Waterwise (2009) Water Efficiency Retrofitting: A Best Practice Guide. Available at:
http://www.waterwise.org.uk/wp-content/uploads/2018/01/Waterwise-2009_Water-efficiency-Retrofitting_Best-
practice.pdf
2018s0255 TDC WCS Phase 2 Outline v2.0 27Infrastructure and/or treatment
work upgrades are required to Infrastructure and/or treatment
Capacity available to serve the serve proposed growth, but no upgrades will be required to serve
proposed growth significant constraints to the proposed growth. Major constraints
provision of this infrastructure have been identified.
have been identified
SESW also carried out a modelling study in which all development sites were added to the
model, providing a “worst case scenario”. The following additional criteria were used to
inform their RAG score:
• Green - 1.0m pressure change
• Red – > 1.0m pressure drop - reinforcement will be required AND major constraints
have been identified
Data collection
The following data sets are used to assess the water supply and distribution capacity:
• Site locations in GIS format (provided by Tandridge District Council)
• A technical note outlining the growth scenario and potential housing numbers for
each site
• Site tracker spreadsheet (See Appendix A)
4.3.3 Results
Table 4.4 summarises the scoring given to each site by SESW. The modelling work carried
out by SESW identified eight sites where reinforcement WILL be required, and a further
fourteen where reinforcement MAY be required. The remaining sites were assessed as
having capacity to serve the proposed growth. No major constraints to providing
infrastructure upgrades were identified.
Table 4.4 Summary of RAG score by site
Water
supply
networks RAG Score
Site references SESW Comments
RAG score description
given by
SESW
Infrastructure and/or
treatment upgrades will
be required to serve
RED None N/A
proposed growth.
Major constraints have
been identified.
Infrastructure and/or CAT007, CAT040, Reinforcement will be
treatment work GOD010, required
upgrades are required GOD021, OXT067,
Amber to serve proposed SMA004,
SMA040, WAR012
growth, but no
significant constraints
to the provision of this
2018s0255 TDC WCS Phase 2 Outline v2.0 28Water
supply
networks RAG Score
Site references SESW Comments
RAG score description
given by
SESW
infrastructure have
been identified.
Infrastructure and/or BHE007, CMP1, CMP6, Reinforcement may be
treatment work ENA12, ENA22, ENA30, required
upgrades are required ENA8, NUT017, GV3,
to serve proposed SMA039, WAR005,
WAR019,
Amber growth, but no
WAR036, WAR038
significant constraints
to the provision of this
infrastructure have
been identified.
CAT016, CAT044, N/A
CAT079, CAT081, CMP2,
CMP4,
Capacity available to ENA27, ENA21, ENA23,
Green serve the proposed LIN030, OXT016,
OXT021, OXT068,
growth
OXTC1, SMA008,
SMA030, UCS02, UCS09,
UCS11, WAR011,
WAR016, WAR023
SESW stated that the South Godstone garden community site would be supplied from the
Bough Beech WTW, which would have capacity to serve the forecast growth based on the
information supplied. Extensive reinforcement is needed to build a new strategic connection
to the trunk main at Blindley Heath. This will require a new main between 1.5 and 2km
long. This garden community site, if adopted is likely to commence construction in 2025/26
allowing time for this work to be completed assuming developers engage with SESW at the
earliest opportunity.
4.3.4 Conclusions
• Water supply network reinforcements will be required at eight of the proposed sites
and may be required at a further fourteen.
• The remaining sites have capacity to serve the proposed growth
• The South Godstone garden community site will require extensive reinforcement
and a new main 1.5 to 2km long to connect to the Blindley Heath trunk main.
• No significant constraints to the provision of these upgrades have been identified.
Early developer engagement with SESW is essential to ensure that, where
necessary, network reinforcement is delivered prior to developments becoming
occupied. No further assessment is recommended in a phase 3 WCS.
2018s0255 TDC WCS Phase 2 Outline v2.0 294.3.5 Recommendations
Action Responsibility Timescale
Undertake technical study to
understand infrastructure
requirement for potential
garden community sites SESW
including land that should be TDC TBC
safeguarded for Developers
infrastructure, and timeline
for provision of new
connection to trunk main.
Undertake technical studies to
understand options to provide
sufficient bulk and local
transfer capacity to sites SESW TBC
evaluated as amber and
communicate results with
TDC.
Encourage the use of
rainwater harvesting and non-
potable water recycling in new TDC
development sites, in SESW In local plan
particular the garden Developers
community sites in order to
reduce water demand.
2018s0255 TDC WCS Phase 2 Outline v2.0 305 Wastewater collection
5.1 Sewerage Undertaker for Tandridge
Southern Water and Thames Water are the Sewerage Undertakers (SUs) for Tandridge.
The role of sewerage undertaker includes the collection and treatment of wastewater from
domestic and commercial premises, and in some areas, it also includes the drainage of
surface water from building curtilages to combined or surface water sewers. It excludes,
unless adopted by the SU, systems that do not connect directly to the wastewater network,
e.g. Sustainable Drainage Systems (SuDS) or highway drainage. At present, Thames Water
do not adopt most forms of SuDS systems, however they will adopt conventional piped
surface water drainage systems downstream of private or third-party SuDS, where these
drain the building curtilage. Southern Water do not adopt SuDS schemes.
Increased wastewater flows into collection systems due to growth in populations or per-
capita consumption can lead to an overloading of the infrastructure, increasing the risk of
sewer flooding and, where present, increasing the frequency of discharges from Combined
Sewer Overflows (CSOs).
Likewise, headroom at Wastewater Treatment Works (WwTW) can be eroded by growth in
population or per-capita consumption, requiring investment in additional treatment
capacity. As the volumes of treated effluent rises, even if the effluent quality is maintained,
the pollutant load discharged to the receiving watercourse will increase. In such
circumstances the Environment Agency as the environmental regulator, may tighten
consented effluent consents to achieve a "load standstill", i.e. ensuring that as effluent
volume increases, the pollutant discharged does not increase. Again, this would require
investment by the water company to improve the quality of the treated effluent.
In combined sewerage systems, or foul systems with surface water misconnections, there
is potential to create headroom in the system, thus enabling additional growth, by the
removal of surface water connections. This can most readily be achieved during the
redevelopment of brownfield sites which have combined sewerage systems, where there is
potential to discharge surface waters via sustainable drainage systems (SuDS) to
groundwater, watercourses or surface water sewers. In some areas of Tandridge, there
are known issues of surface water causing localised flooding. Strategic schemes to provide
improved local surface water drainage may be required in such areas, rather than solely
relying upon on-site soakaways on brownfield or infill plots.
5.2 Sewerage System Capacity Assessment
New residential developments add pressure to the existing sewerage systems. An
assessment is required to identify the available capacity within the existing systems, and
the potential to upgrade overloaded systems to accommodate future growth. The scale
and cost of upgrading works may vary significantly depending upon the location of the
development in relation to the network itself and the receiving WwTW.
It may be the case that an existing sewerage system is already working at its full capacity
and further investigations have to be carried out to define which solution is necessary to
implement an increase in its capacity. New infrastructure may be required if, for example,
a site is not served by an existing system. Such new infrastructure will normally be secured
through private third-party agreements between the developer and utility provider.
Sewerage Undertakers must consider the growth in demand for wastewater services when
preparing their five-yearly Strategic Business Plans (SBPs) which set out investment for the
next Asset Management Plan (AMP) period. Typically, investment is committed to provide
new or upgraded sewerage capacity to support allocated growth with a high certainty of
being delivered. Additional sewerage capacity to service windfall sites, smaller infill
development or to connect a site to the sewerage network across third party land is
normally funded via developer contributions, as third-party arrangements between the
developer and utility provider.
2018s0255 TDC WCS Phase 2 Outline v2.0 31You can also read