Economic Development Plan Ciutat Vella 2016-2021 - Ajuntament ...
←
→
Page content transcription
If your browser does not render page correctly, please read the page content below
Economic Development Plan Ciutat Vella 2016-2021

Dear all,

We hereby present the Economic Development Plan 2016-2021 for Ciuat Vella (Old Town),
a roadmap for the socio-economic transformation and revitalisation of this District of Barcelona
over the next five years. The plan was developed from proposals made as part of the District
Action Plan, as part of a dialogue between commerce and the social and community fabric. This
plan is designed to align City Council resources, the Economic Development Agency of Barcelona
(Barcelona Activa) and organisations and regional economic stakeholders in order to design the
economic horizon for the District, as well as how to reach this point.

The vision for this horizon represents a new economic model for our neighbourhoods: a plural,
diverse and solid economic model in terms of business sectors and distribution of wealth,
designed to satisfy the needs of residents in our neighbourhoods and our city. This new economic
model will help us avoid making the same mistakes of doing business in the sort of ruthless way
that led to recession and the social exclusion suffered in recent years.

The current situation makes building this new economic ecosystem a challenging job. However,
a public administration needs to try to facilitate this transition with all the tools and resources at
its disposal. In collaboration with other stakeholders and based on the logic of coproduction and
shared territorial governance, we can create neighbourhoods that generate more and better jobs.
Neighbourhoods that can grow and sustain traditional businesses and innovative projects: ranging
from local shops to initiatives developed by the social and solidarity economy. Neighbourhoods
where tourism is an economic activity that guarantees the rights of those who live and work from
it and a source of wealth that is compatible with everyday life in conjunction with the rest of our
business sectors.

Therefore, we encourage you to make this Economic Development Plan your own by participating
in its management and contributing through your everyday work, consumption, entrepreneurship
and community involvement, in order to build a fairer economic model that is more sustainable
and solid for the benefit of our neighbourhoods.

Sincerely,

                       Gerardo Pisarello Prados                             Gala Pin Ferrando
                       First Deputy Mayor for Work,                         Councillor for the
                       Business and Strategic Planning.                     District of Ciutat Vella
                       President of Barcelona Activa

Economic Development Plan Ciutat Vella 2016-2021                                                       3
Contents
01. PRESENTATION ..................................................................................... 5
01.1. How we understand local development .............................................. 5
01.2. Context of 2015 for local development ............................................... 7
01.3. How this Plan was created ............................................................... 10
02. DIAGNOSIS AND VISION .......................................................................... 12
02.1. Diagnosis ..................................................................................... 12
02.2. Vision for the future ........................................................................ 23
02.2.1. Dynamics we want to reverse .................................................. 23
02.2.2. Sectors or economic areas ..................................................... 25
03. STRATEGY LINES AND MEASURES ............................................................. 28
03.1. Local development economy ............................................................ 28
03.2. New public leadership .................................................................... 34
03.3. Quality employment ........................................................................ 38
03.4. Sustainable tourism ....................................................................... 43
03.5. Social, Cooperative and Solidarity Economy ........................................ 46
04. TIMELINE ............................................................................................. 49
05. RESOURCES ......................................................................................... 56
06. GOVERNANCE AND EVALUATION ............................................................... 57
06.1. Governance of the Plan ................................................................... 57
06.2. Monitoring and evaluation ............................................................... 58
4 Economic Development Plan Ciutat Vella 2016-202101. Presentation
01.1. HOW WE UNDERSTAND LOCAL DEVELOPMENT1
This plan understands local economic development as a set of actions, policies and strategies
that promote economic activity aimed at addressing the needs of those people that live
in a particular area, with a perspective on wealth distribution, gender, inter-cultural and
environmental sustainability. It is a development that brings together the resources of an area
to make a plural economic ecosystem that welcomes different economic sectors and stimulates
different economic activities through the coordination of policies and projects by the Public
Administration, the fabric of our community, and the social and private sectors.
In more detailed terms, it is a type of development that:
• Places the needs of the population and improving their quality of life centre stage. It does not
just contemplate the growth of wealth, but rather how wealth is distributed and how it benefits
the whole of society. It is part of a plural economy at the service of citizens, promoting fair
working conditions in a healthy environment and taking into account environmental protection
and social cohesion.
• Considers the region in an integral way, with particular emphasis on how to generate virtuous
dynamics between different areas of economic development: training, employment, business
and conventional entrepreneurship, with an eye on the social and solidarity economy and the
care economy.
• Contemplates everything that is local as an opportunity to promote concerted strategies for
economic revitalisation with different regional stakeholders -public, private and from the
community-, with clear public leadership that facilitates, accompanies, promotes or links into
desirable community leadership. It also actively promotes cooperative and transversal work
between the different authorities involved and between the different areas of the City Council,
looking for maximum alignment and coherence of actions carried out in order to be
more efficient.
• Stimulates the private sector to achieve greater social and environmental returns for
everyone, while promoting the cooperative, social and solidarity economy because it is based
on fairer and more democratic relations and because of its high sustainability and resilience
value, and because it resists the ravages of recession better, amongst other characteristics.
1
Throughout the document we will use the term ‘economic development of Ciutat Vella’, although we also understand this as other
possibilities such as ‘local development’ or, as used in the local district action plans (PAD) as ‘development and the local economy’.
All these forms refer to the same idea in this section.
Economic Development Plan Ciutat Vella 2016-2021 5• Has a gender perspective, as it attends to the needs of women, putting emphasis on improving
their living conditions, and bearing in mind that they suffer higher rates of unemployment,
higher levels of insecurity at work and poverty and receive lower wages and pensions–, while
aiming to dignify those jobs that have been traditionally feminised, de-valued and with low
qualifications, but that are nevertheless essential for our welfare and life, such as cleaning
or caring for people.
• Has an intercultural perspective in its diagnosis and interventions, and believes, therefore,
in effective policies to promote the equality of rights, obligations and opportunities to combat
situations of exclusion and discrimination by origin or based on cultural differences.
• Addresses the challenges of environmental sustainability in terms of economic activity,
and therefore, this aspect is included in the designed set of policies and actions. These take
into account the environment as something that must be protected and taken care of through
the use of resources that approaches zero waste and minimal environmental impact.
This type of local development is the basis of Barcelona Activa’s new strategy lines, which place
localness and proximity as the general benchmark criteria. This is a new model of economic
revitalisation that translates into locally-oriented services and actions that are closer to our
neighbours, which reach more sectors of our society and which are designed in cooperation with
the district councils and local stakeholders. District Economic Development Plans, like that of
Ciutat Vella, are examples of this type of local development.
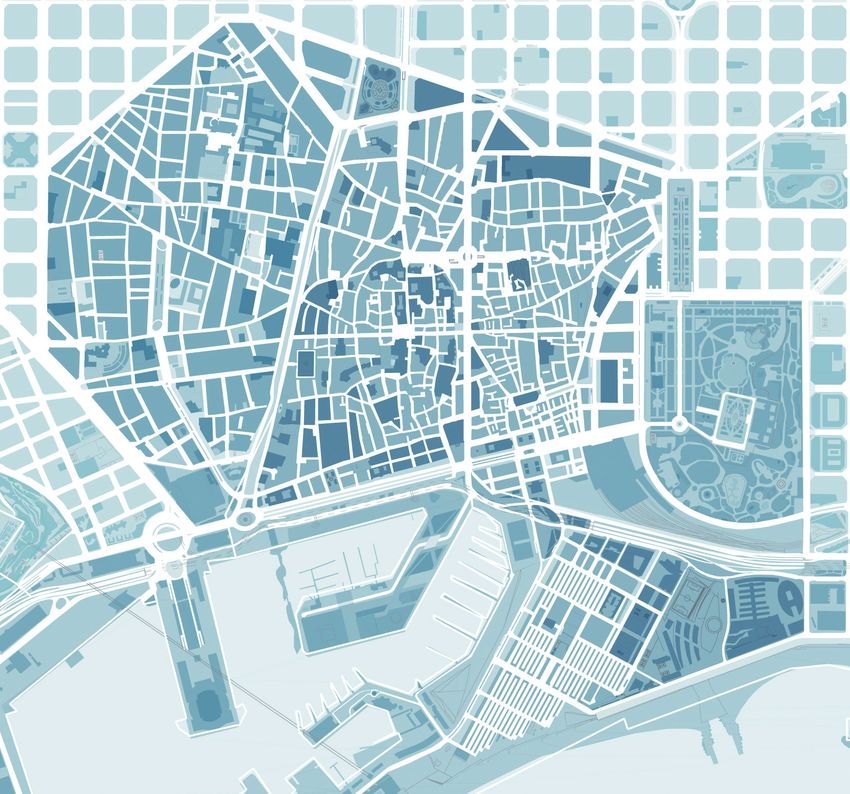
CIUTAT VELLA
El Raval
El Gòtic Sant Pere,
Santa Caterina
i la Ribera
La Barceloneta
6 Economic Development Plan Ciutat Vella 2016-202101.2. CONTEXT OF 2015 FOR LOCAL DEVELOPMENT Background Ciutat Vella has undergone an intense process of transformation and urban revitalisation since the early eighties. This process began with the Special Internal Reform Plans of Ciutat Vella and Barceloneta (1979-1986), and a subsequent declaration of the entire district as an Integral Rehabilitation Area (1986), which has continued until today, with reform plans in each of its neighbourhoods. Beyond the purely urban dimension, a variety of programmes have been put in place aimed at the area’s social and economic development, as well as comprehensive public policy intervention focused on enhancing the quality of life of the inhabitants in the area. In this regard, there are two types of programmes: Usage Plans and the Neighbourhoods Act (Pla d’Usos and Llei de Barris). Ciutat Vella Usage Plan Known as the Ciutat Vella Usage Plan (formally: Special plan for public establishments and other activities in Ciutat Vella), this is a planning tool used to regulate the implementation of certain activities in this area and to regulate premises under public way bylaws (bars, restaurants, theatres, music venues, cinemas, etc.) to ensure a mix of uses and defend neighbourhood life in the district. The first Usage Plan was passed in 1991, but despite subsequent modifications (1995, 2000 and 2005) it was not until 2010 that a proposal was made to divide the District into several zones: some with denser areas (where the new implementation of activities is more restrictive) and others being intermediate and more permissive zones (where it is easier to locate an activity). In 2013 there was a modification of the Plan, which lowered restrictions for the tourism sector by allowing the location of more hotels in the district. Although the objective was still to obtain a balance between increasing economic activity in the District and the quality of life of its neighbours, wider zoning was defined with new targets prioritising the arrival of investments and the renovation of premises, allowing an increase in the number of tourist hotels. The lack of comprehensive control over the registration and de-registration of businesses meant new efforts were made in order to ensure some sort of balance in terms of commerce and retail. This is the legislation currently in force (June 2016) and it has a major impact on the economic development of the District. To this we have to add a Usage Plan for the Rambla, developed at the end of 2014, which takes into account its uniqueness (Special Regulation Plan for the Rambla). Economic Development Plan Ciutat Vella 2016-2021 7
Neighbourhoods Act

Ciutat Vella has received comprehensive intervention projects from all three Neighbourhoods Acts
(an Act designed to improve urban areas and towns that require special attention), in the areas
of Santa Caterina and Sant Pere (2004-2008), Barceloneta (2008-2012), South Raval (2010-2018).
This Act gave the Catalan government intervention tools to improve areas that, because of their
conditions, require special attention from the authorities. The current Neighbourhoods Act is
located in South Raval until 2018, which is an urban renewal policy focused on vulnerable areas
with the aim of making significant public investment to leverage transformation. The sources
of funding are provided by the Regional Government and local governments, on average around
10 million Euros per call.

Given the precedents of these specific and sector policies, the Neighbourhoods Act is aimed
at fully intervening in different areas (social, physical/urban, economic, environment) with a
multi-dimensional treatment of issues affecting neighbourhoods. It is worth highlighting that
a wide variety of stakeholders have a will to work together with a common goal: improving the
neighbourhood, producing a certain amount of horizontal transversality (working together
across areas such as social services, urban planning and economic promotion) and vertical
transversality (participation of local associations, neighbours or at an individual level). In the case
of the Neighbourhoods Act of South Raval, the global economic recession delayed the arrival of
investments to carry out 36 projects agreed on to improve social and urban development. As such
this policy has been developed over eight years as opposed to four years as established at the
outset and this is still in progress. In the present context, the Neighbourhoods Act of South Raval
will be integrated into the Neighbourhood Plan started this mandate.

Current framework

PAM / PAD

The current framework came about firstly from the Municipal Action Programme (PAM) and the
District Action Plan (PAD) for Ciutat Vella, planning tools that are still pending approval, which
set out the priorities, objectives and the actions that the municipal government is committed to
developing during the mandate. These essential documents have been prepared in a participatory
manner based on a process aimed at discussing and collectively building the actions and priorities
of government with citizens and giving special prominence to neighbourhoods and participation,
and the digital participation of neighbours.

The priority action lines of these roadmaps in terms of socio-economics in the city and in Ciutat
Vella include promoting the cooperative, social and solidarity economy, commitments to diversify
the production model, promoting quality jobs and developing the local economy in a more
grounded sense so that it is capable of developing the potential of the area.

8                                                                Economic Development Plan Ciutat Vella 2016-2021
Neighbourhood Plan against inequalities

The ‘Neighbourhood Plan against inequalities’ is one of the main measures of the municipal
government regarding social issues. The planned investment runs to 150 million Euros for 10
neighbourhood plans for areas that have been particularly hit by the recession, in order to reduce
inequalities. Challenges have been set like recovering economic activity, dealing with urban deficits
and ‘empowering neighbours’ based on ‘co-produced’ actions between the community fabric
in the area and the council as a whole.

Although this time resources come largely from the municipal budget, the ‘Neighbourhoods Plan
against inequalities’ roughly follows the main lines of the former Neighbourhoods Act (Law 2/2004),
placing special emphasis in this case on the stimulation of economic and social programmes
(education, health and conviviality issues).

The neighbourhoods included in this programme were determined by analyzing variables such as the
levels of average income, socio-economic, educational and social indicators, and also points such as
urban deficits or the state of the housing stock. They are divided between the districts of Nou Barris,
Sant Andreu, Sant Martí, Horta-Guinardó, Sants-Montjuïc and Ciutat Vella. In the last case, the
strategy and intervention characteristics are to be determined throughout 2016.

Tourism Strategic Plan 2016-2020

Moreover, the Tourism Strategic Plan 2016-2020 opens a new planning, reflexion and shared
knowledge process about the city’s tourism activity and its effects via an analysis of the current
situation and future scenarios.

The result of this process will allow us to define a series of municipal initiatives and actions that
should allow us to upgrade commitments and responsibilities regarding the sustainability of the
destination, as well as managing tourism and its effects on the city, satisfying –at the same time–
visitors and citizens.

Approval of the Tourism Strategic Plan for 2016-2020 is due at the beginning of 2017.

Responsible Consumption Promotion Plan

Increasingly businesses and citizens are showing an interest in responsible consumption as a
commitment to another type of economy and sustainability. Responsible consumption brings us
local and/or organic products, fair trade, short sales circuits, repaired and re-usable products,
collaborative networks, reductions in packaging ... and especially a consciousness about
consumption as a means to resolve real needs and, at the same time, being able to help reduce
inequalities and increase sustainability. The Responsible Consumption Promotion Plan
of Barcelona City Council aims to promote changes in consumption at the institutional level
and also for the people that inhabit the city.

The Responsible Consumption Promotion Plan is expected to be passed in the autumn of 2016.

Economic Development Plan Ciutat Vella 2016-2021                                                        9
01.3. HOW THIS PLAN WAS DEVELOPED

The Economic Development Plan of Ciutat Vella includes socioeconomic proposals from residents,
and those from the community fabric, and social and business sectors represented in our
neighbourhoods. It draws on diagnosis and previous experiences seen in the area (public policy
and previous programmes that we need to commit to, which in certain cases need some rethinking,
updating or special development) and it proposes new solutions in line with the programme
presented for the new government mandate.

The strategies and measures contained in this plan are the result of several documents and
deliberative scenarios.

Steering Group behind the Economic Development Plan of Ciutat Vella

A Steering Group was set up in order to develop the Economic Development Plan of Ciutat Vella
made up by technical staff of the District Council and the team at Barcelona Activa in Ciutat Vella
and advisers at the District Council. This group has been meeting fortnightly since early April 2016.

District Action Plan (PAD) and the Municipal Action Plan (PAM)

The starting point of these strategy lines and measures were proposals made during the PAD /
PAM consultation process, a document that sets out the strategy lines for this municipal and
District mandate. Ciutat Vella held 31 events during this process with the participation of 1,200
people. Moreover, 110 people from the District contributed via the web. As part of the consultation
process, special meetings were carried out with retail and commerce stakeholders, and the
tourism sector and the community. The contributions that achieved most consensus in Ciutat Vella
were processed and the minutes of the meetings held in the District were revised.

Barcelona Activa’s local development plan

Contents from the PAD/PAM proposals were crossed with a new strategy of local development by
Barcelona Activa, as well as the expertise of 30 years designing and implementing programmes to
promote employment, entrepreneurship, business and economic activity in general in the city and
its neighbourhoods.

A first draft for discussion was developed from these two first sources.

10                                                             Economic Development Plan Ciutat Vella 2016-2021
Working sessions for the Economic Development Plan of Ciutat Vella

In addition to discussion forums on the PAD / PAM, which were part of the preparation framework
for the Economic Development Plan of Ciutat Vella, there were also working sessions with various
stakeholders implicated in local development. These meetings were developed as part of the
aforementioned draft, which had previously been submitted to participants, and these strategy
lines and measures were discussed.

In particular the following sessions were held:

 • 1 Municipal District committee of technicians: with the participation of staff from the
   Directorate of Public Services and a representative of Foment de Ciutat Vella and the Director
   of Social Services of Ciutat Vella and the Director of the Catalan Government’s Office for Work
   and Employment, as well as the Barcelona Activa team located in Ciutat Vella.

 • 4 district sessions (one for each neighbourhood of Ciutat Vella: the Raval, the Gòtic area,
   Sant Pere, Santa Caterina i la Ribera and Barceloneta) with stakeholders related to economic
   development: shop owner associations, secondary organizations dedicated to economic
   and community revitalization, and employment networks.

 • 1 meeting on tourism and economic revitalization at a District level, where all stakeholders
   were invited to participate that had been at the neighbourhood sessions along with entities
   and representatives of tourism, leisure and restaurant businesses, and also the guilds.

 • 2 sessions with directors, managers and technical specialists working in different departments
   at Barcelona Activa: Employment, Enterprise, Entrepreneurship, Tourism and Other Economies.
   The Technical Commissioner for the Cooperative, Social and Solidarity Economy also attended,
   along with the Directorate General for Trade and Commerce.

In addition to these areas designed for participation, there were 10 interviews with specific
key professionals from Barcelona Activa, the District and the Directorate General for Trade
and Commerce.

In total, around 85 people participated in these events designed to draft the Economic
Development Plan of Ciutat Vella.

Contributions were collected at each interview and session, as were other reflections, and these
were assessed so that they could be introduced into the Plan. When setting numerical results, we
considered the results and indicators used by programmes involved with training, employment
and support for businesses and entrepreneurship at Barcelona Activa, inferring information at the
Ciutat Vella level, and contrasting this with the directors of the various services and programmes
regarding the viability of new indicators, according to resources planned for the next five years.

Economic Development Plan Ciutat Vella 2016-2021                                                     11
02. Diagnosis and vision

02.1. DIAGNOSIS

The District of Ciutat Vella includes the neighbourhoods of the Raval, Gòtic, Barceloneta, and
Sant Pere, Santa Caterina i la Ribera. It is the historic centre of Barcelona, a cultural and economic
melting pot and a welcoming space for new neighbours and the visiting population. The area can
be summarised with the following socio-economic data:

Socio-economic indicators of Ciutat Vella 2015
                                                                                   Ciutat Vella                 Barcelona
Demographic indicators

Population                                                                           100,227                    1,609,550

% Increase in annual population                                                       -2.0 %                      -0.2 %

Net population density (inhab/ha) (2015)                                                775                        619

Men (%)                                                                               52.6 %                      47.4 %

Women (%) (June 2015)                                                                 47.4 %                      52.6 %

Life expectancy (Men / Women, 2013)                                             77,2 / 84.9 years            80 / 86.4 years

% Youth population (16-24 years)                                                      8.7 %                       8.0 %

% Population 16-64 years                                                              74.2 %                      65.0 %

% Population with no education or primary education                                   32.3 %                      24.7 %

% Population with university education                                                28.3 %                      29.4 %

% total population                                                                    42.6 %                      16.3 %

% Main countries of origin of foreigners in the district                        15.6 % (Pakistan)              7.6 % (Italy)

Socio-economic indicators

Index of disposable household income (2014)                                            79.7                       100.0

Change in IDHI 2014/13                                                                 +2.5                         0.0

Total unemployed (May 2016)                                                           7,155                       82,569

Weight of registered unemployment (population 16-64 years)
                                                                                      9.6 %                       7.9 %
as a % (May 2016)

% Inter-annual variation in registered unemployment (May 2016)                       -10.9 %                     -11.8 %

% Long-term unemployed / total registered unemployment
                                                                                      40.0 %                      42.2 %
(May 2016)
% of people attended by municipal social services compared                            8.5 %                       4.6 %
to total population

Source: Department of Employment, Business and Tourism Studies based on data from the Statistics
Department at Barcelona City Hall.

12                                                                                  Economic Development Plan Ciutat Vella 2016-2021
Demographics
According to data for 2015, Ciutat Vella is home to a population of 100,227 inhabitants, a decrease
of 2% between June 2014 and 2015, in contrast to stable population trends seen at the city level
(-0.2%) . Cumulative figures since 2006 show the district has lost 11.4% of its neighbours. Despite
this, Ciutat Vella has 6.2% of the population of Barcelona.
With a surface area of 436.8 hectares, the population density of Ciutat Vella (775 inhabitants
per hectare) is 25% higher than the average for Barcelona as a whole (619 inhabitants / ha). This
population density, calculated according to official residency figures, is much higher in reality
when we add the very high number of visitors to this District every day.
Following on with data for 2015, 42.6% of the district’s population is of foreign origin –a rate that
is 2.6 times or 25% more than the city average (16.3%). This district has the highest weighting of
foreign residents of any district in the city.
Life expectancy in Ciutat Vella is 80.9 years, 2.5 years less than the average for the whole of
Barcelona, according to data for 2013. All areas of Ciutat Vella fall below the average on this
indicator compared to the rest of Barcelona, with the neighbourhoods of Sant Pere, Santa Caterina
i la Ribera closest to the average with 82.4 years, while the lowest figure was for the Raval
neighbourhood (80.3 years), which is six years less in terms of life expectancy than Pedralbes, the
neighbourhood with the highest rate in the city. The life expectancy of men is significantly lower,
with the gap between the Raval and Barceloneta areas and those neighbourhoods with the highest
life expectancy being more than eight years.
Life expectancy in the neighbourhoods of Ciutat Vella (years) 2013
Total Men Women
El Raval 80.3 76.2 84.9
El Gòtic 81.3 80.9 83.4
La Barceloneta 80.4 76.0 84.8
Sant Pere, Santa Caterina i la Ribera 82.4 78.8 85.5
Ciutat Vella 80.9 77.2 84.9
Barcelona 83.4 80.0 86.4
Source: Public Health Agency of Barcelona.
Economic Development Plan Ciutat Vella 2016-2021 13Employment Market
The overall weighting of the working age population (74.2% of the total) is 9.2 points higher than
the city’s average, while that of young people (8.7%) is 0.7 points higher.
32.3% of the district’s population has no formal education or primary education –a figure that
is 7.6 points higher than the average for Barcelona–, while in contrast, the population with a
university education stands at more than a quarter (28.3%) of the District, close to the city average
(29.4%), but with significant differences within the District, for example, the figure for the Raval
quarter stands at 18.9%, while in the Gòtic neighbourhood it is 34.4%.
The 7,155 people registered as unemployed in Ciutat Vella in May 2016 represent 8.7% of the
total for this group in Barcelona. Compared to May 2015, the number of unemployed decreased by
10.9%, a more moderate fall compared to the other districts of Barcelona. 9.6% of the working age
population of Ciutat Vella was unemployed at March 2016, a figure that is 1.7 percentage points
above the city average (7.9%).
Weight of registered unemployment / population 16-64 years (%). Ciutat Vella, May 2016
El Raval 10.4 %
La Barceloneta 10.2 %
Ciutat Vella 9.6 %
Sant Pere, Santa Caterina i la Ribera 9.0 %
El Gòtic 7.7 %
Barcelona 7.9 %
0% 2% 4% 6% 8% 10 % 12 %
Source: Department of Employment, Business and Tourism
Studies,Barcelona City Council, based on data from the Department
of Statistics,Barcelona City Council
The registered unemployment rate in every one of the district’s neighbourhoods is higher than
the average for Barcelona, with the highest rates in the Raval and Barceloneta quarters.
14 Economic Development Plan Ciutat Vella 2016-2021Household income
Historically, Ciutat Vella has been one of the districts with the lowest incomes in the city. In 2000,
it had the lowest household income, although it has also progressed most in terms of income:
it is the only district where household incomes have risen year after year since 2008, with an
accumulated increase of 8.6 points2. However, one of the main factors explaining this improvement
has been the arrival of inhabitants with higher purchasing power in recent years, rather than a
homogeneous rise in the incomes of neighbours.
Despite this trend, disposable household income for Ciutat Vella in 2014 was still only 79.7% of
the average income of the city, placing it in the mid-to-lower part of the ranking for all districts.
All quarters in Ciutat Vella recorded a disposable household income per capita below the average,
although the Gòtic, Sant Pere, Santa Caterina i la Ribera come close to the average, with the Raval
neighbourhood still a long way behind.
Disposable household income per inhabitant in Ciutat Vella (IndexBcn = 100) 2014
El Raval 65.9 %
Ciutat Vella 79.7 %
La Barceloneta 84.5 %
Sant Pere, Santa Caterina i la Ribera 92.5 %
El Gòtic 98.5 %
Barcelona 100 %
0 20 40 60 80 100 120
Source: Department of Employment, Business and Tourism
Studies,Barcelona City Council, based on data from the Department
of Statistics, Barcelona City Council
In 2015, the City Council’s Social Services attended 8,503 people in Ciutat Vella. This take-up figure
represents 8.5% of the total population of the district, while in Barcelona the overall figure for the
same concept stood at 4.6% of the population.
2
Note: in comparison to other years we should take into account changes in the statistical data used as a source for this index.
Economic Development Plan Ciutat Vella 2016-2021 15Economic activity Indicators for Ciutat Vella 2015
The special characteristics of Ciutat Vella make it a singular and unique place within the
economic structure of the city, with a clear specialization in culture, leisure, retail and hotels
and restaurants.
38.8% of the registered cadastral surface area of the District is dedicated to economic activity,
which is 8.2 percentage points higher than the average for the whole of Barcelona. In terms of
activities, offices account for almost a quarter (24.4%) of the productive area of the District,
followed by commerce and retail, tourism and hospitality, each representing one-fifth of the area
(21.4% and 21.1% of the total, respectively). Comparatively, the weight of office space is higher
than the city’s average (by 6.3 points), while the area dedicated to commerce and retail is 2.4
points lower than at the city level due to the fact that retail and commerce in this area is generally
in smaller premises–, and space dedicated to industry is 14.5 percentage points lower.
Cadastral surface area of economic activities’ premises
Ciutat Vella Barcelona
1.4 % 4.4 %
2.5 % 1.4 % Retail and commerce
2.4 % 5.5 % Offices
12.3 % 21.4 % 23.8 %
10.3 % Tourism and hospitality
Industry
14.5 % Education
24.4 % 18.1 % Shows and theatres
29 %
Healthcare
21.1 %
Sports
7.4 %
Source: Department of Employment, Business and Tourism Studies,Barcelona City Council,
based on data from the Department of Statistics, Barcelona City Council.
16 Economic Development Plan Ciutat Vella 2016-2021Indicators of economic activity in Ciutat Vella 2015
In 2014, the most representative sector in Ciutat Vella in ground floor premises was services3
(42.3% of total), while retail and commerce accounted for 40.3% of the total and empty premises
represented almost 10%.
Establishments on the ground floor. 2014
Ciutat Vella Barcelona
7.5 % 6.1 %
Services
9.9 % Commerce and retail
15.7 %
Empty premises
42.3 % Other
46.4 %
40.3 %
31.8 %
Source: Department of Employment, Business and Tourism Studies,Barcelona City Council,
based on data from the Department of Statistics,Barcelona City Council
Compared to Barcelona, it is worth noting that there is a large proportion of retail and commerce
in the district –8.5 percentage points above the average for the city– and a lower rate of empty
premises –5.8 points below the average for the city– due to the district’s strong appeal as a
central location in the city.
As for ground floor premises across quarters, commerce and retail was dominant in terms of
activity in the Gòtic and Sant Pere, Santa Caterina i la Ribera, while the Raval and Barceloneta saw
a higher percentage of services, which is the same as we find across Ciutat Vella as a whole,
and even more clearly in terms of the whole of Barcelona.
3
Including hotels and restaurants.
Economic Development Plan Ciutat Vella 2016-2021 17Public access business licensing
In Ciutat Vella there are currently 3,035 licenses for public access economic activities. The
majority of them (1,259) are related to eateries, followed by accommodation (852, of which 604
are licenses for housing for tourism purposes) and activities relating to the sale of products and
foodstuffs (768). We can therefore see a strong specialization in eateries, tourism and leisure.
Number of licenses. 2016
Type of activity Number
of licenses
Restaurants 1,259 Restaurants
Accommodation 852 Accommodation
(hotels, guest houses and
apartments for tourism use) Food
Audiovisual -
Food 768
internet cafè
Audiovisual-internet cafè 48
Music
Music 38
Culture and social
Culture and social 21 Exhibitions
Exhibitions 20 Convenience
Convenience 16
Games and attractions 9
Sports 4
Tourism and Hospitality
Ciutat Vella brings together most of the tourist activity in the city because of the fact it is centrally
located and because of its range of activities, urban attractions and heritage sites. The District has
a high number of hotels: 125 offering 17,678 hotel rooms, which represents a third (31.7%) of all
city hotels and more than a quarter (26.9%) of the hotel beds available in the city.
The total supply of tourist places in the district is 24,563 - including hotels, hostels, tourist
apartments, housing for tourism usage and youth hostels-, representing 20% of the total supply
in Barcelona.
Tourism Total supply of tourist places* % of the District
El Raval 9,895 40.3 %
El Barri Gòtic 8,691 35.4 %
La Barceloneta 2,951 12.0 %
Sant Pere, Santa Caterina i la Ribera 3,026 12.3 %
* Includes hotels, hostels, housing for tourism use and youth hostels.
Source: Department of Employment, Business and Tourism Studies of the City Council of Barcelona.
18 Economic Development Plan Ciutat Vella 2016-2021Regarding the distribution of tourism supply by neighbourhood, the Raval heads all the quarters with 9,895 beds available, representing two-fifths of the whole district’s supply (40.3%), followed by the Gòtic quarter, with about 8,700 beds, representing more than a third of the total (35.4%), while Sant Pere, Santa Caterina i la Ribera have more than 3,000 beds and Barceloneta has 2,950, which accounts for 12.3% and 12 % of the total, respectively. Social and solidarity economy Ciutat Vella accounts for 11% of Barcelona’s social and solidarity economy initiatives, including a wide variety of organizations and activities, with a significant presence of housing cooperatives and social placement companies, which represent 42% and 30% of those found in the city, respectively. It has 76 cooperatives and 61 worker-owned companies, 6 consumer group initiatives, three exchange markets and three community allotments, as well as two time banks and two community management spaces, four mutual companies and an ethical finance entity. This diversity of projects shows the huge potential for developing the market for alternative social and economic initiatives. Initiatives of the Social and Solidarity Economy Ciutat Vella % Barcelona CETS 3 6.3 % Job placement companies 6 30.0 % Housing cooperatives 13 41.9 % Education cooperatives 1 5.3 % Ethical finance 1 14.0 % Community allotments 3 15.0 % Consumer groups 6 10.2 % Exchange markets 3 23.1 % Time Banks 2 10.0 % Community management 2 9.5 % Mutual 4 23.5 % Consumer cooperatives 1 3.2 % Cooperative societies 76 8.8 % Worker owned companies 61 5.1 % Source: The Social and Solidarity Economy in Barcelona. Barcelona City Council 2015. Economic Development Plan Ciutat Vella 2016-2021 19
It also highlights the concentration of the Third Social Sector in this district with entities with
different legal structures that aim to deal with social problems related to vulnerable groups,
amounting to 336 organizations in 2013 (14% of the city’s total). This makes Ciutat Vella the
district with the largest number of such entities, along with the Eixample.

Regarding the total number of associations, the city’s register has 973 entries for Ciutat Vella,
with 322 cultural institutions –one third (33.1%) of the city’s total–, followed by those working in
the area of education and training –74 entities or 7.6% of the total. Moreover, cultural associations
and guilds and other professional organizations represent over one fifth (21%) of these entities
in Barcelona.

Distribution of associations across the neighborhoods of Ciutat Vella in 2015
Association type                          El Raval        El Gòtic   La Barceloneta        Sant Pere,         Ciutat Vella
                                                                                         Santa Caterina
                                                                                           i la Ribera

Total associations                           343            297           84                   249                 973

% over / total District                    35.3 %         30.5 %         8.6 %               25.6 %

Education and Training                        28            20             8                    18                 74

Social Economy                                 7             2             0                     4                 13

Guilds and professionals                      22            17             2                    13                 54

Cultural                                     112            87            33                    90                 322

Neighbourhood                                 10            12             9                     6                 37

Source: Governobert. City Council entities report file.

In terms of their distribution across neighbourhoods, the Raval accounts for more than a third
of all associations in the district with a total of 343 associations, followed by the Gòtic quarter
(with 30.5%), Sant Pere and Santa Caterina i la Ribera (25.6%) and Barceloneta (8,6%).

20                                                                             Economic Development Plan Ciutat Vella 2016-2021
Socio-economic indicators, Ciutat Vella 2015
Demographics (1) El Raval El Gòtic La Barceloneta Sant Pere, Ciutat Vella Barcelona
Santa Caterina
i la Ribera
Population (1) 47,617 15,269 15,036 22,305 100,227 1,609,550
% Of the total population of the District 47.5 % 15.2 % 15.0 % 22.3 % - -
% Annual population increase -1.76 % -4.03 % -0.96 % -1.63 % -2.01 % -0.2 %
Net population density (inhab / ha) (2015) 949 454 1,149 695 775 619
Men (%) 54.9 % 52.1 % 49.8 % 50.0 % 52.6 % 47.4 %
Women (%) 45.1 % 47.9 % 50.2 % 50.0 % 47.4 % 52.6 %
Life expectancy (M / W), (2013) 76.2/ 84.9 years 80.9/83.4 years 76.0/84.8 years 78.8/85.5 years 77.2/84.9 years 80/ 86.4 years
% Youth population (16-24 years) 9.5 % 8.4 % 7.9 % 7.9 % 8.7 % 8.0 %
Economic Development Plan Ciutat Vella 2016-2021
% Population 16-64 years 74.3 % 76.4 % 71.1 % 74.5 % 74.2 % 65.0 %
% Population without education + primary education 34.2 % 20.5 % 29.0 % 22.0 % 32.3 % 24.7 %
% Population with university education 18.9 % 34.4 % 22.6 % 33.5 % 28.3 % 29.4 %
% of foreign population over the total 48.1 % 41.7 % 31.3 % 38.9 % 42.6 % 16.3 %
% of the largest foreign population group over the total 22.6% 14.5% 16.4% 15.1% 15.6% 9,6%
of foreign population (Pakistan) (Italy) (Italy) (Italy) (Pakistan) (Italy)
Socio-economics
Index of disposable household income (2014) 65.9 98.5 84.5 92.5 79.7 100
Change IDHI 2014/13 +5.6 -5.1 +2.4 +1.3 +2.5 % -
Total unemployed (May 2016) 3,630 919 1,092 1,514 7,155 82,569
% Of unemployed over District total (May 2016) 50.7 % 12.8 % 15.3 % 21.2 % - -
Weight of registered unemployment (population
10.4 % 7.7 % 10.2 % 9.1 % 9.6 % 7.9 %
16-64 years) in % (May 2016)
Weight of registered unemployment (population
11.7 % 9.0 % 11.2 % 9.9 % 10.8 % 9.0 %
16-64 years) in % (May 2015)
Change in the weight of unemployment (p.p.) -1.3 % -1.3 % -1.0 % -0.8 % -1,2 % -1.1 %
Total unemployed May 2015 4,110 1,067 1,194 1,655 8026 93,617
Annual % change in unemployment (May 2016) -11.7 % -13.9 % -8.5 % -8.5 % -10.9 % -11.8 %
% Of long-term unemployed over total unemployed
38.5 % 39.5 % 45.4 % 42.2 % 40.0 % 42.2 %
(May 2016)
% People attended by municipal social services with
9.3 % 7.8 % 9.0 % 7.6 % 8.5 % 4.6 %
respect to total population
21
(1) Official Residency Registration 06/30/2015
Source: Department of Employment, Business and Tourism based on data from the Statistics Department at Barcelona City Hall.22
Economic Activity Indicators, Ciutat Vella 2015
El Raval El Gòtic La Barceloneta Sant Pere, Ciutat Vella Barcelona
Santa Caterina
i la Ribera
Economic activity
% Surface area given over to economic activity 35.9 % 46.7 % 44.9 % 31.2 % 38.8 % 30.6 %
% Cadastral surface area occupied by Industry (m²) 12.9 % 16.3 % 5.0 % 21.4 % 14.5 % 29 %
% Offices 14.6 % 28.8 % 31.7 % 27.2 % 24.4 % 18.1 %
% Retail and commerce 21.9 % 23.8 % 12.9 % 23.5 % 21.4 % 23.8 %
Retail and services (2014)
Total establishments on the ground floor 2,544 2,140 753 1,837 7,274 67,433
% establishments over total for the District 35.0 % 29.4 % 10.4 % 25.3 % - -
Total retail on the ground floor 900 1,011 177 841 2,929 21,414
% retail over total establishments on ground floor 35.4 % 47.2 % 23.5 % 45.8 % 40.3 % 31.8 %
% retail over total for the District 30.7 % 34.5 % 6.0 % 28.7 % - -
Total Services on ground floor 1,209 797 370 698 3,074 31,290
% services over total establishments on ground floor 47.5 % 37.2 % 49.1 % 38.0 % 42.3 % 46.4 %
% Services over total for the District 39.3 % 25.9 % 12.0 % 22.7 % - -
% premises empty over total for the District 34.2 % 28.3 % 15.8 % 21.7 % - -
Tourism
Total supply of tourist places* 9,895 8,691 2,951 3,026 24,563 122,223
% of the total for the District 40.3 % 35.4 % 12.0 % 12.3 % - -
Housing
Housing prices, 2nd hand (€ / m²) 2,775 4,236 4,043 3,827 3,765 3,478
Rental prices (average monthly rent, € / month) 625.8 786 602.6 723.4 675.7 734.94
Average size of rented surface area 61.1 79.5 38.2 64.5 61.1 70.7
Number of leases signed 1,484 684 703 1,014 4,182 40,623
* Including hotels, hostels, apartments, housing for tourism use and youth hostels.
Source: Department of Employment, Business and Tourism based on data from the Statistics Department of Barcelona City Hall
Economic Development Plan Ciutat Vella 2016-202102.2. VISION OF THE FUTURE This Plan is setting forth a vision for the economic development of the district aimed at reaching the objectives described in section 1.1. To achieve this we need to reverse some of the negative dynamics experienced in the socio-economic area, as well as committing to economic sectors that facilitate the transition to a new type of production model. 02.2.1. Dynamics to reverse Monoculture economy centred on tourism, eateries and nightlife Tourism is an important economic sector for Ciutat Vella: here we find most of the hotels in Barcelona, 26.9% of the city hotel count and a large number of associated services. This centrality generates, as we know, a huge economic dynamism and opportunities for employment. 22.8% of the population residing in the District, in fact, say they work or have worked over the last two years in activities related to tourism, 9.7% above the average for the city, according to the Survey on the Perception of Tourism in 2015 carried out by Barcelona City council. However, economic specialisation has also led to a loss of diversity in both commerce-related and business activities and this can lead to an increased vulnerability of the economic model. The Local Development Plan for Ciutat Vella should allow us therefore to strengthen our productive basis to boost the area’s resources in order to consolidate a plural economic ecosystem that is diversified, sustainable and which offers social returns that encourage different sectors of economic activity and make us more resilient over the long-term to cyclical variations and different economic contexts. As well, there is a massification of visitors and a difficult balance in terms of the use of public space because of this economic activity and the multiple leisure options available. In fact, the neighbours in the Gòtic quarter, Barceloneta or Sant Pere, Santa Caterina i la Ribera say tourism is the main problem facing the city, according to the latest Survey of Municipal Services. Another key objective of the Plan must therefore be to ensure that tourism generates a greater social return while reducing its negative impacts on the residents of the District and the rest of Barcelona too, by making a strategic commitment to economic diversification and a locally-oriented commerce sector serving the needs of the residents of Ciutat Vella and Barcelona. Economic Development Plan Ciutat Vella 2016-2021 23
Gentrification

The Ciutat Vella District has seen the original low-income population replaced in recent years
–and to a large extent this is still occurring– with other social strata that have a higher
purchasing power.

Without public leadership, housing and living costs are rising, due to the characteristics of this
District and its centrality and its enormous capacity to attract people, along with the fact that the
area is going through a process of urban renewal, as well as the weight of tourism in the district.
While disposable household income in Ciutat Vella is around 80% of the average of Barcelona,
according to the latest data, which we might say is in the mid-to-low range, housing rental prices
have not stopped rising, especially in areas suffering most of the pressure of tourism, such as
Barceloneta, which are now the most expensive areas in Barcelona per square metre. Also the
sales price of second-hand housing is 8% higher than in the rest of the city (data from the first
quarter of 2016).

Thus, especially in some areas, we are witnessing processes of local population displacement that
are leaving the district against their will. As mentioned above, in the last ten years Ciutat Vella has
lost 11.4% of its residents.

Job insecurity and violation of labour rights

Precarious labour conditions are not new, but this certainly has intensified in recent years.
87.3% of the job contracts signed in Barcelona last June were temporary ones, according to the
Department of Business and Employment. If we look more closely at the intensifying nature of
temporary work, we see that in Catalonia 88.1% of contracts are temporary, according to the
previously mentioned source, and 40.5% of these did not last more than one month in 2015,
and almost two out of three (64.7%) did not last a year.

Moreover, the persistence of significant levels of unemployment and the cumulative effect of many
years of economic recession has also led, according to statistics and other newspaper, union and
qualitative studies, to other forms of deterioration in working conditions. Low wages, excessive
workloads often unpaid, and the growth of part-time contracts have resulted in fraud and abuse
of various kinds and situations of discrimination and exploitation against women and immigrants
which are situations that unfortunately are too common.

Economic development initiatives and the promotion of employment cannot look the other way.
In this sense, the Ciutat Vella Development Plan aims to address the processes of precarious
employment by promoting more and better quality jobs. It will put special emphasis on the tourism
sector as a leading economic sector in the district, which has a high degree of outsourcing, and
precarious and temporary jobs. The deterioration of working conditions also affects the excellence
of services provided and also the quality offered, so improving working conditions should have
a payback on the living conditions of workers and the quality of the sector.

24                                                               Economic Development Plan Ciutat Vella 2016-2021
Unemployment, especially for youngsters, and growing inequalities

Although Ciutat Vella is a very dynamic district economically, its population is younger than in
other areas, with a higher percentage of working age population, and with an unemployment rate
that stands two points above the average for the city.

Given a general context of very high rates of youth unemployment (27.8% of people under 30 years
old in Catalonia in the first quarter of 2016), this District’s youngsters show high levels of dropout
at school in a schooling context that is moreover highly complex. Therefore, local employment
policies must remember that this is one of the social sectors that has most difficulties to find
employment and this must be given priority attention. It is also important to take into account
the situation of women, who are particularly affected by poverty, precarious working conditions
and accountability in terms of caring tasks, and other groups such as immigrants, the long-term
unemployed, those over 55 years old and generally those with special difficulties in accessing
the labour market.

As we have seen, the number of people being attended by the municipal social services compared
to the total population –standing at 8.5%– is almost four points above the average for the city
as a whole. Other socio-economic indicators show that across large swathes of the District,
social needs are high, while the differences between quarters in the same district are also
significant, which makes social cohesion difficult. It is essential, therefore, that action aimed at
economic development generates better income distribution and equality of opportunities for the
inhabitants of the District.

02.2.2. Sectors and economic areas

The economic diversification being projected means we need to identify a number of economic
sectors or areas as part of the framework of the Plan that can be prioritised and therefore get
special support in order to make them into spaces that are dynamic and solid in their provision
of goods and services, whilst generating quality employment:

Care work and services for people

As mentioned in point 1.1., the local development contemplated in this Plan has the needs
of people who inhabit this area at the centre of its activity. The main needs of people to lead
a dignified, full and sustainable life are related to caring (food, facilities, wellbeing, health,
accommodation, caring for one’s self and those we are responsible for), and so it is important
to explore this area in terms of employment and service provision.

Community interventions

The social and community needs of the area can be dealt with by Public Authorities and also
to a large extent by social or individual initiatives and these can generate quality jobs. These
intermediation projects can be community, social and culturally based, or related to the
development of the area and social research, among others, and at the same time they are
economically sustainable and generate a significant social return.

Economic Development Plan Ciutat Vella 2016-2021                                                     25
Local commerce and retail

This Plan understands local commerce as individual shops (not chains or franchises) dedicated
to catering to various needs of the population. These are traditional shops, and also new shops by
individual entrepreneurs or SMEs that offer goods and services necessary for local area residents
and those in the city, as well as for workers in Ciutat Vella. In a district with many retail chains
and franchises aimed at supplying goods and services for tourism, promoting such institutions
helps preserve the traditional business model, which is valuable because it promotes uniqueness
rather than homogenization, personal services and the involvement of retailers in the community
life of our neighbourhoods. Thus, this Plan is aimed at preserving and promoting this type of trade
and also highlighting the valuable role of shopkeepers. In this sector, it is important to protect
traditional and unique retail because of its high cultural value.

Responsible consumption

Alongside support for local commerce to protect and promote key economic, social, cultural and
community issues, there is also a need to develop responsible consumption, as described in point
2.1. This type of consumption is aimed at resolving the real needs of people efficiently, and also
to help empower them (as consumers and producers), and to reduce inequalities and to generate
environmental sustainability.

Cultural projects

An area with quality cultural projects available to everyone is an area that looks after its welfare
and the empowerment of citizens. At the same time, the cultural sector can become a strong
economic sector, generating employment, goods and services that improve the lives of people
who enjoy culture or take part in it. Today there are more than 300 cultural facilities in the city
and Ciutat Vella plays host to 33.6% of the total surface area for this activity, according to the
Cultural Observatory of Barcelona. This sector can generate positive synergies with other areas
of development and should be understood as an economic stakeholder acting in favour of the
rights of everyone. Therefore, it should stimulate development in this area, understanding culture
is a common good, and this should help move towards a city model that is fairer, more plural and
democratic, towards a “new institutionality” that includes the major cultural facilities and
the basis of our cultural and citizen frame.

Small-scale urban production

In the current economic context where the most important sector of the economy is the service
sector, there should be a commitment to small-scale urban production in order to move towards
a plural and diversified economy that also produces goods. Whether this is based on crafts, which
are deeply rooted in the District, or small-scale manufacturing industry, an optimal economic
ecosystem is one that apart from solving needs via services, also offers local production.

26                                                              Economic Development Plan Ciutat Vella 2016-2021
Circular economy

The circular economy is based on the concept of sustainability, where the value of products,
materials and resources –water, energy, raw materials– remains in the economy for as long as
possible to minimize the generation of waste. The circular economy is creating jobs in sectors
such as waste management and this contributes greatly to reducing the negative externalities of
the current production model. At the same time, it is a good starting point for reindustrialization,
as it generates jobs in the area that cannot be relocated. In 2014, the green economy had
between 25,000 and 36,000 workers in Barcelona and this represented between 2.6 and 3.7%
of employment in the city, generating stable and quality employment –79.8% workers in green
sectors are salaried4–. It is undoubtedly an emerging economic sector and it produces a significant
social return.

Knowledge and innovation

A dynamic area, economically and culturally speaking, is one that researches, studies and
promotes innovation, whether technological or social. The knowledge economy is a major asset
for this district. In the field of advanced services and value added industry, Ciutat Vella has
considerable dynamism. During the period 2001-2010, the District experienced growth of 28.8%
in these sectors, above the 5.3% average increase of Barcelona (Bcn Metròpoli Creativa, Informe
i mapes urbans de coneixement i innovació de Barcelona 2011).

Moreover, Ciutat Vella is recognised because of the fact there are a lot of universities and
innovative companies in sectors such as business services, ICTs and biohealth (Barcelona
Innovation Map 2014).

Ciutat Vella has to make the most of these assets and facilitate the creation of new projects
and innovation hubs and as such promote connections between these and the rest of the area.

4
    Data from Estudi sobre l’economia Verda a Barcelona (2015), by the Department of Employment, Business and Tourism Studies
    at Barcelona city Hall.

Economic Development Plan Ciutat Vella 2016-2021                                                                                27
03. Strategy lines and measures
03.1. LOCAL ECONOMIC DEVELOPMENT5
As mentioned in the introduction, this Plan understands local economic development as a set
of actions, policies and strategies that promote economic activity that are rooted in the potential
of an area and aimed at solving the needs of people who live there. The idea is to strengthen the
local economy in order to cover the needs of the city, and deal with the crisis situations which we
find ourselves immersed in, with the aim of distributing wealth and opportunities, with a gender,
intercultural and environmental sustainability perspective.
This type of local development aims to take advantage of resources in the area and at the same
time organise a plural economic ecosystem that stimulates different practices and economic
activity sectors through concerted policies and projects between the Public Administration,
the community fabric, the social sector and private stakeholders.
Strategy line 1
Promoting retail diversity and local commerce
Given the centrality and intensity of visits that Ciutat Vella receives, retail and commerce has
experienced a specialization in tourism segments which has led to a loss of diversity in business
activity. Commerce in the District should be able to find a balance between tourism’s demand
and the needs of those men and women who live and work there, as well as finding solutions
for Barcelona’s residents that still see the centre of the city as a reference shopping point.
Commercial development that is designed to serve people is one that can meet these needs as
far as possible.
In this regard, support for local retail is essential. This plan understands local commerce as a type
of premises or shop (not a chain or franchise) dedicated to catering to the various needs of the
population. These are traditional shops, and also entrepreneurs’ new premises or SMEs that offer
goods and services required by the neighbourhood and/or other people of Barcelona. In a district
with many retail chains and franchises supplying goods and services for tourism, promoting such
shops helps to preserve the traditional business model. It is a valuable model because it promotes
uniqueness, rather than homogenisation, and personalised service, and because it brings huge
social value contributing to social structure and the cohesion of neighbourhoods. Thus, this Plan
also aims to support, preserve and promote this type of commerce, valuing the shopkeeper’s
profession.
5
The strategy lines included under Local Economic Development are specially apt to deal with this area, but all of the strategy lines set
out in this plan, in this and other sections (New Public Leadership, Employment quality, Sustainable Tourism and Social and Solidarity
Economy) are strategy lines for Local Development Economy, although in order to respect the perspective of the PAD/PAM, the contents
have been divided into the PAD/PAM sections.
28 Economic Development Plan Ciutat Vella 2016-2021You can also read