PATTERNS OF GROUND-DWELLING VERTEBRATE BIODIVERSITY IN THE GNANGARA SUSTAINABILITY STRATEGY STUDY AREA - Leonie E. Valentine, Barbara A. Wilson ...
←
→
Page content transcription
If your browser does not render page correctly, please read the page content below
PATTERNS OF GROUND-DWELLING VERTEBRATE
BIODIVERSITY IN THE GNANGARA SUSTAINABILITY
                STRATEGY STUDY AREA

Leonie E. Valentine, Barbara A. Wilson, Alice Reaveley, Natalia
            Huang, Brent Johnson and Paul Brown

            Department of Environment and Conservation

                            July 2009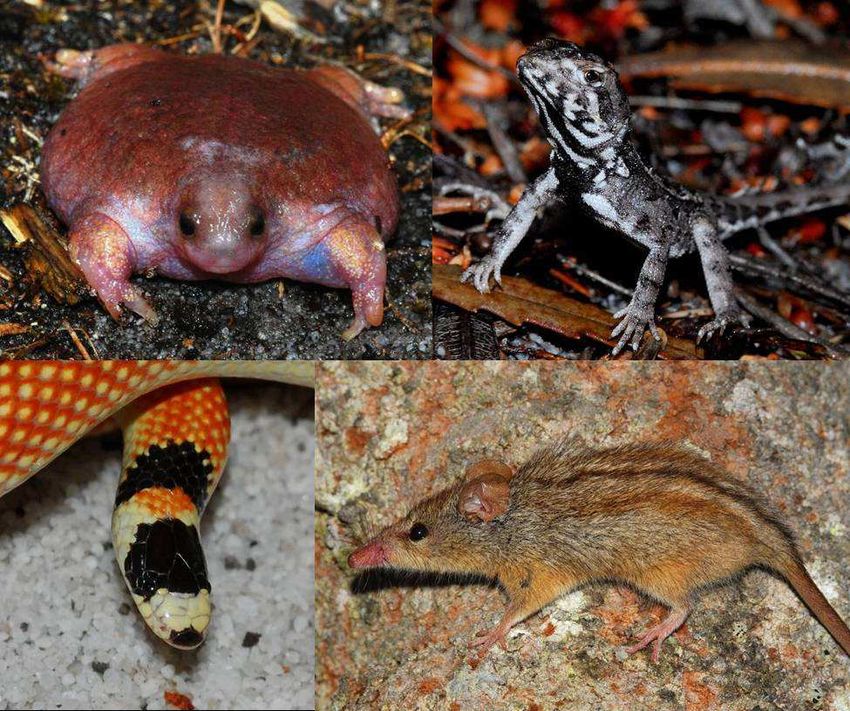
Patterns of ground-dwelling vertebrate biodiversity in the Gnangara Sustainability
Strategy study area

Draft Report to the Department of Environment and Conservation and the
Gnangara Sustainability Strategy

Leonie E. Valentine, Barbara A. Wilson, Alice Reaveley, Natalia Huang, Brent
Johnson and Paul Brown

Department of Environment and Conservation

Gnangara Sustainability Strategy Taskforce
Department of Water
168 St Georges Terrace
Perth Western Australia 6000
Telephone       +61 8 6364 7600
Facsimile       +61 8 6364 7601
www.gnangara.water.wa.gov.au
© Government of Western Australia 2009
July 2009

This work is copyright. You may download, display, print and reproduce this material in unaltered form only
(retaining this notice) for your personal, non-commercial use or use within your organisation. Apart from any
use as permitted under the Copyright Act 1968, all other rights are reserved. Requests and inquiries
concerning reproduction and rights should be addressed to the Department of Conservation and Environment.

This document has been commissioned/produced as part of the Gnangara Sustainability Strategy (GSS). The
GSS is a State Government initiative which aims to provide a framework for a whole of government
approach to address land use and water planning issues associated with the Gnangara groundwater system.
For more information go to www.gnangara.water.wa.gov.au

Acknowledgements
The Department of Environment and Conservation would like to thank the following for their contribution to
this publication: The GSS – DEC biodiversity team and numerous volunteers who assisted with field work,
and Dr Ian Abbott and Dr Wes Bancroft for comments on a draft version.

Front cover photos (clockwise from top right): Rankinia adelaidensis adelaidensis, Tarsipes rostratus,
Neelaps calonotos and Myobatrachus gouldii. Photo credit: L. Valentine.
Patterns of Biodiversity in the GSS

Table of Contents

Introduction ........................................................................................................................... 1
   The Gnangara groundwater system ................................................................................... 1
       The Gnangara Sustainability Strategy ........................................................................... 2
   Species richness and endemicity ....................................................................................... 3
       The southwest of Western Australia – a globally significant region............................. 3
       Diversity and endemicity in the GSS ............................................................................ 4
       Disturbances to species diversity in the GSS ................................................................ 6
   Aims .................................................................................................................................. 8
Methods ............................................................................................................................... 10
   Study area ........................................................................................................................ 10
   Fauna surveys .................................................................................................................. 12
       General survey trapping............................................................................................... 12
       Targeted trapping surveys ........................................................................................... 14
       Plant species richness and habitat parameters ............................................................. 15
   Data collation and analyses ............................................................................................. 16
       General trapping survey............................................................................................... 16
       Targeted trapping survey ............................................................................................. 19
Results ................................................................................................................................. 20
   Occurrence and distribution of fauna .............................................................................. 20
   General fauna surveys ..................................................................................................... 26
       Abundance, species richness and diversity ................................................................. 26
       Patterns in species composition................................................................................... 30
       Fauna and habitat parameters ...................................................................................... 31
       Succession with time since fire in Banksia woodlands ............................................... 34
   Targeted quenda and rakali trapping ............................................................................... 36
Discussion............................................................................................................................ 39
   General observations ....................................................................................................... 39
   Fauna trapping surveys.................................................................................................... 40
       Patterns in diversity across vegetation types and landform units................................ 40
       Patterns in diversity with time since fire ..................................................................... 42
       Targeted trapping surveys ........................................................................................... 44
   The future for biodiversity in a drying climate ............................................................... 46

Table of Contents                                                                                                                  i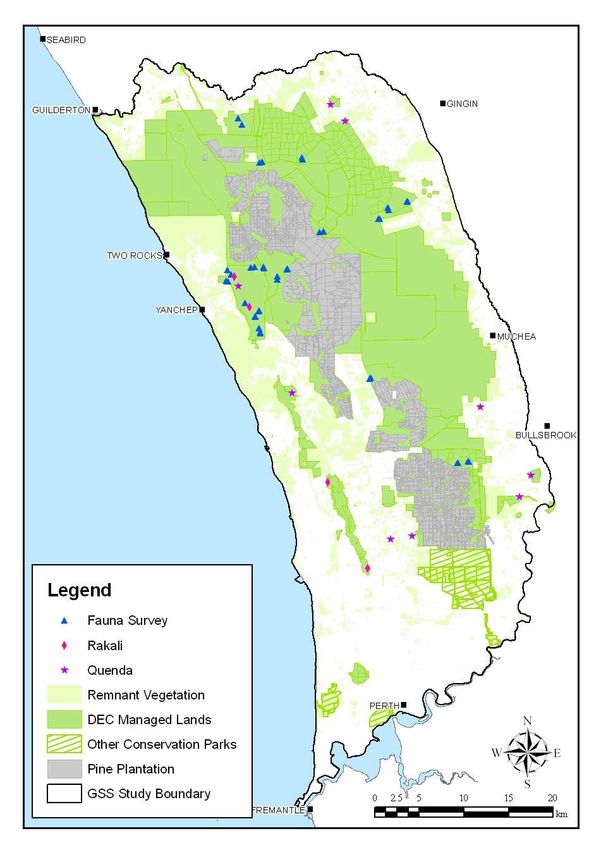
Patterns of Biodiversity in the GSS

References ........................................................................................................................... 48
Appendix ............................................................................................................................. 57

List of Figures

Figure 1. The remnant vegetation extent and DEC managed lands located within the GSS
study area. Fauna survey sites, including targeted mammal trapping areas are also
indicated. ............................................................................................................................. 11
Figure 2. Vegetation types surveyed, including a) tuart, b) Melaleuca, c) Banksia and d)
jarrah.................................................................................................................................... 13
Figure 3. Representative fauna captured during fauna surveys in the GSS study area. ...... 24
Figure 4. Differences in the mean (± 95%CI) a) reptile abundance and b) species richness
of different vegetation types. ............................................................................................... 27
Figure 5. Significant differences in mean (± 95%CI) a) reptile evenness, b) plant species
richness, and c-d) selected individual species abundances among different vegetation types.
............................................................................................................................................. 28
Figure 6. Significant differences in the mean (± 95%CI) of a) reptile abundance and b)
abundance of M. obscura between long unburnt (Old) and recently burnt (Young) sites. . 29
Figure 7. NMDS ordination (Sorensen distance measure) on the assemblage of reptiles (n
= 23 species) at 38 sites coded by a) landform unit, b) vegetation type and c) time since
fire........................................................................................................................................ 31
Figure 8. Associations of a-b) reptile species and c-e) reptile abundance with various
habitat parameters, and, f) reptile abundance with litter depth, with times since fire
categories identified............................................................................................................. 33
Figure 9. Successional responses of reptiles (using relative abundance estimates) to time
since fire.. ............................................................................................................................ 35
Figure 10. Successional responses of Mus musculus and Tarsipes rostratus (using relative
abundance estimates) to time since fire............................................................................... 36
Figure 11. Abundance of four mammal species at sites targeted for trapping quenda. ...... 37
Figure 12. Abundance of three mammal species at sites targeted for trapping rakali........ 38

Table of Contents                                                                                                                     ii

Patterns of Biodiversity in the GSS

List of Tables

Table 1. Species captured during pit-fall trapping or cage and elliot trapping during
general fauna surveys throughout the GSS study area, excluding targeted mammal
surveys.. ............................................................................................................................... 21
Table 2. ANOVA F-values for reptile abundance, species richness, diversity and evenness
and plant species richness and individual species abundances showing responses to
landform unit, vegetation type and time since fire. ............................................................. 29
Table 3. Pearson’s correlations (r) of reptile abundance, species number, diversity,
evenness, plant species number and fuel age with habitat variables at each site. ............... 32

Table of Contents                                                                                                                iii

Patterns of Biodiversity in the GSS

  Patterns of ground-dwelling vertebrate biodiversity in the
                  Gnangara Sustainability Strategy study area

Introduction

Human-induced disturbances are major causes of global environmental change and
substantially modify ecosystems and alter natural disturbance patterns (Sala et al. 2000;
1997). Common contributors to environmental change include habitat destruction, altered
fire regimes and climate change. Understanding how fauna respond to these human-
mediated disturbances is critical for effective conservation planning and management of
biodiversity assets, and may determine future management actions. However,
understanding the influence of disturbances on biodiversity assets is often difficult to
assess without basic knowledge of the occurrence, distribution and relative abundance of
species in relation to local landscape features.

A case study example includes the biodiversity assets of the northern Swan Coastal Plain,
north of Perth, Western Australia. The region is close to a capital city, and has undergone
extensive habitat modification and alterations to fire regimes. In addition, the region is
currently experiencing declines in water supply caused by reduced rainfall and increased
abstraction of the underground aquifers. Yet the area contains one of the largest remnant
vegetation patches on the Swan Coastal Plain, and has high biodiversity values,
particularly of the ground-dwelling vertebrates (e.g. Kitchener et al. 1978; Storr et al.
1978). To aid future conservation planning and management activities, it is imperative to
broaden our understanding of the potential influence of landscape features and human-
mediated disturbances on biodiversity assets of the region.

The Gnangara groundwater system
The Gnangara groundwater system is located on the Swan Coastal Plain (SWA2) IBRA
sub-region, north of the Swan River, Perth, Western Australia and covers an area of
approximately 220 000 ha. The Gnangara groundwater system consists of an unconfined,
superficial aquifer known as the Gnangara Mound that overlies the confined Leederville

Introduction                                                                               1
Patterns of Biodiversity in the GSS and Yarragadee aquifers, as well as the smaller Mirrabooka and Kings Park aquifers (Government of Western Australia 2009b). The area covered by the Gnangara groundwater system represents a distinct water catchment that extends from Perth (Swan River) in the south, to the Moore River and Gingin Brook in the north, and from the Darling Scarp in the east to the Indian Ocean in the west (Government of Western Australia 2009b). The Gnangara Mound is directly recharged by rainfall (Allen 1981; Government of Western Australia 2009b) and provides the city of Perth with ~ 60 % of its drinking water. It supports numerous significant biodiversity assets, including the largest patch of remnant vegetation south of the Moore River, a number of Bush Forever sites, threatened species and ecological communities, and ~ 600 wetlands. However, declining rainfall and runoff levels in the past 30 years have heavily impacted on water availability and the ecosystems in the region. The impacts of a drying climate and declining groundwater levels strongly influence the water levels of the Gnangara groundwater system (Froend et al. 2004; Horwitz et al. 2008). Since the late 1960s, monthly rainfall has generally been below average (Yesertener 2007), resulting in decreased flows to public water supply dams and declining groundwater levels in the aquifers (Vogwill et al. 2008). Indeed, groundwater levels have decreased by up to 4 m in the centre of the Gnangara Mound and the eastern, north-eastern and coastal mound areas have experienced declines in the water table of 1 – 2 m (Yesertener 2007). In addition, other threatening processes are impacting on biodiversity in the region, including habitat clearing, fragmentation, altered fire regimes and impacts of Phytophthora cinnamomi (Government of Western Australia 2000; Mitchell et al. 2003). The Gnangara Sustainability Strategy Maintaining biodiversity is fundamental to maintaining ecosystem processes and is an environmental policy and priority of both Commonwealth and State Governments in Australia. To tackle the impending water crisis, the Gnangara Sustainability Strategy (GSS) was initiated to provide a framework for balancing water, land and environmental issues; and to develop a water management regime that is socially, economically and environmentally sustainable for the Gnangara groundwater system (DOW 2008). A multi- agency taskforce was established in 2007 to undertake the GSS project, which incorporates existing land and water use policies, studies on the ecosystem assets and processes, and the Introduction 2
Patterns of Biodiversity in the GSS

development of a decision-making process to integrate values, risks and planning processes
(DOW 2008).

Current understanding of biodiversity values, ecosystem processes and the dynamics of the
Gnangara groundwater system, particularly at landscapes scales, is inadequate
(Government of Western Australia 2009b). Gaps in our capacity to measure impacts on
biodiversity, landscape condition and ecosystem processes as a result of disturbances (e.g.
climate change, changed water regimes, fire, and plant pathogens) are likely to result in
ineffective management actions and low quality outcomes. The ability to develop
successful planning relies on the quality of the biodiversity information (Pressey 1999;
Wilson et al. 2005). Indeed, unless an adequate understanding of these issues is
accomplished, justification of changed management actions in the face of potentially
degrading impacts on biodiversity is difficult.

Species richness and endemicity

The southwest of Western Australia – a globally significant
region
The GSS study area is located centrally in the biodiversity hotspot of southwest Western
Australia – a region of globally significant biodiversity (Mittermeier et al. 2004). This
area is internationally recognised because of its high levels of biodiversity and endemicity
and the high degree of threatening processes (Mittermeier et al. 2004). The high level of
plant biodiversity is generally attributed to the extreme climatic shifts and poor soils that
have promoted local specialisations (Hopper and Gioia 2004). The floristic diversity of the
area is particularly well renowned (Beard et al. 2000; Hopper and Gioia 2004), containing
over 7 000 vascular plant taxa, of which approximately 50 % are endemic (Coates and
Atkins 2001; Hopper and Gioia 2004). Similarly, southwest Western Australia provides
habitat for > 500 vertebrates, of which nearly 1/6th are endemic (Mittermeier et al. 2004).
The high degree of endemicity is particularly well reflected among the rich reptile and frog
taxa with a total of approximately 177 species of reptiles and 32 species of frogs, of which
15 % and 80 % respectively are endemic to southwest Western Australia (Mittermeier et
al. 2004). Similarly, the mammal fauna is historically diverse with 59 species recorded,
including 12 endemics (Mittermeier et al. 2004). However, the mammal fauna in

Introduction                                                                             3
Patterns of Biodiversity in the GSS

southwest Western Australia has undergone a number of species extinctions and declines
(Abbott 2008; Kitchener et al. 1978).

The occurrence and distribution of ground-dwelling vertebrates are often influenced by
landscape features, including structural complexity and succession age, and are thus likely
to respond to disturbance induced changes in habitat (e.g. Pianka 1989; Rosenzweig and
Winakur 1969; Wilson et al. 1986). Indeed the mammal fauna of southwest Western
Australia has already undergone a series of extinction and range contractions, indicating a
susceptibility to human-mediated disturbances (Kitchener et al. 1978). Reptiles are
strongly dependent on habitat structure (Pianka 1989), typically have small home ranges
and are therefore often used as a surrogate measure of faunal diversity in response to
disturbances (e.g. Cunningham et al. 2002; Valentine and Schwarzkopf 2009). Frogs are
primarily influenced by changes in water cycling and quality, which is strongly related to
water balance physiology and reproduction (White and Burgin 2004). Although there is
scant information regarding the relative importance of habitat factors for herpetofauna
assemblages, it is likely that the importance of factors varies between reptiles and
amphibians, as well as among species, and response is based on individual life history
attributes (e.g. How and Dell 2000; Jellinek et al. 2004).

Diversity and endemicity in the GSS
The GSS study area is located north of the Swan River (Figure 1), in the northern Swan
Coastal Plain, in an area that is well known for its richness of terrestrial vertebrate taxa
(Kitchener et al. 1978; Storr et al. 1978). Part of the Swan Coastal Plain’s significance for
biodiversity lies in its geographic location, with several species occurring at the limits of
their distribution (How 1978). A number of parallel reviews on the diversity of the
ground-dwelling vertebrates of the Swan Coastal Plain were conducted as part of the GSS
process (see Bamford and Huang 2009; Huang 2009; Reaveley 2009) and these provide a
detailed review of the biological diversity and history of vertebrates in the GSS study area.

Herpetofauna

All 13 species of frogs (Bamford and Huang 2009) historically known to occur in the GSS
study area still occur on the Swan Coastal Plain, with the possible exception of

Introduction                                                                              4
Patterns of Biodiversity in the GSS

Heleioporous barycragus, which may occur only on the south eastern edge, and the
burrowing frog Neobatrachus pelobatoides, formerly widespread but now known only
from populations south of Perth (How and Dell 2000). There are approximately six frog
species that are restricted to wetlands, including the Motorbike Frog Litoria moorei, the
Slender Tree Frog Litoria adelaidensis, Crinia georgiana, Crinia pseudinsignifera, Crinia
glauerti and possibly Günther’s Toadlet (Pseudophryne guentheri) (Bamford and Huang
2009). Additional frog species include the terrestrial Turtle Frog Myobatrachus gouldii,
the Pobblebonk Frog Limnodynastes dorsalis and the Moaning Frog Heleioporus eyrei,
which are dependent on upland woodland habitats during the non-breeding season
(Bamford and Huang 2009).

The reptilian fauna on the northern Swan Coastal Plain is speciose (How and Dell 1993;
1994; 2000; Storr et al. 1978). Its species richness (in the GSS) is currently estimated to
comprise of 39 genera and 64 species including 2 turtles, 8 geckoes, 8 pygopodids, 2
dragons, 3 goannas, 21 skinks, 2 turtles, 4 blind snakes, 2 pythons and 14 elapid snakes
(Huang 2009). The study area has 17 taxa at or close to their geographical limit. Of these
species, 27 taxa are restricted to southwest Western Australia. Of these, seven taxa are
local endemics to the SCP, including Pseudemydura umbrina, Delma concinna concinna,
Pletholax gracilis gracilis, Hemiergis quadrilineata, Lerista christinae, Rankinia
adelaidensis adelaidensis and Neelaps calonotos. Only one species, the critically
endangered Western Swamp Tortoise Pseudemydura umbrina, is endemic to the GSS
study area, with populations restricted to Ellen Brook Nature Reserve and Twin Swamps
Nature Reserve on the eastern boundary of the GSS (Burbidge and Kuchling 2004). The
Western Swamp Tortoise is Australia’s most endangered reptile species (Cogger 2000).
Several species may have experienced range and abundance contraction since European
settlement, with only one species believed to have become extinct from the GSS study
area: Stimson’s Python (Antaresia stimsoni stimsoni) (How and Dell 1994).

The legless lizards, skinks and elapid snakes are well represented in the northern Swan
Coastal Plain (Storr et al. 1978). In particular, nearly half of the pygopods in the northern
SCP are endemic to the west coast and coastal plains of WA, representing a stronghold for
this reptilian taxa (Storr et al. 1978). In addition, the fossorial skinks and snakes are well
represented on the deep siliceous and calcareous sands of the western part of the SCP
(How and Dell 2000).

Introduction                                                                             5
Patterns of Biodiversity in the GSS

Mammals

Historically, up to 33 native mammal species have been recorded on the northern Swan
Coastal Plain (Kitchener et al. 1978), although by the late 1970s only 12 species were
recorded during extensive surveys conducted by the Western Australian Museum
(Kitchener et al. 1978). A recent review (Reaveley 2009) estimated that approximately 10
non-bat mammal species are currently extant within the GSS. Species such as the Woylie
(Bettongia penicillata) and Numbat (Myrmecobius fasciatus) are presumed extinct in the
northern SCP while extant species such as the Bush Rat (Rattus fuscipes), Water Rat
(Hydromys chrysogaster), Western Brush Wallaby (Macropus irma) and Honey Possum
(Tarsipes rostratus) occur only in restricted or isolated populations (How and Dell 2000;
Kitchener et al. 1978). The mammals have thus experienced very high extinction rates and
all species are considered to have declined in distribution and abundance (Kitchener et al.
1978).

Disturbances to species diversity in the GSS
A number of threatening processes for terrestrial vertebrates have been identified
previously in the study area including declining groundwater levels, habitat fragmentation,
inappropriate fire regimes and Phytophthora infection (Government of Western Australia
2000; Wilson et al. 2007). The impacts of such processes on the reptiles and mammals of
the study area were also explored in parallel literature reviews (Huang 2009; Reaveley
2009) and some of the threatening processes are examined here.

Recently, declining rainfall and increased aquifer abstraction has led to declining
groundwater levels (Yesertener 2007). This has emerged as a significant threat to wetland-
associated vertebrate fauna in the GSS study area. There is evidence that lake systems are
being converted to swampy flats, and seasonal wetlands are drying, with some becoming
acidic (Froend et al. 2004; Pettit et al. 2007). Long-term changes in groundwater may also
have a negative impact on Banksia woodland ecosystems that are not directly linked to the
groundwater. Declines in wetlands and Banksia woodlands should have significant
impacts on vertebrate fauna and their habitats, as most of the fauna of the northern Swan
Coastal Plain has adapted to the predictability of the climate (How 1978). However, there

Introduction                                                                          6
Patterns of Biodiversity in the GSS

is little knowledge of both the habitat components that are most affected, and the fauna
communities or taxa that are most susceptible to declining groundwater levels. Mammals
(e.g. the Water Rat, Bush Rat and Quenda), reptiles (e.g. the Tiger Snake and the Glossy
Swamp Skink Egernia luctuosa) and frogs that are dependent on lakes, wetlands, and
damp and thick vegetation are likely to be highly susceptible to declines in rainfall and
groundwater levels. Indeed, it is suspected that the Mardo (Antechinus flavipes) have
disappeared locally as a consequence of wetland losses (How 1978; Kitchener et al. 1978).

Located within close proximity to Western Australia’s capital city, Perth, the GSS study
area has undergone substantial clearing for urban development and agriculture. Numerous
studies have examined the relationship of faunal response to urban expansion, habitat loss
and fragmentation (How and Dell 1993; 1994; 2000). Reptiles have shown a marked
decline in Perth and its suburbs, with very few species persisting after development occurs,
and there is a rapid decline as soon as native vegetation is cleared for farming (How and
Dell 1993; 1994; 2000). Native mammals are typically the most disadvantaged, with few
native mammals surviving in urban areas (How and Dell 2000). Congruently, the success
of introduced species associated with urban expansion (e.g. cats) is correlated with native
mammal declines (Kitchener et al. 1978). However, in the GSS study area DEC manages
> 70 000 ha of remnant vegetation, including the largest contiguous remnant vegetation
patch south of the Moore River. In this habitat, the persisting fauna may be strongly
influenced by fire regimes and climate change, although data to this effect are scarce.

Fire often occurs as a human-mediated disturbance and is an important contemporary land
management tool (Russell-Smith et al. 2003; Whelan 1995). Fire plays a pivotal role in
determining environmental and biological heterogeneity (Brawn et al. 2001; Whelan
1995), and is instrumental in structuring numerous communities in southwest Western
Australia (Burrows and Abbott 2003). Ecosystems on the Swan Coastal Plain are
considered some of the most flammable in southwest Western Australia, due to the lengthy
period of the year that the vegetation is combustible, and plant growth adaptations that
result in rapid accumulation of vegetation after fire (Burrows and Abbott 2003). However,
inappropriate fire regimes have been recognised as a major threatening process on the
Swan Coastal Plain at the landscape level, for protected areas, wetlands, riparian zones,
ecosystems and species at risk.

Introduction                                                                              7
Patterns of Biodiversity in the GSS

A potential management measure that has been suggested to reduce declining groundwater
levels of the Gnangara groundwater system is the use of 10 year rotational burning
strategies (Government of Western Australia 2009a), where fire management may be used
to promote groundwater recharge. However, burning to increase groundwater recharge is
still only a modelled concept (Vogwill et al. 2008; Yesertener 2007). If burning for
groundwater recharge is implemented across the Gnangara groundwater systems, empirical
data on the responses of fauna to fire is essential. Previous studies in other habitats have
shown that reptile and mammal fauna communities are strongly influenced by fire regimes
(Cunningham et al. 2002; Letnic et al. 2004; Valentine and Schwarzkopf 2009; Wilson and
Aberton 2006; Wilson et al. 2001). Urban remnants in the Perth region have also shown
that lizard diversity was greatest in areas that have remained unburnt the longest (Dell and
How 1995), indicating a susceptibility of some species to frequent burning. Understanding
how fauna in larger remnant vegetation patches respond to fire is important for developing
appropriate fire management strategies. Within the GSS study area, fauna groups of
particular interest with regard to fire regimes include the diverse reptile community and
targeted mammal species such as the Honey Possum (Tarsipes rostratus). Although the
strong association of frog species with wetland vegetation obviously make this taxon
relevant, we do not focus on responses by frogs to fire regimes in this report.

Aims
There has been a range of studies conducted at various locations and with a range of
objectives on the GSS study area over the past 40 years. Previous assessments of patterns
of vertebrate biodiversity have been restricted to single phylogenetic groups, and/or land
classes or geographically localised areas. There is little understanding of the habitat
requirements of taxa and communities, and of the impacts of threatening processes.

In our report, we assess the current occurrence and distribution of terrestrial vertebrate
fauna across the GSS study area, examine patterns in biodiversity with landscape features
and assess the susceptibility of taxa and communities to threatening processes such as
declining groundwater levels and fire. The project was designed with the main objectives
to:
      1. Determine the current species richness and abundance of ground-dwelling
           vertebrate fauna persisting in the region;

Introduction                                                                              8
Patterns of Biodiversity in the GSS
2. Investigate patterns of biodiversity with broad landscape features including
landforms, vegetation types and time since fire;
3. Examine patterns in biodiversity and specific species responses with site
characteristics including habitat and microhabitat structure and floristics;
4. Relate findings to the impacts of fire, and predictions on the potential impacts of
declining groundwater levels.
Introduction 9Methods Study area The GSS study area is situated on the Swan Coastal Plain and extends from the Swan River in the south, to the Moore River and Gingin Brook in the north, and from the Ellen Brook in the east to the Indian Ocean in the west (DOW 2008) Figure 1). The Swan Coastal Plain is built up from foothill, aeolian, lake, river and estuarine deposits laid down to the west of the scarp (Davidson 1995). Three main dune systems underlie most of the groundwater system – the younger Quindalup Dunes close to the coast, the Spearwood Dunes associated with Tamala Limestone ridges within about ten kilometres of the coast and the inland Bassendean Dunes which are older and flatter, and contain leached and slightly acidic sands (Figure 1). The three main dune systems are dominated by a Banksia overstorey with sporadic stands of Eucalyptus and Allocasuarina, and an understorey consisting mainly of low shrubs from the Myrtaceae, Fabaceae and Proteaceae families. There are many seasonal damplands, swamps and permanent wetlands, fringed by Banksia littoralis and Melaleuca trees with a variable understorey of species from the Cyperaceae, Juncaceae and Myrtaceae (Semeniuk et al. 1990). The distribution of vegetation on the northern Swan Coastal Plain is predominantly determined by the underlying landforms, soils, depth to water table and climatic conditions (Cresswell and Bridgewater 1985; Heddle et al. 1980). Heddle et al. (1980) defined broad vegetation complexes across the Swan Coastal Plain in relation to these landform–soil units (Churchward and McArthur 1980) and the varying climatic conditions. Although there have been large amounts of clearing for urbanisation and agriculture, the total remnant native woodland in the GSS study area covers more than 100 000 ha (72 447 ha of which is managed as DEC-estate), and includes the largest continuous area of remnant vegetation on the Swan Coastal Plain, south of the Moore River. The remnant woodland within the GSS study area has significant biodiversity values, containing threatened species and ecological communities, and numerous wetlands. The study area also includes approximately 25 000 ha of pine plantation (Figure 1). Methods 10
Figure 1. The remnant vegetation extent and DEC managed lands located within the GSS
study area. Fauna survey sites, including targeted mammal trapping areas are also
indicated.

Methods                                                                             11
The GSS study area experiences a dry Mediterranean-type climate (Beard 1984), with hot
dry summers (December – March) and cool wet winters (June – August), and an average of
870 mm annual rainfall recorded at the Perth meteorological station. Rainfall and runoff
declines in the last 30 years have been significant, with approx 21 % less rainfall and 64 %
less runoff for the 1997 - 2003 compared to 1911 - 1974 (Yesertener 2007).

Fauna surveys
The GSS fauna survey included a general ground-dwelling vertebrate trapping program
across the GSS study area and a targeted program for particular wetland-associated species
(quenda and rakali) in specific wetlands and damplands within the GSS study area.
The fauna trapping was designed to cover a range of remnant bush land in the northern and
eastern part of the GSS study area, predominantly within DEC-managed estate. The trap
sites were selected to represent a range of landform units, vegetation associations and fuel
ages, were initially examined by desktop spatial analysis and maps and subsequently
validated in the field. Landform unit was classified according to Churchill and McArthur
(1980) with potential sites selected by spatial analysis. Vegetation associations were
identified initially by spatial analysis of the Mattiske dataset (Mattiske Consulting Pty Ltd
2003) and field validation confirmed the dominant plant species at each site. Time since
last fire was obtained from the 2007 Corporate Data fuel age dataset provided by Fire
Management Services of DEC, with time since last fire at each site validated using
VegMachine.

General survey trapping

Trapping design

The sampling regime was designed to assess 40 sites in the major areas of continuous
remnant bush land in the northern and eastern areas of the GSS study area (Figure 1). Sites
were selected to represent the major landform units (Quindalup, Spearwood and
Bassendean), vegetation communities (Banksia woodland, coastal scrub, jarrah forest, tuart
forest and Melaleuca wet or dampland; Figure 2) and time since last fire. As the time since
last fire varied considerably among sites (3 – 36 years since last fire, YSLF), we grouped
sites into two major categories: Young, those recently burnt (< 11 YSLF); or Old, those
long unburnt (> 16 YSLF) (Figure 1; Appendix 1). Where possible, the 40 sites were

Methods                                                                                  12
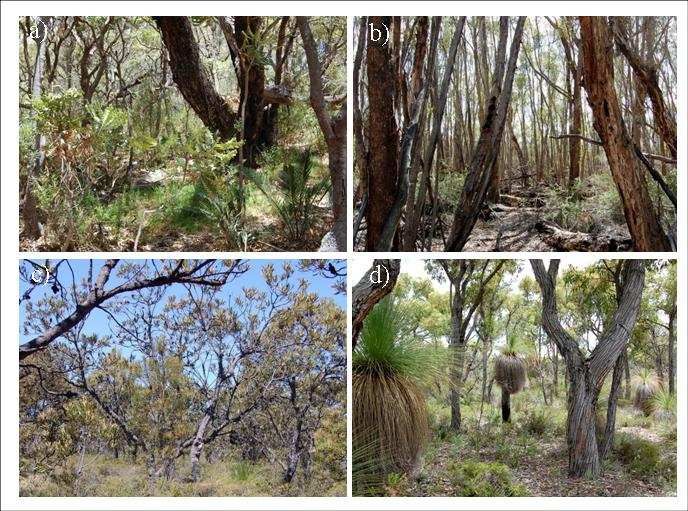
grouped into 20 paired sites, located between 300 – 500 m from one another. Some
categories, such as the Quindalup landform were not well represented due to their limited
occurrence and/or poor accessibility in the study area.

Figure 2. Vegetation types surveyed, including a) tuart forest, b) Melaleuca wetland c)
Banksia woodland and d) jarrah forests.

The trapping layouts, sampling design and methodology employed in previous vertebrate
surveys on the GSS study area has been variable. We used a trapping design that included
an array of pitfall traps (20 L buckets), and a transect line of small aluminium box traps
(elliotts) and cage traps (sheffields). Several studies have indicated that the large pitfall
traps in conjunction with drift fences have superior trap success (Friend et al. 1989;
Morton et al. 1988; Ryan et al. 2002) and hence were utilised in our study. Each of our
sites contained one pitfall trap array, with 10 pitfall traps located in a Y shape, with three
pits placed along each arm radiating out from a central pit and placed at approximately 7
metre intervals along each arm. The pitfall traps were connected with 30 cm high
aluminium fly wire drift fence and extended out one metre past the end of each arm. Each
arm measured 22 metres long, with a total fence length of 66 metres in an array (see
Appendix 2 for pitfall trap layout).

Methods                                                                                  13
Where sites were located in pairs (paired sites were at least more than 300 m apart), twenty
elliott and ten sheffield traps were positioned along a 300 m-long transect between the two
sites. Elliott traps were located at 15 m intervals, and a Sheffield cage trap was set at 30 m
intervals corresponding with every second elliott trap point. Both trap types were baited
with universal bait comprising a mixture of peanut paste, rolled oats and tinned sardines.

Survey effort

Sites were opened for 12 – 20 nights in spring 2007, autumn 2008 and spring 2008. While
open, all traps were checked once per day in the early morning. Captured animals were
identified, processed and released onsite. Measurements taken included: weight (g), snout-
vent length (mm), total length (mm) for reptiles; and, weight (g), head length (mm), short
pes length (mm), gender, and presence of pouch young for mammals. Mammals were ear
notched for recapture purposes (quenda received a unique ear tag), whilst reptiles were
marked with a non-toxic permanent marker pen under the throat. Amphibians were not
marked. Taxonomic nomenclature, including common names, followed the Western
Australian Museum. Incidental observations of species were also recorded and are
included in the tally of species totals.

Species accumulation curves were examined for the initial two trapping periods (spring
2007) to establish optimal trapping nights. Curve asymptotes indicated that 5 to 8 nights
was adequate.

Targeted trapping surveys
Targeted trapping surveys for quenda (south brown bandicoot; Isoodon obesulus
fusciventer) and rakali (water rats; Hydromys chrysogaster) were undertaken in May 2008.
Quenda were targeted following the lack of captures during the general spring 2007
terrestrial vertebrate survey, and to confirm recent information indicating that the species
appears to be linked to wetland-associated vegetation (T. Friend pers. comm.). Rakali
were targeted to determine if the species is persisting within the study area and if so, their
distribution. As the only known aquatic mammal in southwest Western Australia, their
presence in a wetland or waterway could be a useful indicator of the health of wetland
systems.

Methods                                                                                 14
Quenda sites were selected in areas that contained a permanent wetland or were swampy or
damp for part of the year. Four sites were selected based on historical records; these
included Little Badgerup Swamp, Neaves Road Nature Reserve, Maralla Road Nature
Reserve and Nowergup Nature Reserve (Figure 1). The five remaining sites were selected
based on presence of suitable habitat for quenda. Permanent water bodies are believed to
be suitable rakali habitat (Olsen in Van Dyck and Strahan 2008), and rakali sites were
selected to reflect this habitat preference. Sites were chosen at three lakes within the study
area: Lake Joondalup in the suburb of Joondalup, Lake Goolellal in the suburb of Kingsley
and Loch Mc Ness in Yanchep National Park (Figure 1). Trap transects were located on
the north western section of Lake Joondalup, the eastern side of Lake Goolellal and 4-5
different locations around Lake Loch McNess. Traps for rakali were established on the
water’s edge, with the open door facing the lake.

A continuous transect of Sheffield cage traps was established amongst vegetation
considered to be suitable habitat for quenda or rakali at 50 m intervals through the site.
Depending on the size of the site, between 10 and 30 traps were set. Universal bait was
used in all traps set to capture quenda and a sardine was hung on a hook in the cages set for
rakali. All sites were trapped over 4 nights, except for Lake Goolellal, which was trapped
for 3 nights due to logistic issues. Captured animals were identified, measured and
released onsite. Measurements included: weight (g), head length (mm), short pes length
(mm) and gender. Captured quenda were ear-tagged in each ear with unique identification
tags. Rakali were ear-notched in one ear.

Plant species richness and habitat parameters

Floristic surveys

A number of 10 m x 10 m floristic survey quadrats were established in the GSS study area,
located as close as possible to the centre point of the established fauna pit traps. The
location data of each quadrat was recorded on a GPS at the centre of the quadrat, using
GDA94 as the datum, and each quadrat was physically demarcated using four galvanised
fence droppers, one at each corner. In total, floristic surveys were conducted at 36 of the
40 fauna sites. Due to logistical constraints, floristic surveys were not conducted at the
two Quindalup Dune (coastal scrub vegetation) sites or two of the northern Banksia

Methods                                                                                    15
woodland sites (sites 3A and 3B). All vascular plants were recorded in spring 2008, and in
our study we focus on the number of plant species per site. Plant specimen identifications
are currently being confirmed with the Western Australian Herbarium. A detailed
examination of floristic diversity patterns will be the focus of a separate report (Mickle and
Swinburn in prep).

Habitat parameters – vegetation structure

Within close proximity to the floristic plots (within 20 m) and the pit-fall trap array, 20 x 1
m2 quadrats were established to examine microhabitat attributes. Attributes assessed
included vegetation structure and ground substrate composition. To provide an index of
vegetation complexity within a 2 m height range, vegetation contact (both live and dead)
was recorded (for height classes 0-20cm, 20-40cm, 40-60cm, 60-80cm, 80-00cm, 100-
150cm, 150-200cm) using a graduated pole, placed at the point in the centre of the quadrat.
At the same point, canopy cover was measured using a densitometer, which calculated an
approximate percentage canopy cover. Ground cover within the 1m2 quadrat was
estimated as a percentage of vegetation (live and dead), soil (bare ground) and litter
(including leaf and woody debris). Litter depth (cm) was measured using a ruler that was
pressed through the litter (where relevant) until it touched a firm soil surface.

The vegetation structure and cover were recorded using Keighery (1994). The crown cover
is estimated to as close to 5 % as per the National Vegetation Inventory System as well as
the class rating as per Muir (1977). Up to three dominant species were recorded as part of
each layer and any more that three dominants were classed as mixed. Vegetation condition
was recorded using the Keighery (1994) Vegetation Condition Scale.

Data collation and analyses

General trapping survey

Abundance, species richness and diversity

Data from pit-fall trapping of sites, and the trapping using elliott and cage traps between
paired sites is described and collated as species presence/absence tables. Most data were
collected using pit-fall trapping, and further exploration and analyses were conducted on

Methods                                                                                  16
the pit-fall trapping data, excluding data from the two sites on Quindalup dunes (due to
limited number of replicates in this dune system). Pit-fall trapping intensity varied among
sites, and we have performed analyses on the data using average abundance and species
richness estimates, based on the relative abundance for each species and species richness
from 10 trap nights. Diversity of the reptile assemblage at each site was calculated from
these measures using Simpson’s Diversity of Index (1-D), which ranges from 0 (low
diversity) to 1 (high diversity). In addition, the Evenness of the reptile assemblage at each
site (E, derived from Shannon-Wiener Index) was calculated. Evenness represents the
degree of variation in a community, with higher values of E representing a less variable
community.

To explore patterns in data, one-way ANOVAs (using SPSS 2008, version 17.0) were used
to examine differences in reptile abundance, reptile species richness, reptile diversity and
evenness among the 38 sites with respect to landform unit (Spearwood and Bassendean),
vegetation type (Banksia, Melaleuca, jarrah and tuart) and time since last fire (Old, > 16
YSLF and Young, < 11 YSLF). Post-hoc Tukey HSD tests were used to determine
differences among vegetation types where applicable. The abundance of dominant species
(reptiles: ≥ 10% of observed individuals; mammals and frog: the two most abundant
species) were also compared among factors using ANOVAs. In addition, the number of
plant species recorded at each site (n = 36) were also explored in relation to landform,
vegetation type and fuel age using ANOVAs.

Patterns in species composition

Community composition, defined as the average abundance (per 10 trap nights) of each
species per site, was compared among factors (landform unit, vegetation type and fuel age)
using Multi-Response Permutation Procedure (MRPP, Mielke 1984), based on a rank-
transformed Sorensen distance matrix in the statistical package, PC-ORD (McCune and
Mefford 1999). Rare species (species that were observed in less than three sites) were not
included in the analysis. MRPP is a type of nonparametric multivariate procedure for
testing differences between groups and provides an A statistic, which is the chance-
corrected within group agreement, and an associated p-value (McCune et al. 2002). Post-
hoc pair-wise comparisons were used to examine differences in reptile assemblages among
vegetation types. Where community composition differed significantly among factors (α <

Methods                                                                                17
0.05), non-metric multidimensional scaling (NMDS, Kruskal 1964) was used to
graphically depict the site assemblage relationships using PC-ORD (McCune and Mefford
1999). Where 3-dimension ordinations were deemed more appropriate (determined using
scree plots and Monte Carlo tests), the two axes that represent the highest proportion of
variance in the ordination are displayed. Reptile species and microhabitat and vegetation
structure variables that were correlated with the NMS axes (r2 > 0.2) are graphically
depicted on the ordinations.

Habitat parameters and correlations with fauna

Habitat parameters examined included percentage estimates of ground vegetation cover,
soil cover, litter cover and canopy cover, a measurement of litter depth and data collected
on understorey structure (touch pole data). Habitat variables for each site were correlated,
using Pearson’s correlation coefficient (SPSS, version 17), with reptile abundance, reptile
species richness, reptile diversity, reptile evenness, plant species number and time since
last fire (recorded in years since last fire or YSLF).

Succession with time since fire in Banksia woodlands

Initial groupings of sites into time since fire categories were fairly broad, with recently
burnt sites < 11 YSLF and long unburnt sites > 16 YSLF. However, sites located in
Banksia woodlands (n = 16) were from a range of time since fire (4 – 36 YSLF), and could
be sorted into five different categories of time since fire, including: Young, 4 YSLF (n =
4); Young-Intermediate, 6-7 YSLF (n = 3); Intermediate, 17 YSLF (n = 4); Old, 22-26
YSLF (n = 2); and, Very Old, 36 YSLF (n = 3). This range in time since fire allowed us to
examine possible patterns of succession in different stages of post-fire Banksia woodlands.
We calculated average abundance per 10 trap nights for each species in the five different
time since fire categories, and then relativised abundance estimates for each species and
graphically interpreted patterns in relative abundance of dominant reptile and mammal
species. Rare reptile species (those species observed in less than 3 sites) were excluded
from analyses.

Methods                                                                                 18
Data transformations

Habitat parameters measured using percentages were adjusted by arcsine transformation of
the square-root proportional data (Zar 1999). Count data (reptile abundance, species
number, individual species abundance, and vegetation touch pole data) and litter depth
were examined for normality and heteroscedasticity using box plots, Q-Q plots and
residual plots. Individual species abundances, vegetation touch pole data and litter depth
were square-root transformed to meet assumptions of ANOVA and Pearson’s correlations.

Targeted trapping survey
The results of the targeted trapping surveys, including the capture of non-target species, is
described and graphically interpreted. As trapping intensity varied among sites, mammal
capture rates are presented as abundance per 100 trap nights.

Methods                                                                                19
Results

Occurrence and distribution of fauna
Trapping effort in the general fauna survey involved 5 600 pitfall trap nights, 5 600 elliott
trapping nights and 2 800 cage trapping nights, and 930 cage trap nights in the targeted
surveys for quenda and rakali. In total, 38 reptile, 16 mammal and 6 frog species were
trapped and/or recorded during surveys (see Appendix 3 for complete species list). The
reptile and frog families represented include: Myobatrachidae (ground frogs; 5 genera, 5
species), Hylidae (tree frogs; 1 genus, 1 species), Gekkonidae (geckos; 3 genera, 3
species), Pygopodidae (legless lizards; 6 genera, 7 species), Agamidae (dragons; 2 genera,
2 species), Varanidae (goannas; 1 genus, 1 species), Scincidae (skinks; 9 genera, 16
species), Typhlopidae (blind snakes; 1 genus, 1 species) and Elapidae (front-fanged
snakes; 7 genera, 8 species). Nine native mammal species and seven introduced mammal
species were recorded: Tachyglossidae (1 species), Dasyuridae (1 species), Peramelidae (1
species), Tarsipedidae (1 species), Phalangeridae (1 species), Macropodidae (2 species),
Muridae (4 species), Canidae (1 species), Felidae (1 species), Leporidae (1 species), Suidae
(1 species) and Bovidae (1 species).

Trapping for the general fauna surveys yielded 2 021 individuals, representing 43 species
of frogs, reptiles and mammals (Table 1, Figure 3). Skinks were the most commonly
caught animal during surveys (65 %). The majority of species (36 species) were captured
in the pit-fall traps, however, six species were only captured in the cage and/or elliott traps
(Table 1). All reptiles were recorded in one or more trap type, excluding Varanus gouldii,
which was recorded only by incidental observation. Six mammals were captured by one or
more trap type (Table 1), while ten mammal species were recorded only by incidental
observation. The priority reptile species, Neelaps calonotos, was captured on two sites:
one in the north in Melaleuca wetlands on long unburnt (22 YSLF) Bassendean soils;
second in the east in Banksia woodland on long unburnt (36 YSLF) Bassendean soils.

Results                                                                                 20
Table 1. Species captured during pit-fall trapping or cage and elliott trapping during general fauna surveys throughout the GSS study area,
excluding targeted mammal surveys. The presence or absence of each species is represented based on landform unit, vegetation type and fuel
age (presence of species indicated by a ‘1’, and the number of sites in each category is provided in brackets). The number of site a species was
observed at, and the abundance of each species in either pit-fall traps or cage and elliott traps is included. Summary data on general abundance
and family-level representation in different landform units, vegetation types and time since fire category is also provided.
                                       Landform Unita                  Vegetation Typeb          Years Since Firec   # of sitesd   Abundancee
                                    Q (2) Sp (20) Bn (18) Cs (2)   Tt (4) Jh (4) Me (14) Bk (16) 16 (21)   Total (40)    PF     CE
                                                                    Amphibia
 Myobatrachidae
 Crinia insignifera                  0       0       1      0       0          0    0        1      0        1            1         1     0
 Heleioporus eyrei                   1       1       1      1       1          1    1        1      1        1           17        84      0
 Limnodynastes dorsalis              1       1       1      1       1          1    1        1      1        1           24        52     1
 Myobatrachus gouldii                0       1       1      0       0          1    1        1      1        1           19        75      0
 Pseudophryne guentheri              0       0       1      0       0          0    0        1      1        0            1         3      0
 Hylidae
 Litoria moorei*                     0       1       0      0       0          0    1        0      1        0           1         0       1
                                                                    Reptilia
 Gekkonidae
 Christinus marmoratus               0       1       1      0       1          1    1        1      1        1           10        17      0
 Diplodactylus polyphthalmus         0       1       0      0       0          0    0        1      1        0            1         1      0
 Strophurus spinigerus spinigerus    1       1       1      1       0          1    1        1      1        1           15        42      0
 Pygopodidae
 Aprasia repens                      0       1       1      0       0          0    1        1      1        1           12        31      0
 Delma concinna concinna             0       0       1      0       0          0    0        1      1        0            1         1      0
 Delma fraseri fraseri               0       1       1      0       0          0    1        1      1        1            3         5      0
 Delma grayii                        1       1       1      1       0          0    1        1      1        1            3         3      0
 Lialis burtonis                     1       1       1      1       0          1    1        1      1        1           15        27      0
 Pletholax gracilis gracilis         0       1       1      0       0          1    0        1      1        1            3         3      0
 Pygopus lepidopodus                 0       0       1      0       0          0    1        1      1        1            7         9      0
 Agamidae
 Pogona minor minor                  1       1       1      1       0          1    1        1      1        1           21        50      0

Results                                                                                 21
Landform Unita Vegetation Typeb Years Since Firec # of sitesd Abundancee
Q (2) Sp (20) Bn (18) Cs (2) Tt (4) Jh (4) Me (14) Bk (16) 16 (21) Total (40) PF CE
Rankinia adelaidensis adelaidensis 1 1 1 1 0 1 1 1 1 1 24 165 0
Scincidae
Acritoscincus trilineatum 0 1 1 0 1 0 1 0 1 1 5 10 0
Cryptoblepharus buchananiif 1 1 1 1 1 1 1 1 1 1 31 149 0
Ctenotus australis 1 1 1 1 1 1 1 1 1 1 9 17 1
Ctenotus fallens 1 1 1 1 1 1 1 1 1 1 31 119 6
Ctenotus impar 0 0 1 0 0 0 1 0 1 0 1 1 0
Egernia kingii 0 1 0 0 0 0 1 0 1 0 1 2 1
Egernia napoleonis 0 1 1 0 0 1 1 1 1 1 5 7 4
Hemiergis quadrilineata 1 1 1 1 1 1 1 1 1 1 26 167 0
Lerista elegans 1 1 1 1 1 1 1 1 1 1 35 362 0
Lerista lineopunctulata 1 0 0 1 0 0 0 0 0 1 1 1 0
Lerista praepedita 1 1 1 1 0 0 1 1 1 1 13 17 0
Menetia greyii 1 1 1 1 1 1 1 1 1 1 33 278 0
Morethia lineoocellata 0 0 1 0 0 0 0 1 1 1 4 13 0
Morethia obscura 1 1 1 1 1 1 1 1 1 1 29 168 0
Tiliqua occipitalis 1 0 1 1 0 0 0 1 0 1 2 2 3
Tiliqua rugosa rugosa 1 1 0 1 1 1 1 0 1 1 7 10 82
Typhlopidae
Ramphotyphlops australis 0 1 1 0 0 0 0 1 0 1 2 4 0
Elapidae
Brachyurophis semifasciata 0 0 1 0 0 0 1 0 0 1 1 1 0
Demansia psammophis reticulata 1 0 1 1 0 0 1 0 0 1 2 3 0
Neelaps calonotos 0 0 1 0 0 0 1 1 0 1 2 2 0
Notechis scutatus* 0 0 1 0 0 0 1 0 0 1 1 0 1
Parasuta gouldii 0 0 1 0 0 0 1 1 1 1 3 4 0
Pseudonaja affinis affinis* 0 1 0 0 0 0 0 1 1 0 1 0 1
Pseudonaja nuchalis* 0 0 1 0 0 0 0 1 1 0 1 0 1
Simoselaps bertholdi 1 1 1 1 1 0 0 1 1 1 6 8 0
Mammalia
Tachyglossidae
Tachyglossus aculeatus* 0 0 1 0 0 0 1 1 1 1 3 0 3
Dasyuridae
Sminthopsis sp 0 0 1 0 0 0 0 1 1 0 1 1 0
Tarsipedidae
Results 22Landform Unita Vegetation Typeb Years Since Firec # of sitesd Abundancee
Q (2) Sp (20) Bn (18) Cs (2) Tt (4) Jh (4) Me (14) Bk (16) 16 (21) Total (40) PF CE
Tarsipes rostratus 0 1 1 0 0 1 1 1 1 1 14 28 0
Muridae
Mus musculus 1 1 1 1 1 1 1 1 1 1 27 77 39
Rattus fuscipes 0 1 0 0 0 0 1 0 1 0 1 1 1
Rattus rattus* 0 1 0 0 1 0 1 0 1 0 2 0 2
Summary Data
Abundance Total Total
Total Number of Individuals 628 99 554 420 99 163 351 248 382 899 2021 147
Relative Average Abundance per
site (10 trap nights) 4.025 3.4115 3.1676 4.025 5.8854 3.755 2.5253 3.2081 2.90132 3.72242
Species Richness
Number of Frog Species 2 3 5 2 2 3 3 5 4 4 5 1
Number of Reptile Species 18 23 32 18 11 15 27 28 29 31 33 9
Number of Mammal Species 1 4 4 1 2 2 5 4 6 3 4 4
Total Number of Species 21 30 41 21 15 20 35 37 39 38 42 14
Relative Average Richness per site
(10 trap nights) 0.95 0.8479 0.812 0.95 0.651 0.839 0.7545 0.9409 0.86294 0.81329
a
Landform Unit: Q = Quindalup, SP = Spearwood Dunes, Bn = Bassendean Dunes
b
Vegetation Type: Cs = Coastal Scrub, Tt = tuart forest, Jh = jarrah forest, Me = Melaleuca wetlands, Bk = Banksia woodlands
c
Years Since Fire: < 11 = more than 11 years since last fire, > 16 = more than 16 years since last fire
d
# of sites: refers to the number of sites a species was captured at out of a total of 40 sites
e
Abundance: refers to the total abundance of captured species in either the pit-fall traps (PF) or cage and elliott traps (CE)
f
Formerly considered to be C. plagiocephalus, recent revision indicates the species in the GSS is C. buchananii (Horner 2007).
* Indicates species that were exclusively captured in the cage or elliot traps
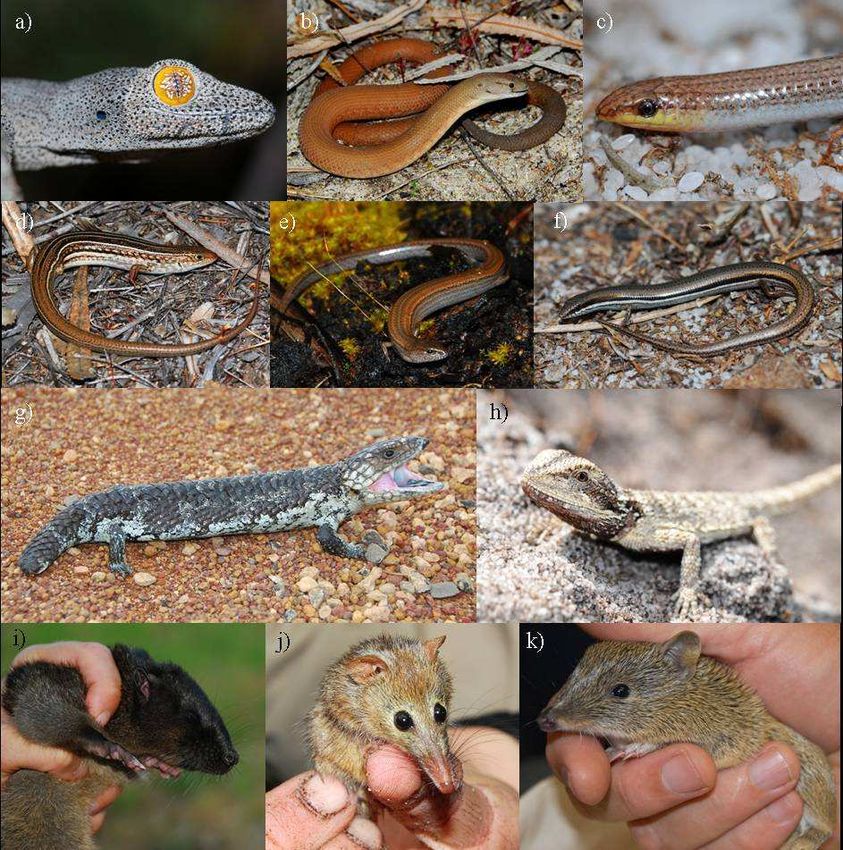
Results 23Figure 3. Representative fauna captured during fauna surveys in the GSS study area. Species include a) Strophurus spinigerus spinigerus, b) Pygopus lepidopodus, c) Aprasia repens, d) Ctenotus fallens e) Hemiergis quadrilieata, f) Lerista elegans, g) Tiliqua rugosa, h) Pogona minor, i) Hydromys chrysogaster, j) Tarsipes rostratus, and k) Isoodon obesulus fusciventer. Photo credit: a-j) L. Valentine, k) DEC. Total species richness varied among sites, from a minimum of two to a maximum of 18 species, with the highest number of species recorded at two long unburnt (> 20 YSLF) Bassendean sites in Banksia woodland. The two sites located on the Quindalup landform in coastal scrub vegetation were also species rich, with 15 species captured at both sites. One of these species, Lerista lineopunctulata, was only captured in the coastal scrub Results 24
vegetation. The lowest species richness was recorded at a Spearwood site in Melaleuca
dampland with young fuel age (3 YSLF). Total species richness also varied among
landform units and vegetation type, with the highest species richness on Bassendean sites,
and in Melaleuca and Banksia sites (Table 1). There were few differences in total species
richness between recently burnt and long unburnt sites. However, sites were not trapped
equally, and the relative species richness variable provides a more equitable measure.
Based on this, Quindalup Dunes contains the highest species richness of landform units,
with coastal scrub vegetation type and Banksia woodlands being the most species rich sites
(Table 1).

The most widespread or commonly-occurring reptile species across all sites were Lerista
elegans, (85 % of sites), Cryptoblepharus buchananii (75 % of sites) and Menetia greyii
(68 % of sites) (Table 1). A total of 1 163 reptiles were captured in pitfall traps. Of these,
the most abundantly captured species were Lerista elegans and Menetia greyii, making up
21 % and 17 % of total reptile captures respectively. There were 7 reptile species and 60
individuals caught by cages and elliots, with a vast majority of these (80 %) being Tiliqua
rugosa (Bobtail). Three reptile species were caught exclusively by cages and elliots (Table
1). Several species of snake were only captured in sites with older fuel ages, including the
blind snake Ramphotyphlops australis and the two small elapids Brachyurophis
semifasciata and the Priority listed species Neelaps calonotos.

The most widely distributed frog species was Limnodynastes dorsalis (pobblebonk frog),
occurring at 30 % of sites. Of the 74 frogs recorded, the most abundantly captured frog
was Helioperous eyrei (moaning frog) making up 42 % of total frog captures. Six species
of frog and reptile were captured at only one of the 40 sites (Crinia insignifera,
Pseudophryne guentheri, Brachyurophis semifasciata, Demansia psammophis reticulata,
Delma concinna concinna and Lerista lineopunctulata). For four of these species only one
individual was captured (C. insignifera, B. semifasciata, D. concinna concinna and L.
lineopunctulata). Eleven frog and reptile species were found exclusively in Bassendean
sands, while two species were found exclusively in Quindalup Dunes.

Mammal capture rates were fairly low with the introduced Mus musculus (house mouse)
occurring at 45 % of sites and the native Tarsipes rostratus (honey possum, noolbenger)
trapped at 30 % of sites. In addition, one Rattus fuscipes (bush rat, moodit) and three

Results                                                                                 25
You can also read