THE CRITICAL DECADE New South Wales climate impacts and opportunities - Climate Council
←
→
Page content transcription
If your browser does not render page correctly, please read the page content below

THE CRITICAL DECADE New South Wales climate impacts and opportunities
The Critical Decade: New South Wales climate impacts and opportunities

    Summary
    New South Wales (NSW) is home to over a third of             This is the critical decade for action. To minimise climate
    Australians and 31% of the national economy and is           change risks we must begin to decarbonise our economy
    highly vulnerable to climate change. Climate change          and move to cleaner energy sources this decade. The
    is increasing the risk of hot weather, heatwaves, and        longer we wait the more difficult and costly it will be.
    bushfires, and changing the patterns of drought and
    heavy rainfall. A changing climate is costly, putting        NSW is well-placed to capitalise on the global trend
    pressure on human health, agriculture, infrastructure        towards clean energy. Globally the clean energy
    and the natural environment.                                 sector attracted $263 billion worth of investment in
                                                                 2011 and is one of the fastest growing sectors in the
    NSW is becoming hotter and drier. Record-breaking            world. In Australia $5.3 billion was invested in clean
    hot days have more than doubled across Australia             energy in 2011. NSW, with a legacy of innovation and
    since 1960 and heatwaves in the greater Sydney region,       achievement in renewable energy development, has
    especially in the western suburbs, have increased in         significant opportunities.
    duration and intensity.

    Over the last 40 years much of eastern and southern
    Australia has become drier. The continuing drying trend
    increases the risk of longer and harsher droughts. While
    there will continue to be wet years, the future trend of
    declining rainfall poses challenges for Sydney’s long-term
    water security.

    This long-term increase in hot and dry weather has
    made NSW more susceptible to bushfires. Very high
    fire danger days have already become more frequent,
    and will occur even more often in the coming decades.        Professor Will Steffen 		      Professor Lesley Hughes
                                                                 Climate Commissioner			        Climate Commissioner
    Coastal infrastructure in NSW is vulnerable to flooding
    from sea-level rise. A 1.1m rise by the end of the century
    could put between 40,000–60,000 houses, 1200                 With thanks to the Science Advisory Panel.
    commercial buildings and 250km of highway in NSW
    at risk of inundation.

2   Climate Commission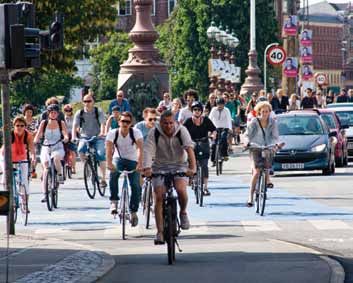
The Critical Decade: New South Wales climate impacts and opportunities (continued)

1. Temperature                                                 Sydney, up from 3 times as many in the 1970s. The
                                                               temperature of the hottest day recorded each year has
    – NSW is becoming hotter                                  increased across NSW over the past 40 years – in some
    – Heatwaves will become more severe and will likely       regions by up to 0.8°C, and warm weather spells (at least
       last longer                                             four consecutive warm days) have increased in duration
                                                               over much of the state.
    – Western Sydney is more vulnerable than coastal
       locations to extreme heatwaves
                                                               Average temperature across NSW is expected to increase
                                                               by 0.3–1.5°C by 2030 and by 1.0–5.0°C by 2070 compared to
Extremes of temperature have significant impacts, including
                                                               1990. The upper end of these ranges is projected for the far
illness and loss of life, and economic costs in transport,
                                                               north of the state only (CSIRO and BOM, 2007). With higher
agriculture, energy and infrastructure. Extreme high
                                                               average temperatures, there will be further increases in
temperatures can trigger costly interruptions to services
                                                               the number of hot days and heatwaves across the state.
such as electricity and trains; stress emergency
                                                               Currently in eastern Sydney, there are about 3 days
management services; increase hospital admissions for
                                                               above 35°C a year. By 2030 this is projected to increase
kidney disease, heart attack and other diseases; and drive
                                                               to 4–5 days per year, and to 9 days per year by 2070
decreases in agricultural production (Queensland University
                                                               (Figure 2; CSIRO and BOM, 2007). The corresponding
of Technology, 2010).
                                                               expected increases for the western suburbs would be
                                                               higher if the observed trends shown in Figure 3 continue.
A small increase in the average temperature has a big
impact on the number of extreme high temperatures
experienced. For example, the number of record hot days        Figure 2. Number of days over 35 degrees projected
across Australia has more than doubled since 1960              for Sydney.
(Figure 1), with an increase in average temperature of only
                                                                                        2008      2030      2070     2100
about 0.9°C across the country (CSIRO and BOM, 2007).
                                                                SYDNEY                   3.3          4.4      9       14
Over the period from 1970 to 2011, the number of hot days
(days over 35°C) in NSW has increased, in some areas by up     Source: Modified from CSIRO, cited in Garnaut, 2008
to 7.5 days per decade. Coastal Sydney has not shown a
significant trend, but for the western suburbs the number of
hot days has increased by 60% (see Figure 3), owing to
both the urban heat island effect (Box 1) and the underlying
temperature rise due to climate change. Currently,
Parramatta experiences 4 times as many hot days as

Figure 1. Average number of record-breaking hot temperatures each year across Australia. Yearly average
shown by red line and 10-year average shown by purple bars.

                       60

                       50
 Number in each year

                       40

                       30

                       20

                       10

                        1960    1970                1980                 1990                  2000                 2010

Source: BOM

                                                                                                                            3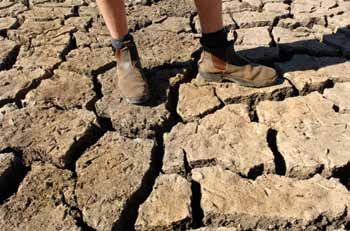
The Critical Decade: New South Wales climate impacts and opportunities

    Box 1. Western Sydney suffers from an urban                                          Analysis of temperature records over the last 40 years
    heat island effect                                                                   shows that Western Sydney has seen a rise in annual
                                                                                         temperatures above that experienced in coastal parts
    Urban Heat Island: noun.                                                             of the city. Residents of Blacktown, Richmond, Camden,
    An area, such as a city or industrial site, having                                   Liverpool and Parramatta have all experienced this
    consistently higher temperatures than surrounding                                    effect: the gap between coastal and Western Sydney
    areas because of a greater retention of heat, as by                                  temperatures has widened, and the number of extreme
    buildings, concrete, and asphalt.                                                    hot days has increased in the west (Figure 3).
                                                                                         Assuming no changes in the sea breeze in future, the
    Without the cooling sea breeze off the coast, Western                                current trends are very likely to continue as the average
    Sydney residents feel the full effect of heatwave conditions.                        temperature across the region increases further in the
                                                                                         coming decades.
    Urban centres are hotter than their rural surrounds
    because dark roofs, car parks, paved areas and bitumen                               Some people are more vulnerable than others to the
    roads absorb and keep heat in the area (Figure 4). Lack                              impacts of heat extremes. Children and people who are
    of shade and high density buildings trapping heat increase                           elderly, work in heat-exposed jobs or have low incomes
    the effect. This is intensified in areas like Western Sydney                         are at greater risk. The dangers can be aggrevated by
    that miss out on the relief brought by cooling sea breezes.                          infrastructure failures (see section 4 on health).

    Figure 3. Number of days over 35oC in Parramatta and Sydney, from 1970 to 2011.

                                                                                                                            Parramatta
                                                                                                                            Sydney
                                                                                                                            Linear trendline
                                 25
      Number of days over 35˚C

                                 20

                                 15

                                 10

                                  5

                                  0
                                  1968        1972         1977        1982       1987    1992        1997        2002        2007       2011

    Source: BOM, 2012b. Historical data obtained from Observatory Hill Station (Reference Climate Station, Sydney
    Cove) and North Masons Drive Station (Parramatta). Gaps are due to missing data points for those years.

    Figure 4. The urban heat island effect. The average annual air temperature in cities (more than one million
    people) may be 1 to 3°C hotter than surrounding areas.

      33˚C
                                      Late Afternoon Temperatures (˚C)
             TEMPERATURE

     30˚C

                                      RURAL          SUBURBAN     WAREHOUSE        CBD      URBAN       PARK         SUBURBAN        RURAL
                                                                  OR INDUSTRIAL             RESIDENTIAL

    Source: Modified from US EPA, 2008 and NASA, 1999

4   Climate Commission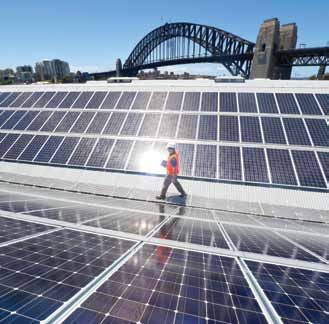
The Critical Decade: New South Wales climate impacts and opportunities (continued)

 Box 2. Heat records continue to be set                     During the November 2009 heatwave, temperatures
                                                            were 4.6°C above the average for that time of year; the
 2009 was the hottest year on record in NSW. Three          largest monthly variation ever recorded for an Australian
 extreme heat events occurred in that year: a heatwave      state. Many heat records were set, with 71% of NSW
 in late January/early February in southwest NSW,           setting maximum temperature records. For example, the
 extreme winter heat in August in northern NSW and          monthly maximum temperature average in Bathurst was
 an unusually extended and intense heatwave across          7.8°C above normal (National Climate Centre, 2009).
 all of NSW in November (Table 1; BOM, 2010).
                                                            As average temperatures rise with climate change, there
 The highest temperature recorded in NSW in 2009 was        is likely to be an increase in the number of hot and very
 at Menindee, at 46.8°C (National Climate Centre, 2009).    hot days, and in extreme heat events like those in 2009.
                                                            While there will continue to be hotter and colder years,
                                                            the overall trend is increasing temperatures.

  Table 1. A selection of temperature records broken in NSW during 2009: hottest temperature, hottest
  November temperature and length of hot periods.
  Location               Temperature             Previous record      Year of previous
                         (November)              (November)           record
  Sydney airport         27.2                    26.7                 1968
  Parramatta             28.6                    28.4                 2002
  Bankstown              28.6                    28.1                 1968
  Location               Temperature             Previous record      Year of previous record
  Dubbo                  43.4                    43.3                 1944
  Prospect reservoir     42                      41.6                 2002
  Bowral                 38                      37.1                 1997
  Location               Temperature             Number of days       Previous record         Year of previous
                         threshold               above threshold                              record
  Bathurst               30                      16                   15                      1982
  Dubbo                  35                      12                   11                      1922
  Wagga                  35                      11                   7                       1982
  Source: BOM, 2011

                                                                                                                        5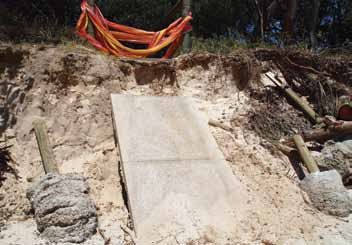
The Critical Decade: New South Wales climate impacts and opportunities

2. Bushfires
                                                                                                                                                                                   Figure 6. A 2009 fire at Morton National Park.
                   – Long-term increases in hot and dry weather
                      have made NSW more susceptible to bushfires
                   – ‘Very high’ fire danger days have become more
                      frequent and will become even more frequent
                      in future

Higher average temperatures also have significant
implications for extreme temperature-related events such
as bushfires. NSW has already experienced an increase
in extreme fire weather associated with the increased
frequency and intensity of extreme heat and drought since
the early 1970s (Clarke et al., 2011; Figure 6).

The conditions for large and intense fires – low humidity,
high winds and extreme high temperatures, which
contributed to the 1994 and 2001 Black Christmas fires
and the 2003 southeast NSW/Australian Capital Territory
fires – are likely to become more common by mid-century.
Climate projections suggest that the numbers of ‘very high’
fire danger days in southeast Australia could increase by
as much as 23% by 2020 and up to 70% by 2050
(Lucas et al., 2007).

Bushfires cause loss of property, livelihoods, biodiversity
and human lives (Box 3). The safety of fire-fighters is at                                                                                                                         Source: Dave Cunningham
risk, with sleep deprivation, heat, and carbon monoxide
exposure dangerous to health (Aisbett, 2012). There are                                                                                                                            Box 3. 2001/2002 NSW bushfire season
also costs associated with suppressing and preventing
fires – funding to the NSW Rural Fire Service has doubled                                                                                                                          From December 2001 to mid-January 2002, NSW
in the past 10 years in recognition of the increased threat                                                                                                                        experienced a fire season of considerable intensity.
(NSW Rural Fire Service, 2003; Figure 5).                                                                                                                                          Contributing factors were the very high temperatures
                                                                                                                                                                                   (up to 45°C), low humidity and very strong winds,
                                                                                                                                                                                   with 20 consecutive days without rain.
Figure 5. Funding to the Rural Fire Service from
1999/2000 to 2009/2010.                                                                                                                                                            There were 450 fires in total, concentrated in
                                                                                                                                                                                   bushland around Sydney. More than 29,000 personnel
                                         250                                                                                                                                       were involved in fighting the fires, including fire
    Millions of dollars in RFS funding

                                                                                                                                                                                   fighters called in from every state in Australia and
                                                                                                                                                                                   from New Zealand (NSW Rural Fire Service, 2002;
                                                                                                                                                                       2009/2010

                                         200
                                                                                                                                                           2008/2009
                                                                                                                                               2007/2008

                                                                                                                                                                                   Joint Select Committee on Bushfires, 2002).
                                                                                                                                   2006/2007

                                         150
                                                                                                                                                                                   The losses were significant: approximately
                                                                                                                       2005/2006
                                                                                                           2004/2005

                                                                                                                                                                                   754,000 hectares of land were burnt by fires, 7,000
                                                                                               2003/2004
                                                                                   2002/2003

                                         100
                                                                       2001/2002

                                                                                                                                                                                   head of livestock killed, and 109 homes destroyed
                                                           2000/2001

                                                                                                                                                                                   (Joint Select Committee on Bushfires, 2002).
                                               1999/2000

                                          50

                                          0

Source: NSW Rural Fire Service, 2010; 2006; 2002; 2000

6                              Climate Commission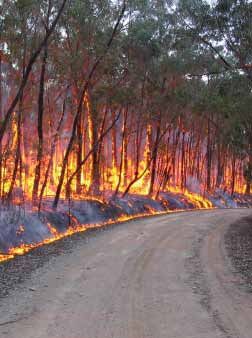
The Critical Decade: New South Wales climate impacts and opportunities (continued)

3. Rainfall and drought                                       Figure 8. Extended dry periods have risks for water
                                                              supplies and agriculture.
  – Rainfall patterns have changed across NSW over the
     past 40 years
  – The well-known climatic pattern of severe droughts
     and flooding rains will continue into the future,
     modified by longer-term trends in climate
  – Climate change cannot be ruled out as a factor in
     recent heavy rainfall events

Rainfall patterns are changing, bringing both risks and
opportunities. Despite difficulties in projecting long-term
trends, there are some large-scale patterns that are
becoming clearer. As summarised in the recent Climate
Commission report (2012) ‘The science behind Australia’s
wet, cool summer’:                                            Drought
    “The quintessential Australian climatic pattern
                                                              Most of NSW has experienced an overall drying trend over
      of severe droughts and flooding rains will continue
                                                              the past 40 years, with the trend more pronounced in the
      into the future. Across the south, heavy rainfall
                                                              southeast of the state (Figure 7).
      events will still occur, and high summer rainfall
      events will continue to be a feature of the climate.    The 1997–2009 dry period provides a recent example
      However, on average, the south of the continent         of the risks that extended dry periods bring for the water
      will likely be drier in the future compared with        supplies of Sydney and many other cities and towns
      the early to mid twentieth century, particularly        in NSW. The period was the driest 13-year period in
      in the cool months of the year.”                        southeast Australia in the last 110 years of climate
                                                              records (SEACI, 2010; Figure 8). Although 2010/2011 have
Figure 7. Trend in annual total rainfall (mm/10 years)        been wet years, water security is likely to be an on-going
for the 1970–2011 period.                                     issue of critical importance for NSW (Steffen et al. 2012).

                                                              The drought from 1997 to 2009 exposed the vulnerability
                                                              of Sydney’s urban water supplies to extended drought,
                                                              and led to permanent changes in the way water is supplied
                                                              and used in Sydney, the Illawarra, and the Blue Mountains.
                                                              From October 2003, increasingly severe water restrictions
                                                              were introduced as dam levels dropped below 40% (Sydney
                                                              Water, 2012). In 2009, the NSW Government introduced
                                                              new, permanent water efficiency rules in recognition of
                                                              Sydney’s highly variable climate and growing population
                                                              (NSW OW, 2012a).

Source: Bureau of Meteorology

                                                                                                                            7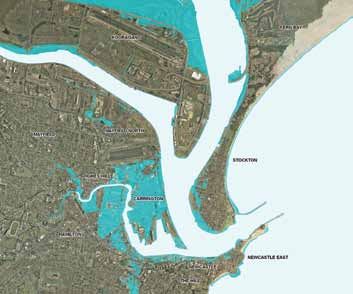
The Critical Decade: New South Wales climate impacts and opportunities

The impact of the drought was felt acutely in Goulburn,          Figure 9. Floods can cause major damage to
where dam levels fell to 12% during 2007. Serious                important infrastructure, such as roads and bridges.
consideration was given to the expensive option of trucking
in water (Goulburn Mulwaree Council, 2012). After the
drought ended, Goulburn also introduced permanent water
saving rules, as well as guaranteeing its water supply by
building an emergency pipeline to connect to Sydney’s
water supply (Goulburn Mulwaree Council, 2012).

Agriculture is also affected by changes in water availability.
For example, without effective global action to reduce
emissions, irrigated agriculture in the Murray-Darling Basin
could decline about 50% by 2050 (Garnaut, 2008). However,
many Australian farmers have shown considerable adaptive
capacity in dealing with present-day climate variability and
                                                                 Source: Jo Caldwell
with the observed trends over the past 40 years – changing
what they plant and when they plant, and changing the            The start of 2012 saw widespread heavy rainfall across
ways they manage livestock. These skills will be tested in       the state. Several regions experienced record high daily
future as patterns of drought and rainfall continue to shift     rainfalls and more than 75% of the state was affected by
in ways that are difficult to predict.                           flood warnings (BOM, 2012c). Natural disaster zones were
                                                                 declared in 87 regions (NSW Farmers, 2012) and over ten
Rainfall
                                                                 thousand people were evacuated from their homes.
As well as a decline in annual rainfall across nearly all
                                                                 As well as the humanitarian concerns of people being
of NSW over the past 40 years, the number of wet days
                                                                 cut off from health services and from fresh food and water,
per year has declined across the state. However, as for
                                                                 there were economic costs for urban areas and farmers.
temperature, the changes in rainfall are most acutely felt
                                                                 For example, tens of thousands of head of sheep and cattle
in the extremes – the flooding rains that punctuate the
                                                                 were moved out of floodwaters to higher ground and
extended dry periods.
                                                                 helicopters were used to drop fodder to stranded animals.
The 2010–2011 La Niña period set records across                  Thousands of head of livestock were lost and surviving
Australia for the amount of rainfall received. Heavy rainfall    animals that have been exposed to floodwater may suffer
contributes to flooding events. Floods over the past two         poor health as a result (Walker, 2010).
years have affected most of the state, with many regions
                                                                 In the Griffith, Hillston, Deniliquin and Finley areas,
experiencing damage and disruption, including road
                                                                 dairies, vineyards, and summer crops such as rice,
closures, power outages and evacuations (Figure 9).
                                                                 sorghum and maize were inundated. Waterlogged plants
With the projection that, on average, the intensity of
                                                                 were rapidly damaged and were exposed to a range of toxins
precipitation events is expected to increase with a hotter
                                                                 and pollutants from runoff. Waterlogged conditions
climate (IPCC, 2007), the risk of damage and disruption
                                                                 encourage the spread
is likely to increase in the future, which emphasises the
                                                                 of plant diseases, and soil quality may be affected for a long
need for effective preparation measures.
                                                                 time after the water is gone, affecting future crops (DPI, 2012).

8   Climate Commission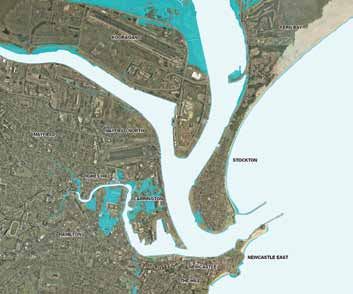
The Critical Decade: New South Wales climate impacts and opportunities (continued)

The Commission’s recent report (2012) ‘The science behind        4. Human health
Australia’s wet, cool summer’ discussed the possible link
between the heavy rainfall of 2010–2011 and climate change:        – More extreme heatwaves increase the risk of heat
                                                                      related deaths and hospital admissions
    “Climate change cannot be ruled out as a factor
      in recent heavy rainfall events. The Sea Surface             – Respiratory disorders will worsen as air quality
      Temperatures (SSTs) around northern Australia                   deteriorates
      during the spring and early summer of 2010–2011              – More extreme weather events create higher risks
      were the highest on record. This has very likely                of loss of life, illness and mental ill-health
      contributed to the exceptionally heavy rainfall
      over much of Australia in the last two years.              Adverse impacts on health that can be attributed to
      La Niña events bring high SSTs to the seas around          climate change have already been observed globally and
      northern Australia, but warming over the past century      in Australia. These include illness or death related to heat,
      has also contributed to the recent record high SSTs.”      air pollution, water and vector-borne diseases, and mental
                                                                 health problems (Kjellstrom and Weaver, 2009).
A future climate with potentially more frequent and intense
rainfall events will have significant effects on our cities,
roads and infrastructure. The effects we have seen of
intense rainfall events are instructive in planning for future
risks (Box 4).

  Box 4. Single storm event causes major disruption in Sydney

  Extreme rainfall events can cause damage and                   The economic costs include damage to infrastructure,
  disruption in exceptionally short periods of time.             public and private buildings, people’s homes and assets,
                                                                 lost productivity due to people missing work, and loss
  On 8 March 2012, Sydney experienced the wettest                of business. Early estimates of the damages alone are
  March day in over 25 years. A single major storm               in excess of half a billion dollars for this single day
  event caused severe flash flooding, with nearly 110mm          (Gay, 2012).
  measured at Observatory Hill over the course of
  the day, of which over 40mm fell between 7:30 and
  8:30am – right in the middle of the morning traffic            Figure 10. Extreme rainfall in Sydney on 8 March
  peak (BOM, 2012d).                                             2012 affected roads, public transport, power and
                                                                 had significant costs.
  The flooding caused many road closures and traffic
  chaos. There were more than a thousand road incidents,
  and travel delays of 2½ to 3 hours were experienced.

  Public transport was severely affected; some rail lines
  and train stations were closed due to flooding and
  delays occurred on seven of the 16 rail lines (SMH, 2012).
  Bus routes were affected by road closures, ferries were
  cancelled, and there were flight delays and diversions
  (SBS, 2012; Figure 10).

  Power was lost to 2000 homes and businesses, and
  many people were evacuated from their homes.
  The State Emergency Service conducted 19 flood
  rescues (SBS, 2012).
                                                                 Source: Fairfax Syndication

                                                                                                                                 9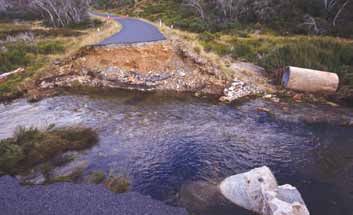
The Critical Decade: New South Wales climate impacts and opportunities

Periods of extreme hot weather can lead to an increase in        Changes in climate- and weather-related extreme events
mortality, especially in the elderly (Kjellstrom and Weaver,     and natural disasters can increase stress and influence
2009). A study of emergency hospital admissions in five          mental health, as described in the recent Climate Commission
regions in NSW – Sydney East and West, Illawarra,                report (2011), ‘The Critical Decade: Climate change and
Gosford-Wyong and Newcastle – showed that on extremely           health’:
hot days there was an increase in heat related injuries such
                                                                     “…the results of one study in New South Wales found
as dehydration. Those with existing conditions such as
                                                                       that a decrease in annual rainfall by about 300mm
cardiac and respiratory diseases, and mental health
                                                                       would lead to increase in the suicide rate by about 8%
problems, are more susceptible to heat-related injury and
                                                                       of the long-term average suicide rate (Nicholls et al.,
death (Khalaj et al., 2010). Workers at risk from exposure
                                                                       2006). …In metropolitan South Australia, admissions
to extreme heat include those who work outdoors, such as
                                                                       for mental, behavioural and cognitive disorders have
construction workers and builders; maintenance workers;
                                                                       been found to increase by around 7% during heatwaves
farmers and emergency and essential service providers
                                                                       (Hansen et al., 2008a; Nitschke et al., 2007).”
(Hanna et al., 2011).
                                                                 Increased frequency and intensity of extreme events such
Climate change is likely to lead to increases in certain
                                                                 as storms and floods will also have significant flow-on
types of air pollutants as well as air-borne allergens like
                                                                 health impacts. Extended electricity outages can cause
pollen and mould spores (Hughes and McMichael, 2011).
                                                                 food to spoil due to improper refrigeration, or be
These have serious effects on people who suffer from
                                                                 contaminated due to inadequate cooking, leading to illness
respiratory illnesses, such as asthma, hay fever and lung
                                                                 (Kjellstrom and Weaver, 2009). Water and sewerage
cancer as well as affecting those suffering from other
                                                                 infrastructure can be damaged, potentially increasing risks
conditions such as heart disease. The current health cost
                                                                 to water quality (Box 5; DECCW, 2010a).
of Sydney’s air pollution is estimated to be $1 billion to
$8.4 billion each year (Spickett et al., 2011). A study of the   Droughts can also cause water quality problems; less water
Sydney region by CSIRO showed that higher ozone levels           in dams increases pollutant concentrations, and higher
(which contribute to smog) associated with an increase in        water temperatures encourage growth of toxic blue-green
hot days, could result in a 40% increase in hospital             algae (Kjellstrom and Weaver, 2009). Increasing algal
admissions over the years 2020–2030, and a 200% increase         blooms due to prolonged drought pose a risk to water
over the years 2050–2060 (Cope, 2008).                           quality in the Sydney catchment areas (NSW OW, 2010).

10 Climate Commission
The Critical Decade: New South Wales climate impacts and opportunities (continued)
5. Sea-level rise
Figure 11. Many residents in the Hunter region
were evacuated during severe storms and – 85% of Australians live near the coast and nearly
flooding, including health care patients. all our major cities are on the coast, making Australia
highly vulnerable to sea-level rise
– Coastal flooding will increase as the sea level rises
– Coastal infrastructure in NSW is vulnerable to
rising sea levels
– Many NSW beaches are under threat from increased
erosion
The densely populated coastal areas of NSW face
significant risks from sea-level rise – to property,
infrastructure and beaches. There are three ways that
buildings and infrastructure are at risk from sea level rise:
1. Storm-related flooding that causes inundation events
2. M
ore regular flooding from higher sea levels associated
with high tides
3. Erosion of the land on which buildings and infrastructure
are built.
Storm surge flooding
Source: Fairfax Syndication
The impacts of sea-level rise are felt most acutely during
Box 5. 2007 Hunter region storms and the impact severe storm events. When combined with a storm surge and
on health high tide, even small rises in sea level can result in very large
increases in the frequency of coastal flooding (ACE CRC, 2008;
Church et al., 2006). Around Sydney, flooding that is currently
In 2007, storms and associated floods in the Hunter
considered a 1-in-100 year event could occur every few months
region caused 10 deaths and 6,000 evacuations
with a sea-level rise of 0.5m (Figure 12).
(Figure 11). Flooding and power outages affected
105,000 homes, 207 drinking water supplies, 2,600 Figure 12. Estimated increase in the frequency
septic tanks and 1,200 food premises. The public of high sea-level events caused by a sea-level rise
health risk associated with water quality and quantity of 50cm.
prompted daily health briefings for four weeks after
the storm, and residents were urged to boil all water
Darwin
before consumption (Cretikos et al., 2007).
As well as an increase in hospital admissions due to
storm-related injuries and illnesses, electricity outages
and flooding also directly affected the health system.
Twenty-nine people were admitted to New England
Brisbane
hospitals because their oxygen, dialysis, intravenous
and other therapies were interrupted by power outage. Sydney
Three health care facilities had to relocate patients Fremantle
due to power outages and flooding and 12 hospitals
and 50 private nursing homes had to rely on on-site Adelaide
electricity generation. Over 10,000 vaccine doses had Melbourne
to be replaced in general practices due to refrigeration
failure (Cretikos et al., 2007). 10000 x 1000 x 100 x
Hobart
Source: ACE CRC 2008
11The Critical Decade: New South Wales climate impacts and opportunities
More regular flooding Figure 14. Erosion of coastal walkway at Scotts Head,
NSW.
Average global sea levels have risen by about 20cm since
the late 1800s. For NSW (including Sydney) sea levels along
the southern coast have risen slightly more than the global
average, while for the northern coasts the rise has been about
the global average or slightly less (CSIRO and BOM, 2012).
Global average sea level is projected to rise by up to 80cm
by 2100 compared to 1990 levels (IPCC, 2007). Larger rises
cannot be ruled out due to uncertainties about how fast
ice-sheets can melt or disintegrate. Observed sea-level rise
is currently tracking close to the worst case scenario, the
upper limit of climate model projections. This suggests that
a global sea level rise by 2100 of about 0.5m is likely and
that a rise of 1.0m is a significant risk.
Source: Hannah Angus
A 1.1m rise in sea level (modelled by the Australian
Government to assess the highest likely risk) could put With a sea-level rise of 1.1m:
between 40,000–60,000 houses in NSW – the highest of
– Up to 1,200 commercial buildings and over 250km of
any state in Australia – with a value of up to $18.7 billion,
highway may be at risk
at risk of flooding towards the end of this century
(Figure 13 and 15; DCC, 2009). Up to 20% of all houses – Parts of Sydney airport, the busiest in Australia, would be
in the Rockdale, Great Lakes and Shellharbour local flooded with a storm surge, interrupting operations and
government areas could be at risk under this scenario. damaging infrastructure
– Over 170km of railway would be at risk, with a
replacement value of up to $1.3 billion. Wollongong and
Figure 13. Number of residential buildings at risk
Newcastle have the longest lengths of railway of NSW
in NSW local councils (lowest estimate), from a
cities at risk from a 1.1m sea-level rise – 43–51 km and
sea-level rise of 1.1m.
49–56 km respectively (DCCEE, 2011).
8000 Erosion
Number of residential buildings
7000
Higher sea levels can contribute to the erosion of
6000 beaches, and the retreat of soft coastlines further inland.
Coastal erosion can result in the loss of iconic beaches;
5000
it can also undermine buildings, such as surf clubs and
4000 houses, and infrastructure, such as roads and railways
(Box 6; Figure 14). Approximately 3,600 residential
3000
buildings in NSW are located within 110 metres of soft
2000 shorelines. The local government areas of Sutherland
and Port Stephens have the highest number of properties
1000
at risk in NSW (DCC, 2009).
0
Lake Macquarie
Rockdale
Great Lakes
Sutherland Shire
Port Stephens
Newcastle
Greater Taree
Port Macquarie-Hastings
Wyong
Gosford
Wollongong
Tweed
Shoalhaven
Shellharbour
Eurobodalla
Pittwater
Canada Bay
Clarence Valley
Source: DCC 2009
12 Climate CommissionThe Critical Decade: New South Wales climate impacts and opportunities (continued)
Figure 15. Images of Newcastle with simulated coastal flooding from a sea level rise of 0.5m and 1.1m.
0.5m 1.1m
Source: Ozcoasts (www.ozcoasts.gov.au)
Box 6. Lake Cathie, NSW management options: sea walls, groynes, pumping
sand (beach nourishment) and planned retreat. Each
Coastal erosion in Lake Cathie, near Port Macquarie, of these options has different financial, environmental
has occurred at an average of 0.2m each year since and social costs and benefits (Port Macquarie-Hastings
1940 (Adamantidis, 2008; Figure 16). This small Council, 2012).
increase has already affected residents and
infrastructure: beach access and storm water outlets Figure 16. Commissioners Will Steffen, Lesley
have been destroyed, 330m of road is threatened, Hughes and Roger Beale visited Lake Cathie
14 private residences are at risk of losing their access with the Port Macquarie-Hastings council in 2011.
and recreational qualities of the beach have been
affected (Adamantidis, 2008).
These impacts are likely to be exacerbated by rising
sea levels, with a conservative estimate of erosion
continuing at 0.2m each year. Studies have estimated
that loss of beach recreational qualities is worth
$13.5 million; by 2050, 16 houses could be in the
erosion zone, and further houses and roads could
have unstable foundations (Adamantidis, 2008).
In NSW, local councils are responsible for managing
coastal hazards, such as erosion. The Port Macquarie-
Hastings Council has undertaken studies to better
understand the risks, and have identified four potential
13The Critical Decade: New South Wales climate impacts and opportunities
6. Plants and animals Figure 18. Cattle near Wagga during drought in 2006.
– Heat and extreme weather events threaten the
breeding and regeneration cycles of plants and animals
– Extreme heat and extended dry periods put crops and
livestock at risk, threatening a billion dollar industry
– Many invasive plants and pests such as cattle tick
and cane toads are likely to flourish in a hotter climate
– Native animals such as the koala and the mountain
pygmy possum are already suffering from climate change
Healthy biodiversity has many benefits, such as absorbing Source: Flickr/John Schilling
pollution and protecting soils that support water supply and mature and produce seed. The 2003 bushfires burnt half of
agriculture, and supporting an extensive tourism industry. all the alpine ash forests in NSW and regeneration following
the fires has been very poor. The combination of more
Animals and plants provide an early indication of a
frequent fires and hotter weather threaten the future of
changing climate; many species in NSW are already
these forests (DECCW, 2010a).
responding to higher temperatures. Many birds and
insects are now found at more southerly locations or at Hotter temperatures and reduced precipitation threaten
higher elevations because they have migrated towards alpine regions and the biodiversity they support (Box 7).
cooler habitats. Aspects of animal and plant life cycles, Spring snow depth at Spencers Creek in the Snowy
such as migrations and flowering, are also changing in Mountains has decreased by 40% since the 1960s (CSIRO
response to a hotter climate (Hughes, 2003; Beaumont et al., and BOM, 2007). Snow is melting sooner, leading to
2006; OEH, 2010). For example, bold-striped cool-skinks in decreases in sensitive plants that live in the alpine
southeast Australia have changed the depth of their nests, environment (Figure 17; OEH, 2011).
and when they lay their eggs. More skinks are also being
born female as nest temperature affects the sex of their Agriculture is an important part of the NSW economy,
offspring (Telemeco, 2009). contributing around $8.4 billion in 2009–10 (ABS, 2011a).
In 2010–11, livestock contributed $3.1 billion to the NSW
Bushfires are expected to become more frequent and more economy, and livestock products around $1.6 billion (ABS,
intense in response to a hotter climate, affecting the ability 2011b). Increasing length of dry periods, more hot days and
of species and ecosystems to bounce back from fire changes in rainfall pose significant risks to agricultural
damage. For example, alpine ash, one of the iconic plant productivity. For example, grazing animals, particularly
species of NSW, needs six weeks of seed-chilling to cattle, are likely to suffer heat stress more frequently.
germinate, and approximately 20 years for young trees to Animals with heat stress have a reduced appetite and
Figure 17. Snow melt at Mount Kosciuszko, where are less likely to breed, leading to losses in productivity
higher temperatures affect snow depth. (Figure 18; DPI, 2012).
A changing climate may be favourable for many introduced
pest species, with significant impacts for both ecosystems
and agriculture (see Box 8). For example, higher temperatures
may allow the cattle tick (Boophilus microplus) – the most
significant parasite affecting cattle in Australia – to move
further south into northern NSW (IPCC, 2007). The tick is
estimated to cost $146 million in lost productivity each year,
by reducing cattle productivity and spreading tick fever that
can sicken and kill non-immune cattle (MLA, 2012; IPCC
2007). Several million dollars is currently spent each year
in an effort to control the tick spreading further south;
however, these efforts might become economically
Source: Mel Schroeder unsustainable with both developing tick immunity to
poisons and an overall increase in cattle tick numbers
14 Climate Commission (IPCC, 2007).The Critical Decade: New South Wales climate impacts and opportunities (continued)
Box 7. Highly vulnerable mountain Figure 20. Density of cane toads in 2004 and
pygmy-possum projected for 2050, without global action to reduce
greenhouse gas emissions.
The endangered mountain pygmy-possum
(Burramys parvus) is restricted to elevations above 2004 2050
the winter snowline. It is a highly vulnerable species,
already at risk from feral cats and foxes as well as
habitat destruction (Figure 19; DECCW, 2010b).
The pygmy-possum shelters from temperature
extremes and predators under snow. Reductions in
snow, coupled with high summer temperatures, Density
may subject the species to considerable stress. 0
The pygmy-possum population has already declined, 1
resulting from a reduction in snow cover, droughts 2
affecting food supply, loss of habitat from fire 3
and increased predation from feral cats and foxes
(DCCEE, 2009). Source: Caley et al., 2011
Box 8. Climate more favourable for cane toads
The pygmy-possum relies on seasonal food supplies,
such as the bogong moths. Hotter temperatures Climate change is likely to be beneficial for the cane
may wake the pygmy-possum from hibernation before toad. The cane toad’s distribution is predicted to
the migrating bogong moths appear. Over the past increase fourfold, as higher temperatures create a
30 years the spring thaw has arrived progressively more favourable climate, mainly in coastal areas
earlier, but the arrival of the moth has not. In 2006, (Figure 20; Caley et al., 2011).
the spring thaw arrived at the earliest time ever
recorded, while the moths arrived later than ever Cane toads are a serious threat to Australia’s
recorded. This mismatch in timing, increasing with biodiversity (Figure 21). They are highly toxic, killing
climate change, affects not only the possum but native predators; they breed faster and grow more
many migratory birds, insects and flowering plants rapidly than native frogs and toads; they are very hardy
(DCCEE, 2009). and can tolerate a broad range of environmental and
climatic conditions, potentially crowding out native
Figure 19. This pygmy possum, highly vulnerable species; and they eat about 200 prey per night,
to climate change, hid in a fire-fighter’s pocket. including native frogs (DSEWPC, 2010). The wallum
froglet (Crinia tinnula), which is found in lowland
coastal habitats of northeast NSW, is vulnerable
to predation by cane toads and is threatened by
expansion of the cane toad’s habitat (Queensland
Government, 2012; Caley et al., 2011).
Figure 21. Cane toads are a serious threat to
Australia’s biodiversity, and may benefit from
climate change.
Source: Therese Cobcroft Source: Flickr/!p4ul
15The Critical Decade: New South Wales climate impacts and opportunities
7. Opportunities
Climate change is already affecting koalas, particularly
in NSW and western Queensland where they are – Renewable energy is a booming industry globally,
listed as threatened (NRMMC, 2009; Figure 22). with $5.1 billion invested nationally during 2010–11
Koalas and other plant-eating animals are affected
– Companies are saving millions of dollars by moving
by the nutritional quality of their plant food. High levels
to renewable energy sources and by implementing
of carbon dioxide reduce the quality of their food by
energy efficiency measures
decreasing the protein content and digestibility of
plants, making them less nutritious (DeGabriel et al.
2010).Koalas and other species are also likely to be Globally, the clean energy sector – mainly renewable
affected by long periods of very high temperatures, energy, but also efficiency and low carbon technologies
which may lead to dehydration and heat stress. – attracted US$263 billion worth of global investment in
2011 (PEW, 2012). Excluding research and development
Any increased frequency or intensity of droughts spending, global investment in the sector is now over 600%
and bushfires may also reduce koala habitat, and lead higher than in 2004 (PEW, 2012). In Australia, more than
to a contraction in koala distribution. Climate change $5.2 billion was invested in clean energy during 2010–11,
is also likely to exacerbate existing stresses such an increase of 11% on the previous year. Around $4 billion
as habitat loss and fragmentation, and increase was invested in household solar power alone (PEW, 2012;
the risks of disease, dog attacks and vehicle strike, Morris and Johnston, 2011).
as koalas are forced to move further afield in search
By 2020, it has been estimated that $43 billion will be
of food (NRMMC, 2009).
invested in clean energy in Australia, including $20 billion
in solar (Morris and Johnston, 2011). Even if solar panels
Figure 22. Climate change presents many risks are imported from overseas, around 30–40% of panel
for Koalas. installation costs will go to local installers, creating jobs in
installation, sales, marketing and metering (UNSW, 2010).
NSW has the largest state economy in Australia (DTI, 2012),
with around 32% of Australia’s light manufacturing,
electronic equipment, heating, ventilation and air-conditioning
manufacturing businesses. The state is therefore well
placed to take advantage of increased demand for more
energy-efficient products (DSRD, 2008). NSW is also home
to about 35% of Australia’s professional, scientific and
technical services industry employees, so growth in this
sector would be to its advantage (DSRD, 2008).
Renewable energy
Around 6% of NSW energy generation is from renewable
sources and the NSW Government has a target of 20%
renewable energy by 2020 (DTI2012a; DTI, 2012b).
Wind speeds in several parts of NSW are very good for
wind power (Box 9), and are similar to northern Europe,
which has much of the world’s installed wind power (DTI,
2012c).
South Australia, with the second highest wind energy
penetration in the world after Denmark, has demonstrated
the potential for renewable energy in Australia. South
Source: Flickr/SunriseOn7 Australia is producing 53% of the nation’s wind energy
(Figure 23; CEC, 2012).
16 Climate CommissionThe Critical Decade: New South Wales climate impacts and opportunities (continued)
Many individuals and businesses are taking advantage of
renewable energy (Box 10). NSW has the largest number Box 9. The Capital wind farm
of installed solar panels of any state (Morris and Johnston,
2011). Major projects under construction included 92 The Capital wind farm, located near Bungendore,
megawatt (MW) wind farm at Crookwell and 48 MW wind NSW, is the largest wind farm currently operating in
farm at Woodlawn, and 1.1 MW landfill gas plants at the state (Figure 24; DECCW, 2010b), with 67 wind
Woodlawn and Buttonderry (CEC, 2012). turbines and a total capacity of 140MW. The project
provides rental income for landowners and local
employment opportunities; employing 120 people
Figure 23. Installed capacity of key renewable during construction and 10 people on an ongoing basis.
energy technologies (in megawatts).
The wind farm generates about 450,000 MWh per
year, which is enough to power around 60,000 homes.
1400
The renewable energy generated by the wind farm
Solar thermal
Solar PV represents a saving of around 400,000 tonnes of
Bioenergy greenhouse gases each year, which is equivalent to
Wind the emissions of about 85,000 cars each year (Infigen
1200
Energy, n.d.).
Figure 24. Capital wind farm is the largest
currently operating in NSW.
1000
800
600
400
200
Source: Tim Lewer
0
NSW VIC QLD SA WA TAS ACT NT
Source: CEC (2011)
Note: This graph does not include hydro power.
17The Critical Decade: New South Wales climate impacts and opportunities
Box 10. Sydney Theatre Company The company has also factored public education into
its plan, with touch screen kiosks throughout the
Through solar power, water conservation, waste theatre which explain the works undertaken and the
management and education, the Sydney Theatre impact on sustainability.
Company is providing a best practice example of how
businesses can adapt a sustainability model that will The ‘Greening the Wharf’ program, which received
also save money. significant funding from corporate and government
partners, earned a Banksia Award in 2011 for ‘Leading
The roof of the theatre houses the second largest in Sustainability’.
photovoltaic solar array in the country, with almost
2,000 solar panels (Figure 25). The panels provide Figure 25. Sydney Theatre Company solar panels
70% of the theatre’s energy requirements. In addition provide 70% of their energy needs.
to the panels, theatre lights have been replaced with
energy efficient bulbs, air conditioning and box office
lights put on timers, gas-boosted solar hot water
installed and additional windows fitted to bring in more
natural light. Energy consumption has been reduced
by 60%, saving the company money as energy prices
increase, and has reduced carbon emissions by 550
tonnes per year (Sydney Theatre Company, 2012a).
The company overhauled its waste practices so that
over the past two years, no waste has been sent to
landfill. For example, all sets, props and costumes are
reused if possible, reducing landfill waste as well as
cutting costs and reducing the amount of timber
purchased for set construction by 58% in 2011. All waste
that cannot be recycled is sent to a bio-reactor for energy
recovery (Sydney Theatre Company, 2012b).
Source: Sydney Theatre Company
18 Climate CommissionThe Critical Decade: New South Wales climate impacts and opportunities (continued)
Research and development
Box 11. NSW research and development
– NSW is home to some of Australia’s leading
Recent Eureka prize winners – for leading science
researchers in renewable energy
developments – include:
– NSW residents have lead the country in solar uptake
– Dr Vanessa Peterson (Bragg Institute, Australian
Nuclear Science and Technology Organisation, NSW),
Some of the world’s leading clean technology research
People’s Choice Finalist 2011, for researching ways
and development happens in NSW, placing the state in a
to store hydrogen for fuel cells and pave the way for
position to take advantage of growth in clean technology
a clean-fuelled future
markets worldwide (Box 11). The CEO of Suntech, the
world’s largest solar company, was previously a researcher – Professor Manfred Lenzen, Dr Christopher Dey &
with the University of NSW (UNSW) School of Photovoltaic Dr Joy Murray (University of Sydney), Innovative
and Renewable Energy Engineering (Figure 26). Four of Solutions To Climate Change Winner 2011, for
the top six global manufacturers in solar photovoltaic developing tools to accurately identify which economic
technology have been students or researchers at UNSW, decisions are contributing most to environmental
including JA Solar, Trina Solar and Yingli Green Energy pressures, particularly climate change
Holding (UNSW, 2012). – Scientia Professor Martin Green (UNSW), Winner of
Leadership in Science 2010, for leading the field in
Australian ocean waves have enough energy to power
solar cell research
the nation many times over, and world leading wave-energy
researchers and developers are located in NSW. Oceanlinx, – Professor Stuart Wenham (UNSW), Finalist of
one of Australia’s wave energy developers, is based in Leadership in Science 2009, for development of solar cell
Sydney and has partnered with the University of technology.
Wollongong in wave energy demonstration projects
(University of Wollongong, 2012). The University of
Consumers around the world have become more conscious
Wollongong hosts well-equipped laboratories and
of energy prices, creating a wealth of opportunities for
workshops researching wave energy technologies.
technical innovation and new business. The development
and manufacture of new technologies requires capital and
Figure 26. Shi Zhengrong, CEO of Suntech at the
labour, and regions supporting new technologies are likely
‘sustainability champions’ session of the World
to attract higher amounts of investment and jobs (PEW,
Economic Forum, 2012.
2012). In NSW, take-up of solar in residential and medium
scale businesses significantly increased in 2009 and 2010,
creating new businesses, new jobs, reduced consumer bills,
reduced network demand and greenhouse gas savings
(Morris and Johnston, 2011). Early 2011 data shows a slight
decline, as some programs, such as the NSW Solar Bonus
Scheme, have now closed (Morris and Johnston, 2011).
Source: Flickr/World Economic Forum
19The Critical Decade: New South Wales climate impacts and opportunities
Sustainable Cities
With the higher population density, buildings and
– NSW is home to three of Australia’s largest cities; infrastructure of cities come many opportunities for
Sydney, Newcastle and Wollongong taking advantage of clean energy technologies. Options
– Traffic gridlock is a significant contributor to for cities include: local energy generation (see Box 12),
greenhouse gas emissions fast transit systems (see Box 13), higher population
– Better public transport would cut down on commute density along transit systems, walking and cycling areas
times and carbon pollution in and between centres, phasing out freeways, phasing
in congestion taxes and traffic-calming measures,
improvement on car emissions and moving to electric
Cities consume over two thirds of the world’s energy and vehicles (Figure 27; Newman et al., 2009).
account for 70% of greenhouse gas emissions (C40 Cities,
2011). Cities are growing and are vulnerable to the impacts Businesses are embracing energy saving measures in
of climate change. retrofits and new buildings. The new 161 Castlereagh Street
building incorporates two 450 kilowatt tri-generation plants,
Sydney’s population is currently 4.5 million and is forecast which provide electricity, as well as heating and cooling for
to increase to 5 million people by 2020 and to 6 million air conditioning and hot water systems. The building also
by 2036 (RDA, 2011). Sydney is home to 63% of the NSW has a high-performance thermally shielded glass exterior,
population, and is growing at the fastest rate of any area which lets in light and acts as insulation. Environmentally
in NSW (1.7% each year) (ABS, 2011c). In addition to Sydney, friendly concrete was used during construction and effort
Newcastle and Wollongong are in Australia’s top ten most was taken to reduce the amount of reinforcing steel needed
populous cities. (GBCA, 2011).
The underlying factors that influence emissions in cities Recycling of waste products can have energy-savings and
include: inefficient building heating, cooling, lighting and prevent materials going to waste (where they can break
refrigeration; landfills releasing methane; inefficient outdoor down, producing greenhouse gas emissions). For example,
lighting; high car use; heavy traffic congestion and Dunlop Flooring now manufactures a 90% recycled carpet
inefficient water systems (C40 Cities, 2011). underlay and has introduced a program to buy old underlay
Figure 27. Technologies and solutions for transport already exist, and many countries around the world are
taking advantage of the benefits. Electric car recharge points in the Netherlands and a cycleway in Copenhagen,
Denmark, are shown below.
Source: Flickr/Maarten Takens and Flickr/Mikael Colville-Anderson
20 Climate CommissionThe Critical Decade: New South Wales climate impacts and opportunities (continued)
from carpet retailers (Dunlop Flooring, 2012). Recycling of For example:
metals such as aluminium and steel – both manufactured
– The Wrigley Company – maker of sweets such as
in NSW – can have significant energy and cost savings.
Starburst – has installed solar and wind power, cut energy
Recycling aluminium uses only 5% of the energy taken to
use by 10% and diverted 100% of waste from landfill
manufacture new aluminium, and on average emits only 5%
as much greenhouse gases (Australian Aluminium Council, – Taronga Zoo has identified water pumping, lighting and
2010). Alcoa, a large aluminium recycler in Australia, other opportunities to save $84,700 a year, and 523 MWh
recycles around 55,000 tonnes each year in Yennora, NSW. – SD Smash and Mechanical Repairs in Auburn now saves
Recycling one aluminium can saves enough energy to run a $1,511 a year after installing new lighting (OEH, 2012).
television for three hours (Alcoa, 2012).
Improving energy efficiency has already reduced costs Moving to energy savings, clean energy and better transport
for business around NSW, with state energy audits and planning has many benefits in addition to reducing
identifying average annual electricity savings of 28%, greenhouse gas emissions, such as reducing negative
and average cost savings of 31% (OEH, 2012). impacts on human health, and creating jobs and better
places to live and work (Mandag Morgen, 2011).
Box 12. City of Sydney 2030
It could also save NSW electricity consumers up
to $1.5 billion in grid upgrades and new power
The City of Sydney has committed to reduce its
stations by 2020 (Dunstan and Langham, 2010).
emissions 70% by 2030 (City of Sydney, 2011). As part
of this commitment, Sydney has been the first of
The tri-generation plan is supported by both small and
Australia’s capital cities to start work on a decentralised
large business initiatives, such as the Better Buildings
energy generation network, or tri-generation network,
Partnership which works with large commercial
which will eventually produce 70% of its energy needs
building managers to cut carbon emissions and save
(City of Sydney, 2012a).
energy, water and waste. Founding members include
Colonial First State, The GPT Group, Investa Property
Sydney’s tri-generation network will use small local
Group, Lend Lease, Mirvac and Stockland.
generators powered by natural or waste gases to
produce and supply low-carbon electricity, heating
Figure 28. A trigeneration plant operating
and air-conditioning to networks of buildings in the
in an Investa-managed Sydney building.
Sydney CBD (Figure 28). The technique is more than
twice as efficient as coal-fired power generation
because it uses heat that would otherwise be wasted
during electricity generation, to both heat and cool
buildings (City of Sydney, 2012b).
Sydney currently gets 80% of its electricity from
coal-fired power stations, with two thirds of the
energy used to generate this electricity wasted as
heat or in transmission losses (City of Sydney, 2012b).
Tri-generation can reduce greenhouse gas pollution
by 40–60 per cent compared to coal-fired power
for connected buildings (City of Sydney, 2012b).
Source: City of Sydney
21The Critical Decade: New South Wales climate impacts and opportunities
Box 13. Transport improved accessibility to jobs, business and shopping
districts and affordable transport for all (IAPT, 2012).
Transport in Australia is likely to undergo a profound The city of Copenhagen, Denmark, found that its public
transformation during this century, as a result of higher transport system saves $5.7 billion DKK (equivalent to
oil prices, new transport technologies, rising incomes around $ 1 billion AUD) in lost productivity from travel
and population growth (Garnaut, 2008). time (Mandag Morgen, 2011). In the United States, it is
estimated a reduction of commuting time by 1 minute
Transport is the second largest consumer of energy in across the country is worth $19.5 billion in value added
NSW, and a significant contributor of greenhouse gases to the economy (Mandag Morgen, 2011). The social cost
– around 14 per cent of total NSW emissions (DCCEE, of traffic congestion in Sydney was estimated at $3.5
2012a). Cars make up approximately half of NSW billion in 2005, and is forecast to rise to $7.8 billion by
transport emissions, and trains only 3% (DCCEE, 2020 (DIT, 2007).
2012b). Technologies and solutions for more energy
efficient transport already exist and many cities around Figure 29. Trains are an extremely efficient and
the world are capitalising on the benefits of integrated low emissions form of transport.
transport systems, electric cars and active transport,
such as walking and cycling.
Trains are an extremely efficient and low emissions
form of transport (Figure 29). A train line can move
50,000 commuters per hour, whereas a freeway lane
can only move 2,500 in the same time. The potential
to reduce greenhouse gas emissions is equally great.
Just one commuter switching from road to rail from
Castle Hill to the Sydney CBD reduces emissions by
3,150kg of CO2 per year (TTF, 2009).
Efficient public transport systems, such as trains,
reduce emissions and provide many other advantages.
Benefits include improved air quality decreased traffic
congestion and noise; reduced costs to the community;
safe transport; less energy and public-land usage; Source: Flickr/Gareth Edwards
22 Climate CommissionThe Critical Decade: New South Wales climate impacts and opportunities (continued)
A SINGLE PERSON’S journey from
Parramatta to Central Station by car
emits around 4kg of greenhouse gases,
by train only 0.7kg
4kg
0.7kg
An eight-carriage train can move 1,000
people, the equivalent of 250–1,000 cars.
This would require around 1.3 hectares
of parking space.
Source: CityRail (2012) 23You can also read