Benefits of Non-Agricultural Pesticides in Canada - CropLife ...
←
→
Page content transcription
If your browser does not render page correctly, please read the page content below

Benefits of Non-Agricultural
   Pesticides in Canada

           Submitted to:

          February 2019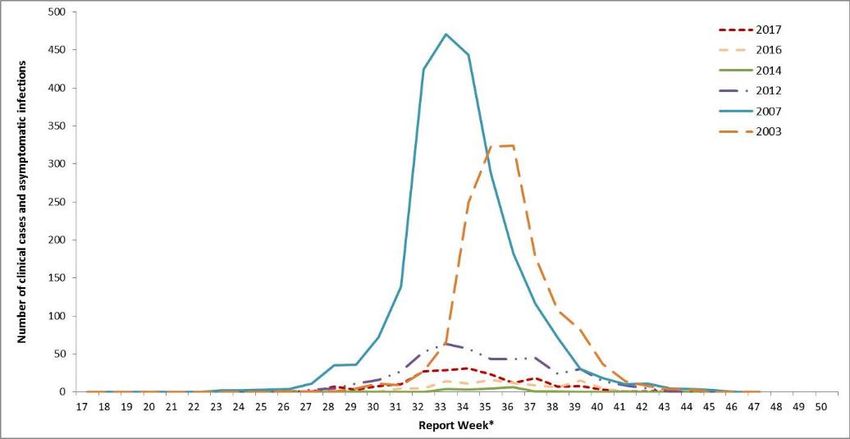
Benefits of Non-Ag Pesticides in Canada                                                                          February 2019

Table of Contents
Executive Summary .......................................................................................... 2
1   Introduction ................................................................................................ 5
2   The Non-Agricultural Pesticide Sector in Canada .......................................... 6
    2.1 Pest Control Products in Canada ............................................................................... 6
    2.2 Non-Ag and Domestic Pest Control Product Sector ................................................. 7
3   Economic Benefits to Canadians .................................................................. 9
    3.1 Economic Benefits of Non-ag and Domestic Use Pesticide Manufacturing............. 9
    3.2 Economic Benefits of Non-Agricultural Pesticide Use in Other Sectors ................ 11
4   Environmental and Societal Benefits .......................................................... 15
    4.1 Protection of Habitat and Diversity ......................................................................... 15
    4.2 Control of noxious weeds and nuisance weeds ....................................................... 16
    4.3 Roadside, railway, and industrial worker safety ..................................................... 17
    4.4 Maintenance of public spaces, infrastructure and investments into landscaping .... 17
    4.5 Public health benefits .............................................................................................. 18
    4.6 Sports-field safety.................................................................................................... 20
    4.7 Fire prevention ........................................................................................................ 20
5   Impacts of Use Restrictions ....................................................................... 20
     5.1 Impacts on Municipal Governments ....................................................................... 20
     5.2 Impacts on Schools .................................................................................................. 21
     5.3 Impacts on Consumers ............................................................................................ 21
     5.4 Impacts on Businesses ............................................................................................. 22
6   References ................................................................................................ 24
Appendix 1: Methodology ............................................................................... 26
Appendix 2: Summary of Provincial and Municipal Restrictions on Pest Control
Products ........................................................................................................ 27

                                                                                                                           Page 1
Benefits of Non-Ag Pesticides in Canada February 2019
Executive Summary
This report examines the economic, environmental, and social benefits that the non-
agricultural pesticide sector delivers to Canadians, including pesticides for domestic use,
industrial vegetation management, structural pest control, golf courses, and lawn care.
Overall, agricultural pesticides account for 74.7% of all pest control product use by volume in
2016. The non-agricultural sector (e.g. mainly antimicrobials used for wood preservation and
water treatment, as well as some herbicides used in industrial vegetation management ) has a
20.1% share of pest control product use.
Domestic use (e.g. mainly antimicrobials used for swimming pool and spa treatment)
accounted for 5.2%. Homeowners also use a variety of insecticides, herbicides, vertebrate
controls, fungicides, and disinfectants to control a wide range of pests, including:
• insects such as cockroaches, ants, spiders, silverfish, flies, mosquitoes, fleas, ticks and
bed bugs
• lawn and garden weeds
• rodents, such as rats and mice
• household mildews, molds and bacteria.
Economic Benefits
It is estimated that revenues for non-agricultural pest control product manufacturers in
Canada amounted to $312 million in 2016 ($248 million for non-ag use and $64 million for
domestic use). This level of manufacturing activity generates $617 million in economic
activity, $285 million in GDP, and $115 million in income for more than 1,840 Canadians.
In addition to these economic benefits, it is estimated that the sector spends about $22 million
on research and development on non-ag and domestic use pest control products in Canada,
generating an additional $30 million in GDP, 327 jobs and $21 million in wages in the
Canadian economy.
Impacts across the value chain include sales at the wholesale level, which generate $252
million in economic activity in Canada, $139 million in GDP, $81 million in labour income,
and over 1,465 jobs. Retail sales account for an additional $134 million in economic activity
in Canada, $76 million in GDP, $50 million in labour income, and over 1,520 jobs.
Non-agricultural pest control products are important intermediate inputs to other industrial
sectors, generating significant additional benefits throughout Canada’s economy. For
example:
Page 2Benefits of Non-Ag Pesticides in Canada February 2019
• Wood preservation: pest control products are a major input used in the Canadian wood
preservation industry. There are 55 wood preservation facilities with total sales of
$874 million in treated product (industrial and residential).
• Industrial vegetation management (IVM): pest control products are also a key input to
the IVM sector in Canada, which does about $50 million in business a year, about $20
million of that being for herbicides and $30 million for the cost of applying the
herbicides and the other vegetation management methods, such as hand trimming,
mowing, etc. Pest control products play a critical role in maintaining the safety and
security of critical electrical power and pipeline infrastructure, as well as safety along
thousands of kilometres of roadsides and railroads in Canada
• Forest vegetation management (FVM): the Canadian forestry sector relies on pest
control technology to ensure sustainable forest renewal and to remain competitive in
global markets.
• Structural pest control: pest control products are critical tools used to control rodents,
vermin, insects and wood-destroying pests and organisms which invade buildings or
structures, including railroad cars, ships, docks, trucks, airplanes, or the contents
thereof.
• Turfgrass: this multi-billion-dollar sector involves planting, growing, and maintaining
of turfgrass by sod farms, lawn and landscaping companies (households, offices,
institutions), municipal parks, cemeteries, golf courses, and sports fields.
• Other industrial uses: Raw commodities and packaged grocery products—the foods
Canadians eat—are protected from insect contamination by the controlled use of
insecticides in processing, manufacturing, and packaging facilities. Pesticides are used
in grocery stores to manage insects and rodents attracted to food and food waste.
• Domestic use: while most domestic use involves swimming pool and spa products,
domestic pest control products are used in plastics, paints, and caulking used in homes
prevent mold, and in toilet bowl cleaners and disinfectants to protect health.
Environmental and Societal Benefits
Non-ag pesticides also deliver a range of environmental and societal benefits to Canadians,
including:
• Protection of habitat and diversity through invasive weed control
• Control of invasive forest pests
• Control of noxious weeds and nuisance weeds
• Roadside, railway, and industrial worker safety
• Power supply security
• Maintenance of public spaces, such as infrastructure and parks
• Nuisance insect control
• Public health and hygiene
• Sports-field safety
Page 3Benefits of Non-Ag Pesticides in Canada February 2019
• Fire prevention
Impacts of Restrictions on Non-Ag Pesticides
For municipalities and schools, restrictions on non-ag pesticides have significantly increased
costs of playing field maintenance, particularly for small municipalities and school boards.
Bans have also increased costs of maintaining a lawn for homeowners by an average of $80-
$100 per year. However, despite various provincial and municipal bans, the most recent data
from Statistics Canada (2015) shows that herbicide use by all households across Canada has
fallen by only 4 percentage points since 2007. Data for households with a lawn or garden
show that herbicide use has actually grown by 12 percentage points in Quebec and 4
percentage points in Ontario.
Overall, non-ag pest control products provide significant economic benefits to Canadians.
However, proper use of non-ag pesticides as part of integrated pest management (IPM)
strategies also deliver significant environmental and societal benefits to Canadians – benefits
that often go unnoticed by the public.
Page 4Benefits of Non-Ag Pesticides in Canada February 2019
1 Introduction
Properly used, pesticides provide benefits essential to our way of life. There are many kinds
of benefits of pesticides that go unnoticed by the public. The most obvious and easiest
benefits to calculate are economic benefits that farmers derive from the protection of crop
yield and quality, ensuring reliable supplies of agricultural produce at prices which are
affordable to Canadian consumers. These benefits have been quantified in a separate report,
The Value of Plant Science Innovations to Canadians. (RIAS Inc., 2015)
But pesticides are also widely used in a variety of other settings. For example, if left
unchecked, trees and brush growing beneath power lines can cause costly power outages.
Herbicide use by utility companies to prevent undergrowth eliminates the problem and
provides unobstructed access for maintenance and repairs. Road crews also use herbicides to
control vegetation along highways for safety reasons: clear roadsides increase visibility for
drivers and allow water to escape more efficiently during a downpour or flooding. Herbicides
also are used to fight invasive weeds in parks, wetlands, and natural areas. Insecticides are
also used in parks, wetlands, and natural areas to protect Canadians against West Nile virus
and other mosquito-borne diseases.
Pesticides are used around our homes and businesses in ways we often take for granted.
Plastics, paints, and caulking often contain fungicides to prevent mold. Toilet bowl cleaners
and disinfectants often contain pesticides. Raw commodities and packaged grocery
products—the foods Canadians eat—are protected from insect contamination by the
controlled use of insecticides in processing, manufacturing, and packaging facilities.
Pesticides are used in grocery stores to manage insects and rodents attracted to food and food
waste. Proper use of pesticides, as part of integrated pest management (IPM) strategies,
improves quality of life, protects our property, and promotes a better environment.
However, these non-monetary benefits from the use of pesticides are difficult to quantify,
particularly when they are distributed across various impacted groups such as pesticide users
(both synthetic and organic), other market participants (e.g. shippers and retailers), residents
of those areas where the pesticides will be applied, consumers of products treated with
pesticides, formulators, marketers, and applicators.
Economic Benefits
Economic benefits are estimated across the entire value chain of the sector, from suppliers to
manufacturers of non-agricultural pesticides, to manufacturing of non-agricultural pesticides,
to transportation/distribution/ warehousing, to wholesalers/dealers and retailers, and to final
consumers. Estimates of economic benefits are derived using multipliers from Statistics
Canada’s interprovincial input-output (I-O) simulation model. Measures from I-O modeling
include total economic activity generated, and contribution to GDP, total employment and
Page 5Benefits of Non-Ag Pesticides in Canada February 2019
labour income. Additional measures are also calculated, such as provincial and federal
income and corporate tax revenues. For more detail on methodology, please see Appendix 1.
Environmental and Societal Benefits
Section 5 of this report also provides an overview of the environmental and societal benefits
of non-ag pesticides from the literature, including:
• Protection of habitat and diversity through invasive weed control
• Control of invasive forest pests
• Control of noxious weeds and nuisance weeds
• Roadside, railway, and industrial worker safety
• Power supply security
• Maintenance of public spaces, such as infrastructure and investments into landscaping
• Nuisance insect control
• Public health and hygiene
• Sports-field safety
• Fire prevention
Impacts of Restrictions on Non-Ag Pesticides
Section 6 of the report examines how product restrictions on non-ag pesticides have impacted
economic, environmental, and societal benefits to Canadians within the various sub-sectors
identified above.
2 The Non-Agricultural Pesticide Sector in Canada
2.1 Pest Control Products in Canada
A pest control product is any product intended to control, destroy, attract or repel any pest,
and includes chemicals, devices (such as pheromone traps) and even organisms (such as
microbials).
According to 2016 data, the most common pest control products are herbicides (57% of all
pest control products sold in Canada, by volume), antimicrobials (24.8%), fungicides (7.7%),
and insecticides (4.7%) (Health Canada, 2018). While pest control products are most
commonly synthetic products, the term also includes biopesticides derived from such natural
materials as animals, plants, bacteria, and certain minerals. Biopesticides account for more
than 6.8% of all pest control products.
Overall, agricultural use accounts for 74.7% of all pest control product use by volume in
2016. The non-agricultural sector (e.g. mainly antimicrobials used for wood preservation and
water treatment, as well as some herbicides used in industrial vegetation management) has a
20.1% share of pest control product use, while domestic use (e.g. mainly antimicrobials used
Page 6Benefits of Non-Ag Pesticides in Canada February 2019
for swimming pool and spa treatment, as well as insecticides and herbicides) accounted for
5.2%.
Figure 1: Quantity of Pesticides Sold in Canada by Sector (2012-2016)
Source: Health Canada, 2018.
Table 1 shows the market for pest control products in Canada. Total market is calculated as
total revenue for pest control product manufacturing (NAICS 32532) in Canada plus imports
minus exports.
Statistics Canada has suppressed revenue data for 2016 to meet the confidentiality
requirements of the Statistics Act, so the latest data for total market for pest control products
in Canada is $2.6 billion in 2015.
Table 1: Canadian Market for Pest Control Products ($ millions)
2012 2013 2014 2015 2016
Total revenue $581.4 $804.9 $1,135.9 $1,121.4 $1,419.1*
Imports $1,160.0 $1,539.0 $1,663.0 $1,607.0 $1,779.0
Exports $90.5 $71.2 $90.3 $125.1 $113.8
Total Canadian Market $1,650.9 $2,272.7 $2,708.6 $2,603.3 $3,084.3
Source: Statistics Canada Table 16-10-0117-01 Principal statistics for manufacturing industries, by North American Industry
Classification System (NAICS), Statistics Canada Table 18-10-0032-01 Industrial product price index by industry, and Trade
Data Online. * 2016 revenues were estimated based on total active ingredient in 2016 x total price/kg in 2015 x IPPI
2016/IPPI 2015 for Pesticide and other agricultural chemical manufacturing (32532).
2.2 Non-Ag and Domestic Pest Control Product Sector
The non-agricultural pesticide sector in Canada includes industrial vegetation management,
turfgrass farms, lawns and landscaping around homes and institutions, municipal parks, golf
Page 7Benefits of Non-Ag Pesticides in Canada February 2019
courses and sports fields. Although a multi-billion-dollar sector in Canada, reliable statistics
for this sector are scarce.
Manufacturing
We examined several different data sources to determine the value of non-agricultural
pesticide manufacturing, including comparing market shares by volume of pesticides sold in
Canada according to Health Canada’s sales reports from 2012 to 2016 with market shares
based on the value of pesticides used as intermediate inputs by industries and in final
consumption by households from Statistics Canada’s Supply and Use Table 36-10-0478-01
over the same period. Data in Table 2 show that the share of the Canadian market segments
by volume and by value are fairly similar.
Table 2: Market Shares
Average
2012 2013 2014 2015 2016 2012-2016
Market Shares Based on Volume - Pest Control Products Sales Reports
Agricultural 78.1% 73.9% 74.3% 73.0% 74.7% 74.8%
Non-Ag 17.1% 20.2% 21.0% 23.2% 20.1% 20.4%
Domestic 4.8% 5.9% 4.6% 3.7% 5.2% 4.9%
Market Shares Based on Value - Statistics Canada’s Supply and Use Table
Agricultural 84.5% 80.3% 71.6% 79.6% n/a 78.6%
Non-Ag 10.8% 15.9% 24.4% 16.1% n/a 17.3%
Domestic 4.7% 3.8% 4.0% 4.3% n/a 4.2%
Source: Health Canada (2018) and Statistics Canada (2018b).
Notes: “n/a” - not available
Non-Ag Pesticides
According to the most recent report from PMRA, there has been some fluctuation in Non-
agricultural sector sales since reporting began in 2007/2008, with a large decrease in some
years (2012) and smaller increases and decreases in other years. For the Non-agricultural
sector, antimicrobials accounted for 95.4% of sales in 2016, followed by herbicides (3.4%),
fungicides (1.0%), insecticides (0.5%), and vertebrate control (0.2%). Antimicrobials
consistently account for the majority of Non-agricultural sector pesticide sales (ranging from
86% to 96.8%) since reporting began. Non-agricultural sector products are used
predominantly in the wood preservation industry and for water treatment.
Domestic Use Pesticides
Domestic use products accounted for 5.2% of overall pesticides in Canada for 2016. The
PMRA notes that changes from year to year in the Domestic sector may be dependent on
changes in regional regulations (e.g. restrictions at the municipal or provincial level), as well
as changes in weather (e.g. hot and sunny summers may result in increased sales of
swimming pool and spa products).
Page 8Benefits of Non-Ag Pesticides in Canada February 2019
In 2016, antimicrobial products accounted for 53.5% of domestic pesticides sold in Canada
(mainly sales of swimming pool and spa products), followed by herbicides (35.8%),
insecticides (8.6%), vertebrate controls (2.0%) and fungicides (0.3%) (Health Canada, 2018).
Homeowners use a variety of insecticides, herbicides, vertebrate controls, fungicides, and
disinfectants to control a wide range of pests, including:
• insects such as cockroaches, ants, spiders, silverfish, flies, mosquitoes, fleas, ticks and
bed bugs
• lawn and garden weeds
• rodents, such as rats and mice
• household mildews, molds and bacteria.
3 Economic Benefits to Canadians
The testing, development, production and selling of non-agricultural and domestic use pest
control products impact Canada’s economy at various stages of the value chain. This section
includes a breakdown of the economic impacts for the following stages of the value chain:
• Production of non-agricultural pest control products (i.e. production by CropLife
member companies)
• Suppliers of products and services used in the production of non-agricultural pest
control products (e.g. R&D, other inputs such as energy, commodity chemicals,
financial and professional services, etc.)
• Wholesaling and distribution of non-agricultural pest control products
• Retail/household use
3.1 Economic Benefits of Non-ag and Domestic Use Pesticide Manufacturing
Production impacts are based on our estimate of the value of manufacturing shipments of
non-agricultural pest control products of $312 million. Based on the average market shares
over the 5-year period from 2012 to 2016 from Table 2 above, we applied shares of 17.5% for
non-ag use and 4.5% for domestic use to the estimated $1.42 billion in revenues for pest
control product manufacturers in 2016.
Table 3: Economic Impacts from Production of Non-agricultural and Domestic Use Pest Control Products
Output GDP Labour income
($ millions) ($ millions) ($ millions) Jobs
Direct
Non-ag $248.3 $97.2 $28.2 319
Domestic $63.9 $25.0 $7.3 82
Sub-Total $312.2 $122.1 $35.4 401
Direct and Indirect
Non-ag $429.5 $75.1 $8.6 1,408
Domestic $110.4 $46.4 $24.9 406
Sub-Total $540.0 $121.5 $33.4 1,814
Page 9Benefits of Non-Ag Pesticides in Canada February 2019
Output GDP Labour income
($ millions) ($ millions) ($ millions) Jobs
Direct, Indirect, and Induced
Non-ag $490.6 $226.8 $91.9 1,466
Domestic $126.1 $58.3 $23.6 377
Sub-Total $616.7 $285.1 $115.6 1,843
Source: RIAS Inc. estimates based on Statistics Canada input-output multipliers (Statistics Canada, 2017)
Table 3 shows that $312 million in revenues generates total direct, indirect and induced
impacts of just under $616 million in economic output, $285 million in GDP, $115 million in
income and more than 1,840 jobs for Canadians.
Private Research and Development
On average, the pesticide industry reinvests about 7% of its total sales into R&D (RIAS Inc,
2015). Applying this R&D spending estimate to sales of non-agricultural and domestic use
pest control products in Canada, we estimate that companies spend approximately $22 million
on research and development on non-ag and domestic use pest control products in Canada.
Table 4: Economic Impacts of Research and Development
Output GDP Labour income Jobs
($ millions) ($ millions) ($ millions)
Direct $21.9 $16.3 $14.1 179
Direct and Indirect $30.6 $21.1 $17.3 237
Direct, Indirect, and Induced $45.5 $29.7 $21.3 327
Source: RIAS Inc. estimates based on Statistics Canada input-output multipliers (Statistics Canada, 2017)
Private investment in research and development generated almost $30 million in GDP, and an
additional 327 jobs in the Canadian economy earning over $21 million in labour income.
Non-Agricultural Wholesale
Overall, non-agricultural pest control products generate over $252 million in economic
activity in Canada, $139 million in GDP, 1,465 jobs for Canadians earning over $81 million
in wages and salaries at the wholesale level.
Table 5: Economic Impacts of Non-Ag Wholesale
Output GDP Labour income Jobs
($ millions) ($ millions) ($ millions)
Direct $122.6 $68.0 $42.8 697
Direct and Indirect $197.6 $108.1 $66.7 1,135
Direct, Indirect, and Induced $251.9 $139.2 $81.3 1,465
Source: RIAS Inc. estimates based on Statistics Canada input-output multipliers (Statistics Canada, 2017)
These non-agricultural pest control products are important intermediate inputs to other
industrial sectors, generating significant additional benefits throughout Canada’s economy, as
discussed in Section 3.2 below.
Page 10Benefits of Non-Ag Pesticides in Canada February 2019
Domestic Use Retail
Table 6 shows that the sale of domestic use pest control products generates over $134 million
in economic activity in Canada, $76.5 million in GDP, almost $50 million in labour income,
and 1,524 jobs at the retail level.
Table 6: Economic Impacts of Retail Sales - Domestic Use Pesticides
Output GDP Labour income Jobs
($ millions) ($ millions) ($ millions)
Direct $62.2 $35.5 $28.5 1,100
Direct and Indirect $100.7 $57.2 $40.6 1,319
Direct, Indirect, and Induced $134.5 $76.5 $49.7 1,524
Source: RIAS Inc. estimates based on Statistics Canada input-output multipliers (Statistics Canada, 2017)
3.2 Economic Benefits of Non-Agricultural Pesticide Use in Other Sectors
Treated Wood Industry
Based on the most up-to-date information available, in 2010 the Canadian wood preservation
industry was comprised of 55 wood preservation facilities with total sales of $874 million in
treated product (industrial and residential). Provinces with the most active facilities are
British Columbia with 14, Ontario with 12 and Quebec with 11 (Environment Canada, 2013).
Treated wood is lumber, timbers or round poles that have been treated with a chemical
preservative to prolong their service life. The treatment can reduce the impact of fungal decay
(rot), weathering or wood-eating insects such as termites. Wood intended for structural
applications (such as preserved wood foundations) or non-structural applications (such as
utility poles or fence posts) can be treated with preservatives.
The most common treatments can be divided into two groups: those used only on industrial
products and those used primarily for residential products. Industrial uses of treated wood
include telephone and power poles, landscaping ties, bridge parts and decking, and
commercial decks and boardwalks. Residential products include primarily outdoor decking,
landscaping ties and fence posts, with some treated products used in house foundations.
In Canada the predominant wood preservatives are the following antimicrobial pesticides:
• Aqueous based formulations for residential use:
o ACQ (alkaline copper quaternary) - ACQ-treated products include lumber for
patios and fencing in residential construction.
o CA-B (copper azole) - CA-B-treated products include lumber for patios and
fencing in residential construction
o Borates - Uses are for wood components in interior applications.
• Aqueous based formulations for commercial & industrial use:
Page 11Benefits of Non-Ag Pesticides in Canada February 2019
o CCA (chromated copper arsenate) - CCA-treated products include agricultural
fence posts, foundation lumber and plywood, utility poles and construction timber.
• Oil based formulations for commercial & industrial use:
o PCP (pentachlorophenol) - PCP-treated products include utility poles and cross-
arms.
o Creosote - Uses include treatment of railway ties, utility poles for export, and
pilings and timbers for marine applications.
Studies have shown that pesticides used in wood preservation enhance the lifetime utility of
wood by a factor of 5 to 10 or more, depending on the species of wood, end use and efficacy
of the treatment. (Environment Canada, 2013). This is an important contribution that the
wood preservation industry makes to forest conservation. Substituting alternative materials
(such as steel, concrete or plastics) for treated wood in industrial applications (not including
residential) could increase material costs to users.
Industrial Vegetation Management
The industrial vegetation management (IVM) sector carries out the control, removal or
alteration of vegetation to achieve the objectives of land users. IVM services includes tree
trimming, hazard tree identification and removal, manual brush cutting, mechanical brush
control, and herbicide use. The large majority of industrial vegetation management (IVM)
services are outsourced to contractors. IVM services are critical for a number of sectors,
including pipelines and electrical distribution utilities, provinces and municipalities for
roadside maintenance, railroads and industrial sites.
The industrial vegetation management sector in Canada does about $50 million in business a
year, about $20 million of that being for herbicides and $30 million for the cost of applying
the herbicides and the other vegetation management methods, such as hand trimming,
mowing, etc.
Utilities and Pipelines Rights of Way: Critical electrical power infrastructures, including
transmission lines, relay facilities, pipes, fences, gates, bridges, and access roads, occupy
many acres across Canada on rights-of-way (ROW) corridors. Easy, safe access to repair and
update these critical infrastructures is essential. Proper maintenance, including vegetation
management, of ROW and its supporting facilities is crucial to ensuring the reliable
transmission of affordable electrical power, though this is no small task. Vegetation
management on rights of way (ROW) often represents a utility company’s largest operations
and maintenance cost. Unmanaged and poorly maintained vegetation can cause electricity
outages, wildfires, soil erosion, and water quality issues. These events can damage electric
power infrastructures, resulting in serious reliability, economic, environmental, and health
risks.
Page 12Benefits of Non-Ag Pesticides in Canada February 2019
Vegetation interference with transmission and distribution power lines is one of the most
common causes of electrical outages. For example, the August 14, 2003 electricity blackout
affected more than 50 million people across eight northeastern and midwestern states and two
Canadian provinces. In some areas, power was restored in hours, while other areas were
without power for several days. While this blackout was an inconvenience for many, it also
interrupted critical infrastructure services and cost the U.S. economy an estimated $7 to $10
billion. The August 14, 2003 blackout culprit: overgrown trees. (U.S. EPA, 2018). According
to the Electric Power Research Institute (EPRI), power outages and other power disturbances
cost the U.S. economy nearly $120 billion every year. Much of this cost can be directly
attributed to power outages triggered by overgrown vegetation on ROW. (U.S. EPA 2018)
Pipelines have similar requirements. A clear sight line remains important for proper pipeline
maintenance. During regular inspections conducted from aircraft or ground vehicles, crews
can spot leaks or problems. Even routine maintenance becomes difficult if crews can’t easily
access pumps, gates and valves. Vegetation management also positively affects the safety of
work crews that must access pipelines.
Both electrical utilities and pipeline companies have legal responsibilities to maintain rights
of way to ensure safety; vegetation management is a significant component of achieving that
goal. For example, activities within pipeline ROWs are governed by the NEB Act, the NEB
Pipeline Damage Prevention Regulations – Authorizations and NEB Pipeline Damage
Prevention Regulations – Obligations of Pipeline Companies, and easement agreements
between landowners and pipeline companies. Aesthetics and wildlife habitat also play a role
in managing a well-maintained right-of-way. An emerging issue is security. Clear visibility
and access are vital to ensure that the security of pipeline infrastructure is not threatened.
Roadsides: Safety is paramount along highways and roads. Vegetation management helps
ensure motorist safety by controlling encroaching weeds and brush that can conceal road
signs and affect driver visibility. Since weeds and brush offer animals an ideal hiding spot,
wildlife can dart into the road, increasing the potential for vehicular accidents. Eliminating
heavy, tall vegetation bordering roadways prevents shading and allows the sun to melt ice or
snow on pavement. It also eliminates snow that may be trapped in vegetation and lead to
hazardous drifting across roadways. In addition, vegetation management stops weeds and
brush roots that crack and buckle road surfaces.
Railroads: With more than 51,000 km of railroad track crisscrossing Canada, effective
vegetation management on and along railways is critically important. Safety is essential for
railroads, because heavy equipment moves at high speeds along the rails. Left unchecked,
weeds and brush can reduce train traction during starts and stops, can hide damaged
equipment and other hazards, and can cause rail ballast to rot prematurely. At crossings,
Page 13Benefits of Non-Ag Pesticides in Canada February 2019
dense foliage limits motorist sight lines. Again, railways have a legal responsibility to safety
and vegetation management.
Forest Vegetation Management: Forest Vegetation Management (FVM) is an important
tool in the regeneration of Canada’s forests. The Canadian forest industry relies on the use of
herbicides as an effective plantation management technique to ensure forest renewal and to
remain competitive. Following harvest, numerous pioneer plant species (e.g., Canada blue-
joint grass, raspberry, trembling aspen), which are well-adapted to disturbed sites and open
growing conditions, easily outcompete newly planted crop tree seedlings (e.g., spruce and
pine species) for nutrients, light, water and growing space. Similar to what happens in the
home garden, reduced crop growth or outright crop failure will occur if weeds are not
controlled effectively. Of course, in contrast to the home garden, the scale at which forestry
operations occur makes hand-weeding highly impractical.
According to Natural Resource Canada, while non-chemical FVM techniques are employed
on a large portion of the forest land base, there are generally “no alternatives that are as cost-
effective, efficient or reliable as modern chemical herbicides in many forest regeneration
scenarios.” (NrCan 2011). The literature also indicates that trees in herbicide treated areas
produced more volume with higher future value than those in mechanically cut areas.
Homogain, et al (2011) found that the projected value of wood produced was 36% to 53%
higher in herbicide-treated tree plots and 24% to 37% higher in mechanically cut plots than in
control plots.
Structural Pest Control
Structural pest control is the control of pests (including but not limited to rodents, vermin and
insects) and wood-destroying pests and organisms or such other pests which may invade
buildings or structures, including railroad cars, ships, docks, trucks, airplanes, or the contents
thereof. The practice of structural pest control involves structural repairs or replacements, or
the use of pesticides, insecticides, rodenticides, fumigants, or allied chemicals or substances,
or mechanical devices for the purpose of eliminating, exterminating, controlling or preventing
infestations or infections of such pests, or organisms.
Turfgrass
Turfgrass is a multi-billion-dollar industry in Canada. This sector consists of the planting,
growing, and maintaining of turfgrass principally in the following locations:
• sod farms;
• lawns and landscaping (households, offices, institutions);
• municipal parks;
• cemeteries;
• golf courses; and
• sports fields.
Page 14Benefits of Non-Ag Pesticides in Canada February 2019
Sod Farms: In 2017, there were 246 sod farms managing 20,522 hectares of turfgrass, with
sales of $147.3 million. Ontario is the largest sod producing province in Canada, with 65 sod
farms covering 8,624 hectares and sales of $59.1 million.
Canadian sod production peaked in 2012. Lower sod sales since that time have been attributed
to a shift away from the construction of single-detached dwellings in favour of multi-dwelling
type buildings, and a move away from traditional landscaping practices towards hardscaping.
Table 7: Summary Statistics for Sod Production in Canada
2013 2014 2015 2016 2017
Total sod operations 284 274 243 240 246
Total sod area (ha) 23,766 24,225 22,914 21,915 20,522
Total sod sales ($ M) $160.2 $162.4 $157.0 $146.8 $147.3
Source: Statistics Canada. Table 32-10-0034-0 - Estimates of sod area, sales and resales and Table 32-10-0026-01 - Total
greenhouse, sod and nursery employees
Golf Courses: Canada has 2,346 public and private golf facilities, ranking it third in the
world in total supply by country. Golf courses in Canada manage over 175,000 hectares of
green space, including 30,000 hectares of wildlife habitat under golf course stewardship.
Landscaping Services
This industry comprises establishments primarily engaged in planning, designing and
administering the development of land areas for projects such as parks and other recreational
areas, airports, highways, hospitals, schools, land subdivisions, and commercial, industrial
and residential areas by applying knowledge of land characteristics, location of buildings and
structures, use of land areas, and design of landscape projects.
Total sales in 2016 were $435.5 million, up from $422.1 million in 2015. About 54% of
landscaping services where to businesses, 9% to households, and 33% to governments, not-
for-profits and public institutions, with the remaining 4% to exports.
4 Environmental and Societal Benefits
4.1 Protection of Habitat and Diversity
While vegetation management on ROW is essential for providing safe and reliable electric
power, the ROW also provide important wildlife habitats. As wildlife habitats in Canada are
lost to development, these ROW become increasingly important. While poor vegetation
management on ROW can result in the loss of these critical habitats, the IVM approach can
create natural, diverse, and sustaining ecosystems, such as a meadow transition habitat. These
transition landscapes, in turn, reduce wildlife habitat fragmentation and allow species to be
geographically diverse, remaining in areas from which they might otherwise be excluded. A
variety of wildlife species (including threatened and endangered species), such as butterflies,
Page 15Benefits of Non-Ag Pesticides in Canada February 2019
songbirds, small mammals, and deer, consider these habitats home. These habitats also
encourage the growth of native plant species and can increase plant diversity.
And proper vegetation management on ROW is not just a concern for utility managers; it is
also vitally important to those who manage the land adjacent to ROW. How vegetation is
managed on ROW can impact the surrounding land by causing wildfires, fragmenting wildlife
habitat, and introducing invasive and exotic species. Utility companies and land managers can
both benefit by implementing Integrated Vegetation Management (IVM) programs on ROW
and adjacent properties.
Invasive and exotic species are often a problem on ROW, and, consequently, the surrounding
land. IVM techniques (such as selective herbicide application) can minimize this problem,
while ensuring native and endangered species are not affected. (U.S. EPA 2018)
4.2 Control of noxious weeds and nuisance weeds
Invasive alien species (IAS) are species introduced through human action from outside their
natural distribution (past or present), that threaten the environment, economy, or society -
including human health. Annually, IAS results in billions of dollars in direct losses, control
costs, increased production costs and lost market access. The annual impact of IAS is
estimated to be as much as $20 billion to the forest sector, $7 billion for aquatic invasive
species in the Great Lakes, and $2.2 billion for invasive plants alone in the agricultural
sector. IAS have gained international attention as globalization, climate change, and
international trade increases have elevated IAS introduction risks. (CFIA, 2014)
Invasive species affect Canada’s economy in many ways, both directly and indirectly. Direct
economic impacts caused by invasive species arise from costs such as, research, control and
management programs, reduction of economically important resources and crop yield, and
impacts on international trade and tariffs. However, much of this data is not available, and
many of these impacts are not assessed. Indirect economic impacts can be much more
challenging to quantify, and in some cases, hold a greater weight than direct impacts.
Examples of indirect economic impacts include loss of ecosystem services (the ways that the
environment benefits humans), changes in natural habitats, decrease of biodiversity, and
social impacts. Due to the difficulty in assessing both the direct and indirect impacts of
invasive species, estimates of economic impact vary widely.
Economic loss, due to invasive species in Canada, can be calculated from available data on
control costs, reduced yield and land value, trade bans, landowner compensation, health-care
costs, and reduced revenue from tourism. The costs associated with ten species, which invade
the Canadian fishing, forestry, and agriculture industries, totaled $187 million per year
(Colautti, et al, 2006).
Page 16Benefits of Non-Ag Pesticides in Canada February 2019
There is also an “invisible tax” due to invasive species that is caused by the reduced
production of resources. This decrease due to invasions applies to forestry, fisheries, and
agriculture. When this impact is incorporated, the cost of invasive species to Canada is
between $16.6 billion and $34.5 billion per year. Similarly, the Canadian Food Inspection
Agency (CFIA) estimates the annual impact of invasive species to be $30 billion ($20 billion
in the forest sector, $7 billion for aquatic invasive species in the Great Lakes, and $2.2 billion
for invasive plants in the agricultural sector). It saves money in the long run to invest in
prevention efforts when dealing with invasive species, rather than paying the extensive costs
associated with management after arrival and establishment. (CFIA, 2014)
However, none of these IAS damage estimates include the significant impacts of IAS in urban
areas. In 1945 Dutch elm disease was introduced to Quebec from the United States. Since
then, it has killed 600,000 elm trees in Quebec and in one year alone killed 80 percent of
Toronto’s 35,000 elm trees. Dutch elm disease is now found in most of North America and
has irrevocably changed the composition of many Canadian urban forests. More recently,
emerald ash borer and Asian longhorn beetle have been threatening hardwoods in Windsor
and Toronto respectively.
4.3 Roadside, railway, and industrial worker safety
Poorly managed vegetation on ROW can have significant negative impacts on these features,
such as wildfires, soil erosion, and water quality issues associated with runoff. An IVM
program on ROW can reduce these risks.
4.4 Maintenance of public spaces, infrastructure and investments into
landscaping
• Soil erosion control, water conservation — ground water recharge. Healthy lawns
absorb rainfall and reduce runoff up to 80 times more efficiently than impervious
surfaces. Runoff water from agriculture and urban areas account for 64% and 5% of non-
point surface water pollution affecting US rivers, and 57% and 12% of non-point water
pollution affecting US lakes. Research has shown that “quality turfgrass stands modify the
overland flow process so that runoff is insignificant except in the most intensive rainfall
events.” Good turf had runoff of 5% to 25% of bare soil (RIAS Inc., 2006).
• Storm water runoff and flood control. This is a critical issue in Canadian and US rural
and urban municipalities, especially those with combined sewer outflows, which can
cause sewage facilities to overflow in heavy rain events. The issue is so important that
storm water utilities have been established in the United States (only studies, so far, in
Canada) to charge for runoff from properties. The charge structures usually offer an
incentive to reduce runoff. Properties with good ground cover would pay less than those
without. This is another market-price recognition of the value of good ground cover.
• Soil enrichment. This takes place through carbon storage.
Page 17Benefits of Non-Ag Pesticides in Canada February 2019
• Discourages nuisance pests. Well-maintained lawns discourage nuisance pests.
• Organic chemicals decomposer. Bacterial populations in a thick turf community offer
one of the most active biological systems for the degradation of trapped organic
chemicals.
• Phosphorus runoff. Research at the University of Wisconsin O.J. Noer Turfgrass
Research Center confirms that poorly kept, unfertilized lawns contribute 40% more
phosphorus than fertilized lawns. The reason is that phosphorus binds to soil; and soil
runoff carries phosphorus with it. A healthy, well-kept, properly fertilized lawn filters
rainwater and holds soil in place, preventing runoff — and phosphorus pollution (RIAS
Inc., 2006).
4.5 Public health benefits
The role of pesticides in protecting public health is broad and varied. Water utility companies
apply the pesticide chlorine to public drinking water to kill harmful bacteria. Pesticides
known as disinfectants eliminate dangerous organisms that cause Legionnaire’s disease, and
hospitals rely on disinfectants to prevent the spread of bacteria such as Staphylococcus.
Insecticides are used to eradicate bed bug infestations. Rodenticides are used in public
housing units to control rodents that carry diseases such as the deadly hantavirus. Avicides
are used to control birds near silos and grain storage buildings, reducing the likelihood of
grain contamination and exposure of workers to the lung disease histoplasmosis.
Herbicides control allergen-producing weeds such as ragweed and poison ivy. About 15% to
20% of the population has hay fever or allergic reactions to plant pollen, dust and other
airborne particles. Ragweed is the major cause of the problem. Hay fever is most common
among 24- to 44-year olds, and the economic impact of their diminished productivity is
substantial. For many individuals, high pollen counts trigger asthma attacks, and may
promote the development of the condition. Dense lawns typically are free of the many weedy
species that produce allergy-related pollens.
While poison ivy can be controlled by grubbing (digging) out the roots and stems, herbicides
offer some safety advantages over mechanical methods. For example, the danger of a person
receiving poison-ivy dermatitis either by direct contact with the plant or indirectly by
touching contaminated tools, etc., is much less with herbicidal methods than with mechanical
methods. Also, control of these weeds using herbicides is usually more effective by than by
mechanical methods since it is almost impossible to remove every piece of underground stem,
so regrowth is likely to occur.
Page 18Benefits of Non-Ag Pesticides in Canada February 2019
Figure 2: Cases of West Nile Virus and Other Mosquito-borne Diseases
Source: Public Health Agency of Canada. West Nile virus and Other Mosquito-borne Diseases
National Surveillance Report
Figure 2 shows the incidence of West Nile Virus and other mosquito-borne diseases in
Canada over time. Healthcare professionals recommend the use of DEET to repel insects that
vector Lyme disease, West Nile virus, etc. West Nile virus alone has resulted in deaths of
significant numbers of people, horses and birds nationwide over the past 20 years. The goal of
public health officials is to reduce mosquito numbers to levels that minimize the risk of West
Nile virus transmission.
While there are a range of integrated pest management strategies, including identification and
elimination of mosquito breeding sites, use of sentinel species such as crows and blue jays to
detect the virus, and the monitoring of adult mosquito populations, even with best efforts
mosquito populations sometimes explode beyond acceptable public health standards. When
this happens, health officials take immediate action to control adult mosquitoes with
insecticides in areas where the virus is detected. Once the insecticides have controlled the
mosquito population, some professionals resume their focus on non-pesticidal methods of
prevention but pesticide programs for larvae control are much more common.
Raw commodities and packaged grocery products are protected from insect contamination by
the controlled use of insecticides in processing, manufacturing, and packaging facilities.
Pesticides are used in grocery stores to manage insects and rodents attracted to food and food
waste.
Other health benefits of maintaining household lawns and community sports fields and green
spaces include:
• Temperature moderation. The average-sized front lawns of eight homes have the same
cooling effect as about 70 tons of air conditioning. Lawns cool hot summers. Healthy,
well-maintained lawns will reduce surface temperatures by 18 to 24 degrees Celsius in
Page 19Benefits of Non-Ag Pesticides in Canada February 2019
comparison to bare soil, and 10 to 15 degrees Celsius in comparison to natural
vegetation or poorly managed grass.
• Pollutant filter for water quality.
• Oxygen release. 2,500 square feet (230 m2) of lawn releases enough oxygen for a
family of four.
• Noise abatement/glare reduction. Good turf also makes life a bit quieter. It effectively
absorbs and deflects sound. When combined with trees and other landscaping, grass
can reduce noise levels within urban environments by 20% to 30%.
4.6 Sports-field safety
Herbicides are used on athletic fields to promote healthy turf, which has been shown to
reduce sports injuries (fewer twisted knees and ankles). Weeds can result in reduced lateral
shear strength of turf and can therefore increase the chance for athlete injury (Gardner, 2017).
Weedy turf does not afford the density necessary for safe footing for athletes and is not
desirable for high quality amateur sports or professional sports fields.
4.7 Fire prevention
Safety and productivity requirements often dictate that certain areas on industrial sites, around
enclosed warehouses and exposed stockpiles and warehouses, utility substations, highways,
railways and runways be kept completely weed free (bare ground). This reduces fire hazards
and ensures that maintenance and emergency equipment can access freely the sites and
facilities.
Unmanaged and poorly maintained vegetation along utility rights of way can result in
wildfires, which can result in damage to electric power infrastructure, with potentially serious
economic, environmental, and national security consequences.
5 Impacts of Use Restrictions
5.1 Impacts on Municipal Governments
Municipalities have discovered that there can be additional costs associated with the
maintenance/rebuilding of sports fields, to retain safety standards and usability, should the
fields be attacked by an infestation. In addition, should an infestation occur during the
construction or renovation of a field, there may be revenue loss associated with the delay in
bringing the field(s) back into service, and potential additional costs to bring the field back up
to acceptable use standards.
Impacts of municipal bans appear variable – some larger cities report relatively low or no cost
increases to deal with the bans, while smaller cities report significant costs. For example, one
southeastern Manitoba city has experienced cost increases for field maintenance of
Page 20Benefits of Non-Ag Pesticides in Canada February 2019
"eight/nine fold" (CBC, 2016b) as a results of the 2014 ban in Manitoba. More recently, the
Association of Manitoba Municipalities reports that alternatives to traditional pesticides aren't
as effective and are "incredibly costly," costing 10 to 15 times more (CBC, 2017).
Below are some unedited comments from municipal parks/operations officials in Ontario:
• “Ballfield closures for grass establishment, unplayable surfaces due to insect and disease
problems, more frequent cycle of field renovation. Cost of organic bio-controls for
thousands of acres is prohibitively expensive and not consistently available or effective.”
(City of Hamilton)
• “Expensive! Hand’s on in the field guy… cost to spray is $24 per hectare. Full IPM
overseeding, aerating, topdressing cost is $9000 per hectare for parks turf. All parks are
completely overrun with weeds. Property owners go to Buffalo to buy pesticides” (City of
Brampton)
5.2 Impacts on Schools
A major study published in HortScience in 2015 found that budgetary expenditures for
schools increased as a result of the pesticide ban for schools in Connecticut in 2010 due to
“increased labor requirements, increased cultural practices, and/or increased cost of products
necessary to maintain school grounds and playing fields.” The paper noted that schools “will
continue to struggle with demands for acceptable school grounds and athletic field quality and
balancing expense, especially given the limited literature and resources currently available
that address the management of school grounds without pesticides.” Another major finding of
the study was that cities/towns with higher median incomes (and higher budgets) are better
able to maintain school ground quality and have safer recreation and athletic fields than lower
income school districts due to expense imposed by the pesticide ban in Connecticut
(Bartholomew et al, 2015).
5.3 Impacts on Consumers
Regarding other uses of domestic pest control products, RIAS Inc. (2006) examined the
benefits of herbicides for residential lawns/landscaping. This work cited a study by the
Université Laval that demonstrated a mean price premium of 7.7% across all landscape
attributes and all values of houses from well-kept lawns. Landscape Ontario reports that
properly-maintained natural turfgrass lawns increase property values by 15-20% (Landscape
Ontario, 2018).
The Laval study also found the costs of maintaining consistently high turf quality to be 60
times higher when herbicides are not used. More recent estimates indicate that the cost of
having a lawn professionally treated throughout the season may be $80 to $100 more than it
Page 21Benefits of Non-Ag Pesticides in Canada February 2019
was before provincial/municipal bans came into effect in Canada (CBC, 2016a). When total
loss due to infestation occurs, the cost to re-sod a lawn is considerable – for 1,000 square feet
of lawn, costs to re-sod average about $1,600. Additional costs of $1,000 to $2,000 may also
be incurred for removal of existing material.
Data from Statistics Canada shown in Table 8 below indicates that the effectiveness of the
bans appears to be limited. Since 2007, the number of households in Canada using herbicides
has fallen by only 4 percentage points. In Quebec, one of the first provinces to institute bans
on “cosmetic” use, the number of households with a lawn or garden using herbicides has
actually increased by 12 percentage points. In Ontario, where the ban was implemented in
2008, herbicide use initially fell by 5 percentage points (2009), but by 2015 had risen 9
percentage points – 4 percentage points above the pre-ban level.
Table 8: Domestic Use of Pest Control Products (% of households)
2007 2009 2011 2013 2015
Canada - households with lawn or garden 95% 96% 96% 96% 97%
Herbicide use 80% 75% 76% 76% 76%
Insecticide use 29% 31% 28% 27% 27%
Fungicide 6% 5% 5%E 4% 5% E
Quebec - households with lawn or garden 90% 96% 94% 95% 97%
Herbicide use 46% 36% 37% 56% 58%
Insecticide use 49% 71% 59% 45% 45%
Fungicide -- -- -- 8% E 13% E
Ontario - households with lawn or garden 98% 96% 98% 96% 97%
Herbicide use 79% 74% 77% 77% 83%
Insecticide use 32% 33% 24% 26% 20%
Fungicide 7% 8% E -- 4% E --
Source: Statistics Canada. Table 38-10-0052-01 Use of fertilizer and pesticides
Notes: “E” use with caution, “--” too unreliable to be published.
5.4 Impacts on Businesses
Industrial Vegetation Management
RIAS Inc. (2006) found that restrictions on herbicide use in industrial vegetation management
would have two immediate effects and a more important follow-on effect. The immediate
effects would be an increase in the costs of industrial vegetation management estimated to be
150% (i.e., from about $7.0 million to about $17.5 million) along with a decrease in the
effectiveness of weed control and brush management. The follow-on effect would be an
increase in the events that industrial vegetation management is intended to prevent (i.e.,
power outages through brush contact with transmission lines, the inability to access facilities
quickly for maintenance or in response to an emergency/failure, reduced visibility at
crossroads and the loss of even more land to invasive species).
Page 22Benefits of Non-Ag Pesticides in Canada February 2019
Turfgrass
Although most provincial bans exclude golf courses, RIAS Inc (2006) also found that
restriction of phenoxy herbicides use alone would increase treatment costs at golf courses in
Canada from about $3 million to about $26 million, but without maintaining course quality.
The decline in quality could cost Canadian courses both their regular customers and the high-
profile competitions that bring additional economic benefits to local communities.
Page 23Benefits of Non-Ag Pesticides in Canada February 2019
6 References
Bartholomew, Candace, Benjamin L. Campbell and Victoria Wallace. 2015. Factors
Affecting School Grounds and Athletic Field Quality after Pesticide Bans: The Case of
Connecticut. HORTSCIENCE 50(1):99–103. 2015.
Canadian Association of Physicians for the Environment (CAPE). 2016. Cosmetic Pesticides
– Provincial Policies & Municipal Bylaws: Lessons Learned & Best Practices. August 2016
Canadian Food Inspection Agency (CFIA), 2014. 2013-2014 Departmental Performance
Report. http://www.inspection.gc.ca/DAM/DAM-aboutcfia-sujetacia/STAGING/text-
texte/acco_repparl_2013-2014dpr_1414175730978_eng.pdf
CBC News. 2016a. Cosmetic pesticide ban means dandelions more expensive to fight. May
19, 2016
_________. 2016b. Manitoba pesticide ban needs provincial review, municipalities say
May 30, 2016
_________. 2017. NDP slams Pallister government's plan to revamp pesticide law, but
municipalities welcome change. Apr 19, 2017
Colautti, Robert I., Sarah A. Bailey, Colin D.A. van Overdijk, Keri Amundsen and Hugh J.
MacIsaac. 2006. “Characterised and projected costs of nonindigenous species in Canada”,
Biological Invasions (2006) 8: 45–59.
Cooper Jerry and Hans Dobson (2007) “The benefits of pesticides to mankind and the
environment” Crop Protection Accepted 19 March 2007
Damalas, Christos A. 2009. Understanding benefits and risks of pesticide use. Scientific
Research and Essay Vol. 4 (10), pp. 945-949, October, 2009.
Environment Canada (2013). Recommendations for the Design and Operation of Wood
Preservation Facilities. December 2013.
http://publications.gc.ca/collections/collection_2014/ec/En4-237-2014-eng.pdf
Felsot Allan S. 2011. Pesticides & Health: Myths vs. Realities A Position Paper of the
American Council on Science and Health. June 15, 2011
Health Canada. 2018. Pest Control Products Sales Report for 2016.
Homagain, K., C.K. Shahi, M. Leitch, N.J. Luckai and F.W. Bell. 2011. Differences in
extrinsic tree quality and value of fibre production following alternative vegetation
management treatments in northwestern Ontario. For Chron. 87(2): 251–259.
Page 24You can also read