Engagement of TREM2 by a novel monoclonal antibody induces activation of microglia and improves cognitive function in Alzheimer's disease models ...
←
→
Page content transcription
If your browser does not render page correctly, please read the page content below
Fassler et al. Journal of Neuroinflammation            (2021) 18:19
https://doi.org/10.1186/s12974-020-01980-5

 RESEARCH                                                                                                                                            Open Access

Engagement of TREM2 by a novel
monoclonal antibody induces activation of
microglia and improves cognitive function
in Alzheimer’s disease models
Michael Fassler, Maya Saban Rappaport, Clara Benaim Cuño and Jacob George*

  Abstract
  Background: Genetic variants and mutations in triggering receptor expressed in myeloid cells (TREM2) are associated
  with premature and late onset Alzheimer’s disease (AD).
  Methods: We developed a panel of monoclonal antibodies, the selected lead of which was avidly shown to bind the
  extracellular domain of human and murine TREM2.
  Results: By engaging membrane-bound TREM2, the selected antibody was shown to promote their cellular
  proliferation, uptake of oligomeric beta amyloid/apoptotic neurons, and activation in a Syk and Akt dependent
  manner. The antibody was shown to avidly bind soluble TREM2 in the CSF from AD patients and blunted the
  proinflammatory program driven by its intracerebral injection. Upon in vivo treatment, the antibody was shown
  to improve cognitive function in experimental amyloidopathy models and to facilitate plaque-associated
  microglial coverage and activation.
  Conclusion: Thus, we describe a novel monoclonal antibody targeting membrane bound and soluble TREM2,
  that improves cognitive function by inducing microglial activation and attenuating chronic neuroinflammation.
  Keywords: Neuroinflammation, TREM2, Alzheimer’s disease, Mouse model, Monoclonal antibody

Introduction                                                                            also known as DNAX-activation protein 12 (DAP12)
Alzheimer’s disease (AD), the most common form of de-                                   DAP12/TYROBP [11]. Whereas heterozygous variants in
mentia, is evident histopathologically by the abnormal                                  TREM2 are associated with AD [2, 3, 8], homozygous var-
accumulation of amyloid plaques, hyperphosphorylated                                    iants in TREM2 or its binding partner DAP12/TYROBP
tau aggregates, and microgliosis [21]. TREM2 has been                                   cause polycystic lipomembranous osteodysplasia with
shown to be involved in neuroinflammation and in the                                    sclerosing leukoencephalopathy (PLOSL), also known as
metabolic fitness, proliferation, survival, and phagocytic                              Nasu-Hakola disease (NHD). NHD is a rare autosomal-
capacity of microglia [19].                                                             recessive early-onset dementia characterized by behavioral
  Gene network analyses of human AD brains and mouse                                    changes and cognitive decline, with or without patho-
models of AD have highlighted a central role for microglia                              logical bone fractures [2, 3, 13].
in AD and, in particular, TREM2 and its binding partner                                   The mechanism by which TREM2 influences to neuro-
TYRO protein tyrosine kinase-binding protein (TYROBP),                                  degeneration remains obscure. Furthermore, studies in-
                                                                                        vestigating the impact of TREM2 signaling on the
* Correspondence: jgeorge@bezeqint.net                                                  inflammatory response have produced contradictory
Kaplan Medical Center, 1 Pasternak St, 76100 Rehovot, Israel

                                         © The Author(s). 2021 Open Access This article is licensed under a Creative Commons Attribution 4.0 International License,
                                         which permits use, sharing, adaptation, distribution and reproduction in any medium or format, as long as you give
                                         appropriate credit to the original author(s) and the source, provide a link to the Creative Commons licence, and indicate if
                                         changes were made. The images or other third party material in this article are included in the article's Creative Commons
                                         licence, unless indicated otherwise in a credit line to the material. If material is not included in the article's Creative Commons
                                         licence and your intended use is not permitted by statutory regulation or exceeds the permitted use, you will need to obtain
                                         permission directly from the copyright holder. To view a copy of this licence, visit http://creativecommons.org/licenses/by/4.0/.
                                         The Creative Commons Public Domain Dedication waiver (http://creativecommons.org/publicdomain/zero/1.0/) applies to the
                                         data made available in this article, unless otherwise stated in a credit line to the data.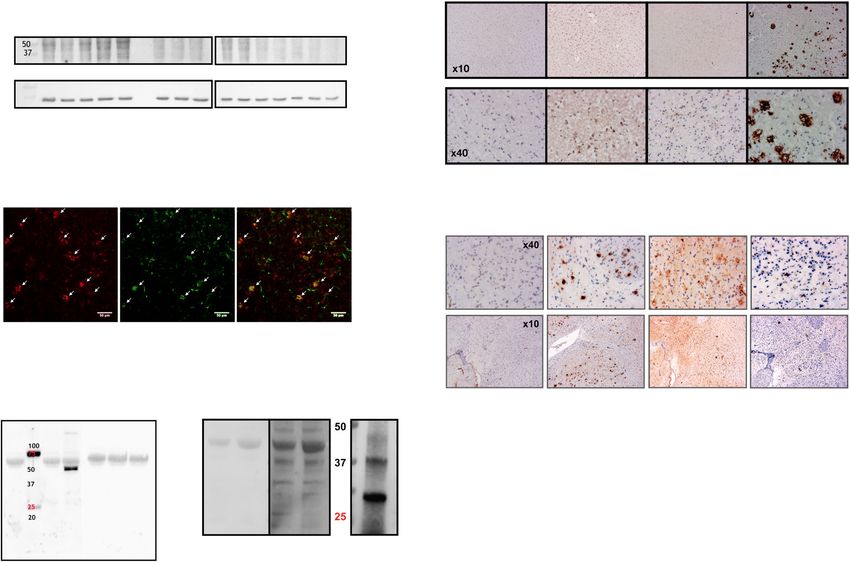
Fassler et al. Journal of Neuroinflammation   (2021) 18:19                                                 Page 2 of 18

results, demonstrating either an anti-inflammatory or        Humanization of Ab-T1
a pro-inflammatory role for TREM2 [4, 6, 7, 15, 18].         Sequencing of mouse IgG was performed by whole tran-
Recent studies have identified a role for TREM2 in           scriptome shotgun sequencing. Antibody sequences were
microglial survival [22], as well in regulating energy       analyzed for specific liabilities based on published pro-
metabolism [20]. Conflicting data has been reported          tein motifs using an in-house system build in Microsoft
on the role TREM2 in phagocytosis [5, 9, 10, 17, 22,         Excel.
23] in humans potentially related to interspecies dif-
ferences [16].                                               Dot blot for Ab-T1 binding assessment
  Herein, we developed a panel of agonistic and antag-       Cell lysates (HEK293T transfected with human or mouse
onistic mAbs, binding the extracellular domain of            TREM2, and Naïve HEK293T as control) were prepared
TREM2 the selected antibody of which was shown to be         in hypotonic buffer (0.01 M Tris, pH 7, 1 mM EDTA, 1
capable of activating microglia expressing TREM2             mM EGTA) freshly supplemented in protease inhibitor
thereby facilitating uptake of oligomeric beta amyloid       cocktail (P8340, Sigma), incubated on ice for 30 min,
and attenuating cognitive decline in amyloidopathy           and pellet resuspended in STE lysis buffer (150 mM
models of Alzheimer’s disease but would also be relevant     NaCl, 50 mM Tis-HCl, pH 7.6, 2 mM EDTA, 1%
to all neurodegenerative diseases.                           Triton-X 100).
                                                                Two micrograms (reduced conditions) of lysate sam-
Methods                                                      ples were loaded into 0.2 μm nitrocellulose membranes
Subjects and tissue sampling                                 (WhatmanProtan BA83, Cat No. 10401380) until dry.
This study was performed at Kaplan Medical Centre in         Samples incubated at 4 °C for 12 h with 1 μg/ml mouse
Rehovot, Israel, under appropriate Institutional Review      Ab-T1, Ab-T2, Ab-T3, Ab-T4, Ab-T5, mouse IgG (nega-
Board approval. Blood samples were obtained from the         tive control) or anti-TREM2 (Abnova MAB2056, 1:1000,
Israel National Blood Services except for CSF and brain      positive control) as primary antibodies diluted in 1%
specimens included in the study which were collected at      BSA/TBST followed by goat anti-mouse conjugated to
the Cambridge Brain Bank supported by the NIHR Cam-          HRP (115-035-003, Jackson, 1:10,000) for additional 1-h
bridge Biomedical Research Centre.                           incubation at room temperature. Membranes were de-
                                                             veloped using Fusion Solo 7S imager system (Vilber,
Animals                                                      France).
5xFAD animals were bred in house (mutations were an-
alyzed using specific primers for PCR genotyping). All       Affinity testing of Ab-T1
housing, breeding, and procedures have been reviewed         Ab-T1 clone was selected and tested for its high affinity
and approved by “The Israel Board for Animal Experi-         to extracellular domain of human and mouse TREM2 in
ments” and in compliance with “The Israel Animal Wel-        surface plasmon resonance (Biacore SPR system, GE
fare Act.” Animals were housed under standard                Healthcare Life Sciences), whereby anti-TREM2 anti-
laboratory conditions, air conditioned, and filtered         bodies are immobilized on the chip surface through an
(HEPA F6/6) with adequate fresh air supply (minimum          anti-mouse capture antibody (BR100838, GE), for ex-
15 air changes/hour). Animals were kept in a climate-        ample, a CM5 sensor chip and the human TREM2 and
controlled environment. Temperatures range was 20–24         mouse TREM2 (SI 50149-M02H, Sino Biological) and
°C and relative humidity range was 30–70% with a 12-h        TREM1 antigens are then run over the chip.
light and 12-h dark cycle.
                                                             Transfection of hTREM2 and mTREM2 into HEK293T cells
Generation of monoclonal antibodies                          Naïve HEK293T cells were transiently transfected
Several clones of monoclonal antibodies (mAbs) were          with constructs expressing human (HG11084-ACG,
produced according to standard protocols by Balb/C           Sino Biological) and mouse (MG50149-ACG, Sino
mice immunization with extracellular domain of human         Biological) TREM2 (fused at the C-terminus with
TREM2 protein followed by three additional boosts.           GFP) using JetPrime-mediated transfection (JetPrime,
After confirming the presence of polyclonal anti-TREM2       Polyplus-transfection) following manufacturer proto-
antibodies in the sera, mice were sacrificed. Cells were     col. Cells transfected with pCDNA-GFP (without an
isolated from their spleens and hybridized with an SP2/0     insert gene) were used as sham control. Transfected
myeloma line, followed by clonal screening for binding       cells were validated by flow cytometry using mouse
to human TREM2. The hybridomas were then grown in            Ab-T1 conjugated to Alexa 488 Fluor (Invitrogen, Cat
serum-free media for 2–3 weeks, and media were col-          No. A10235). FL1–blue laser (488 nm) was used to
lected and concentrated by 30 kDa centricons (Biological     measure TREM2 levels indicated as relative geomean
Industries, Israel).                                         fluorescence intensity (gMFI).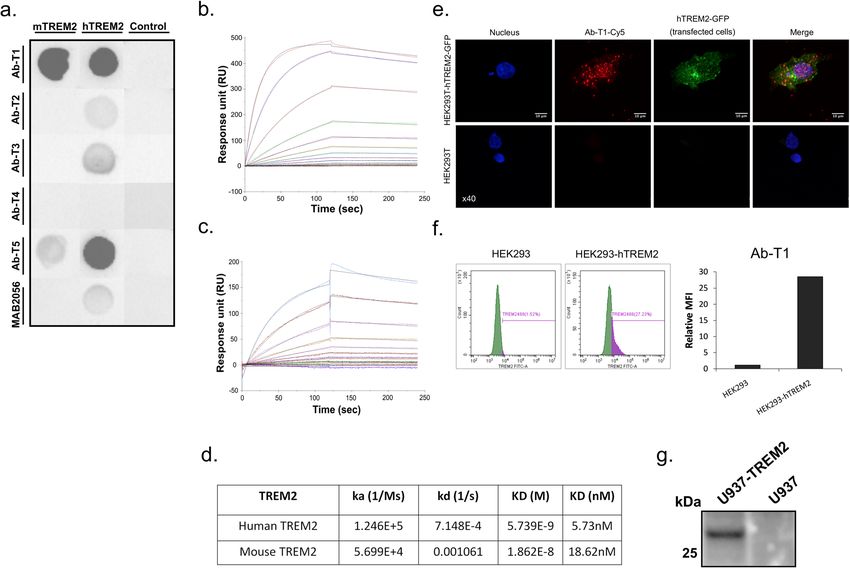
Fassler et al. Journal of Neuroinflammation   (2021) 18:19                                                   Page 3 of 18

Stable cell line generation of U937 cells expressing         Biosystems Newcastle Ltd, UK). Tissues were pretreated
human TREM2                                                  with epitope-retrieval solutions (ER, Leica Biosystems
Naïve U937 cells (CRL-1593.2, ATCC) were transduced          Newcastle Ltd, UK) followed by 30-min incubation with
with lentiviral vector carrying human TREM2 gene. Sin-       primary antibodies mouse Ab-T1 (2.85 μg/ml), anti Iba-
gle clone was screened from cell pool generated by lim-      1 (1:1500), anti-beta amyloid (1:600), and mouse IgG (1
ited dilution and positive clones were selectively           μg/ml). The Leica Refine-HRP kit (Leica Biosystems
expanded.                                                    Newcastle Ltd, UK) was used for detection followed by
                                                             counter-stain with Hematoxylin.
Immunofluorescence staining in cell culture
Transfected and Naïve HEK293T cells (HEK293T-                Immunofluorescentic staining of brain tissues
hTREM2-GFP / HEK293T) were seeded (0.2 × 10⁶/well            Slices were rinsed in 0.3% Triton X-100/PBS (3 × 5
in a 12-well plate) on cover slips coated with 0.1 mg/ml     min). In order to prevent non-specific binding, slices
poly-L-lysine (Sigma) and blocked in 20 mM HBSS              were pre-incubated with blocking buffer (1% bovine
(Gibco) supplemented with 10% FBS for 45 min at room         serum albumin (BSA) and 0.3% Triton X-100 in PBS)
temperature. After 24 h at 37 °C, cells were incubated       for 2 h at room temperature. Slices were incubated with
with 0.5 and 1 μg/ml mouse Ab-T1 conjugated to Cy5           Iba1 antibody (WAKO, 019-19741; 1:1000), mouse Ab-
(mAb-T1-Cy5) as primary antibody (diluted in above           T1 (0.5 μg/ml), or anti CD68 (Santa Cruz Biotechnology,
blocking buffer) for 1 h at room temperature followed        sc-20060 AF488; 1:200) overnight at 4 °C. Slides were
by additional 1 h at 4 °C. Control experiment used iso-      rinsed with 0.3% Triton X-100 in PBS (3 × 5 min)
type control mouse IgG as the primary antibody (K Iso-       followed by incubation with Cy5 goat anti-Rabbit IgG
type control mouse IgG Cy5, Cat# 400115, Biolegend).         (Abcam, ab6564; 1:200) or Alexa Fluor 488 anti-Mouse
Cells were rinsed twice with ice-cold PBS and fixed in       IgG (Abcam, ab150113; 1:200) in blocking buffer for
4% v/v paraformaldehyde for 12 min at room                   additional 2 h at room temperature. Slides were washed
temperature. Cells on cover slips were washed 3 times in     3 times in 0.3% Triton X-100/PBS and a drop of mount-
ice-cold PBS and laid down on a slide with a drop of         ing buffer (DAPI Fluoromount-G. Cat#: 0100-20, South-
mounting buffer (DAPI Fluoromount-G, SouthernBio-            ernBiotech) was added before visualized on a confocal
tech) before visualized on a confocal laser scanning         laser scanning microscope (TCS SP8, Leica).
microscope (TCS SP8, Leica).

Western blotting for TREM2 detection                         Isolation and culture of bone marrow derived
Thirty to twenty-five micrograms of cell lysate/superna-     macrophages
tants/CSF was loaded in each well for SDS-PAGE pro-          Bone marrow-derived macrophages were harvested from
tein separation (reduced conditions) on Nuphage 4–12%        c57BL/6 mice and cultured in DMEM/F-12 medium.
gels (ThermoFisher Scientific, Cat No. NP0322BOX).           Cells were centrifuge at 500×g at room temperature, re-
Samples were transferred to 0.2 μm nitrocellulose mem-       suspended in 10 ml medium, counted and adjusted to a
branes (WhatmanProtan BA83, Cat No. 10401380) and            concentration of 4 × 10⁶/ml in macrophage complete
incubated at 4 °C for 12 h with mouse Ab-T1 (5 μg/ml)        medium (DMEM/F-12 , 10% FBS, pen/strep, L-glu, +M-
or mouse IgG (5 μg/ml control) as primary antibodies         CSF 0.1 nM). Cells were seeded (4 × 10⁵ per 10 ml petri
diluted in 1% BSA/TBST followed by goat anti mouse           dish) in 10 ml macrophage complete medium and incu-
conjugated to HRP (Jackson, 1:10,000) for additional 1h      bated at 37 °C, 5% CO2. On day 3, 4 ml of complete
incubation at room temperature. Membranes were de-           medium were added to each dish and cells were grown
veloped using Fusion Solo 7S imager system (Vilber,          for additional 4 days (total of 7 days) before use.
France).
                                                             Isolation and culture of human peripheral blood
Immunohistochemistry                                         mononuclear cells
Human brain tissue sections from Alzheimer disease pa-       Whole blood was diluted 1:1 ratio with PBS (Ca/Mg
tients and 5xFAD mice were post-fixed in 4% formalin         free), gently laid in density gradient medium (lympho-
for 48 h, dehydrated in ethanol, and embedded in paraf-      prep—Cat#: 04-03-9391/01, Stemcell technologies, ratio
fin. A series of sections was stained for either mouse       1:2), and centrifuged for 30 min, 1500 rpm. Buffy coat
Ab-T1, anti-Iba-1 (Abcam, ab178847), anti-beta amyloid       was collected into a new tube, washed with PBS, and
(Abcam, ab2539)/(Biolegend, 800702 (clone 4G8)), or          centrifuged for 15 min in 1200 rpm. Additional wash
mouse IgG (Abcam, ab37355).                                  with PBS was supplemented, and blood was centrifuged
   Immunohistochemical staining was performed on 4-          for 15 min in 1200 rpm before cells were resuspended in
μm sections using the Leica Bond III system (Leica           10 ml PBS for counting.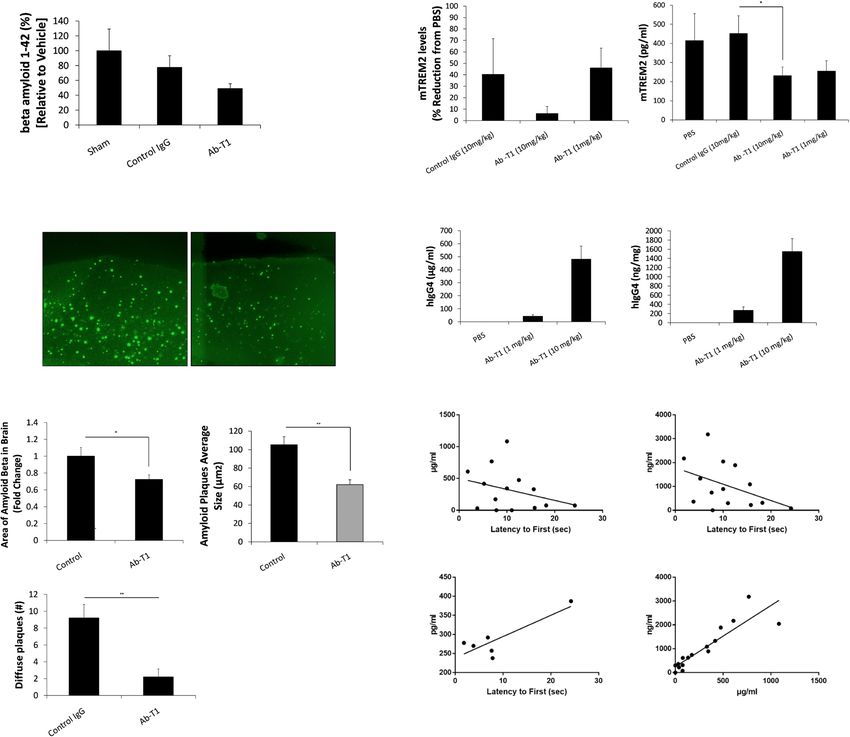
Fassler et al. Journal of Neuroinflammation   (2021) 18:19                                                    Page 4 of 18

Macrophage cell culture differentiated from PBMC’s             uptake indicated as relative geomean fluorescence inten-
Primary human macrophages were differentiated from             sity (gMFI).
peripheral blood monocytes cells (PBMC). After isola-
tion of PBMC’s in a density gradient medium, cells were        Uptake of apoptotic neurons
split into 12-well culture plates (Greiner CELLSTAR            Human SH-SY5Y neuronal cells were stained using
multiwell culture plates, 0.4 × 10⁶ cells/well) and incu-      CFSE cell division tracker kit (BioLegend, Cat #: 423801)
bated at 37 °C, 5% v/v CO2 and 95% v/v O2 for 1 h in a         following manufacturer protocol. Stained SH-SY5Y cells
free serum medium (RPMI 1640, 2 mM L-glutamine, 1%             were seeded (6 × 10⁵ cells/well) in a 12-well tissue cul-
Pen/Strep, Biological Industries). Non-adherent contam-        ture plate and incubated overnight at 37 °C. In parallel,
inated cells were removed and remaining monocytes              BV-2 microglia cells were seeded in two 10 cm tissue
differentiated to human microglia like cells for 10 days       culture plates (7 × 10⁶ cells/plate), one of them incu-
with recombinant human granulocyte-macrophage                  bated with Ab-T1 (5 μg/ml) and the second one with
colony-stimulating factor (GM-CSF, 10 ng/ml; R&D sys-          control IgG (BioLegend, Cat#: 403702) overnight at 37
tems) in a full RPMI medium (RPMI 1640, 10% FBS, 2             °C. The next day, H2O2 (1.6 mM) was added to the
mM L-glutamine, 1% Pen/Strep) and incubated at 37 °C,          stained neuronal cells for apoptosis induction (45 min at
5% v/v CO2 and 95% v/v O2.                                     37 °C). Activated and control microglia cells were added
                                                               to the stained neuronal cells (1 × 10⁶ cells/well) for
                                                               apoptotic cells uptake (1 h). Microglia cells in suspen-
Preparation of beta amyloid oligomers
                                                               sion were collected from each well (only the super-
Lyophilized 1 mg of ultrapure beta amyloid (1-42)
                                                               natant), washed and analyzed using flow cytometry
monomers (A-1167-2, rPeptide, USA) was thawed at
                                                               (FL1–blue laser (488 nm) was used to measure neuronal
room temperature for 10 min followed by addition of
                                                               CFSE uptake indicated as relative geomean fluorescence
sterile DMSO to a final concentration of 5 mM. Beta
                                                               intensity (Relative MFI)).
amyloid was transferred to a new low-binding, sterile 1.5
ml microcentrifuge tube (Protein LoBind Tube 1.5,
                                                               ELISA for assessment of TNF-alpha levels
Eppendorf tubes, Cat no.: 022431081) followed by
                                                               TNF-alpha (TNFα) protein levels in cells were detected
addition of cold phenol-free F12 cell culture media (sup-
                                                               using DuoSet Elisa assay (R&D System) following manu-
plemented with 146 mg/L L-Glutamine; BioSource), di-
                                                               facturer protocol.
luting to a final concentration of 100 μM beta amyloid.
After 15 s of vortex, the tube was placed in 4 °C incuba-
                                                               Lysate preparation
tion for 24 h.
                                                               Cell supernatants, brain, and cell lysates were prepared
                                                               in hypotonic buffer (0.01 M Tris, pH 7, 1 mM EDTA, 1
Uptake of beta amyloid oligomers in cells                      mM EGTA) freshly supplemented in protease inhibitor
Different concentrations of Ab-T1 (0.5, 2, and 10 μg/ml)       cocktail (P8340, Sigma)), incubated on ice for 30 min,
were added to cells with total 1 ml/well new culture           snap frozen, thawed, followed by pellet resuspension in
media (RPMI 1640, 10% FBS, 2 mM L-glutamine, 1%                STE lysis buffer (150 mM NaCl, 50 mM Tis-HCl, pH
Pen/Strep) and incubated at 37 °C for 8 h. Conditioned         7.6, 2 mM EDTA, 1% Triton-X 100), and incubated on
medium with PBS (without Ab-T1) was added to the               ice for 20 min before clarifying and supplemented with
cells as control. 0.3 μM beta amyloid oligomers (1-42)         Laemmli sample buffer for SDS-PAGE protein
conjugated with Alexa 488 (oABeta-488) was added dir-          separation.
ectly to cells in the culture plates and then cells were in-
cubated 37 °C for additional 2 h before harvest (a             Microglia activation by Ab-T1 with Syk/Akt inhibitors
number of wells were incubated without beta amyloid            Mouse BV-2 microglia cells (ICLC cell bank, Cat No.
and Ab-T1 treatment as an additional control). Medium          ICLC ATL03001) were seeded (500,000 cells/well) in a
was removed, centrifuged, and saved for further analysis       12-well tissue culture plate. Prior to studies with micro-
in ELISA assay. Extracellular and cell surface oABeta-         glial activation and proliferation, the EC50 studies were
488 in cell pellet was quenched by incubation of 0.4%          conducted to determine the doses by which to conduct
Trypan blue in PBS (pH 4.4) for 1 min (adding directly         the main experiments. After 2 h, different concentra-
in to the cells in the plates). Cells were washed and re-      tions of MK-2206 Akt inhibitor (ENZO, Cat: ENZ-
moved from culture plate by adding ice-cold PBS con-           CHM164-0005, 12 nM, 65 nM, 100 nM), R406 Syk in-
taining 2.5 mM EDTA, followed by incubation on ice for         hibitor (BioVision, Cat #: 9682-5, 0.05, 0.1, 0.5, and 1
30 min. Flow cytometry (CytoFLEX, Beckman coulter -            μM), or DMSO (control) were added and incubated with
FL1–blue laser (488 nm)) was used to measure beta              cells for 1 h at 37 °C. Two concentrations of Ab-T1 or
amyloid oligomers (conjugated to Alexa Fluor 488)              control IgG (5 μg and 10 μg) were added to the cells for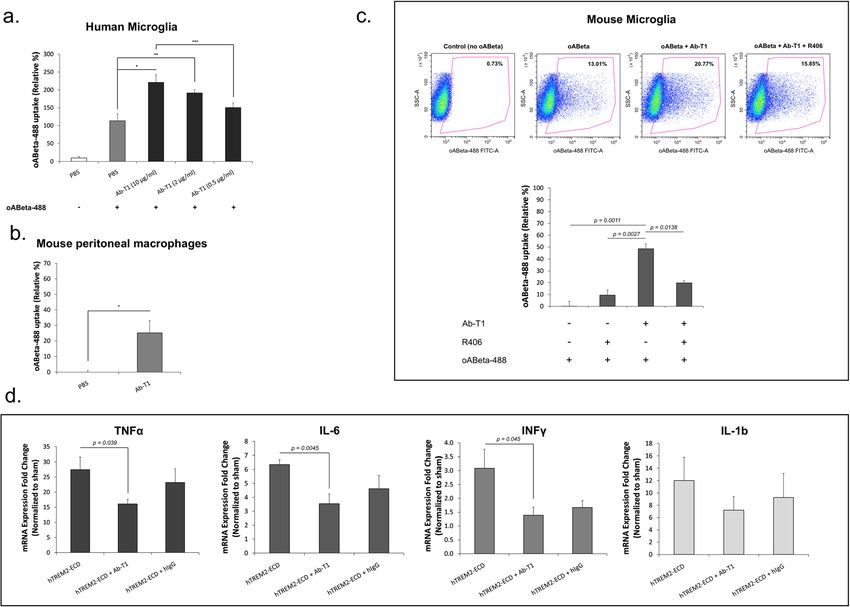
Fassler et al. Journal of Neuroinflammation   (2021) 18:19                                                 Page 5 of 18

overnight incubation at 37 °C. The next day, supernatant     anti human Fc (Invitrogen, Cat#: H10500, 10 μg/ml) in-
and cells were saved in order to examine neuroinflam-        cubation at 37 °C for 10 min. After treatment, cells were
matory markers (TNFα and IL-1β levels) using Elisa or        spin down (2500×g, 10 min) and washed with cold PBS
quantitative RT-PCR. Relative quantitation of gene ex-       containing protease and phosphatase inhibitors (1 mM
pression was conducted by real-time PCR carried out          Na3VO4, 10 mM NaF, and protease inhibitors cocktail
using TaqMan® Gene Expression Assay (Applied                 (Sigma, P-8340, 1:100)). Cells were centrifuged (12,000
Biosystems).                                                 RPM, 5 min, 4 °C), aspirated with PBS, and lysed with
                                                             full lysis buffer (150 mM NaCl, 25 mM Tris, pH 7.5, Tri-
The effect of Ab-T1 on Syk phosphorylation in BMDM           ton, 0.5 mM EDTA, protease inhibitor cocktail, 1 mM
At the day of experiment, bone marrow-derived macro-         Na3VO4, 10 mM NaF). Cell debris were removed by cen-
phages (BMDM) were harvested using Trypsin LE                trifuging samples at ~ 14,000×g for 15 min and kept on
(ThermoFisher Scientific, Cat#: 12604054) and re-            ice till SDS-PAGE.
suspended in 10 ml starvation medium (1% FBS), for 4 h         Twenty-five micrograms of lysates per sample were
at 37 °C. Next, cells were divided into sample tubes (1.2    loaded in each well for SDS-PAGE protein separation on
× 106 cells/ml starvation medium). Five micrograms of        Nuphage 4–12% gels (ThermoFisher Scientific, Cat No.
Ab-T1 were added to samples for 2 or 5 min incubation        NP0322BOX). Samples were transferred to 0.2 μm nitro-
on ice. For positive control, 0.1 mM of Na3VO4 (Enzo,        cellulose membranes (WhatmanProtan BA83, Cat No.
Cat#: ALX-400-032-G025) together with 0.3 nM of              10401380) and incubated at 4 °C for 12 h with rabbit
H2O2 were added and cells were incubated at 37 °C for        anti Phospho-Akt (Cell signaling, Cat #: 4060S; 1:2000)
10 min. After treatment, cells were spin down (2500×g,       or Rabbit anti Akt (Cell signaling, Cat #: 9272S; 1:1000)
10 min) and washed with cold PBS containing protease         as primary antibodies diluted in 5% BSA/TBST followed
and phosphatase inhibitors (1 mM Na3VO4, 10 mM NaF           by goat anti mouse conjugated to HRP (Jackson, 1:10,
(New England Biolabs, Cat#: P0759), and protease inhib-      000) for additional 1h incubation at room temperature.
itors cocktail (Sigma, P-8340, 1:100)). Cells were centri-   Membranes were developed using Fusion Solo 7S imager
fuged (12,000 RPM, 5 min, 4 °C), aspirated with PBS,         system (Vilber, France).
and lysed with full lysis buffer (150 mM NaCl, 25 mM
Tris, pH 7.5, Triton, 0.5 mM EDTA, protease inhibitor        Proliferation assay
cocktail, 1 mM Na3VO4, 10 mM NaF). Cell debris were          Different concentrations of Ab-T1 and control IgG (2, 5,
removed by centrifuging samples at ~ 14,000×g for 15         and 10 μg/ml) were added to BMDM cells (7 × 10⁵
min and kept on ice till immunoprecipitation (IP).           cells/well) with total 1 ml/well new culture media and
  Lysates were immunoprecipitated with monoclonal            incubated at 37 °C for 72 h. Conditioned medium with
antibody to mouse Syk (SYK-01, EXBIO, Cat #: 11-376-         PBS (without antibody treatment) was added to the cells
C100), 2 μg per sample bound to A/G PLUS-Agarose             as control. Cell proliferation was measured by flow cy-
beads (SantaCruz Biotechnology, Cat #: sc-2003) follow-      tometry (Quantifying cell population growth). Results
ing manufacturer’s instructions, then separated by SDS–      are mean of four repeated experiments (3 wells for each
PAGE protein separation on Nuphage 4-12% gels (Ther-         sample per experiment).
moFisher Scientific, Cat #: NP0322BOX) and transferred
to Protran nitrocellulose membranes. Membranes were          Regional distribution phenotype assessment of plaque-
analyzed by immunoblot for phosphorylated Syk using          associated microglia
mouse anti-Phosphotyrosine antibody (G410, Merck,            Tissues were fixed in 4% PFA, dehydrated in ethanol,
Cat #: 05-321; 1:1000) following peroxidase-AffiniPure       and embedded in paraffin. Sequential double immuno-
goat anti-mouse IgG (Jackson; 1:10,000) before enhanced      histochemical staining was performed on 4-μm sections
chemiluminescence development (Fusion Solo 7S imager         using the Leica BOND-MAX system (Leica Biosystems
system, Vilber, France).                                     Newcastle Ltd, UK). Tissues were pretreated with
                                                             epitope-retrieval solution (ER1, Leica Biosystems, Cat#:
Akt phosphorylation in activated BMDM                        AR9961 Newcastle Ltd, UK) for 5 min followed by 30-
At the day of experiment, BMDM were harvested using          min incubation with Beta-Amyloid (1:600, Abcam ab
Trypsin LE (ThermoFisher Scientific, Cat#: 12604054)         2539) and Iba1 (Abcam, ab125212, 1:1500) primary anti-
and re-suspended in 10 ml starvation medium (1% FBS),        bodies (sequential double immunostaining). The Poly-
for 4h at 37 °C. Next, cells were divided into sample        mer Refine-HRP kit (Cat#: DS9800) for microglia
tubes (3 × 10⁶ cells/ml starvation medium). Five micro-      staining and the Refine-Red kit (Cat#: DS9390) for beta
grams of Ab-T1 or human control IgG (BioLegend,              amyloid plaque staining (Leica Biosystems Newcastle
Cat#: 403702) were added to samples for 2 or 10 min in-      Ltd, UK) were used for enzymatic detection and tissues
cubation at 37 °C followed by cross linking with goat        were counter-stained with Hematoxylin. An investigator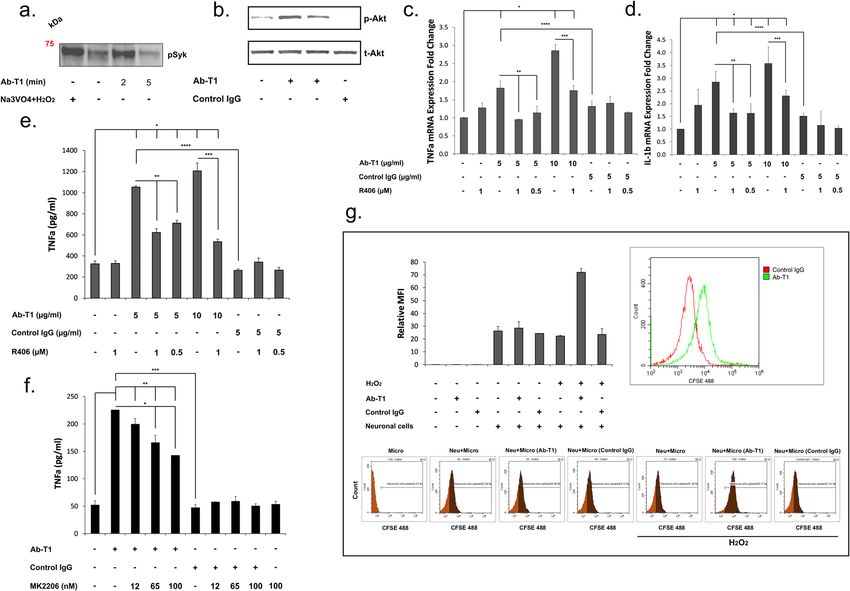
Fassler et al. Journal of Neuroinflammation   (2021) 18:19                                                 Page 6 of 18

blinded to the animal clinical data outlined the cor-        = 3). A single needle insertion (coordinates: − 2.2 mm
tical (Primary motor cortex (M1) and S1HL) or hip-           relative to bregma, 2.0 mm from midline) into the right
pocampal (CA1, CA2, CA3, and DG) region of                   hemisphere was used to target the inoculum to the
interest on each slide using a brightfield auto cell im-     hippocampus located at a depth of 2 mm below the
aging system (EVOS FL Auto Cell Imaging System,              dura. Material was injected via a 10 μl Hamilton syringe
ThermoFisher Scientific). Twenty of 80 × 80 μm               at a rate of 0.4 μl per min (5 μl total volume) with the
counting frames at × 20 magnification were randomly          needle in place (33G) for ≥ 10 min at each target. Ani-
selected in each region (cortical or hippocampal) in         mals were inoculated at the right hemisphere unless
which plaque associated microglia was counted by             otherwise indicated. Twenty-four hours post-intra hip-
separate tags for stage I, II and III using ImageJ soft-     pocampal injections, animals were sacrificed, and brains
ware to estimate the total number of microglia (stage        were dissected and homogenized. In order to examine
I, II, and III) in the defined area. Different stages of     neuroinflammation, relative quantitation of gene expres-
activation were defined morphologically as previously        sion was conducted by real-time PCR carried out using
described [1]. Data from four serial sections of tissue      TaqMan® Gene Expression Assay (Applied Biosystems).
were averaged to obtain composite average densities
of plaque-associated microglia in each region (average       The influence of treatment with Ab-T1 in the 5xFAD
number of plaques in 20 frames from 4 serial sections        Alzheimer’s disease animal model
(total of 80 frames in each region) in each brain sam-       Thirty-seven female (4 groups of n = 9, 9, 10, 9) 5xFAD
ple from a group of mice). The number of plaques             mice (4–5 months of age) were anesthetized by Isoflur-
analyzed ranged from 100 to 150 in each brain.               ane, intraperitoneal (i.p.) injected with anti-CD4 (clone
  The number of diffuse amyloid beta deposits (immu-         GK1.5, InVivoMAb, BE0003-1) for CD4 cell depletion 6
nostaining with anti-amyloid beta, clone 4G8) in the         days pre-treatment (experiment 1). Mice were treated i.p
cerebral cortex of 5xFAD mice was measured in three          with humanized Ab-T1 (1 mg/kg and 10 mg/kg, n = 9,
image frames per section at × 20 magnification (3 frames     10), human IgG (10 mg/kg, n = 9), and PBS as sham
in 4 serial sections = total 12 frames in each brain sam-    control (n = 9) once every 2 weeks for 3 months. Behav-
ple). Images were captured using a digital slide scanner     ior tests (NOR and MWM) were conducted at various
(Motic, China), converted to gray scale, and segmented       predetermined time points before they were sacrificed at
with an auto threshold command (ImageJ).                     12 weeks post injections by overdose with ketamine/
                                                             xylazine. For histological studies, the brain was removed
Thioflavin S staining for detection of beta amyloid          and the left hemisphere underwent overnight postfixa-
plaques                                                      tion with neutral-buffered formalin (Thermo Fisher Sci-
Brains from 5xFAD mice were extracted and post-fixed         entific), before being processed and embedded in O.C.T
in 4% PFA for 48 h and sunk in 30% sucrose. Brains           compound (Ref 4583, Tissue-Tek) for cryosectioning
were frozen on a cryotome platform and cut to generate       and immunostaining (Thioflavin S staining (Sigma, Cat#:
16- and 40-μm-thick sections. Sections were mounted          T1892)) and immunohistochemistry. For biochemical
on a glass slide and allowed to completely air dry prior     studies, right hemisphere brain tissues were immediately
to staining. Slides were washed with 70% ethanol (1          frozen after removal and stored at − 80 °C until used.
min) and 80% ethanol (1 min) followed by incubation          CSF and blood was taken from 20 animals (5 from each
with filtered thioflavin S (Sigma, Cat#: T1892) for 15       group). Blood was examined for hematological and bio-
min in the dark. Thioflavin S stained slides were washed     chemical parameters. TREM2 protein levels in CSF and
with 70% ethanol (1 min), 80% ethanol (1 min), and           serum were detected using mouse TREM2 sandwich
twice with distilled water before mounted in an aqueous      ELISA kit (Cat#: LS-F7884, LifeSpanBioSciencesInc) fol-
mounting media. The green fluorescence stained plaques       lowing manufacturer protocol. Ab-T1 protein levels in
were visualized with fluorescent microscopy (EVOS FL         brain and serum were detected using human immuno-
Auto Cell Imaging System, ThermoFisher Scientific).          globulin 4 (hu IgG4) sandwich ELISA kit (Invitrogen,
                                                             Cat#: BMS2095). Amyloid beta protein levels in brain
Assessment of neuroinflammatory markers induced by           were detected using human amyloid beta 1-42 sandwich
intracerebral injection of soluble TREM2 in vivo             ELISA kit (Invitrogen, Cat#: KHB3544). In order to
Twenty-four female (n = 3, 7, 7, 7) 5xFAD mice (12–14-       examine neuroinflammation, relative quantitation of
week-old mice) were anesthetized by Isoflurane, and          gene expression was conducted by real-time PCR carried
stereotaxically injected with human TREM2-ECD (3.6           out using TaqMan® Gene Expression Assay (Applied
μg of TREM-ECD per brain) in PBS with and without            Biosystems).
treatment (7.5 μg of Ab-T1 or hIgG4). Control sham             Experiment 2 was carried out in cognitively intact ani-
C57BL/6JRccHsd 5xFAD animals received sterile PBS (n         mals. Twenty-one female (3 groups of n = 7) 5xFAD
Fassler et al. Journal of Neuroinflammation (2021) 18:19 Page 7 of 18
mice (2 months of age) were anesthetized by Isoflurane, Netherlands). Memory was operationally defined by the
and intraperitoneal (i.p.) injected with anti-CD4 (clone discrimination index for the novel object (DI) as the pro-
GK1.5, InVivoMAb, Cat#: BE0003-1) for CD4 cell deple- portion of time animals spent investigating the novel ob-
tion 6 days pre-treatment. Mice were treated i.p with hu- ject minus proportion spent investigating the familiar
manized Ab-T1 (0.5 mg/kg and 5 mg/kg) and PBS as one in the testing period [Discrimination Index, DI =
sham control once a week for 2 months. Behavior tests (novel object exploration time − familiar object explor-
(NOR and MWM) were conducted at various predeter- ation time)/(novel exploration time + familiar object
mined time points before they were sacrificed at 8 weeks exploration)].
from beginning of experiment by overdose with keta-
mine/xylazine followed by transcardial perfusion with Morris water maze
PBS. For histological studies, the brain was removed and The Morris water maze task requires mice to find a sub-
the right hemisphere underwent overnight postfixation merged platform in a large circular pool of water. This
with neutral buffered formalin (Thermo Fisher Scien- version of the task is a reference memory task where
tific), before being processed and embedded in O.C.T mice solve the task by learning the spatial relationships
compound (Ref 4583, Tissue-Tek). For biochemical between the platform location and the extra-maze land-
studies, left hemisphere brain tissues were immediately marks in the testing environment. The experimental
frozen after removal and stored at − 80 °C until used. apparatus consisted of a circular water tank (diameter =
100 cm; height = 40 cm) containing water at 22 °C to a
RNA purification and RT-PCR from brain tissue depth of 32 cm. A platform (10 × 10 cm) was submerged
Animals were sacrificed, and brains were dissected and 1 cm below the water surface and placed at the midpoint
homogenized. RNA was isolated using SV total RNA iso- of one quadrant. The pool was placed in a test room
lation system kit (Promega, Cat#: 20-410-100) following homogenously brightened and containing various prom-
the manufacturer’s protocol. Complementary DNA inent cues. Mice were transferred from the housing facil-
(cDNA) synthesis was carried out with qScript cDNA ity to the behavior room at least 30 min before testing to
Synthesis Kit (Quanta bio, Cat#: 95047) using 2 μg of adjust to the new environment. The swimming paths of
total RNA as template. In order to examine neuroin- the animals were recorded using a video tracking system.
flammation, relative quantitation of gene expression was On day 1, navigation to a visible platform (The water
conducted by real-time PCR carried out using TaqMan® was clear in the water tank and a flag was placed on the
Gene Expression Assay (Applied Biosystems, Cat#: platform to increase visibility) was carried out to evalu-
4369016). Fluorescent (FAM)-labeled IL-6, TNFα, INFγ, ate visual and motor abilities of animals and both the
and IL-1b were normalized to an internal control, platform and starting direction change in each trial (pool
GAPDH. All comparisons refer to sham. Analysis was was divided to 4 quadrants). Mice were gently placed
done using the Comparative Ct Method (ΔΔCT). into the water, facing the edge of the pool. If they failed
to find the platform after 60 s, they were guided to its lo-
Behavioral assessment cation and allowed to stay there for 20 s before returning
Novel object recognition them to their home cage. Mice that manage to find the
Twenty-four hours before testing, all animals were habit- platform were allowed to stay 5 s before their return.
uated to the testing apparatus for 10 min (50 cm box, 40 Mice were submitted to 5 trials per day with an inter-
cm high). The day after, animals were introduced to the trial interval of at least 45 min. On days 2–5, the flag
objects: first, two identical objects were placed in the was removed from platform and aqueous acrylic emul-
box, and mice were allowed to explore objects for 5 min. sion paint was added to the water so that the submerged
The same procedure continued until 5 mice were done. platform will not be visible from the surface of the
The entire phase for 5 mice lasted 30 min. Immediately water. Memory-acquisition trials (training) were per-
after, these 5 mice were tested in the same order as be- formed five times daily with a 45-min inter-trial interval
fore. Animals were introduced to two different objects, to reach a steady state of escape latency. The platform
one familiar object and one novel object that the mice position remained constant while the starting direction
never encountered. Mice were allowed to explore objects changed. Mice failing to find the platform within 60 s
for 5 min and then removed from the box. At all phases, were placed on the platform for 20 s at the end of the
after each mouse was removed from the box, the box trial. On day 6, the platform was removed from the pool
was sterilized with alcohol. Sample and novel objects and the starting direction for the single trial was at the
and their locations were counterbalanced across animals. farthest (North) point from the platform quadrant used
Each trial was videotaped, and time and frequency spent on days 2–5 (Southwest) so that the mice would travel
with each object was measured using NoldusEthoVision some distance before entering the previously learned
XT 11.5 (Noldus information Technology, The platform quadrant. One probe trial (60-s long) wasFassler et al. Journal of Neuroinflammation (2021) 18:19 Page 8 of 18
performed for each animal. NoldusEthoVision XT 11.5 performed using SPSS or Prism 8. P = 0.05 was defined
(Noldus information Technology, The Netherlands) soft- as the level of significance. Unless otherwise indicated,
ware was used so that the camera can create physical in vitro data shown represent three independent experi-
distance information from pixel-based information after mental repeats with triplicate technical repetition.
calibrating and defining parameters (dividing pool into 4
quadrants) in order to track path length, escape latency, Results
and time spent in each quadrant. Ab-T1 recognizes TREM2 expressed on transfected
Animal studies performed were blinded. Transgenic HEK293T, stable U937 expressing cells, and exhibits a
animals were randomly selected for treatment. Behav- high affinity to human and mouse TREM2
ioral assessment data were analyzed identically (regard- A number of monoclonal antibodies against TREM2
less of treatment selection) using NoldusEthoVision XT were generated (hybridoma cells).
11.5 software. In order to evaluate the binding characteristics and af-
finity of monoclonal anti-TREM2 clones, cross-reactivity
Statistical analysis of mAbs with human TREM2 was confirmed by a num-
Values shown in the figures are presented as mean ± ber of immunoassays (Fig. 1a–d). Human embryonic
SEM unless otherwise mentioned. P values for determin- kidney cells (HEK) were transfected with a DNA con-
ation of the statistical significance of differences were struct expressing human or mouse TREM2 (HEK-
calculated by means of paired, two-tailed Student’s t test, hTREM2-GFP or HEK-mTREM2-GFP) to evaluate
two-tailed Mann-Whitney U test. Statistical analysis was mAbs binding to a full human or mouse TREM2 protein
Fig. 1 Binding of Ab-T1 to TREM2. a Binding of the mouse IgG antibodies Ab-T1, Ab-T2, Ab-T3, Ab-T4, Ab-T5, and control anti human TREM2 Ab to
human and mouse TREM2 expressed in HEK293T cells by dot blot assay. Control naïve HEK293T cells (control) used as negative control. Binding affinity
sensograms of Ab-T1 to (b) human TREM2 and (c) mouse TREM2 as measured by surface plasmon resonance (BiaCore). d Ab-T1 binding affinity table;
“Ka” refers to the association rate constant; “kd” refers to the dissociation rate constant; and “KD” refers to the affinity constant. e Confocal images of
Ab-T1 immunostaining non-permeabilised HEK293T transfected with wild type hTREM2-GFP (upper panels) and parental HEK293T (lower panels).
Nuclei stained with DAPI. f Human TREM2 expression levels on transfected HEK293T cells recognized by Ab-T1. The y-axis represents the relative mean
fluorescence intensity (relative MFI) measured by flow cytometry. g Western blot showing human TREM2 detection on stable U937 cell line recognized
by Ab-T1Fassler et al. Journal of Neuroinflammation (2021) 18:19 Page 9 of 18
expressed on their surface. In HEK293T stable cells ex- (Fig. 2d; Microglia) and amyloid plaques (Fig. 2d; beta
pressing TREM2, dot blots of the cell lysates were amyloid). No staining was seen with the control IgG.
probed with different mAbs generated (Fig. 1a). Ab-T1
and Ab-T5 had the highest binding affinity compared to Ab-T1 binds soluble TREM2 in supernatants of TREM2
a commercial detection antibody to human TREM2 (Fig. transfected cells and CSF of human Alzheimer’s disease
1a; MAB2056) while Ab-T1 showed the highest affinity patients
to mouse TREM2. No binding was seen in naïve cells Soluble TREM2 was detected by Western blotting the
(Fig. 1a; control). Ab-T1 clone was further investigated conditioned medium from HEK293 cells transfected
to test its binding affinity in surface plasmon resonance with TREM2 (Fig. 2e; hTREM2). Ab-T1 detected soluble
(Biacore SPR system, GE Healthcare Life Sciences) (Fig. TREM2 in supernatants of HEK293T cells transfected
1b, c) to human TREM2 extracellular domain (TREM2- with human TREM2 (HEK293T-hTREM2) and not in
ECD) and mouse TREM2-Fc conjugated (mouse naïve HEK293T cells (control) or sham control as shown
TREM2). Ab-T1 binding affinity to human TREM2 (Fig. in Western blots (Fig. 2e—Ab-T1 staining). Control
1b, d; KD = 5.73 nM) and mouse TREM2 (Fig. 1c, d; KD mouse IgG antibody (control Ab) did not detect any
= 18.63 nM). Ab-T1 was chosen for further testing. soluble TREM2 forms in transfected HEK293T cells
Non-permealised expressing hTREM2 HEK293T cells (Fig. 2e–control IgG). Human CSF from Alzheimer’s dis-
(Fig. 1e, f) and stably expressing hTREM2 U937 cells ease patients was blotted with Ab-T1 to determine its
(Fig. 1g) showed high levels of TREM2 expression when ability to bind endogenous soluble human TREM2. Ab-
probed with Ab-T1 monoclonal antibody. There was no T1 detected soluble TREM2from AD patients CSF (Fig.
TREM2 expression seen in HEK293T (Fig. 1e, f) and 2f—Alz 93 and Alz 48, right panel) as compared to con-
U937 (Fig. 1g) naïve cells probed with Ab-T1. No bind- trol IgG (Fig. 2f—Alz 93 and Alz 48, left panel).
ing was evident to sTREM1 or TREML1. TREM2-ECD was used as positive control.
Ab-T1 enhances acute microglial activation and promotes
Ab-T1 recognizes soluble and membranous TREM2
uptake of beta amyloid
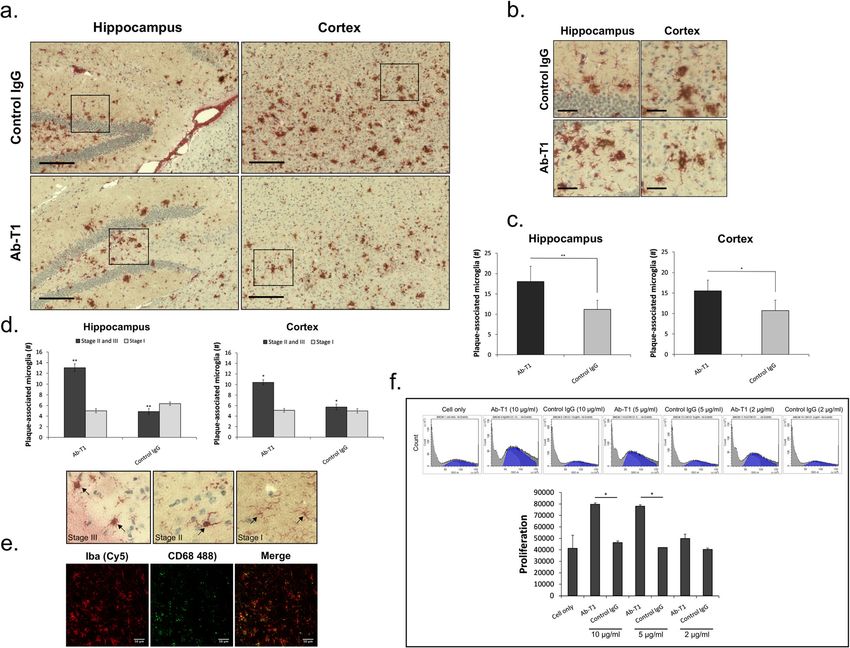
Ab-T1 was shown to bind its target TREM2 in a panel
Flow cytometry was used to measure beta amyloid oligo-
of entorhinal segments human brains (entorhinal cortex;
mers conjugated to Alexa Fluor 488 (oABeta-488) cellular
ento cortex)) from Alzheimer’s disease patients and
uptake (calculated by relative % of geomean fluorescent
healthy subjects seen in Western blot (Fig. 2a). It can be
intensity (Relative %)) (Fig. 3a–c). Flow cytometry analysis
clearly observed that several bands representing several
shows that Ab-T1 increases human microglia like cells’
TREM2 fragments are detected by the antibody repre-
cellular uptake of oABeta conjugated to Alexa Fluor 488
senting soluble clipped forms in the extracellular space
in a dose-dependent manner (Ab-T1; 0.5 μg/ml: 140%, 2
and internalized degraded form of the membranous pro-
μg/ml: 185% and 10 μg/ml: 205%) compared to cells with
tein. There was no binding to TREM2 in a negative con-
control treatment (PBS; 100%) seen in Fig. 3a. As shown
trol human tissue lysate which do not express TREM2
in Fig. 3b, Ab-T1 increases mouse peritoneal macrophages
protein (Fig. 2a, NC).
cellular uptake (Ab-T1; 25.14 ± 7.94%) of oligomeric
amyloid beta conjugated to Alexa Fluor 488 (oABeta-488)
Ab-T1 robustly stains TREM2 in Alzheimer’s disease brains relative to sham treatment (PBS; 0 ± 1.09%, P = 0.039).
and co-localizes with resident microglia Mouse microglia cells showed an increase in oAbeta-488
To verify the binding of Ab-T1 evident in the Western cellular uptake (Fig. 3c—Ab-T1; 48 ± 4.07%) relative to
blot, we used immunohistochemical studies employing sham treatment (Fig. 3c–control; 0.02 ± 4.16%, P =
the antibody. Ab-T1 stains TREM2 in human Alzhei- 0.0011). Pre-incubation of microglia cells with Syk inhibi-
mer’s disease brain tissue samples seen by immunohisto- tor (R406) attenuated ABeta-488 uptake (Fig. 3c—Ab-T1
chemistry staining (Fig. 2b panel), demonstrating its + R406; 19.76 ± 2.22%, P = 0.0138) suggesting Syk phos-
ability to recognize TREM2 in multiple patients with phorylation is required for the uptake.
Alzheimer’s disease and co-localize with resident micro-
glia (Iba1; Microglia) near beta amyloid plaques in ento- Ab-T1 attenuates neuroinflammation induced by
rhinal cortex. As the IHC studies were performed on intracerebral injection of soluble TREM2 in vivo
consecutive studies, we employed double immunofluor- (suppression of chronic microglial activation)
escence studies showing that TREM2 colocalizes with It is known that CSF levels of sTREM2 are elevated in
markers of microglia (panel 2c). To further confirm the neuroinflammatory diseases as Alzheimer’s disease and
relevance to the rodent models, Ab-T1 was shown to de- multiple sclerosis [14] and potentially promote neuroin-
tect TREM2 in brains of 5xFAD Alzheimer’s disease flammation [24]. Mice were injected with human-soluble
mice (Fig. 2d) and co-localize with resident microglia TREM2 (TREM2-ECD) into the hippocampus (with andFassler et al. Journal of Neuroinflammation (2021) 18:19 Page 10 of 18
a. b. Control IgG TREM2 Microglia Beta amyloid
Control ento cortex Alz ento cortex
1 2 3 4 5 A B C D E F G H I NC
TREM2
GAPDH
c. Iba1 (Cy5) TREM2 (488) Merge d.
Control IgG Beta amyloid TREM2 Microglia
e. f. AD CSF
D
EC
l 2
M rol M
2
6 8 6 8 2-
ro EM
nt am RE nt am RE z9 z4 z 9 lz 4
Co Sh hT Co Sh hT Al Al Al A TR
Control IgG Ab-T1
Ab-T1 Control IgG
Fig. 2 Recognition of TREM2 in AD models/human by Ab-T1. a Western blot showing Ab-T1 binding to human entorhinal cortex extracts from Alzheimer/
control group patients. HEK293T protein lysate was used as negative control (NC). GAPDH as “housekeeping” protein loading control is shown in lower panels.
b Immunohistochemistry staining showing Ab-T1 binding to human brain sample (entorhinal cortex sections) from Alzheimer’s disease patient (TREM2) with
microglia and beta amyloid staining of same human brain tissue sample. Mouse IgG was used as negative control staining. c Confocal microscope scan images
showing co-localization of TREM2 (mouse Ab-T1) with resident Iba1 positive cells (Microglia) in 5xFAD mice brain slices (white arrows). d Immunohistochemistry
staining showing Ab-T1 binding to brain tissue from 5xFAD mice (TREM2) with microglia and beta amyloid staining of same mice tissue sample. Mouse IgG
was used as negative control. e Western blots of supernatants (left panel) for soluble TREM2 detection in parental HEK293T vs. HEK293T-hTREM2 cells using
mouse Ab-T1 and mouse IgG1 as control Ab. Transfected HEK293T cells with no insert DNA vector were used as sham. f Western blots of soluble hTREM2
detection in human CSF from Alzheimer patients using Ab-T1 and mouse IgG1 as control IgG antibody. TREM-ECD represents soluble TREM2 recombinant
protein control
without Ab-T1 or hIgG treatment) aiming to test the Ab-T1 enhances activation of TREM2 expressing cells in a
effect of Ab-T1 on the neuroinflammatory response Syk-dependent manner
triggered by soluble TREM2. Ab-T1 downregulated a Ab-T1 activation of trem2 expressing cells was tested in
panel of pro-inflammatory cytokines that were in- a number of immunoassays (Fig. 4). In order to investi-
duced in murine brains after 24 h of exposure to hu- gate if Ab-T1 induces tyrosine phosphorylation of cellu-
man TREM2-ECD (Fig. 3d). Figure 3d shows that Ab- lar proteins such as Syk or Akt, TREM2 expressing bone
T1 significantly downregulates TNF-α (P = 0.039), IL-6 marrow-derived macrophages (BMDM) were stimulated
(P = 0.0045), and INFγ (P = 0.045) mRNA expression with Ab- with protease and phosphatase inhibitors be-
levels after intracerebral injection of soluble TREM2 fore they were immunoprecipitated or blotted with an
compared to no treatment (Fig. 3d; hTREM2-ECD; anti Syk or Akt antibody (Fig. 4a, b). Hydrogen peroxide
TNF-α: P = 0.039, IL-6: P = 0.0045, and INFγ: P = with sodium orthovanadate (Fig. 3d; Na3VO4 + H2O2)
0.045). There was no significant downregulation seen used as positive control and Ab-T1 (Fig. 4a; Ab-T1) in-
by the human IgG control (Fig. 3d; hTREM2-ECD + creased Syk phosphorylation in BMDM as seen in mem-
hIgG; TNF-α (P = 0.49), IL-6 (P = 0.14), and INFγ (P = brane blotted with anti-phosphotyrosine antibody. In a
0.097)). Ab-T1 did not have an effect on IL-1b levels similar experiment, Fig. 4b shows induction of Akt phos-
(Fig. 3d; IL-1b). phorylation in BMDM extracts seen in Western blotFassler et al. Journal of Neuroinflammation (2021) 18:19 Page 11 of 18 Fig. 3 Ab-T1 augments uptake of beta amyloid in a Syk-dependent manner and reduces inflammation triggered by IC delivery of soluble TREM2. Ab-T1 increases uptake of labeled oligomeric beta amyloid a in human microglia derived from differentiated human PBMC’s, b murine peritoneal macrophages, and c murine microglia in a Syk dependent manner (R406). The y-axis represents the relative geometric mean (gMFI) measured by flow cytometry. Results are mean of three repeated experiments with duplicate technical sample repetition. d Intracerebral delivery of sTREM2 with Ab-T1 attenuates the neuroinflammatory response evident by delivery of sTREM2 with control IgG (n = 7, two-tailed student’s t test). The y- axis represents the fold-change in expression relative to sham (PBS injected animals) staining with anti-phosphorylated Akt and anti total Akt compared to control IgG or no treatment (Fig. 4e). antibodies after 2 and 10 min of Ab-T1 stimulation. There was no increase in TNFα protein levels in control There was minimally detectable phosphorylated Akt IgG antibody-treated cells as compared to no treatment. protein detected in BMDM cells stimulated with control Pre-incubation of Ab-T1 activated microglial in the IgG or no treatment. presence of a Syk inhibitor R406, attenuated consequent TNFα and IL-1β mRNA expression levels were mea- activation evident by the lower TNFα protein levels in sured in microglia cells treated with Ab-T1 or control both 0.5 and 1 μM concentrations (Fig. 4e). R406 inhibi- IgG antibodies with and without spleen tyrosine kinase tor alone did not have an effect in TNFα protein levels. (SYK) inhibitor R406 (Fig. 4c, d). Microglia incubated Additionally, TNFα protein levels were measured in with Ab-T1 exhibited more than a 3-fold increase in microglia cells treated with Ab-T1 or control IgG anti- mRNA expression levels of TNFα and IL-1β (Fig. 4c, d) bodies with and without protein kinase B (AKT) inhibi- as compared to untreated cells. There was almost no in- tor MK2206 (Fig. 4f). Ab-T1 increased more than 4-fold crease in pro-inflammatory cytokines in microglia cells TNFα protein levels in microglia cells compared to con- pre-incubated with R406 inhibitor before Ab-T1 trol IgG and no treatment (Fig. 4f). Pre-incubation of treatment. microglia with the Akt inhibitor MK2206 attenuated Ab-T1 concentrations (5 and 10 μg/ml) induced a 4- Ab-T1 induced activation in a dose-dependent manner fold increase in TNFα protein levels in microglia cells as as seen by the lower TNFα protein levels with 12 nM,
Fassler et al. Journal of Neuroinflammation        (2021) 18:19                                                                              Page 12 of 18

 Fig. 4 Effects of Ab-T1 on Syk/Akt phosphorylation and the activation of microglia and macrophages. a Ab-T1 promotes Syk phosphorylation and b Akt
 phosphorylation. Western blot analysis of phosphorylated Syk (Tyr525/526) or Akt (Ser473) in mouse bone marrow-derived macrophages stimulated with Ab-T1.
 Ab-T1 upregulates (c) TNFα and (d) IL-1b mRNA and TNFα protein levels in microglia dependent on e Syk or f Akt phosphorylation as the respective inhibitor
 attenuates consequent Ab-T1-induced activation. Data shown in ELISA assay represent triplicate repeats. g Ab-T1 enhances the uptake of labeled apoptotic
 neurons by microglia as compared to control IgG. Data shown represent triplicate experimental repeats with triplicate sample repetition

65 nM, and 100 nM inhibitor concentration (Fig. 4f; 200,                        Twice monthly dosing of Ab-T1 attenuates
166, 142 pg/ml respectively). MK2206 inhibitor alone                            neuroinflammation and cognitive decline in female
did not have an effect on TNFα protein levels as com-                           5xFAD mice (experiment 1)
pared to no treatment control.                                                  5xFAD mice at 4–5 months of age, a time point where
                                                                                these mice are known to exhibit amyloid plaque burden
                                                                                within the brain, were intraperitoneally injected with differ-
Microglia uptake of apoptotic neurons after Ab-T1                               ent doses of Ab-T1 (1 and 10 mg/kg), a human IgG anti-
stimulation                                                                     body (10 mg/kg) and PBS as sham control twice a month
As one of the important properties of microglia in                              (n = 9–10 per group). A number of behavioral tests were
ameliorating neurodegeneration is their ability to engulf                       conducted to examine their cognitive decline (Fig. 5a, b).
and clear cellular debris. We thus tested the hypothesis                        Seven weeks post treatment, sham (Fig. 5a, PBS) and hu-
that activation of microglia with Ab-T1 will be associ-                         man IgG control-treated mice (Fig. 5a, hIgG; 10 mg/kg) ex-
ated with an increased uptake of apoptotic neurons                              hibited significantly impaired novel object recognition
in vitro.                                                                       compared to 10 mg/kg Ab-T1-treated animals (Fig.
  Stimulated microglia cells with Ab-T1 increased cellu-                        5a; Ab-T1 (10 mg/kg)) as shown by the similar
lar uptake of CFSE-stained apoptotic neuronal cells (Fig.                       amount of time spent in exploring the two objects
4g; Neu + Micro (Ab-T1): relative MFI – 70) as com-                             (familiar and new). There was no net preference be-
pared to control IgG (Fig. 4g; Neu + Micro (control                             tween novel and familiar objects as shown in the re-
IgG): relative MFI – 20).                                                       duced discrimination index [Discrimination Index, DI =
Fassler et al. Journal of Neuroinflammation (2021) 18:19 Page 13 of 18
a. b.
c. d.
Young 5xFAD
Fig. 5 Ab-T1 improves cognition and attenuates neuroinflammation in AD 5xFAD Mice. a Five-month-old female mice treated with sham (PBS) and
human IgG (10 mg/kg) showed cognitive impairment as indicated by the discrimination Index (DI) for the object recognition testing session (NOR)
compared to Ab-T1 (10 mg/kg) treated mice (n = 9–10, two-tailed student’s t test, **P = 0.0019, *P = 0.0027) (b) and by the increase in latency to
platform in the MWM probe test (two-tailed student’s t test, **P = 0.006, *P = 0.029). Error bars represent standard error of the mean. c TNFα, IL-1b, and
IL-6 mRNA levels were detected using TaqMan real-time PCR in purified brain homogenates. The y-axis represents the fold-change in expression
compared to no treatment (sham). GAPDH was used as “housekeeping” gene (two-tailed student’s t test, **P = 0.01, *P = 0.016). d Discrimination Index
(DI) for the object recognition testing session (NOR) after 8 weeks of treatment dysfunction in young 5xFAD mice. (n = 7, two-tailed student’s t test, *P
= 0.033). The result in the NOR can vary between + 100 and − 100, where a positive score indicates more time spent with the novel object, a negative
score indicates more time spent with the familiar object, and a zero score indicates a null preference
(novel object exploration time − familiar object exploration significant difference between human IgG control
time)/(novel exploration time + familiar object exploration) mice and 1 mg/kg Ab-T1-treated mice, similar to the
× 100]. Intraperitoneal treatment with Ab-T1 (Ab-T1 (10 novel object recognition test. In order to examine
mg/kg); DI 41.49 ± 6.13) significantly attenuated cognitive in vivo neuroinflammation, relative mRNA levels for a
decline as compared to human IgG-treated animals (hIgG; number of pro-inflammatory cytokines produced in
DI 3.29 ± 12.49, P = 0.0027), 1 mg/kg dosage of Ab-T1 (DI the murine brain were quantified using RT-PCR 12
9.44) and untreated animals (PBS; DI 12.48 ± 12.22, p = weeks post treatment (Fig. 5c). Ten milligram per
0.0019). Furthermore, 10 weeks post treatment, mice kilogram Ab-T1 (Fig. 5c; 0.73 ± 0.057-fold change)
treated with 10 mg/kg of Ab-T1 showed a significantly downregulated TNFα expression levels relative to 10
shorter latency to escape onto the hidden platform in the mg/kg of human IgG control group (Fig. 5c; control
Morris water maze probe test (Fig. 5b; 8.21 ± 1.27 s) as IgG 1.17 ± 0.132-fold change, P = 0.016). There was
ompared to 10 mg/kg of human IgG (Fig. 5b; 25.97 ± no relative reduction in TNFα mRNA expression
4.44 s, P = 0.029) and sham (Fig. 5b; PBS 14.94 ± levels seen in 1 mg/kg Ab-T1 and human IgG
2.56, P = 0.006) treated control mice. There was no control-treated mice. A similar trend was evident alsoFassler et al. Journal of Neuroinflammation (2021) 18:19 Page 14 of 18
with regard to IFN-g, IL-6, and IL-1b, although not Ab-T1 dose dependently engages serum and CSF-free
statistically significant due to the relatively small soluble TREM2
number of samples. To quantify the levels of soluble TREM-2 (mTREM2) in
experiment 1, in mice treated with Ab-T1 (experiment 1),
an enzyme-linked immunosorbent assay (ELISA) directed
Weekly treatment with Ab-T1 effectively attenuates
against the extracellular portion of mouse TREM-2 pro-
development of cognitive dysfunction in young 5xFAD
tein was used (Fig. 6f). Soluble TREM2 levels were deter-
mice (experiment 2)
mined in all CSF and serum specimens collected from
After showing a therapeutic effect on mice with preexisting
5xFAD mice upon sacrifice. 5XFAD mice treated with
cognitive impairment, we went on to test the effects of Ab-
Ab-T1 (10 mg/kg) exhibited significantly lower levels of
T1 on the progression toward cognitive deterioration when
sTREM2 in CSF (~ 95% reduction) compared to sham
treatment commences earlier at the presymptomatic stage.
(PBS)-treated animals (Fig. 6f; CSF) suggesting a robust
Upon sacrifice, sham-treated mice exhibited significantly
reduction of the soluble unbound TREM2 levels. Signifi-
impaired novel object recognition compared to Ab-T1-
cantly lower levels of mouse sTREM2 (231.1 ± 45.19 pg/
treated animals as shown by the similar amount of time
ml) were evident in serum of mice treated with 1 and 10
spent in exploring both familiar and novel objects (Fig. 5d;
mg/kg of Ab-T1 compared to human IgG control (502.92
P = 0.033). There was no net preference between novel
± 99.91 pg/ml, P = 0.047) and sham (PBS; ~ 400 pg/ml)
and familiar objects as shown in the reduced discrimin-
(Fig. 6f; serum). There was no significant reduction in
ation index [Discrimination Index, DI = (novel object ex-
sTREM2 CSF levels in animals treated with IgG control
ploration time − familiar object exploration time)/(novel
compared to PBS.
exploration time + familiar object exploration) × 100]. In-
traperitoneal treatment with Ab-T1 (Ab-T1 (0.5, 5 mg/
Ab-T1 levels in experiment 1
kg); DI 34.2 ± 10.68, 28 ± 10.30) significantly attenuated
Human IgG4 in brains and serum of animals 10 weeks
cognitive decline as compared to untreated animals (sham;
post treatment with Ab-T1 (1 or 10 mg/kg twice a
DI − 5 ± 11.44) (n = 7 per group).
month) were measured (Fig. 6g). Average serum levels of
10 mg/kg Ab-T1-treated animals were ~ 10 times higher
Intraperitoneal treatment with Ab-T1 reduces soluble (482 μg/ml) than 1 mg/kg treated animals (42.7 μg/ml).
amyloid beta as well as the number of amyloid plaques Brain levels of 10 mg/kg Ab-T1-treated animals were ~
in aged male 5xFAD mice (experiment 1) 6 times higher than 1 mg/kg treated animals (270 ng/
We used murine brains from experiment 1 to test the ml). There was a significant correlation between serum
hypothesis that Ab-T1 would influence soluble amyloid and brain levels of Ab-T1.
beta levels as well as plaque numbers and size when ini- Importantly, serum and brain Ab-T1 levels were
tiated in aged plaque bearing 5xFAD mice [12]. positively correlated with the improvement in cogni-
Upon sacrifice, soluble amyloid beta levels in treated tion evident in the Morris water maze (MWM) test
animals were reduced as compared to controls (Fig. 6a) (Fig. 6h; r = 0.46; P < 0.05 and r = 0.5; P < 0.05, re-
but the effect was marginal and did not achieve statis- spectively). Moreover, it was observed that the lower
tical significance. Brain sections were subsequently the sTREM levels as a measure of engagement by
stained with thioflavin S, which binds to the characteris- Ab-T1, the better the cognition was (Fig. 6h lower
tic β-pleated sheet conformation [22]. Sections from left: r = 0.61; P < 0.05). Serum and brain levels of
mice treated with 10 mg/kg Ab-T1 (Fig. 6b and c; 0.72 ± Ab-T1 were highly correlated (r = 0.89; P < 0.001;
0.05) showed lower levels of plaques per total brain area Fig. 6h lower right) suggesting a reproducible access
compared to sham treated mice (Fig. 6b and c; 1 ± 0.10, of the antibody through the blood brain barrier.
P = 0.032, two-tailed t test). Image analysis of thioflavin
S staining from same brain sections showed decrease in Regional distribution phenotype assessment of plaque
average plaque size in mice treated with 10 mg/kg Ab- associated microglia
T1 (Fig. 6d; 105.38 ± 5.16 μm, P = 0.0001) compared to Cortical and hippocampal regions in a number of con-
sham-treated mice (Fig. 6d; 62.05 ± 8.84 μm, P = 0.0001, secutive sagittal brain slices of treated (Ab-T1 or control
two-tailed t test). Brain sections were then immuno- IgG) 5xFAD animals (experiment 1) were analyzed and
stained with anti-beta amyloid antibody (clone 4G8) for quantified for plaque-associated microglia. An investiga-
diffuse plaque assessment. There was a significant de- tor blinded to the animal clinical data quantified differ-
crease in the number of diffuse plaques in brain sections ent stages of microglia (stage I, II, and III) to estimate
of Ab-T1-treated mice (Fig. 6e 9.2 ± 1.612; P = 0.0001) the total number of plaque-associated microglia and acti-
compared to sham-treated mice (2.2 ± 0.941, P = vated microglia in each region [1] (Fig. 7). Double immuno-
0.0001). staining images of beta amyloid plaques and microglia inYou can also read