New view on the organization and evolution of Palaeognathae mitogenomes poses the question on the ancestral gene rearrangement in Aves
←
→
Page content transcription
If your browser does not render page correctly, please read the page content below
New view on the organization and evolution of
Palaeognathae mitogenomes poses the question on
the ancestral gene rearrangement in Aves
Adam Dawid Urantowka
Uniwersytet Przyrodniczy we Wroclawiu
Aleksandra Kroczak
Uniwersytet Wroclawski
Pawel Mackiewicz ( pamac@smor and.uni.wroc.pl )
Uniwersytet Wroclawski https://orcid.org/0000-0003-4855-497X
Research article
Keywords: ancestral state, Aves, duplication, mitochondrial genome, mitogenome, Neognathae,
Palaeognathae, phylogeny, rearrangement
DOI: https://doi.org/10.21203/rs.3.rs-41469/v2
License: This work is licensed under a Creative Commons Attribution 4.0 International License.
Read Full License
Page 1/42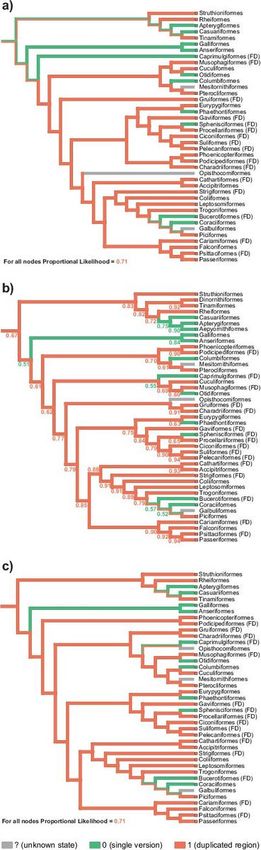
Abstract
Background

Bird mitogenomes differ from other vertebrates in gene rearrangement. The most common avian gene
order, identi ed rst in Gallus gallus, is considered ancestral for all Aves. However, other rearrangements
including a duplicated control region and neighboring genes have been reported in many representatives
of avian orders. The repeated regions can be easily overlooked due to inappropriate DNA ampli cation or
genome sequencing. This raises a question about the actual prevalence of mitogenomic duplications and
the validity of the current view on the avian mitogenome evolution. In this context, Palaeognathae is
especially interesting because is sister to all other living birds, i.e. Neognathae. So far, a unique duplicated
region has been found in one palaeognath mitogenome, that of Eudromia elegans.

Results

Therefore, we applied an appropriate PCR strategy to look for omitted duplications in other palaeognaths.
The analyses revealed the duplicated control regions with adjacent genes in Crypturellus, Rhea and
Struthio as well as ND6 pseudogene in three moas. The copies are very similar and were subjected to
concerted evolution. Mapping the presence and absence of duplication onto the Palaeognathae
phylogeny indicates that the duplication was an ancestral state for this avian group. This feature was
inherited by early diverged lineages and lost two times in others. Comparison of incongruent phylogenetic
trees based on mitochondrial and nuclear sequences showed that two variants of mitogenomes could
exist in the evolution of palaeognaths. Data collected for other avian mitogenomes revealed that the last
common ancestor of all birds and early diverging lineages of Neoaves could also possess the
mitogenomic duplication.

Conclusions

The duplicated control regions with adjacent genes are more common in avian mitochondrial genomes
than it was previously thought. These two regions could increase effectiveness of replication and
transcription as well as the number of replicating mitogenomes per organelle. In consequence, energy
production by mitochondria may be also more e cient. However, further physiological and molecular
analyses are necessary to assess the potential selective advantages of the mitogenome duplications.

1. Background
Animal mitochondrial genomes are characterized by compact organization and almost invariable gene
content, so any changes in them are especially interesting because they can be associated with major
transitions in animal evolution [1, 2]. The rst fully sequenced avian mitogenome from chicken Gallus
gallus [3] turned out to contain single versions of 37 genes and one control region (CR) as in most other
vertebrates, but organized in a different order (Fig. 1). This rearrangement is believed to have derived
from the typical vertebrate gene order by a single tandem duplication of the fragment located between

                                                   Page 2/42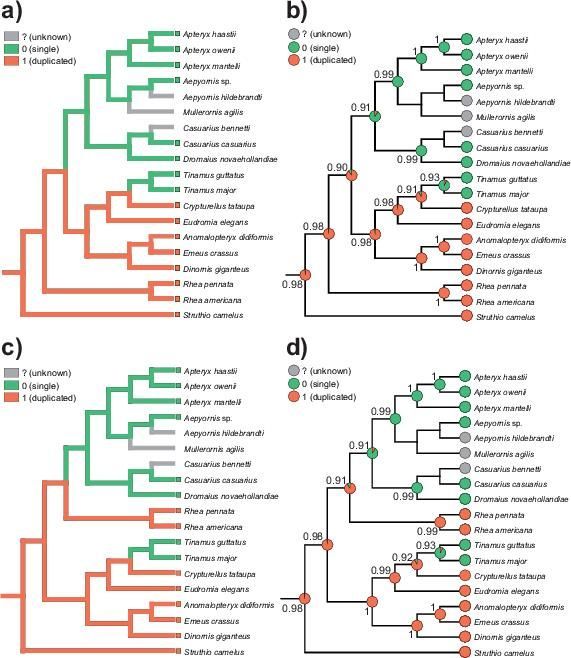
ND5 and tRNA-Phe genes followed by random losses of one copy of duplicated items. Due to the
prevalence of the Gallus gallus gene order in other birds, this rearrangement is generally believed to be an
ancestral state for all Aves. In consequence, it is called common, standard or typical.

However, the growing number of avian mitochondrial genomes sequenced in recent years has revealed
that other gene orders may also be present in a frequency higher than it was previously thought. To date,
several distinct variations of mitochondrial rearrangements have been reported in a lot of representatives
of many avian orders: Accipitriformes [4, 5], Bucerotiformes [6], Charadriiformes [7], Coraciiformes [8],
Cuculiformes [9-11], Falconiformes [4], Gruiformes [12], Passeriformes [13, 14], Pelecaniformes [4, 15, 16],
Phoenicopteriformes [17, 18], Piciformes [4, 19], Procellariiformes [20, 21], Psittaciformes [22, 23],
Strigiformes [24], Suliformes [15, 20, 25] and Tinamiformes [26]. All these rearrangements include an
additional region between ND5 and tRNA-Phe genes, which seems to be particularly susceptible to
duplication.

The most fully duplicated region (GO-FD; Fig. 1) was found in mitogenomes of all representatives of
Gruidae [12] and Suliformes [15, 20, 25, 27], the majority of Pelecaniformes [4, 16] and
Procellariiformes [4, 21, 28], as well as some Bucerotiformes and Psittaciformes species [6, 23]. All other
avian gene orders containing the duplicated elements result from subsequent degenerations of GO-FD
due to pseudogenization or loss of selected genes and/or control region [22, 23].

It has been commonly assumed that the mitogenomic duplications are derived states and occurred
independently in many Psittaciformes and Passeriformes lineages [13, 22, 29-31]. However, an
independent origin of identical gene orders in different avian lineages seems unlikely because of the
great number of possible arrangements [32-35]. More probable seems that the last common ancestor of
many avian groups had a duplicated region. This feature was shown for Psittaciformes [23] and could be
true for Accipitriformes [4, 5, 36-38], Falconiformes [4, 39], Gruidae [12] and Pelecaniformes [4, 15, 16],
because all or almost all members of these groups contain mitogenomes with the duplicated regions.
What is more, Mackiewicz, et al. [14] showed that even the last common ancestor of a larger
monophyletic group of Aves including Psittaciformes, Passeriformes and Falconiformes could have had
a duplication of the control region with adjacent genes in the mitochondrial genome.

The lack of duplication in some fully sequenced mitogenomes may be false and result from omission of
identical repeats due to an inappropriate PCR strategy, insu cient sequencing methods or incorrect
genome assembly. This problem was already addressed by Gibb, et al. [4], who found the fully duplicated
gene order in Thalassarche melanophris mitogenome, which had been previously annotated without the
duplication [40]. Similarly, two other mitogenomes of Notiomystis cincta and Turdus philomelos showed
a novel duplicated gene order after a re-analysis [41], although previously the single version had been
reported [42]. All re-ampli ed and re-sequenced crane mitogenomes also revealed the existence of
duplication [12], which had not been found earlier [43]. Omitted duplications were also found within the
mitochondrial genomes of Strigopoidea and Cacatuoidea, demonstrating that the ancestral parrot
contained duplication in its mitogenome [23].

                                                  Page 3/42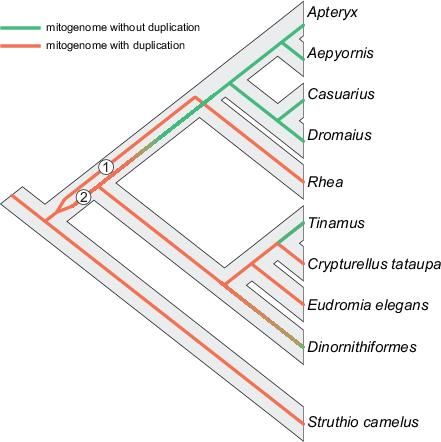
The growing number of formerly unidenti ed duplications implies that many avian mitogenomes
published so far without duplication may, in fact, have it. Therefore, a diligent search for potential
duplications is crucial in understanding the evolution of the avian mitogenome. Palaeognathae are
particularly important to this subject because all comprehensive avian phylogenies have placed them as
the sister group to the rest of birds, called Neognathae [44-48]. Palaeognaths comprise 25 genera and 82
species [49, 50], which are currently grouped into three extinct and ve extant orders: the ighted
Lithornithiformes known from Paleocene and Eocene of North America and Europe, and possibly from
the Late Cretaceous; the ighted tinamous (Tinamiformes) from South and Central America; the ightless
ratites containing the recently extinct New Zealand moas (Dinornithiformes) and Madagascan elephant
birds (Aepyornithiformes) as well as the extant African ostrich (Struthioniformes), South American rheas
(Rheiformes), Australian emu and Australasian cassowaries (Casuariiformes), and New Zealand kiwi
(Apterygiformes). Phylogenetic relationships between these groups have been controversial. Molecular
analyses have revealed that the ratites are paraphyletic and suggested that ightlessness evolved several
times among ratites independently [51-60].

So far, a duplicated region (cytb/tRNA-Thr/tRNA-Pro/CR1/ND6/tRNA-Glu/CR2) has been found only in
one representative of palaeognaths, namely Eudromia elegans [26]. This rearrangement has not been
identi ed in any other avian species. Other Palaeognathae mitogenomes have a typical single avian gene
order or were published as incomplete, especially in the part adjacent to the control region [26]. However,
it cannot be ruled out that an inadequate PCR strategy was unable to amplify identical repeats or even
prevented the completion of the mitogenome sequencing and assembly due to the presence of
repeats [61]. Therefore, we applied another PCR strategy that allows the ampli cation of the fragment
between two control regions including a potentially omitted duplication in representatives of Struthio,
Rhea, Casuarius, Dromaius and Crypturellus. The new data help to elucidate the evolution of the
Palaeognathae mitogenome in terms of duplication events, and also have implications for mitogenomic
evolution in Aves as a whole.

2. Results And Discussion
2.1 Duplicated gene order identi ed in mitogenomes of analyzed Palaeognathae taxa

Using an appropriate PCR strategy (Fig. 2), the diagnostic fragments ranges from the rst (CR1) and the
second control regions (CR2) were obtained for Struthio camelus (Fig. S1a in Additional le 1), Rhea
pennata (Fig. S1b in Additional le 1), Rhea americana (Fig. S1c in Additional le 1) and Crypturellus
tataupa (Fig. S1d in Additional le 1). Only two out of 16 or 48 reactions failed in the taxa for which
species-speci c primers were designed based on the previously published sequences of complete
mitogenomes (Struthio camelus and Rhea species) (Table S1 in Additional le 2). In the case of
Crypturellus tataupa, amplicons were obtained only for six out of 12 tested reactions. This was caused by
the fact that primers dedicated for this species were designed on the sequence of more distant
mitogenome from Eudromia elegans [26]. Similar to the published Crypturellus tataupa genomic
sequence [62], the control region and adjacent genes were missing. Sequencing and annotation of the
                                                  Page 4/42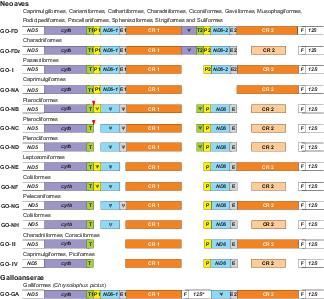
produced amplicons revealed the presence of tRNA-Pro/ND6/tRNA-Glu fragments between two control
regions for Struthio camelus, Rhea pennata, Rhea americana and Crypturellus tataupa (Fig. 1). The
duplicated fragment obtained for Struthio camelus differed only in one nucleotide from the homologous
region in the previously published mitogenome (Fig. S2a in Additional le 1). These fragments in rheas
showed 100% identity with corresponding homologous regions (Fig. S2b and Fig. S2c in Additional le 1).

Although the high identity strongly indicates a mitochondrial origin of the ampli ed CR1/CR2 fragments,
additional diagnostic reactions were designed to exclude a possibility of nuclear mitochondrial DNA
inserts (NUMTs) ampli cation. Based on the obtained sequences of ND6 genes, appropriate primers were
created to amplify ND6-1/ND6-2 regions. Sequencing of the ampli ed PCR products revealed the
ND6/tRNA-Glu/CR/tRNA-Pro/ND6 gene order for all analyzed species. The corresponding CR/tRNA-
Pro/ND6 regions overlapped the appropriate CR1/CR2 diagnostic fragments and showed 100% identity.
Additional PCR reactions (see Methods and Fig. 2) were run to complete the missing parts of CRs and to
reveal the order of genes preceding the rst control region. Finally, the complete mitogenomic fragments
containing the duplicated regions were obtained by assembling four overlapping fragments (Fig. 2). Their
length was: 8,554 bp for Struthio camelus, 8,254 for Rhea Americana, 8,360 bp for Rhea paennata and
7,044 bp for Crypturellus tataupa (Table 1; Fig. S3 in Additional le 1). In all cases the same gene order
was found (GO-I; Fig. 1e, Table 1, Fig. S3 in Additional le 1), which was previously annotated only for two
Passeriformes species, Notiomystis cincta and Turdus philomelos [41]. This gene rearrangement differs
from the most complete known avian duplication (GO-FD; Fig. 1d) in the lack of the second copies of cytb
and tRNA-Thr genes, expected between CR1 and tRNA-Pro2 gene. The presence of identical copies of
tRNA-Glu gene (Fig. S2a-d in Additional le 1) enabled us to position precisely the 5' ends of both control
regions. The 3’ ends of CR2s precede tRNA-Phe genes as in all other gene orders including two potentially
functional control regions. The number of nucleotides between the tRNA-Glu copies and appropriate poly-
C sequences located at the 5' ends of CRs vary from 2 bp (Rhea americana, Rhea pennata and
Crypturellus tataupa) to 26 bp for Struthio camelus (Table S2 in Additional le 2). The CR2 in Rhea
pennata and Crypturellus tataupa is longer than CR1, which obey the rule observed in 13 crane species
[12]. The tandem duplications found in the mitogenomes of Struthio camelus, Rhea americana, Rhea
pennata and Crypturellus tataupa make them longer compared with their previous genomic versions
assuming the typical avian gene order.

2.2 Probable presence of mitochondrial CR1/CR2 fragments in Casuarius casuarius and Dromaius
novaehollandiae nuclear genomes

In the case of two other Palaeognathae species, Casuarius casuarius and Dromaius novaehollandiae, an
attempt to amplify the CR1/CR2 fragment was also made. Similar to other taxa, species-speci c D-F and
D-R primers (Fig. 2; Table S1 in Additional le 2) were designed using the sequences of previously
published complete mitogenomes (AF338713.2 and AF338711.1). In contrast to the results obtained for
the other Palaeognathae species, most PCR reactions failed to amplify the expected fragments. In
Dromaius novaehollandiae, amplicons were obtained only for 3 out of 25 tested reactions (Fig. S4a in
Additional le 1, Table S1 in Additional le 2). Analogously, PCR products were obtained only for 4 out of
                                                 Page 5/42
56 reactions for Casuarius casuarius (Fig. S4b in Additional le 1, Table S1 in Additional le 2). Moreover,
single DNA fragments were not produced for any of these seven reactions, although different annealing
temperatures were applied (Fig. S4 in Additional le 1). Taking into account the heterogeneity of the
obtained DNA fragments as well as the fact that most of the tested reactions failed, we can conclude that
the PCR products presented in Fig. S4 in Additional le 1 were not ampli ed on the mitochondrial genome
template. The D-F and D-R primers as well as the applied PCRs are highly speci c and diagnostic for the
presence of CR duplication in parrots [23], cranes [12] as well as black-browed albatross, ivory-billed
aracari and osprey [4]. Therefore, the seven positive amplicons most likely represent mitochondrial DNA
fragments located in the nuclear genomes, i.e. NUMTs. It means that Casuarius casuarius and Dromaius
novaehollandiae or their ancestors had mitogenomes comprising two control regions, which were
transferred into the nucleus during evolution.
2.3 Reannotation of Eudromia elegans mitochondrial gene order
The GO-I gene order (Fig. 1) found in this study for four Palaeognathae taxa differs from that in the
published mitogenomic sequence of Eudromia elegans [26]. This rearrangement appears to be a
degenerated form of GO-I as it lacks the rst copy of ND6 and tRNA-Glu genes as well as the second copy
of tRNA-Pro gene. This fact prompted us to search for a potential tRNA-Pro pseudogene hidden within the
last 122 nucleotides of the rst control region of Eudromia elegans mitogenome. In fact, the comparison
of CR1 sequence with the potentially functional tRNA-Pro sequence of this species revealed a signi cant
similarity (E-value = 1.2×10⁻⁶; 81% identity without gaps and 64% including gaps) between these
sequences along the 84-bp alignment (Fig. S5a in Additional le 1), which suggests the presence of the
tRNA-Pro pseudogene in the Eudromia mitogenome in the position between 16,272 bp and 16,349 bp.
After reannotation of this pseudogene, the length of CR1 reduced to 1,352 bp. The newly annotated
Eudromia gene order was de ned as GO-P1 in Fig. 1e.
2.4 Reannotation of mitochondrial gene order in the mitogenomes of Anomalopteryx didiformis, Emeus
crassus and Dinornis giganteus
Our analysis of 5’ spacers, i.e. fragments of control regions located between the tRNA-Glu gene and poly-
C motif, revealed that they are much longer in annotated Anomalopteryx didiformis, Emeus crassus and
Dinornis giganteus mitogenomes than in other Palaeognathae species. These spacers of the most
Palaeognathae taxa are from 2 bp to 33 bp in length (Table S2 in Additional le 2), but in Anomalopteryx
didiformis, Emeus crassus and Dinornis giganteus, they are longer, i.e. 133 bp, 157 bp and 150 bp,
respectively. Additionally, all three fragments contain a purine-rich insertion (Fig. S5b in Additional le 1)
analogous to that in parrot ND6 pseudogenes (Fig. S5c in Additional le 1) [23]. In the Psittaciformes
mitogenomes (Probosciger aterrimus goliath, Eolophus roseicapilla and Cacatua moluccensis), this
insertion is preceded by a fragment (with 433 - 450 bp) almost identical with the rst ND6 copy followed
by a highly degenerated region. This similar sequence pattern prompted us to search for potential ND6
pseudogenes within the 5’ spacers of CRs in Anomalopteryx didiformis, Emeus crassus and Dinornis
giganteus. The comparison of 5’ CR sequences with appropriate ND6 genes of these species revealed a
Page 6/42signi cant similarity between the aligned sequences (Table S3 in Additional le 2). Those from
Anomalopteryx didiformis were identical in 71% with E-value = 0.13 (Fig. S5d in Additional le 1) and
from Emeus crassus in 73% with E-value = 0.0015 (Fig. S5e in Additional le 1). The alignment of
Dinornis giganteus sequences was much more signi cant with E-value = 5.8×10-106 and the sequences
showed 83% identity (Fig. S5f in Additional le 1). The obtained identity and E values are in the range of
those obtained for ND6 pseudogenes and their functional copies annotated in other avian species, i.e.
65% - 96% and 0 – 0.23, respectively (Table S3 in Additional le 2).
Assuming the presence of ND6 pseudogenes in Anomalopteryx didiformis, Dinornis giganteus and Emeus
crassus mitogenomes, the length of their CR is reduced to 1,347 bp, 1,360 bp and 1,346 bp, respectively.
The CR sequences show 71-81% identity at 5’ spacers on the length 165 bp (Fig. S5b in Additional le 1).
The new avian gene order present in these reannotated mitogenomes is indicated as GO-P2 in Fig. 1e.
2.5 Comparison of the duplicated regions of Palaeognathae mitogenomes
The GO-I gene order found in four Palaeognathae species (Fig. 1, Table 2) is characterized generally by a
high similarity between paralogous sequences, i.e. copies found within the same mitogenome. The
second copies of tRNA-Pro, ND6 and tRNA-Glu are identical with the rst ones in the case of Struthio
camelus, Rhea americana and Rhea pennata (Table 3). The second copy of tRNA-Glu is also identical
with the rst one in Crypturellus tataupa mitogenome. However, the rst copies of tRNA-Pro and ND6
genes of this species differ from their paralogous sequences in three nucleotides (Table 3). Two control
regions of analyzed species show a slightly greater variation in identity, from 94.4% (Rhea pennata) to
97.8% (Crypturellus tataupa). The difference is mainly located at their 3' ends, except for Rhea taxa,
whose control regions differ also at their 5' ends (Fig. S2 in Additional le 1). The high similarity of
duplicated regions indicates that they evolved in concert, which homogenized their sequences as found in
many other avian groups [4, 6, 14, 23, 25, 28, 30, 63-70].
In contrast to GO-I gene order, the newly de ned rearrangement GO-P1 in Eudromia elegans is
characterized by single versions of ND6 and tRNA-Glu gene (Fig. 1). Moreover, the second copy of tRNA-
Pro is a pseudogene, which has substantially diverged from its full version (Fig. S5a in Additional le 1).
Therefore, it seems that the GO-P1 rearrangement is a degenerated form of GO-I, in which two genes were
removed and one gene was pseudogenized. Surprisingly, despite the high degree of degeneration in
comparison with other analyzed Palaeognathae species, two control regions of Eudromia elegans
maintain the highest sequence identity (Table 3), although the alignment of these regions clearly shows
the presence of several deletions/insertions (Fig. S6 in Additional le 1).
The comparison of paralogous control regions in Palaeognathae revealed that CR2s are much longer
only in two species, i.e. Rhea pennata and Crypturellus tataupa (Table 3). Such a difference in the length
of CRs seems to be a rule in most avian mitogenomes with a duplicated region [23]. Interestingly, CRs in
Rhea americana are identical in length, while those in Struthio camelus and Eudromia elegans differ only
in one and two nucleotides, respectively (Table 3).
Page 7/422.6 Phylogenetic relationships within Palaeognathae based on mitogenomes
Three phylogenetic methods applied for the mitogenomic sequences resulted in a consistent topology
(Fig. 3). The earliest diverging lineage of Palaeognathae was Struthio camelus (representing
Struthioniformes) and the next was Rheiformes (Rheidae). Dinornithiformes (Dinornithidae + Emeidae) is
grouped with Tinamiformes (Tinamidae), whereas Casuariiformes (Dromaiidae + Casuariidae) is sister to
Aepyornithiformes (Aepyornithidae) + Apterygiformes (Apterygidae). Almost all nodes are very well
supported. The least signi cant are two nodes: one clustering Casuariiformes, Aepyornithiformes and
Apterygiformes, and the other encompassing the palaeognath lineages separated after the divergence of
Struthio and Rhea. Nevertheless, these two nodes obtained the highest posterior probability in MrBayes
analysis, i.e. 1.0 and support in the Shimodara-Hasegawa-like approximate likelihood ratio test (SH-aLRT)
equal to 93 and 78, respectively.
In order to eliminate a potential artefact related with the compositional heterogeneity in the third codon
positions of protein-coding genes, we created phylogenetic trees based on the RY-coding alignment (Fig.
4). The tree topology produced by the three methods was the same as that for the uncoded alignment.
The posterior probability of the two controversial nodes was still very high in MrBayes tree, i.e. 0.99 and
the SH-aLRT support was 89 and 82, respectively.
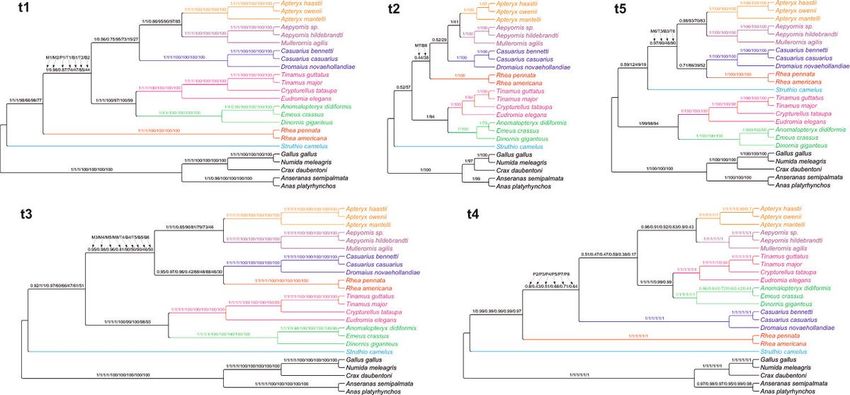
Moreover, we performed phylogenetic analyses based on ten alignments, from which we sequentially
excluded partitions characterized by the highest substitution rate (Table S4 in Additional le 2). The
calculations produced in total 16 topologies, out of which ve are worthy of mention because they were
obtained by many independent approaches (Fig. 5). The topology t1 was identical with that based on the
alignments including all sites and demonstrated rheas as sister to all other non-ostrich palaeognaths.
Such a tree was produced by MrBayes, PhyloBayes and IQ-TREE using the alignment without sites
characterized by the highest substitution rate, as well as by MrBayes and IQ-TREE using the alignment
after removing sites with two highest rate categories. The posterior probabilities for the clade including
palaeognaths other than ostrich and rheas were very high in MrBayes, i.e. 1 and 0.98, respectively, or
moderate, i.e. 0.87 in PhyloBayes. In the topology t2, the Rhea clade was grouped with Casuariiformes +
Apterygiformes. However, the support of this grouping was very weak and occurred only in MrBayes tree
and IQ-TREE consensus bootstrap tree based on the alignments without seven and eight highest rate
categories, respectively. A greater Bayesian support (0.95-0.97) was obtained by the node encompassing
rheas with Casuariiformes in the topology t3 based on the alignments after removing three, four and ve
highest rate categories. This topology was also produced in MrBayes using the alignment without eight
highest rate categories and in IQ-TREE for the alignments without four, ve and six highest rate
categories. However, the node support was generally weak. The topology t4 was produced only by
PhyloBayes for the alignments without two, three, four, ve, seven and eight highest rate categories. As in
the topology t1, the Rhea clade was also sister to all other palaeognaths excluding Struthio, but
Casuariiformes were clustered with the rest non-ostrich palaeognaths, not directly with Aepyornithiformes
and Apterygiformes. The posterior probability values of the clade including palaeognaths sister to rheas
did not exceed 0.8. The topology t5 differed from the others because Struthio camelus was placed within
Page 8/42other Palaeognathae and the external position was occupied by Dinornithiformes + Tinamiformes,
whereas Rhea was grouped with Casuariiformes. This topology was obtained for the alignments without
three (IQ-TREE) and six highest rate categories (MrBayes and IQ-TREE). Nevertheless, the controversial
nodes were poorly supported.
Removing the sites with the highest substitution rate eliminated the alignment positions that were
saturated with substitutions, but the number of parsimony informative sites decreased, too (Fig. S7a).
Therefore, the stochastic error could increase for the short alignments and the inferred phylogenetic
relationships could be unreliable. After elimination of sites with two highest rate categories, the mean
phylogenetic distance in the MrBayes tree decreased abruptly from 0.94 to 0.33 substitutions per site and
the maximum distance in the tree dropped from 1.99 to 0.69 substitutions per site (Fig. S7a). The sharp
decrease was also visible in the number of informative sites, which constituted 56% of those in the
original alignment. However, the sisterhood of rheas to other non-ostrich palaeognaths was still present in
the trees based on the purged alignments and the latter group was relatively highly supported (Fig. S7b).
After removing sites with at least three highest rate categories, the alignment was deprived of more than
half of informative sites and alternative topologies were favored, though with smaller support values (Fig.
S7b).
Among the applied topology tests, the BIC approximation produced all Bayesian posterior probabilities for
the alternative topologies much smaller than 0.05 indicating a strong rejection of the tested alternatives
in favor of topology t1 (Table S5 in Additional le 2). Moreover, the topology t4 performed signi cantly
worse than t1 in two bootstrap tests, whereas the bootstrap probabilities for the topology t2 were 0.063,
i.e. very close to the 0.05 threshold. Other tests did not reject the alternative topologies. However, Bayes
factor was greater than 9 indicating an overwhelming support for the topology t1 because the commonly
assumed threshold for such interpretation is 5 [71].
2.7 Comparison of Palaeognathae tree topologies
All the phylogenetic analyses imply that the relationships presented in the topology t1 describe the most
probable evolutionary history between the mitochondrial genomes of palaeognaths. Such relationships,
but not always on the full taxa set, were also obtained in other studies based on mitochondrial genes [55,
56], selected nuclear genes [48, 54, 57], the joined set of nuclear and mitochondrial genes [46, 52, 58] as
well as the concatenated alignments of many nuclear markers [45, 59, 60]. However, the application of a
coalescent species tree approach on these markers and the analysis of retroelement distribution
indicated a closer relationship between rheas and the clade of Casuariiformes + Apterygiformes [45, 59,
60]. This phylogeny was also generated for selected nuclear genes [53] and in a supertree approach [47].
These relationships are presented in the topology t2 but are, however, insigni cant for the mitochondrial
gene set. An alternative, poorly supported topology, in which Rhea clustered with Tinamiformes or
Dinornithiformes + Tinamiformes, was also received for some nuclear genes [54, 57].
Thus, two topologies, t1 and t2, aspire to be the real species tree but it is not easy to evaluate which one
is true. Although t1 was found in many studies based on concatenated alignments of many markers, it
Page 9/42has been criticized as a true species tree in favor of t2, which was obtained in coalescent-based
approaches also using huge data sets [59, 60]. The selection of one out these two topologies is
complicated by the fact that the topology t2 is supported by 229 loci and is only the 7th in the ranking of
the most common gene tree topologies, whereas the topology t1 is the 2nd, supported by 280 loci [59].
The largest number of markers, i.e. 357, indicated another topology, in which Rheiformes was grouped
with the clade of Dinornithiformes + Tinamiformes. This discrepancy was explained by the existence of
an empirical anomaly zone resulting from incomplete lineage sorting (ILS) across short internal branches
leading to the last common ancestor of Rheiformes, Apterygiformes and Casuariiformes [59, 60].
Although coalescent species trees account for ILS, simulations showed that species tree methods based
on the gene tree summation may not provide signi cantly better performance over concatenation
alignment methods, which can perform even better [72]. Prum, et al. [45], who applied extensive avian
taxon sampling and loci with slow substitution rates, found no single locus that would be able to fully
resolve the tree topology. They concluded that this lack of phylogenetic information can challenge the
accuracy of a coalescent-based summary approach relative to concatenation. The multispecies
coalescent models work under some conditions [73]. For example, they assume that incongruent gene
trees are independently generated from a coalescence process occurring along the species tree and there
is no selection on the studied genetic markers. Because Cloutier, et al. [60] and Sackton, et al. [59]
analyzed conserved and ultraconserved noncoding nuclear elements, we cannot exclude that they are
involved in essential regulatory functions and then are subjected to selection [74-76], which could
in uence the model assumptions.
Generally, nuclear markers are more prone to ILS and hidden gene paralogy [77-84] than mitochondrial
genes, which are present in a haploid genome and maternally inherited [85]. Thus, the time needed to
completely sort the ancestral polymorphism of mitochondrial DNA is on average four times smaller than
for nuclear genes [86]. Introgression of mtDNA is another reason for the discrepancy between the gene
and species trees. However, this process concerning maternally inherited mtDNA is restricted between
heterogametic avian species because female hybrids are characterized by reduced viability [87-93]. In
agreement with that, a survey of causes of mtDNA gene tree paraphyly in birds found that 8% of studied
species had paraphyly attributable to incorrect taxonomy, and only 3% because of ILS or hybridization,
2% on account of ILS and 1% due to introgressive hybridization [94]. Moreover, the mitochondrial genes
are located on one molecule and are inherited together [82, 95], so they should bear a consistent
phylogenetic signal. Accordingly, analyses based on complete mitogenomes have provided well-resolved
phylogenies of various avian groups [9, 14, 40-42, 96-99]. Nevertheless, it is not inconceivable that the ILS
effect can in uence mtDNA in rapidly radiating taxa, in which on-going speciation occurs before genetic
sorting [100].
2.8 Distribution of mitogenomic rearrangements in phylogenetic trees of Palaeognathae
We considered both t1 and t2 topologies to analyze the presence and absence of the mitogenomic
duplication in the phylogenetic context. Using these relationships, we mapped the mitogenomic features
Page 10/42onto these topologies and inferred ancestral states for the individual lineages using maximum parsimony
(MP) and maximum likelihood (ML) methods (Fig. 6).
Two methods applied to the topology t1 clearly indicated that the last common ancestor of palaeognaths
contained a duplicated region in its mitogenome (Fig. 6a and b). This state was inherited by the ostrich
and rhea lineages. The ML method provided the probability P > 0.982 of this state for the last common
ancestors of all palaeognaths and non-ostrich palaeognaths. The last common ancestor of the remaining
groups, i.e. Dinornithiformes, Tinamiformes, Casuariiformes, Aepyornithiformes and Apterygiformes,
could also contain a duplication with P = 0.899. However, the last common ancestor of Casuariiformes,
Aepyornithiformes and Apterygiformes lost this duplication (P=0.914). In turn, the last common ancestor
of Dinornithiformes and Tinamiformes still had the duplicated region (P= 0.983), which was probably lost
in Tinamus, whereas Anomalopteryx, Dinornis and Emeus maintained only a pseudogenized ND6.
According to the topology t2, the last common ancestors of all palaeognaths and non-ostrich
palaeognaths also had the duplication in their mitogenomes with the probability of at least 0.982 (Fig. 6c
and d). The duplication was preserved in the last common ancestor of Dinornithiformes and
Tinamiformes (P=0.996) as well as the last common ancestor of Rheiformes, Casuariiformes,
Aepyornithiformes and Apterygiformes (P=0.906). Among four latter orders, only Rheiformes maintained
the duplication, whereas the last common ancestor of the other orders had a mitogenome without the
duplicated region (P= 0.914).
One could argue that the traces of ND6 pseudogene in Anomalopteryx, Dinornis and Emeus are equivocal.
Therefore, we conducted analyses in which we assumed that mitogenomes of these genera had already
lost the duplication (Fig. S8 in Additional le 1). However, the general conclusion that the last common
ancestor of all Palaeognathae had a mitogenome with a duplicated region did not change. The
probability of this state was 0.916 and 0.829 for topology t1 and t2, respectively. The last common
ancestor of non-ostrich palaeognaths also had this feature with P=0.889 and 0.697 for these topologies,
respectively.
The above-mentioned scenarios of palaeognath mitogenome evolution assume that the mitochondrial
tree represents the true species tree. However, as discussed in the previous section, the topology t1 is
highly supported by mitochondrial data, whereas t2 is backed up by nuclear markers in coalescent-based
approaches and is regarded as the true species tree by some authors [59, 60]. Assuming that the t1
presents the real mitogenomic history, we superimposed the mitogenome phylogeny onto the potential
species tree (Fig. 7). In order to reconcile the alternative positions of rheas in these topologies, we should
assume that there existed heteroplasmy, i.e. at least two types of mitochondrial genomes, in the last
common ancestor of non-ostrich palaeognaths. Both mitogenomes probably initially contained a
duplication, as indicated by the inferred ancestral states. The lineages of these mitogenomes are marked
in Fig. 7 as 1 and 2. Dinornithiformes and Tinamiformes inherited only mitogenome 2, whose duplicated
regions had begun to fade and likely disappeared in Tinamus. However, the common ancestor of
Rheiformes, Casuariiformes, Aepyornithiformes and Apterygiformes preserved two mitogenomes, but
Page 11/42genome 2 lost the duplicated region during the course of evolution. Then, the mitochondrial lineages were
segregated: mitogenome 1 with the duplication was left in rheas, whereas mitogenome 2 without the
duplication was passed to Casuariiformes, Aepyornithiformes and Apterygiformes.
The assumption about the presence of heteroplasmy in some period of Palaeognathae evolution seems
probable because such genomic diversity has also been reported in various avian groups: Accipitriformes
[5], Bucerotiformes [6], Charadriiformes [7, 101, 102], Ciconiiformes [103], Columbiformes [104],
Gruiformes [105], Passeriformes [106, 107] , Pelecaniformes [16, 108], Piciformes [4], Procellariiformes
[28], Psittaciformes [63], Sphenisciformes [109], Strigiformes [24] and Suliformes [25]. The period in
which the ancestor carried two mitogenomes was likely very short. According to the results of molecular
dating performed by Kimball, et al. [47], the time elapsed since the divergence of the clade
Dinornithiformes+Tinamiformes and that including Rheiformes, Casuariiformes, Aepyornithiformes and
Apterygiformes to the separation of Rheiformes from the three latter orders was only 3.6 million years.
The assumption of heteroplasmy is one of possible explanations. Alternatively, we can assume an
introgression of mitochondrial DNA with a duplication to rheas from an extinct lineage that diverged after
Struthioniformes lineage and before the clade of Dinornithiformes + Tinamiformes. However, this seems
unlikely because the birds involved in this introgression must have had a long evolutionary history after
the separation of their lineages, at least 9 to 3.6 million years according to Kimball, et al. [47]. Thus, they
would probably represent a separate species, which would protect them from hybridization. We would
also have to assume that both the donor and the acceptor of mtDNA, i.e. rheas were still evolving in the
same region, e.g. South America.
2.9 Role of duplication in the evolution of palaeognaths
It was reported that two duplicated control regions can lead to a more effective initiation of replication or
transcription and a greater number of replicating mitogenomes per organelle, which may increase energy
production by mitochondria [65, 66, 110-112]. In support of this, it was found that parrots keeping two
copies of control region in their mitogenomes show morphological features related to more energy-
consuming active ight [23]. Following this nding, we can infer that the last common ancestor of
palaeognaths was volant because mapping of mitogenomic features onto the phylogenetic trees showed
that the ancestor most likely contained the duplicated regions (Fig. 6). This nding corresponds well to
recently proposed scenarios for the evolutionary history of Palaeognathae, which may have originated in
the Late Cretaceous in the Northern Hemisphere [58]. Around the Cretaceous-Paleogene boundary, they
may have migrated to the Southern Hemisphere, where they dispersed widely and diversi ed. They
extended their distribution by long-distance overseas dispersal to the Gondwana-derived landmasses,
such as New Zealand and Madagascar [58]. These long-distance dispersals must have been
accompanied by very good adaptations to active ight. However, modern palaeognath species are
ightless or at most poor yers, i.e. tinamous. Therefore, the maintenance of two control regions in some
palaeognaths may be the legacy of their ancestors. Alternatively, these regions can still provide bene ts
even for ightless species during long-distance walking and running, which require a lot of energy.
Page 12/422.10 Implications for mitogenome evolution in all Aves
The nding that a palaeognath ancestor contained a mitogenomic duplication challenges the common
assumption that this feature evolved independently in individual lineages of Neognathae, i.e. the sister
group of Palaeognathae [13, 22, 29-31]. Increasing amount of data indicates that mitogenomes with a
duplicated region are present in all or a vast majority of representatives of diverse Neognathae lineages,
i.e. Accipitriformes [4, 5, 36-38], Falconiformes [4, 39, 68], Gruiformes [12], Pelecaniformes [4, 15, 16],
Psittaciformes [23] and Suliformes [25]. It suggests that ancestors of these groups could have also
possessed a mitogenomic duplication. The presence of this state was recently inferred for the last
common ancestor of three closely related orders, Falconiformes, Passeriformes and Psittaciformes [14].
Therefore, it is interesting to consider if this feature was present much earlier in the evolution of birds or
even in the last common ancestor of all known Aves.
In order to obtain data for this analysis, we surveyed as well as annotated and reannotated all
avian mitogenomic sequences available in GenBank to identify cases with duplication (Table S6 in
Additional le 2; Figure S9 in Additional le 1). Moreover, we conducted appropriate PCR reactions
checking the presence of duplicated fragments in representatives of selected bird orders, which were
poorly represented in the database (Table 1). Most of PCR products were sequenced to determine the
arrangement of genes located between two control regions (Table S9 in Additional le 2). The thorough
analysis revealed many duplicated regions that were previously omitted.
2.10.1 Searching for duplicated regions in avian mitogenomes
So far, only two representatives of the order Chardriiformes have been shown to have duplication in
mitochondrial genomes: Calidris pugnax (GQ255993.1) and Turnix velox (MK453380.1). However, our
annotation and reannotation of another mitogenomes from Alca torda (CM018102.1), Sterna hirundo
(CM020500.1) and Uria aalge (MN356418.1) revealed the presence of the most fully duplicated avian
region (GO-FD) or its variant (GO-FDr), in which the second control region is remnant (Fig. 8 and Fig. S9 in
Additional le 1). Therefore, we analyzed the mitogenomes of two of these species as well as 18
additional Charadriiformes annotated without duplication to identify a potentially unrecognized
duplication in their mitogenomes. Using diagnostic PCR reactions amplifying a fragment between two
control regions, we found GO-FD gene order in the mitogenomes of Alca torda and Uria aalge (Table 1
and Fig. S10 in Additional le 1) as well as additional 15 other species (paper in preparation). We also
received previously omitted sequences of the GO-FD rearrangement in the mitogenomes of ve additional
avian orders: Cathartiformes (Cathartes aura), Ciconiiformes (Ciconia nigra), Gaviiformes (Gavia arctica,
Gavia stellata), Podicipediformes (Podiceps cristatus) and Sphenisciformes (Spheniscus demersus)
(Table 1 and Fig. S10 in Additional le 1). Moreover, our PCR experiments demonstrated the GO-FD gene
order in the mitogenomes of Apus apus (Apodiformes), Corythaixoides personatus (Musophagiformes)
and Podiceps grisegena (Podicipediformes) (Table 1 and Fig. S10 in Additional le 1). Furthermore, ab
initio annotation of Calypte anna (Apodiformes) and Pu nus lherminieri (Procellariiformes)
Page 13/42mitogenomes deposited in GenBank database revealed the presence of GO-FD (Fig. S9 in Additional le
1). The same gene order has been identi ed in the mitogenomes of Morus serrator (Suliformes) as well
as Ketupa blackistoni and Ketupa avipes (Strigiformes) after reannotation of their duplicated gene
rearrangements (Fig. S9 in Additional le 1).
We also obtained interesting results for sole two species from Eurypygiformes, Rhynochetos jubatus and
Eurypyga helias. For the former, two types of amplifying reactions showed no duplication, because the
length of obtained amplicons corresponded to those predicted based on the reference sequence
(MN356362.1), representing the typical avian gene order (Fig. S11a and b in Additional le 1). However,
three out of nine reactions of the CR1/CR2 fragment gave an amplicon with 4000 bp accompanied by
shorter ones (Fig. S11c in Additional le 1). These results suggest that these products represent NUMTs
and there is no duplication in the Rhynochetos jubatus mitogenome, but it could be present in the past as
indicated by the duplicated fragment transferred to the nuclear genome. For Eurypyga helias, we rstly
ampli ed cytb/12S rRNA region, which produced a fragment 4000-bp longer than expected (Fig. S11d in
Additional le 1). Thus, we checked fragments cytb/CR and CR/12S rRNA (Fig. S11e in Additional le 1).
The latter occurred ca. 3600 bp longer than that in the reference genome, which strongly suggests the
presence of duplication. Moreover, based on the length of amplicons cytb/CR, CR/12S rRNA, cytb/12S
rRNA and obtained sequences, we found that the length of the region located between tRNA-Glu and
tRNA-Phe genes is about 5100 bp. It includes a full CR terminated with repeated motifs, which are
followed by an undetermined part and ended with another microsatellite region (Figure S10 in Additional
le 1). The great length of this fragment indicates that it most likely does not contain only one control
region, because this fragment is 1704 bp longer than the longest single CR found in Asio ammeus
(KP889214.1), so there is enough space for duplicates. Moreover, the length of this fragment corresponds
well to those proved to contain two CRs in 46 representatives of avian orders closely related to
Eurypygiformes, i.e. Charadriiformes, Gaviformes, Gaviiformes, Pelecaniformes, Phoenicopteriformes,
Procellariiformes, Suliformes and Suliuformes [45, 47, 113]. The portions with two CRs are in the range of
2563-5575 bp with the average 3749 bp, which is even smaller than the length of the analyzed fragment
in Eurypyga helias. This fragment should contain an additional but remnant CR and likely some
pseudogenes, because no amplicon was obtained in diagnostic CR1/CR2 reactions (Table S9 in
Additional le 2) and no read was get for tRNA-Pro, ND6 and tRNA-Glu genes in sequencing of CR/12S
rRNA amplicon.
A potential duplication was also noticed after the ampli cation of fragment cytb/12S rRNA for Trogon
collaris, a representative of Trogoniformes (Fig. S11f in Additional le 1). The ampli ed product was ca.
3500 bp longer than expected. According to this, six out nine PCRs designed for CR1/CR2 showed several
fragments with the length from ca. 3300 to 4300 bp indicating the presence of two CRs and their
heteroplasmy (Fig. S11g in Additional le 1).
The data available in GenBank (in the day of 9.10.2020) and obtained in this study indicate that
mitogenomes with sequenced duplications are distributed in 32 out of 43 avian orders (Table S6 in
Additional le 2). Among 1261 species with known mitogenomes, 324 have a duplication and 713 do not
Page 14/42show this feature, whereas in 46, both versions are reported. Among the species without duplication, 45
have partial mitogenomes too. Similarly, the mitogenomes of 187 species are too incomplete to classify
them into one of two categories, with or without duplication. The number of mitogenomes with
duplication is likely underestimated because of di culties with the ampli cation and sequencing of
repeated regions [4]. Accordingly, reanalysis of 13 crane mitogenomes, previously annotated without the
duplication, showed that all of them contain the duplicated region [12]. Similarly, 15 mitogenomes of
parrots from Cacatuidae and Nestoridae also revealed this character after using appropriate PCR and
sequencing methods [23]. The obtained results indicate that underestimation of the mitogenomes with
the duplication ranges from 85% to 100% in the case of Charadriiformes, Gruidae and Psittaciformes. It
should be emphasized that the omission of GO-FD gene order can be common in the ampli cation and
sequencing of avian mitogenomes using standard procedures due to the presence of two nearly identical
copies.
2.10.2 Gene rearrangements in studied avian mitogenomes
The performed analyses revealed new gene orders in avian mitogenomes (Fig. 8). Fully duplicated gene
rearrangement (GO-FD) was found in representatives of 12 avian orders Fig. S9 and S10). Other gene
rearrangements are characterized by various degeneration levels of duplicated elements and were found
in single or at most two avian groups, but some general tendencies can be noticed. The second copy of
cytochrome b is the element that disappeared as the rst in the evolution and shows pseudogene
features already in the fully duplicated versions, GO-FD and GO-FDr. The second gene for tRNA-Thr fades
also quite fast and is present intact only in the fully duplicated gene orders, whereas in GO-NB, GO-NC
and GO-ND it is a pseudogene. CR2 also tends to degenerate because its remnant version is present in
seven gene rearrangements. However, in the case of tRNA-Pro, ND6 and tRNA-Glu, the rst copies were
subjected to decay, whereas the second ones remained. Both copies of these genes are present only in
the fully duplicated versions and GO-I. The same tendencies in the deterioration of duplicated elements
were observed in other avian mitogenomes of Accipitriformes [4, 114], Charadriiformes [115],
Coraciiformes [116], Cuculiformes [10, 117], Falconiformes [4, 14, 29], Passeriformes [13, 14, 29, 41, 102,
118, 119], Piciformes [4, 97], Psittaciformes [23] and Strigiformes [24].
An exception is the gene order GO-NA in Caprimulgiformes, in which the rst versions of tRNA-Pro, ND6
and tRNA-Glu have been preserved, whereas the second ones were lost (Fig. 8). The same rearrangement
was only reported in one representative of Procellariiformes [20], Passeriformes [120] and Psittaciformes
[23]. The bias in the loss and preservation of duplicated elements can result from a speci c selection for
structural organization or a special mechanism of duplication around the control region.
Especially interesting is a gene order found in Chrysolophus pictus from Galliformes because it does not
resemble any rearrangement reported in Aves. Between two control regions, there are: the tRNA-Phe gene,
the 770-nt beginning of 12S rRNA gene, the 66-nt end of ND6 gene and the tRNA-Glu gene (Fig. 8 and
S10). All these sequences are identical with those annotated in the GenBank record (NC_014576.1). Only
the sequenced CR portions show 0.3% and 0.4% difference with the corresponding fragments. This gene
Page 15/42order could have arisen by an insertion of duplicated genes tRNA-Phe and 12S rRNA between CR1 and
ND6-2.
2.10.3 Reconstruction of ancestral states in terms of mitogenomic duplications in Aves phylogeny
The gathered sequence data (Table S6 in Additional le 2) and results of PCR experiments were
used to reconstruct the evolution of mitogenomic duplications in all birds. Using maximum parsimony
(MP) and maximum likelihood (ML) methods, we mapped the data onto the phylogenetic trees of Aves
obtained by Prum, et al. [45], Kimball, et al. [47] and Kuhl, et al. [113], so six approaches were applied in
total. The reconstruction presented in Fig. 9 assumes the duplication state for a given avian order if at
least 33% of its species show this feature or this state was already inferred as an ancestral state, i.e. for
Tinamiformes (in this study, see Fig. 6), Passeriformes [14] and Psittaciformes [23]. This assumption is
reasonable because it corresponds to only 41% underestimation of mitogenomes with the duplication,
which is much smaller than that above-mentioned, 85-100%. This assumption implicates that the total
number of species with such mitogenomes in the avian orders already containing at least one
mitogenome of this type exceeds the number of species without the mitogenomic duplication. It would
strongly suggest that the last common ancestor of these orders also contained the mitogenomic
duplication in the past. As a result, there are such 27 avian orders out of 41 (Fig. 9a and c) or 28 out of 43
(Fig. 9b).
For the tree topology obtained by Kimball, et al. [47], ML method produced 0.67 probability that the last
common ancestor of all Aves contained a mitogenome with the duplication (Fig. 9b). The probability of
this feature was still above 0.5 for the last common ancestors of Palaeognathae (0.83), Neoaves (0.61)
and later diverged clades (³0.62). In the case of Neognathae ancestor, the situation is ambiguous
because the probability of its states is close to 0.5. Nevertheless, this method gave 0.71 probability of the
duplication for all nodes in the tree topologies by Prum, et al. [45] and Kuhl, et al. [113] (Fig. 9a and c). MP
methods applied for the trees by Kimball, et al. [47] and Kuhl, et al. [113] also indicated the that the last
common ancestor of all Aves had a mitogenome with duplication, which was also inherited by ancestors
of deeply diverged lineages, Palaeognathae, Neognathae, Neoaves and its descendants (Fig. 9b and c).
However, for the tree by Prum, et al. [45], this method unresolved the states for the ancestors of these
lineages and all Aves (Fig. 9a). This difference in the reconstruction is mainly caused by the placement of
Caprimulgiformes, for which only ve species with duplication and 20 without it were reported. Then, we
assumed that the ancestor of this order did not contain a duplicated region in its mitogenome. This
lineage diverged as the rst among Neoaves in Prum, et al. [45] but later in the other trees [47, 113].
Concluding, more applied approaches indicate that the last common ancestor of all Aves and main bird
groups contained a mitogenome with a duplication and no method favored the state without the
duplication (Fig. 9). This mitogenomic feature was passed to the ancestors of many modern orders.
Depending on the tree topology, the duplication was lost at least 8 or 9 times independently. Among the
groups with the lost duplication is Galloanserae (including Galliformes and Anseriformes), for which the
duplication was reported for one species in this study. If the duplicated regions are found in more
Page 16/42representatives of avian orders, the presented conclusions would be only reinforced by the reconstruction
of the ancestral states. If we assume the duplication state for all orders for which a duplication was
reported in at least one species, the results of the six approaches will consistently show the ancestry of
mitogenomic duplication (Fig. S12).
This view about the ancestry of the mitogenomic duplication can be further supported by the distribution
of the most fully duplicated avian region (GO-FD). It includes the repetition of cytb/tRNA-Thr/tRNA-
Pro/ND6/tRNA-Glu/CR in which only the cytochrome b gene is pseudogenized (Fig. 1). This
rearrangement type occurs in 68 mitogenomes distributed among 17 bird orders (Fig. 9, Table S7 in
Additional le 2). The length and complexity of this duplication suggests that it is unlikely that it occurred
independently many times (see Fig. 9) because it would require the same recombination pattern and
replication errors [12, 16, 25, 67]. Thus, it seems more probable that this state was inherited from shared
ancestors by the avian lineages that contain this rearrangement type. In other bird groups, the duplicated
regions were subjected to degenerations and loss of selected elements.
Whether the duplicated region is only a neutral trait or can provide a real selective advantage is an
interesting question. Previous studies have suggested that bird species having mitogenomes with the
duplicated control region can be characterized by longer life-span [23, 121] as well as a greater metabolic
rate and energy production [14, 23]. However, further understanding the potential selective advantages of
mitogenome duplications will require direct study at physiological and molecular levels.
3. Conclusions
The obtained results indicate that duplicated control regions with adjacent genes are more common in
Palaeognathae mitochondrial genomes than it was previously thought. What is more, this feature was
most likely present in the last common ancestor of this avian group. Once the duplication occurred, it was
preserved during the evolution of Struthioniformes, Rheiformes and some Tinamiformes. The duplicated
regions were subjected to concerted evolution, which resulted in homogenization of some parts of
duplicated regions and degeneration of others. Reconciliation of the mitogenome-based phylogenetic tree
with a probable species tree based on nuclear markers suggests that the evolution of mitogenomes in
Palaeognaths could have involved different mitogenomic variants in one cell, i.e. heteroplasmy, in a short
period of time.
The distribution of mitogenomes with duplications across the avian phylogenetic tree implies that the
last common ancestors of not only Palaeognathae but also major Neognathae groups and even all
known Aves could have had a mitogenomic duplication, which was then inherited by many modern
lineages. The presence of duplicated regions in mitogenomes can be a neutral feature associated with
the mechanism of replication and recombination or can give a selective pro ts, e.g. more effective energy
production by mitochondria. However, it needs further studies in many avian representatives.
4. Methods
Page 17/424.1 Samples and DNA extraction
Blood, muscle and feather samples from avian species were obtained thanks to courtesy of European
zoological gardens, universities, foundations, aviculture parks, animal rehabilitation centers and private
breeding facilities (Table 1). They were taken as dry blood spots on a ber lter dedicated to laboratory
analyses and were preserved at -20°C in Eppendorf tubes sealed with para lm to avoid damping. Total
DNA was extracted with Sherlock AX Kit (A&A Biotechnology) according to the manufacturer’s protocol.
4.2 PCR strategy for tandem duplication survey
To verify the presence or absence of tandem duplication within the mitochondrial genomes of
Palaeognathae and other avian representatives, we used the strategy proposed by Gibb, et al. [4] and
recently successfully applied to parrot mitogenomes [23]. Because two control regions (CRs) are common
in the majority of avian duplicated rearrangements [22] and the paralogous CRs are usually nearly
identical [12, 63], we designed appropriate primers D-F and D-R that were to anneal to the central parts of
CRs (Table S1 in Additional le 2, Fig. 2). This property makes the PCR strategy diagnostic because the
expected amplicons occur only when two control regions are present in the genome. Due to the high
variability of the control region sequences from the analyzed taxa, it was impossible to use universal
primers, which forced us to design primers speci c to each genus or even species (Table S1 and S9 in
Additional le 2). Based on the selected primers, we ran 12-48 different reactions for Palaeognathae
representatives, 35 for Chrysolophus pictus (Galloanserae) and 4-25 for Neoaves representatives (Table
S1 and S9 in Additional le 2).
4.3 PCR strategy for ampli cation of the mitogenomic fragments containing the whole duplicated regions
The diagnostic fragment designed for tandem duplication survey comprises incomplete control regions,
i.e. the second part of CR1 and the rst part of CR2, as well as genes located between the two CRs.
Therefore, in the case of taxa for which such a fragment was obtained, appropriate PCR reactions were
performed to complete the missing parts of CRs and to reveal the order of genes preceding the CR1. The
obtained partial CR1 sequences were used to design species speci c CR-R primers for ampli cation of
tRNA-Leu/CR1 fragment (for Struthio camelus) or ND5/CR1 fragments (for Rhea americana, Rhea
pennata, Crypturellus tataupa) (Fig. 2). Similarly, the partial CR2 sequences were used to design species
speci c CR-F primers for ampli cation of CR2/16S fragments (for Struthio camelus, Rhea americana,
Rhea pennata) or CR2/12S fragment (for Crypturellus tataupa) (Fig. 2). Appropriate L-F, ND5-F, 12S-R and
16S-R primers were designed based on reference mitogenomic sequences of the analyzed or related taxa
deposited in GenBank (AF338715.1, AF090339.1, AF338709.2, AF338710.2). Suitable elongation times
were applied to avoid ampli cation of tRNA-Leu/CR2, ND5/CR2, CR1/12S and CR1/16S fragments, which
would contain two copies of some genes and/or control regions. Additional diagnostic ND6-1/ND6-2
fragments were ampli ed to con rm that the CR1/CR2 sequences were not errors of the PCR reactions or
copies present in the nuclear genome, i.e. nuclear mitochondrial DNA inserts (NUMTs). Finally, the whole
duplicated mitogenomic regions of Struthio camelus, Rhea americana, Rhea pennata and Crypturellus
Page 18/42You can also read