Study Area Existing Conditions - Natural Environment
←
→
Page content transcription
If your browser does not render page correctly, please read the page content below
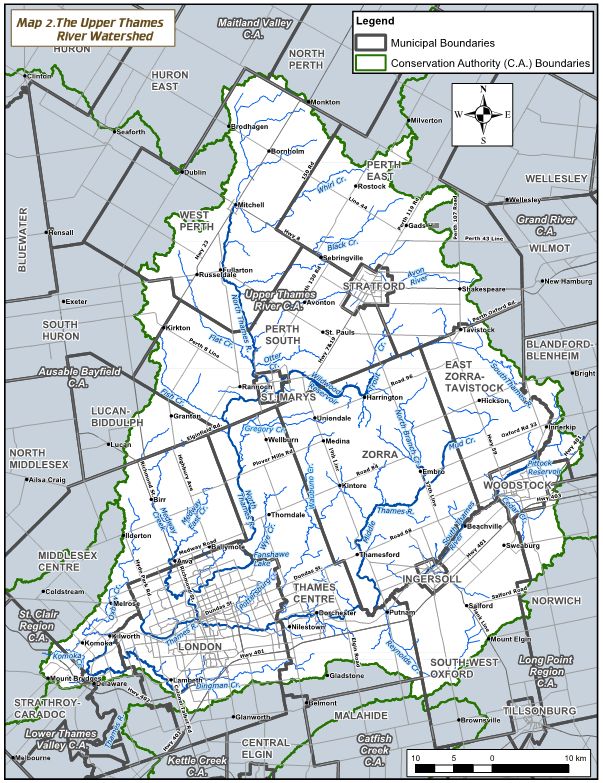
Environmental Assessment Study

3.        Study Area Existing Conditions
3.1       Natural Environment
The Thames River, which flows through the City of London, is one of the largest river systems in Southern
Ontario. The North and South Branches of the Thames River converge near the City’s downtown area at
a location commonly referred to as “the Forks”. The Thames River was recognized as a Canadian
Heritage River in 2000, and is acknowledged to be a river of great natural, cultural, and recreational
importance. The river plays a significant role in the lives of people in the City of London (Dillon et al.,
2011).

The Thames River watershed lies within in the Carolinian Zone (Eco Region 7E), which extends through
southern Ontario from Toronto to Windsor. This ecozone is the most populated zone in Canada, containing
25% of the Canadian population in only 0.25 percent of the Canada’s land mass. The Carolinian Zone hosts
more species than any other region in Canada (Carolinian Canada Coalition, 2016), including many
endangered and threatened species. Ongoing conservation measures, and expanding urban populations
and development makes this zone unique for governance and regulatory agencies.

An overview and description of the natural environment conditions in the One River Study Area are
detailed in the River Characterization (Appendix A-1) and Natural Heritage Summary (Appendix A-2)
reports. Information for these reports was gathered from previous environmental studies completed by the
City, UTRCA and other consultants. To supplement existing data for the One River EA, localized
environmental field programs focusing on the river and aquatic environment were completed in 2017 and
2018. These field programs included fisheries sampling, aquatic habitat mapping, bathymetry surveys
and geomorphic assessments. Findings from these two documents describe the current conditions of the
Thames River and riparian corridor.

3.1.1     Watershed Description

The Thames River in the Study area drains over 3,000 km2 of upstream area. In the Upper Thames
watershed there are three main rivers flowing toward the City of London: North Thames, Middle Thames,
and South Thames (Figure 3-1). Several other large tributaries contribute flow to these main stems
including Medway Creek. The physiography of the watershed is characterized by till plains, till moraine,
and alluvial features around river valleys (UTRCA, 1998). The area’s climate and soils are suitable for
agriculture, and the watershed has been extensively farmed over the last 200 years (UTRCA, 1998). Over
75 percent of the Upper Thames watershed land use is classified as agriculture, with 14 percent
considered natural vegetation and 8 percent urban (UTRCA, 2017a). The large agricultural portion of the
watershed combined with the urban portions leads to 58 percent of the watershed being artificially
drained through tile drainage and/or urban infrastructure. Within the One river study area, the land use is
largely urbanized (80 percent), and runoff is conveyed to the river through storm sewers and outfalls
(UTRCA, 2017a).

In general, the Upper Thames River is set in a confined river valley with steep bluffs and slopes typically
alternating with shallow terracing on the opposite bank (UTRCA, 1998). The channel gradient (slope of
the river) is low and glaciofluvial deposits (sediment deposited by glacial ice and redeposited by
meltwater) underlay the majority of the valley. This low energy (from low slope) and confined setting has
limited the river’s ability to migrate or shift over time. Review of historical photographs of the Thames
River show that besides some local instances such as the oxbow cutoff at the Coves, the river has not
undergone any significant migrations in the last century (UTRCA, 1998).

Forest conditions in the Upper Thames watershed are poor, covering only 11 percent of the watershed,
where the Environment and Climate Change Canada (ECCC) recommendation for a sustainable
watershed is 30 percent (UTRCA, 2017c). Similarly, wetlands make up less than 5 percent of the
upstream watershed, where ECCC recommends at least 10 percent coverage for a healthy ecosystem
(UTRCA, 2017c). Water quality conditions through the watershed are assessed every 5 years based on
total phosphorous, Escherichia coli (E. coli) bacteria and benthic invertebrates. Since 2012, there has
AX0212190922KWO                                                                                           3-1
Environmental Assessment Study

been no change in the water quality conditions, which range from fair (grade C) to poor (grade D) in most
Upper Thames subwatersheds.

Figure 3-1. Upper Thames River Watershed
(adapted from UTRCA, 2017b)

3.1.2     Local Study Area Context

Appendix A-1 and A-2 include many maps of the natural features in the study area including elements
from the London Plan. The maps outline natural features, natural hazards, groundwater recharge,
significant areas, and regulatory limits. Natural features mapping identifies the Thames River and the

3-2                                                                                      AX0212190922KWO
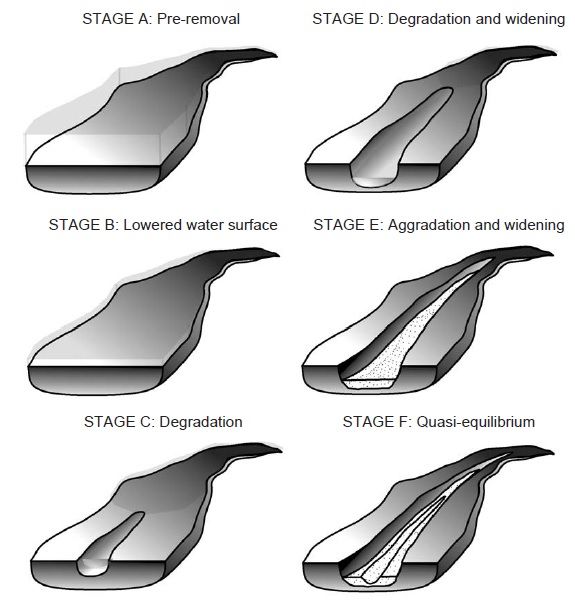
Environmental Assessment Study

surrounding area as a significant wildlife corridor. Woodlands have been mapped through Harris Park
(North Branch), the Thames Park (South Branch) and throughout various sections along the Middle
Thames River. Some unevaluated vegetation patches are also shown near the north side of Springbank
Dam and near the river’s confluence with Mud Creek. The nearest designated Environmentally Significant
Areas (ESAs) are the Coves and Sifton Bog.

The Thames River through the Study Area has been subject to many typical anthropogenic (from human
activity) impacts on river systems. Within the City, the river valley is encroached by urban land use, and
confined by several flood protection dykes, and natural and constructed slopes (Parish, 2014). The level
of encroachment varies as much of the valley lands remain natural or utilized as parkland, providing some
level of a natural or open buffer. Direct and indirect influences from development include efficient delivery
of water through the stormwater network, flow modification from major dams or weirs, and direct
modification to the corridor through slope stabilization, road crossings, and flood-dyke construction and
maintenance.

3.1.2.1   General Dam Impacts

Dams have a direct impact on water elevation, streamflow and sediment movement by modifying water flow,
depth, and velocity. The Springbank Dam has impacted water levels to create extensive (~7 km) backwater
effects to permit recreational boating mainly during the summer months (May to November). When
operational, Springbank Dam raised water levels by more than 3 m, expanding the wetted area within the
valley, and reducing sediment movement in the downstream direction. In turn, the backwater promoted the
deposition of particles of a wide range of sizes within the ponded area, reducing the variability of the channel
shape which would naturally occur. The dam affected the channel’s ability to maintain the dynamic
equilibrium that keeps a natural river healthy. Although the Thames River had free flowing periods in the off-
season months, the winter and spring periods were too short to facilitate the natural recovery of the river
before the beginning of the next recreational season when the dam was again made operational.
Recovery/response following a major change to a river system generally occurs over several years to
decades (Knighton, 1998).

When a dam is removed, there is a typical response whereby the base water level lowers and a period of
degradation and widening occurs creating a sediment wedge within the impounded side (Figure 3-2). As the
channel adjusts to the new free-flowing regime, a bankfull channel establishes within the sediment wedge.

The term “bankfull” represents the condition where water levels in a river are at the top of the banks of the
channel. Bankfull flow represents the maximum capacity for a channel to convey flow before inundating
the floodplain. The prevailing flow that shapes the bankfull channel is often referred to as the “channel
forming” discharge and is thought to have a recurrence interval of 1.5 to 2 years. The conceptual model
detailed in Figure 3-2 may not be entirely applicable to the Springbank Dam as it was seasonally
operated, and presumably, much of the fine sediment was transported downstream during the spring
flows. However, Figure 3-2 does illustrate the trend that has been observed upstream of Springbank
Dam, in terms of the development of a bankfull channel with lateral features, and stabilization of the new
cross-section with vegetation.

AX0212190922KWO                                                                                              3-3
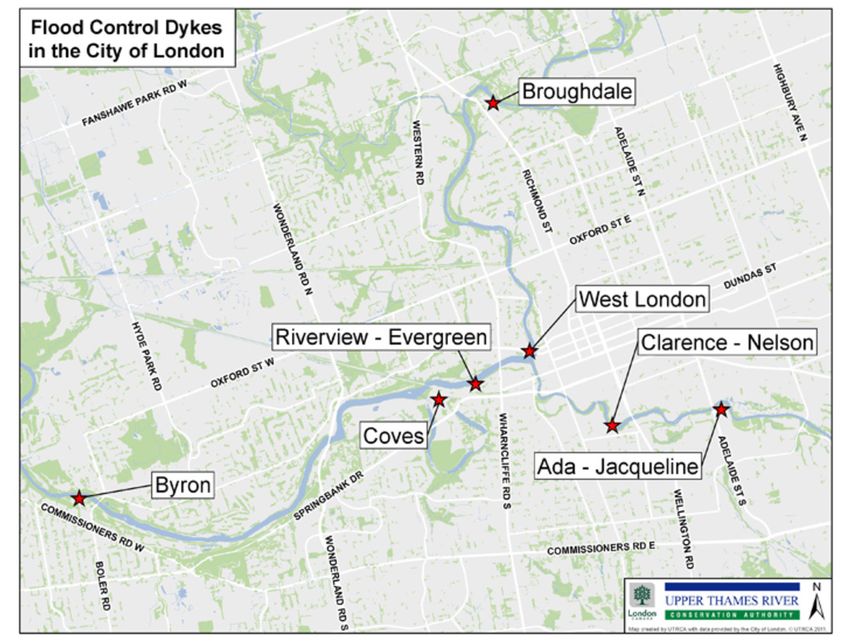
Environmental Assessment Study

Figure 3-2. Conceptual Model of Channel Adjustment Following Dam Removal
(adapted from Doyle et al, 2005).

Three major structures impact the Study Area: Fanshawe Dam, Hunt Weir, and Springbank Dam.
The Central Thames Subwatershed Study suggested that the Fanshawe Dam has had little detrimental
impact to sediment supply or erosion in the downstream reaches (Parish, 2014). However, in general, the
development of surrounding lands, flow management, and the creation of dams and bank hardening has
gradually reduced the actual volume of sediment being supplied to the river. The regulated flows coupled
with a reduced sediment supply have the potential to erode the channel boundaries, presenting risk to
infrastructure where protection measures have not been implemented. With respect to the Springbank
Dam, the Central Thames Subwatershed Study noted that the presence of the dam, even in a
free-flowing condition acts to disrupt the longitudinal conveyance of sediment with localized accumulation
upstream of the Springbank Dam (Parish, 2014).

3.1.2.2   Flood Control and Dykes

The flood-prone area of the Thames River is extensive and historical floods have influenced the
communities of people who have settled in these areas. The City constructed the first system of dykes
after a large flood in 1883 to prevent water entering low-land areas. Dyke construction has continued over
time, and presently there are seven dykes with a total length of approximately 5 km (UTRCA, 2017c).
The seven dykes are shown on Figure 3-3 and are located along the North Thames, South Thames, and
Main Thames Rivers. Within the Study Area, these include the West London Dyke, Riverview-Evergreen,
and the Coves. Portions of the West London Dyke have recently been repaired; however, the Coves and
Riverview-Evergreen Dykes are still awaiting updates.

3-4                                                                                      AX0212190922KWO
Environmental Assessment Study

In addition to the dykes, three upstream reservoirs, The Fanshawe Dam (North Thames), Wildwood Dam
(North Thames) and Pittock Dam (South Thames) are maintained by the UTRCA. These dams were
constructed to provide flood protection as well as other objectives including low flow augmentation and
recreation. The Fanshawe Dam was constructed in 1952, creating the 2.6 km2 Fanshawe Reservoir and
has reduced the risk from flooding. The Wildwood (built in 1965) and Pittock (built in 1967) dams provide
flood control and are also used to augment summer low flow for aquatic habitat and wastewater
assimilation.

Figure 3-3. Flood Control Dykes in the City of London
(adapted from AECOM, 2016)

3.1.2.3   Wastewater Assimilation

The City operates six wastewater treatment plants (WWTPs) which discharge treated effluent to the
Thames River. The wastewater treatment plants discharge approximately 2.30 m 3/s to the Thames River
(City of London, 2017). The largest treatment plant, Greenway, is located 4.5 km upstream of the Dam.
The Greenway plant discharges approximately 1.40 m3/s and is a significant source of flow into the
Thames River through London during low flow periods.

To ensure there is a reliable supply of baseflow during periods of dry weather, the Wildwood and Pittock
reservoirs capture flood waters during the spring freshet, and slowly release that stored water through the
summer and fall period to augmenting downstream dry weather flow. The primary objective for flow
augmentation from Wildwood and Pittock is wastewater assimilation.

3.1.2.4   Urban Storm Sewer Infrastructure

The City’s network of sewer outfalls is extensive. Outfalls are used to convey stormwater and treated
sanitary effluent to the river. Some of the outfalls in the Study Area also function as sanitary sewer overflows
(SSOs), discharging stormwater and sewage directly into the river when the system is overwhelmed during
an extreme wet weather event. Within the Study Area, 42 outfalls are mapped, including five SSOs.

AX0212190922KWO                                                                                              3-5
Environmental Assessment Study

The majority of the outfalls are located within the upstream reaches of the Study Area, along the North
Thames, South Thames, and the Forks areas. Private outfalls also exist along the river including three
outfalls upstream of Springbank Dam along the north bank. The City is currently working on upgrading and
improving their sanitary and combined sewer infrastructure to prevent overflows in the future (City, 2018b).

3.1.2.5   Surface Water Takings

There are a number of operations within the City that have been granted permission by the MECP to
withdraw water from the Thames River. These takings are predominantly commercial golf courses that
are withdrawing water to irrigate turfgrass. Upstream of the Springbank Dam, a City operated golf course
is permitted to withdraw 2,200 m3/day. There are six permitted water withdrawals (all for golf course
operations) downstream of the dam that are permitted to withdraw a total of 16,200 m3/day. When
combined, the maximum permitted water takings are 18,400 m3/day.

3.1.3     River Characterization

The Thames River consists of a wide, low gradient, fairly homogenous channel with a quasi-regular
series of pools, riffles, runs, and several bar formations. Through the City, the River Valley is encroached
by urban land use, and confined by several flood protection dykes and natural and constructed slopes
(Parish, 2014). The level of encroachment varies as much of the floodplain remains natural or utilized
as parkland.

Rivers are dynamic features that develop their geometry in response to streamflow and sediment
characteristics, as well as influencing factors such as land use, climate, direct human intervention,
geology, and vegetation. Over time, morphological (shape of the river channel) adjustments are common
in response to changes in these variables.

3.1.3.1   Hydrology

As a result of the low conductivity soils and agricultural and urban land use in the upstream watershed,
the Thames River flow tends to exhibit a flashy hydrologic response, rapidly peaking and declining in
response to rainfall and snowmelt events. While there are isolated areas that sustain groundwater
discharge, the Thames River is generally seen as an overland runoff-dominated system that does not
generate large amounts of baseflow during periods of dry weather.

The Water Survey of Canada (WSC) has maintained a hydrometric (streamflow) monitoring station on the
Thames River at Byron (Station ID: 02GE002) downstream of Springbank Dam since 1922. To provide
context on the historical flows upstream of the Springbank Dam, Figure 3-4 summarizes and illustrates
daily flow data measured from 1970 to 2015. Typical to southern Ontario, the highest monthly flows occur
in March and April during the spring. Flows then decline into the summer months, reaching the lowest
average monthly flow in August and September, before increasing flows again into the fall. The average
annual flow in the Thames River at Byron is 42.8 m3/s, however when the river is used most for recreation
(between May and October) flows average 22.0 m3/s.

3-6                                                                                         AX0212190922KWO
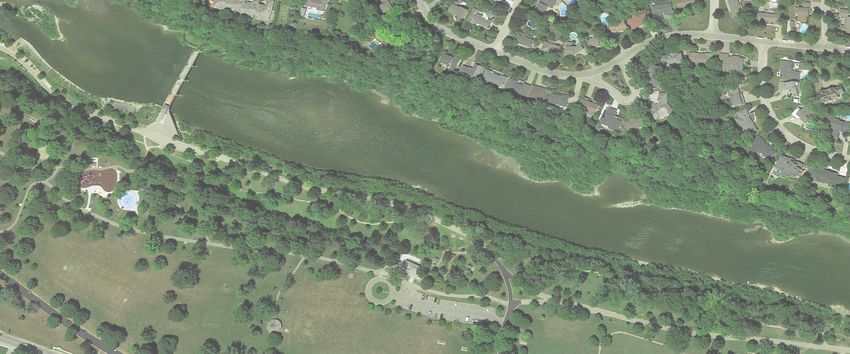
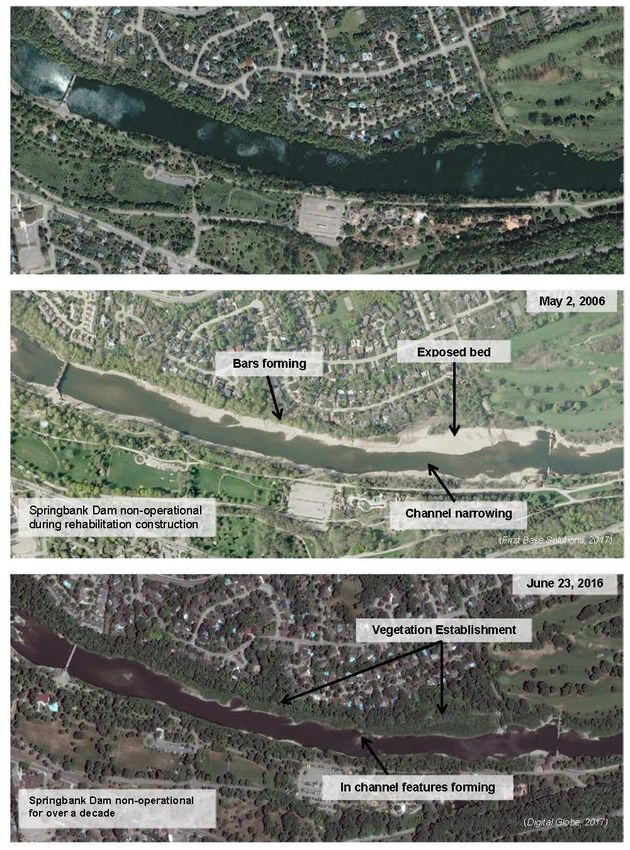
Environmental Assessment Study

Figure 3-4. Water Survey of Canada Station at Byron – Monthly Flow Summary from 1970-2015

Additional flow statistics including peak and low flow statistics for the Main Thames, North and South
branches are provided in Appendix A-1.

3.1.3.2   Riparian and Bank Re-Vegetation

Aerial photograph interpretation and site visits revealed that the Thames River within the former impact
zone of the Springbank Dam has responded to free-flowing conditions by developing a narrower channel,
with bar formations along the margins that have vegetated over recent years (Figure 3-5). This trend is
consistent with the conceptual patterns of an inset bankfull channel development suggested on Figure 3-5
where, over the past decade, lateral and mid-channel bars and benches have vegetated, enhancing their
permanency as grasses, shrubs, and small trees establish and grow. The riparian vegetation is a mix of
native species and invasive species that add root cohesion and roughness, enhancing the overall stability
of the system, and provides a protective buffer to the valley slope.

Vegetated mid-channel bars and lateral floodplain features have become more permanent features
diverting or concentrating flows, (providing variability) and accumulating sediment and nutrients, thereby
enhancing water quality and the riparian zone through nutrient uptake. Prior to the current free-flowing
situation, floodplain features (benches), and island bars were flooded seasonally during dam operation for
extended periods. During these periods of flooding, the settlement of fines and nutrients would occur
throughout the watercourse rather than sorted at select depositional features or on the floodplain.
Riparian areas were submerged during the growing season, and during low flow months, exposed
bars/benches lacked vegetation cover and stability through root cohesion.

AX0212190922KWO                                                                                          3-7
Environmental Assessment Study

Figure 3-5. Aerial Photographs Series of Reach M4 - Upstream of Springbank Dam (1.2 km)

3-8                                                                            AX0212190922KWO
Environmental Assessment Study

3.1.3.3       River Sediment

As the river channel narrows, flows concentrate, which increases flow velocities and shear stress.
These changes increase the capacity for sediment transport and sorting, which enhances the fluvial
(river) and aquatic systems. In general, a coarsening of river bed substrates is expected as a result of
flow concentration. Detailed river bed substrates were characterized at a number of cross-sections in
October 2017. Pebble counts (size of sediment particles) from 2009 and 2012 were available for
cross-sections near the Springbank Dam (2009), and downstream of Wonderland Road near the Rowing
Club (2012). A sediment grain size characterization comparison for these locations is provided in
Table 3-1.
Table 3-1. Grain Size Distribution
                                              Grain Size
                  Location                    Percentile     2017            2009/2012         % Difference

    Rowing Club -(Reach M3)a 2012 - XS7           D10 (cm)   0.80              1.59                -50%

                                                  D50 (cm)   7.39              12.8                -42%

                                                  D90 (cm)   49.2              38.4                28%

    U/S Springbank Dam -(Reach M4)b               D10 (cm)   0.57              0.15               280%

                                                  D50 (cm)   7.10              11.7                -39%

                                                  D90 (cm)   18.3              29.4                -38%
a
    From cross-section 9 in PARISH (2014) Study
b
    From cross-section 9 in PARISH (2010) Study

Based on these comparisons, there is no clear trend in adjustment of the grain size distribution.
Some coarsening is evident upstream of the Springbank Dam. However, only 25 particles were measured
per cross-section in 2009, as compared to 100 in 2017, therefore reducing the ability to produce a
confident interpretation in the perceived adjustment. Unfortunately, substrate characterizations are not
available from a period of Springbank Dam operation to confirm the hypothesis that substrates coarsen
as the sediment wedge is mobilized and flows concentrate during channel narrowing. However, the lack
of fines along the thalweg (center of the river) upstream of the Springbank Dam suggests that there is
little deposition in this area. During field observations, fines were primarily located in bar formations along
the margins, within alcoves and small areas of recirculation.

In addition to river classification based on planform (e.g., meandering, braided, and straight), rivers can
be characterized further based on their dominant material (e.g., sand bed channel, gravel bed channel,
and bedrock). Observations of bed substrates are key to understanding erosion processes, the capacity
for the channel to transport material, bed armouring, and habitat types. Accurate determination of the
particle size distribution of bed material requires sampling and analysis, particularly for coarse bed
material, but for most bed material distributions, rough approximations can be derived from visual
observation. Generalized sediment mapping was completed through the study area and is provided for
each reach in Appendix A-1. The most common sediment types included cobble, boulders, and gravel.

3.1.3.4       Recent High Flow Events

The Thames River is a low gradient system; even large flood events do not produce erosive forces
substantial enough to severely rework local, coarse sediment. Even finer bar formations near the Forks
remain relatively stable, though there is likely a release and collection of sediment as the flood peaks and
falls. Although these bar formations exist in low-velocity zones or areas of expansion, major flood events
have not created any significant modification to these features, or any rapid planform alterations. Table 3.2
shows the dates and magnitudes of each high flow event (events greater than the 2-year flow of 578 m3/s)
from 2006 to 2018. Since the non-operation of the Springbank Dam in 2006, there have only been eight
events greater than 2-year return period and the majority of these events have occurred in 2008 and 2009.

AX0212190922KWO                                                                                               3-9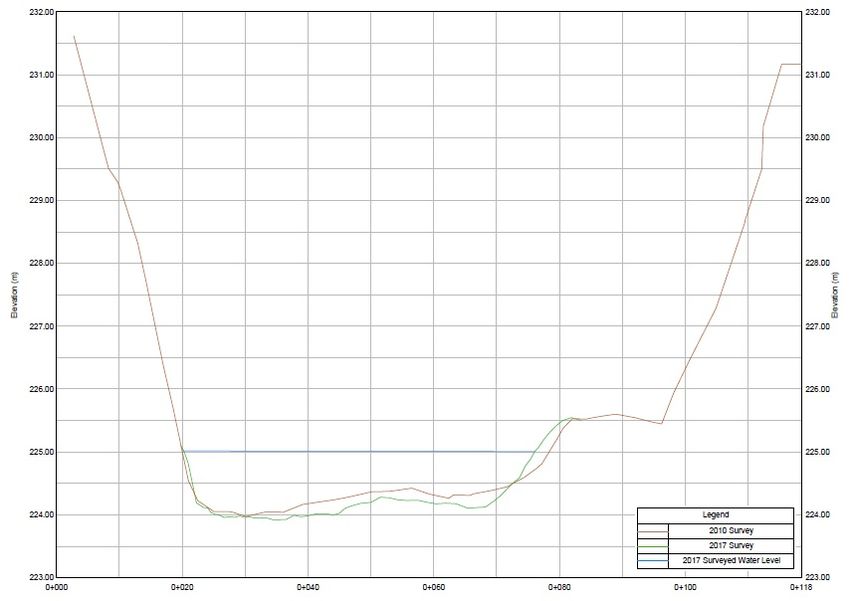
Environmental Assessment Study
Table 3-2. High Flow Events on Thames River Since 2006
Date Flow (m3/s)1 Comparable Return Period Flow
January 10, 2008 601 2-year
April 2, 2008 809 5- to 10-year
December 28, 2008 735 5-year
December 29, 2008 856 10-year
February 12, 2009 800 5- to 10-year
February 13, 2009 826 10-year
March 12, 2013 583 2-year
February 22, 2018 1,020 50-year
The lack of high event flows may be the reason minimal changes in sediment size and morphology was
noted between the 2009 and 2012 sediment size distributions (Table 3.2) and cross-section comparison
(Section 3.1.3.5). Between the 2009/2012 and 2017 sampling periods, only one flow event in March 2013
had flows exceeding the 2-year return period. The February 2018 event occurred after the pebble counts
in October 2017 were collected. Future work should aim to characterize the sediment distribution in the
context of large flood events, and possibly map changes in topography for bedforms to identify locations
where flood events have a morphological response. Such a study would need to span decades in order to
capture significant flood events in such a regulated system.
3.1.3.5 Evolution of the River Channel
Field surveys and desktop analysis were conducted with the intent to identify ongoing adjustments in the
channel cross-section since the period of non-operation of the dam. Surveys completed in October 2017
(Appendix A-1) were compared to available topographic data from the UTRCA hydraulic model and
previous surveys associated with studies of the Springbank Dam and Central Thames (Parish, 2010,
2014). Unfortunately, detailed geomorphic surveys before 2006 are not currently available. Figure 3.6
provides an example of cross-section adjustment over the last 5 years. Although this does not compare
directly with channel form before the free-flowing system, some trends in lateral bar growth are evident,
along with bed degradation. The composition of the bankfull bench, or lateral bar (right side of Figure 3.6),
was primarily cobble and gravel, with a layer of fines, well-vegetated by tall and short grasses, willows,
and other young deciduous trees. Benches were observed throughout the Study Area, having similar
cobble/gravel composition and vegetation types. These benches were evident along one or both banks.
These lateral features had a greater proportion of fine gravels and sands in the upper reaches, compared
to the cobble/boulder benches downstream of Wonderland Road.
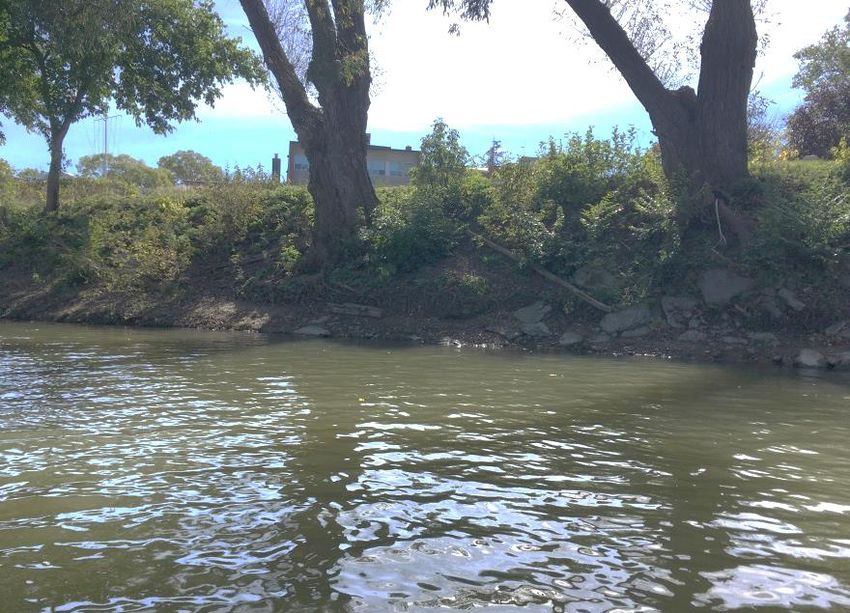
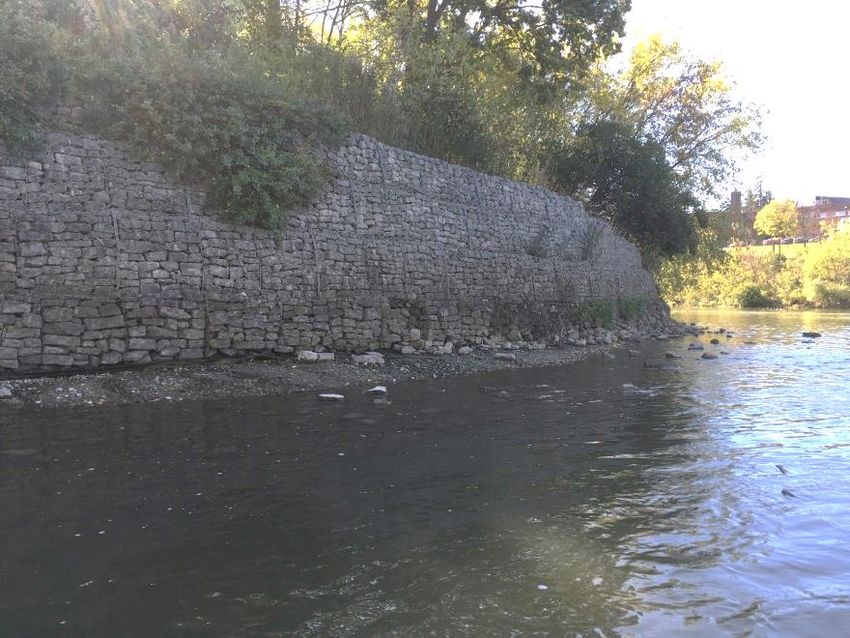
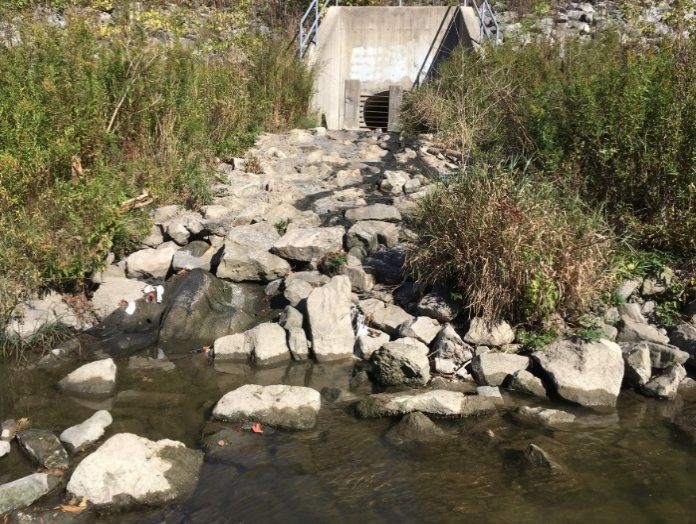
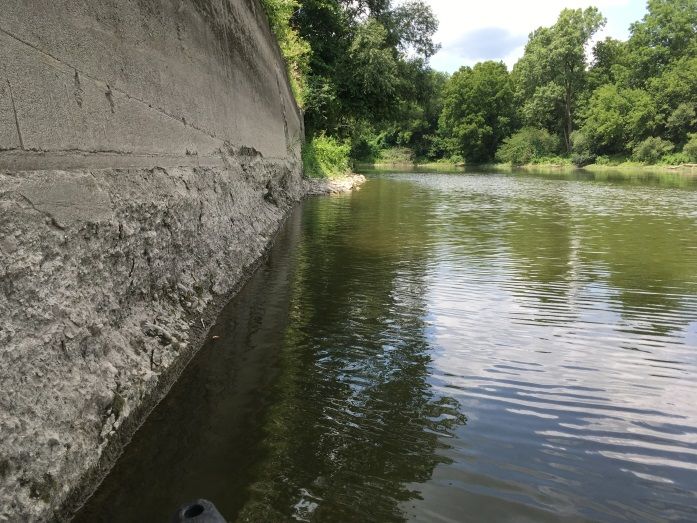
3-10 AX0212190922KWOEnvironmental Assessment Study Figure 3-6. Reach M3 Cross-section Comparison Between 2012 and Recent 2017 Surveys 3.1.4 Natural Hazards and Erosion Natural hazard mapping in the London Official Plan identifies the steep slopes, erosion hazard limits, and special policy areas in the study area (the City 2008a; maps updated in 2015). In addition to the natural hazards noted at many locations, the banks of the river have been artificially hardened in several locations through the application of bank armouring. This hardening is most prevalent along the South Thames, near the dykes, at the Forks, along the Greenway WWTP, and near the Springbank Dam. Zones of active erosion in the Study Area have been previously documented in the Central Thames Subwatershed Study (Parish, 2014). An updated erosion inventory was completed through the study area, which identified areas for remediation to accompany any channel improvements (Appendix A-1). Where the risk is immediate, or appears immediate, a note has been included. A survey of erosion hazards in October 2017 revealed that fluvial erosion (bank and bed scour) was most pronounced near the Forks, extending upstream into the North and South Thames Rivers, and downstream toward the Canadian National Railway (CNR) crossing. At the Forks, observations include failure of gabion baskets (Photo 3-1) as well as failure along steep banks downstream of the confluence posing potential risk to the multi-use trail (Photo 3-2). Toe (base of the river bank) erosion was also observed along the south bank near the Greenway WWTP and the Riverview-Evergreen Dyke, and near the CNR crossing. The latter site showed evidence of scour beneath the concrete retaining wall along the toe of the rail embankment (Photo 3-3). Additionally, permanent lowering of the water level due to Springbank Dam non-operation has resulted in the outflow channels from stormwater outfalls becoming elevated and less stable, with several showing signs of failure (Photo 3-4). AX0212190922KWO 3-11
Environmental Assessment Study

Photo 3-1. Degraded Gabion Baskets at the             Photo 3-2. Over-steepened Banks, Toe Erosion
Forks                                                 Downstream of the Forks (left bank)

Photo 3-3. Localized Scour at Toe of Rail             Photo 3-4. Outflow Channel Slope Failure,
Embankment Retaining Wall                             South Thames

3.1.5     Water Quality

A statistical analysis was performed on available water quality data from three stations: Byron,
Springbank, and Wharncliffe. The objective was to determine if the concentrations of specific water
quality parameters were significantly different over the years with the dam operational, compared to
without the dam. The full water quality report can be found in Appendix A-7.

3.1.5.1   Methods

Raw observed data, typically recorded at a weekly frequency, from the summer months (June through
September) of 1987-2016 at Byron and Springbank, and from 1978-2016 at Wharncliffe, was analyzed
using the R statistics software platform (R Core Team, 2017).

The parameters total phosphorus and suspended solids were chosen for the analysis because a)
sufficient data was available for each parameter across the time periods where the dam was present and
then absent; and b) these parameters are primary indicators of water quality that are more likely to be
affected by the change in hydraulic characteristics associated with the transition from a dammed to free-
flowing river.

3-12                                                                                     AX0212190922KWO
Environmental Assessment Study

The summer data was divided into dry weather and wet weather samples based on analysis of the
cumulative distribution of discharge data at Byron. Close inspection of the plot (Figure 3-7) yielded an
estimate that 22.0 cubic metres per second at Byron was a threshold above which the river was assumed
to be flowing at a wet weather condition, and below which was assumed to be dry weather.
Measurements from common dates at Springbank and Wharncliffe were then categorized as dry weather
or wet weather, based on the discharge measured on that date at Byron. Dry weather samples are of
particular interest, since the presence of a dam is more likely to influence water quality under dry weather
rather than wet weather conditions.

To be conservative, the period with the dam in operation was identified as prior to July 9, 2000 when the
dam was damaged. The period without a dam was identified, again, to be conservative, as July 2008 to
present to account for the time period after the final failure of the new structure. Data from those intervals
were used accordingly for the statistical analysis.

Figure 3-7. Cumulative Distribution Plot of Discharge at Byron

Boxplots were generated for each of the datasets (Figures 3-8, 3-9, and 3-10). Due to the non-normal
distributions of the datasets, the Wilcoxon rank sum test was applied in each case. This test is the non-
parametric analog to the more well-known Student’s t-test. The test was performed to determine whether
the parameter concentration was greater with the dam than without the dam. P-value results less than or
equal to 0.05 indicate statistical significance at the 5% significance level. Average concentration values of
each case were also calculated (Table 3.3).

AX0212190922KWO                                                                                            3-13
Environmental Assessment Study

Figure 3-8. Boxplots of Summer Dry Weather Total Phosphorus Concentrations

On this and the following boxplots, B= Byron, S= Springbank, W= Wharncliffe, 1= period with the dam,
2= period without the dam. Box lines are drawn at the 25th, 50th, and 75th percentiles. Boxplot whiskers
extend to the lesser of 1.5 * the interquartile range or the minimum/maximum datapoint. Outliers are
those points outside the interquartile range.

Figure 3-9. Boxplots of Summer Wet Weather Total Phosphorus Concentrations

3-14                                                                                      AX0212190922KWO
Environmental Assessment Study

Figure 3-10. Boxplots of Summer Wet Weather Total Phosphorus Concentrations

3.1.5.2    Results

Table 3-3 contains statistical analysis results for comparisons of the given parameter with and without the
dam, at summer dry or wet weather conditions.

Table 3-3. Statistical Analysis Results
                          Average
                        Concentration
                          with Dam        Average Concentration        Significantly Greater
                           (mg/L)          without Dam (mg/L)        Concentration with Dam?      p-value

 Total P_dry

 Byron                     0.3262                0.1436                       Yes               < 2.20E-16

 Springbank                0.3246                0.1646                       Yes               < 2.20E-16

 Wharncliffe               0.2084                0.1066                       Yes                6.41E-15

 Total P_wet

 Byron                     0.2807                0.1479                       Yes                0.0002175

 Springbank                0.2689                0.1572                       Yes                0.0008681

 Wharncliffe               0.2078                0.1311                       Yes                0.004358

 Suspended solids_dry

 Byron                      13.62                 12.19                        No                  0.117

 Springbank                 16.51                 12.24                       Yes                 0.0103

 Wharncliffe                19.68                 13.34                       Yes                3.80E-07

The results indicate that total phosphorus concentrations in summer were significantly greater at each
station with the dam, compared to without the dam, both at dry and wet weather conditions in summer. In
particular, during dry weather, the average total phosphorus concentration was about twice as high with
the dam than without the dam at each station. This represents a substantial reduction in phosphorus
concentration during the critical summer period when eutrophication is a greater risk.

AX0212190922KWO                                                                                            3-15
Environmental Assessment Study Average concentrations of dry weather total phosphorus increased downstream and were approximately 50% greater at Byron and Springbank than at Wharncliffe, perhaps due to effluent from the WWTP located between Wharncliffe and Springbank stations. Dry weather average concentrations of total phosphorus at each station were greater at each station than during wet weather, with the dam in operation. However, without the dam, slightly greater average total phosphorus concentrations were observed at Wharncliffe and Byron in wet weather. This shift may be due to a smaller degree of difference in river conditions between dry and wet weather when the dam was not operational. Suspended solids concentrations were significantly greater at the two upstream stations, Springbank and Wharncliffe, with the dam, compared to without the dam, during dry weather in summer. The absence of a dam might have driven a greater degree of change in river depth and velocity at the upstream two stations, yielding a larger decrease in suspended solids there. For both the dammed and free-flowing conditions, suspended solids decreased downstream, perhaps due to dilution. 3.1.6 Terrestrial Ecology The Thames River and valley corridor is known as a unique area for biological diversity that attracts various terrestrial wildlife species. The combination of water, riparian areas, and woodlands promote an opportunity for species to occupy and migrate between a multitude of habitats. The forested valley slopes and wide river corridor separate the natural environment from the surrounding urban landscape. The width and longitudinal connectivity of the terrestrial corridor has increased since the lowering of water levels, allowing for vegetation to establish and more stable slopes to form. A full description of the terrestrial environment is presented in Appendix A-2. 3.1.6.1 Vegetation Vegetation characterization through the area has historically been documented through land use mapping, aerial imagery, ecological land classification (ELC) and flora inventories. The most extensive (spatial) study of vegetation is an ELC completed as part of the ENVision Thames River Valley Corridor Plan (Dillon et al. 2011). The study examined 47 vegetation patches greater than 0.5 ha along the Thames corridor. Between Springbank Dam and the Forks, eight vegetation communities were mapped, including deciduous forest (most dominant), cultural woodland (second most dominant), cultural meadow, mixed forest, coniferous forest, meadow marsh, and open aquatic. A localized shoreline vegetation study was initiated by the UTRCA within the study area. The review was conducted in 2007, 2010, and 2014 and reported in 2015 (UTRCA, 2015a), showing the chronology of vegetation establishment within several vegetation plots within the riparian corridor. The findings from the shoreline vegetation study are of interest as they were a direct observation of the vegetation changes along the river since the non-operation of the Springbank Dam. Vegetation plots were examined for diversity, Floristic Quality Index (an index of vegetation quality based on plant species composition and abundance), and other scoring parameters. Inventories found the number of native and non-native species within the plots to be relatively similar. The Floristic Quality Index increased throughout the plots over time due to the larger number of species found and was considered in the moderate range for diversity. The recommendations in the UTRCA report suggest allowing the vegetation to continue to naturalize and monitor these changes. Over time, the vegetation has since covered over 10 ha of land. Flora Previous flora inventories listed three SAR that have been observed in the area including Butternut (Juglans cinerea), Kentucky Coffee Tree (Gymocladus dioicus), and Red Mulberry (Morus rubra; may be a hybrid). Green Dragon (Arisaema dracontium) was the only species confirmed for the area in the 2016 MNRF species at risk letter and is considered a Special Concern species (Appendix A-2). The remaining SAR flora were all inferred in previous studies based on the presence of other vegetation communities. Several of the floral SAR prefer wet, riverine/floodplain environments including the Butternut and Kentucky Coffee Tree, which could now potentially inhabit the largest riparian environment. However, no plant SAR were found by UTRCA during the three-year vegetation succession study. 3-16 AX0212190922KWO
Environmental Assessment Study

A total of 57 rare species with a S3 ranking or higher (S2, S2, SH, or SX) were listed as potentially
occurring within the study area from previous studies. The majority (53 percent) of these plants were
never found, and only listed as potential, particularly in the West London Dykes Subject Lands Status
Report (SLSR) (UTRCA, 2015d). Of the 57 species identified only four species were observed within the
study area and included Hairy-fruited Sedge (Carex trichocarpa), Hispid Buttercup (Ranunculus hispidus),
Trumpet Creeper (Campsis radicans), and Honey Locust (Gleditsia triacanthos).

3.1.6.2   Terrestrial Wildlife Inventories

Terrestrial wildlife includes birds, mammals, herpetofauna and insects and is separated from aquatic
wildlife. Although terrestrial species may interact with the riverine environment or surrounding vegetation
within the Thames corridor, these species spend much of their life cycle outside of the aquatic
environment. Inventory record reviews were completed through online database searches and atlases
and supplemented with observations from previous reports. A detailed inventory is outlined in
Appendix A-2 and includes 197 birds, 41 mammals, and 34 species of herpetofauna that have been
observed or have the potential to occupy the study area.

Birds observed in the area from previous studies cover several different families including swallows,
thrushes and woodpeckers. Geese, ducks, herons and kingfishes along with other aquatic birds and
water fowl have also been observed utilizing the area upstream of the dam. Generally, birds will utilize the
Thames River and adjacent corridor for foraging, nesting, and shelter, with overwintering occurring in
areas of faster moving water that is not prone to freeze up.

As the Thames River is surrounded by parkland and interspersed by natural lands, mammals generally
utilized the Thames River as interconnected habitat allowing opportunities to exploit the urban setting.
Common wildlife tolerant of human disturbances are able to thrive within the Thames corridor and
maintain a healthy population within the city. Sightings of several mammals have been observed within
the study area including rodents, beavers and larger mammals such as coyotes and white-tailed deer.

Herpetofauna, collectively known as amphibians and reptiles, include snakes, turtles, lizards, frogs, toads,
salamanders, and newts in Ontario (Ontario Nature, 2017). Many of these species utilize river habitats for
a wide range of functional habitat needs including foraging, breeding and nesting. The most common
herpetofauna documented recently within the study area include the Eastern Spiny Softshell turtle,
Eastern Gartersnake and Northern Map turtle.

Birds

Of the 23 potentially occurring bird species at risk in the area, eight have been observed including: Bank
Swallow (Riparia riparia), Barn Swallow (Hirundo rustica), Chimney Swift (Chaetura pelagica), Common
Nighthawk (Chordeiles minor), Eastern Meadowlark (Sturnella magna), Olive-side Flycatcher (Contopus
cooperi), and Wood Thrush (Hylocichla mustelina). Many of these species were found along the South
Thames and the Coves, where more meadow environment exists adjacent to the Thames River Valley.
Some species such as the Olive-sided Flycatcher will use forests adjacent to rivers and wetlands for
breeding where other such as the Chimney Swift and Barn Swallow will use the river for foraging.
Furthermore, a total of 19 Species of Conservation Concern (SCC) were confirmed within the study area.

Mammals

There are 42 mammal species that have the potential or have been observed in the study area based on
the OMA and previous studies. An inventory of mammal species from background contains typical urban
mammal species. Potential occurrences from each study were based on previously recorded
observations.

Only 14 of the 42 mammals were observed within the study area. The most common sightings were Grey
Squirrel (Sciurus carolinensis), White-tailed Deer (Odocoileus virginianus), Eastern Chipmunk (Tamias
striatus), and Raccoon (Procyon lotor).

AX0212190922KWO                                                                                          3-17
Environmental Assessment Study

Five SAR mammals were listed as having potential to occur in the area. The Small Footed Bat (Myotis
leibii) was the only SAR mammal observed during the previous studies North Branch. No SCC were
observed within the study area.

Insects

One SAR insect (Rusty patched Bumble Bee (Bombus affinis)) was listed as potentially occurring within
the area but was never observed. Six SCC butterflies were identified as potentially occurring within the
area. One of these species (Monarch (Danaus plexippus)) was sighted during several of the previous
studies. Monarchs feed on milkweed which prefers wet soils such as riverbanks and other riparian areas.

Herpetofauna

The majority (75%) of Ontario’s reptile species are listed as SAR. The major cause of listing is due to
habitat loss and fragmentation, as these species tend to occupy more sensitive habitats (e.g., wetlands
and shorelines).

A total of 34 species were identified as potentially occurring within the study area. Eight of the
herpetofauna that have potential or have been observed within the study area are classified as SAR. The
Eastern Spiny Softshell (Apalone spinifera) was the only confirmed SAR within the study area. The Spiny
Softshell turtle, unlike other turtle species, uses the riverine environmental for all critical life-cycle
requirements including breeding and foraging. It is the most documented and well-known SAR to inhabit
this area of the Thames River.

Two SCC observed within the study area include the Northern Map turtle (Graptemys geographica) and
Common Snapping Turtle (Chelydra serpentine serpentine). These two species also utilize the river for
critical habitat needs (e.g. hibernating).

3.1.7     Aquatic Ecology

Aquatic habitat within the study area has historically been impacted by the operation of the Springbank
dam which resulted in backwater upstream of the dam for several kilometers, creating a lentic (still water)
ecosystem. This low energy environment limited sediment movement which, in turn, has resulted to
minimal variation in bed forms and a more uniform habitat for aquatic life. Since 2006 the riparian corridor
has been expanding and creating a larger functional habitat along the channel margins. Vegetation
establishment along the banks have developed into dense shrub growths, creating a littoral zone in areas
that were formerly submerged and bordered by retaining walls and dykes.

Previous reports on the aquatic habitat within the area have been limited and generally subject to studies
surrounding structural components such as a dyke or bridge. The Byron Dyke SLSR completed in 2017
(UTRCA, 2017), concluded that the habitat within the subject lands (downstream of the dam) was in good
condition with optimal scores for channel flow, riffle frequency and epifaunal cover. Suboptimal scores
were given for bank stability. Similarly, the West London Dykes SLSR aquatic habitat assessment
completed in 2015 (UTRCA, 2015d), concluded that the subject lands at the Forks was also in good
condition with high scores for epifaunal cover and low amounts of sedimentation. Suboptimal scores were
given for riffle frequency, banks stability, and riparian zone width.

The study team completed detailed aquatic habitat mapping at four locations within the study area; the
Forks, Greenway Park, the Old Pumphouse, and Springbank Dam. The aquatic habitat mapping aligns
with the 2017/2018 fisheries locations and aided in identifying microhabitats as well as food sources and
reliable migration routes.

3.1.7.1   Aquatic Wildlife Inventories

UTRCA identified over 150 aquatic fish, mussel and amphibian/reptile species that inhabit the Thames
River and adjacent tributaries (UTRCA, 2017d). Inventories of fish, mussels, herpetofauna and benthic

3-18                                                                                       AX0212190922KWO
Environmental Assessment Study

macroinvertebrates are documented by agencies such as DFO, MNRF, and UTRCA since 1967. To
supplement the agency studies with recent data, additional fisheries surveys in 2017 and 2018.

Fisheries

Background fisheries data has been compiled by fish sampling records from DFO, Royal Ontario
Museum, MNRF, and UTRCA between 1967 and 2018. In the study area, a total of 68 different fish
species have been documented from the UTRCA records between 1967 and 2018 (Appendix A-2). The
most common species found over the sampling period were Greenside Darter (Etheostoma blennioides),
Rock Bass (Ambloplites rupestris), Smallmouth Bass (Micropterus dolomieu), and Striped Shiner (Luxilus
chrysocephalus).

The 2017 fisheries surveys in Appendix A-7 and the 2018 fisheries surveys in Appendix A-4 and A-5
focused on four select areas: the old pump house upstream of Springbank Dam, Greenway Park
upstream of Wonderland Road, the Fork and the South Thames Branch, just south of the Forks. During
both visits, the most common species caught were members of the minnow family making up over 80% of
the total species sampled. The most common individual species sampled were Common Shiner (Luxilus
cornutus), Rosyface Shiner (Notropis rubellus), Emerald Shiner (Notropis atherinoides) and Silver Shiner
(Notropis photogenis). The free-flowing river system has allowed for the development of vast areas of
riffle, flats and coarse substrates that support large schools of these minnow species.

Since the spatial and temporal extents as well as the methods of collection for each of the fisheries
programs varied, it is difficult to draw conclusions about population changes and trends. There is no direct
connection between the presence of fish species within the area before and after the operation of
Springbank Dam in 2006. However, the number of Silver Shiner observed have increased with current
studies (2011-present) where previously Silver Shiner were only document downstream during the 2003
Riverbend survey.

The Distribution of Fish Species at Risk (DFO 2017) maps are provided in Appendix A-7. The map
indicates that the Special Concern species and species under consideration for listing (Endangered or
Threatened) have critical habitats throughout the study area. The DFO mapping did not indicate critical
habitat within the study area for fish species.

Springbank Dam Fish Passage Study

A study completed by Biotactic in October 2010 (Biotactic, 2010), monitored 3 years of fish movement at
the Springbank Dam during open flow conditions. Fish passage data from three species with varying
swimming abilities and migration timing windows, White Sucker (weak), Shorthead Redhorse (moderate),
and Smallmouth Bass (strong), were monitored each year for various components of fish passage (e.g.,
attraction, efficiency). The data was compared to the pre-construction data from 2006 during a period
where the Springbank Dam was not in operation and the stop logs were not in place. The findings of the
study summarized that although the dam does provide some interference to fish passage, it is not seen
as a complete barrier.

Mussels

The Thames River hosts the second most diverse freshwater mussel population in Canada
(UTRCA, 2017d). Freshwater mussels typical thrive in free-flowing riverine environments where oxygen is
plentiful, siltation is minimal and there is the presence of species specific host fish that each mussel
requires to develop from larvae.

Historical mussel surveys were conducted by UTRCA, DFO and Environment Canada in 1998 and 2015
near the Springbank Dam and the North and South Thames tributary sections. Over 20 species including
live and shell relics were identified within the study area. Eight SAR mussels have been documented to
occur or have the potential to occur within the study area. Mudpuppy (Simpsonaias ambigua) and Wavy
rayed Lampmussel (Lampsilis fasciola) were found within the Main branch. Rainbow (Villosa iris), Rayed
Bean (Villosa fabalis), and Round Pigtoe (Pleurobema sintoxia) were found in sections upstream of the

AX0212190922KWO                                                                                           3-19
Environmental Assessment Study

Forks in the South and North Thames River branches. Hickorynut (Obovaria olivaria) and Kidneyshell
(Ptychobranchus fasciolaris; also SAR) were listed as potentially occurring, but were never found in the
previous studies.

The DFO map of the Distributions of Mussel Species at Risk in Appendix A-7, shows that critical habitat
has been outlined for Mapleleaf (Quadrula quadrula) and Round Pigtoe within the study area.

Since 2004, no mussel surveys have been completed upstream of the Springbank Dam or in the main
Thames branch. The lack of current sampling efforts within the river have limited the understanding of
current assemblages, however it is anticipated that these species would likely still be present in the area
or have migrated downstream from the North and South Thames branches, now that a free-flowing
riverine environment has been established.

Benthic Macroinvertebrates

Benthic macroinvertebrates (benthics) are organisms that live on the bottom of a water body (or in the
sediment) and have no backbone. Benthics are typically sampled at riffles/run habitats in the spring or fall
season, and their taxonomy is classified by family and/or genus levels. The number of benthics in each
family/genus level is then related to various biotic indices. These indices are used to determine the health
of the river based on the sensitivity and tolerance to pollution at a given location within the river.

Both water quality and benthic monitoring on the Thames River has been ongoing since by the City since
2006. The City’s BioMap monitoring program uses several indices to determine the spatial and temporal
trends in water quality of the Thames River. The program has not found any significant improvement
trends in the biotic indices upstream of the Springbank Dam (Matrix, 2016). The best benthic and water
quality sites continue to be found in the North and South Thames River. These sites had scores that
indicate fair to good water quality conditions. The poorest quality conditions continue to be found in the
main Thames River, with biotic index scores indicating fair to fairly poor water quality. The decrease in
water quality downstream of the North and South branch confluence is attributed to the number of
combined sewer overflows and Greenway Pollution Control Plant effluent nutrient loading contributions.

3.1.8     Significant Species

Both federal and provincial species classifications and rankings were used to characterize significant flora
and fauna found in the study area. Each classification system at the federal and provincial levels defines
the level of species and habitat protection.

3.1.8.1   Species of Conservation Concern

A total of 93 SCC were identified as occurring or potentially occurring within the study area. The potential
SCC were assessed to identify if their preferred habitats were present within the study area (Appendix A-7).

The results of the assessment indicated that of the 93 species identified for the study Area, 17 species
were listed as potentially occurring, and 27 species were confirmed. A summary of the potential and
confirmed species are provided in Table 3.4. A detailed description of SCC is provided in Appendix A-2.

3-20                                                                                       AX0212190922KWO
Environmental Assessment Study

Table 3-4. Potential and Confirmed SCC within the Study Area
    Natural feature                       Potential                                 Confirmed

 Flora                •   Black-eyed Susan                       • Hispid Buttercup
                      •   Brainerd’s Hawthorn                    • Honey Locust
                      •   Hairy-fruited Sedge
                      •   Tall Coreopsis
                      •   White-haired Panic Grass
                      •   Wild Four-o'clock

 Birds                • Black-billed Cuckoo                      •   Bald eagle
                                                                 •   Baltimore Oriole
                                                                 •   Belted Kingfisher
                                                                 •   Brown Thrasher
                                                                 •   Eastern Kingbird
                                                                 •   Eastern Towhee
                                                                 •   Eastern Wood-pewee
                                                                 •   Field Sparrow
                                                                 •   Great Blue Heron
                                                                 •   Green Heron
                                                                 •   Killdeer
                                                                 •   Mallard
                                                                 •   Northern Flicker
                                                                 •   Northern Rough-winged Swallow
                                                                 •   Rose-breasted Grosbeak
                                                                 •   Savannah Sparrow
                                                                 •   Sora
                                                                 •   Spotted Sandpiper
                                                                 •   Wood Duck

 Herpetofauna         • Eastern Ribbon Snake                     • Common Snapping Turtle
                                                                 • Northern Map Turtle

 Fish                 • Northern Brook Lamprey                   • Striped Sucker
                      • Spotted Sucker

 Mussels              •   Black Sandshell                        • Elktoe
                      •   Deertoe                                • Mucket
                      •   Pink Heelsplitter
                      •   Purple Wartyback
                      •   Wabash Pigtoe

 Insects              • Hackberry Emperor                        • Monarch
                      • Tawny Emperor

3.1.8.2    Species at Risk

The Thames River is known as the only true Carolinian River in Canada and is one of the main reasons
that many SAR and Special Concern species are potentially occurring upstream of the Springbank Dam
and, generally, within the Thames River. Accordingly, this unique setting hosts species whose northern
ranges are limited or non-existent in other parts of Ontario and Canada.

A review of existing information and previous studies indicated that 59 SAR listed as Endangered or
Threatened have potential to occur in the study area. While some species only have the potential to
occupy the area based on habitat preferences and historical information, many SAR have been observed
to utilize the study area for migration as well as residence.

Species observations and habitat potential were used to assess which species are present, or have the
potential to be present, within the study area. The results of the assessment provided in Appendix A-2,
indicate of the 59 species identified, 10 species have confirmed observations within the study area, 13
species have the potential to occur within the study area, and 36 were considered to be unlikely to occur
within the study area based on the existing habitat. The results of the assessment are provided in
Table 3.5. A detailed description of SAR is presented in Appendix A-2.

AX0212190922KWO                                                                                        3-21
Environmental Assessment Study
Table 3-5. Potential and Confirmed Species at Risk within the Study Area
SARA ESA
Common Name SRANK (Federal) (Provincial) Likelihood of Occurrence
Flora (14)
American Chestnut S1/S2 END END Unlikely
Bird’s-foot Violet S1 END END Unlikely
Blue Ash S2? SC THR Unlikely
Butternut S2? END END Confirmed
Cucumber Tree S2 END END Potential
Drooping Trillium S1 END END Unlikely
Eastern Flowering Dogwood S2? END END Unlikely
False Hop Sedge S1 END END Unlikely
False Rue-anemone S2 THR THR Unlikely
Kentucky Coffee Tree S2 THR THR Confirmed
Purple Twayblade S2/S3 THR THR Unlikely
Red Mulberry S2 END END Potential
Spoon-leaved Moss S1 END END Unlikely
Wood-poppy S1 END END Unlikely
Birds (21)
Acadian Flycatcher S2/S3 END END Unlikely
Bank Swallow S4 THR THR Confirmed
Barn Owl S1 END THR Unlikely
Barn Swallow S4B THR THR Confirmed
Bobolink S4B THR THR Unlikely
Canada Warbler S4 THR SC Unlikely
Cerulean Warbler S3B END THR Unlikely
Chimney Swift S4B, S4N THR THR Confirmed
Common Nighthawk S4B THR SC Potential
Eastern Meadowlark S4B THR THR Potential
Golden- winged Warbler S4 THR SC Unlikely
Henslow's Sparrow SHB END END Unlikely
Kirtland’s Warbler S1 END END Unlikely
Least Bittern S4B THR THR Unlikely
Loggerhead Shrike S2 NAR END Unlikely
Northern Bobwhite S1 END END Unlikely
Olive-sided Flycatcher S4B THR SC Potential
Prothonotary Warbler S1 END END Unlikely
Red-headed Woodpecker S4B THR SC Unlikely
Wood Thrush S4B THR SC Confirmed
Yellow-breasted Chat S2B END END Unlikely
Turtles (3)
Blanding’s Turtle S3 THR THR Unlikely
Eastern Spiny Softshell S2 THR END Confirmed
Spotted Turtle S2 END END Unlikely
Snakes and Salamanders (5)
Butler’s Garter Snake S2 END END Unlikely
Eastern Hog-nosed Snake S3 THR THR Unlikely
3-22 AX0212190922KWOEnvironmental Assessment Study
SARA ESA
Common Name SRANK (Federal) (Provincial) Likelihood of Occurrence
Eastern Massasauga S1 END END Unlikely
Jefferson Salamander S2 END END Unlikely
Queensnake S2 END END Potential
Mammals (4)
American Badger S2 END END Unlikely
Eastern Small-footed Bat S2/S3 Not Listed END Potential
Little Brown Bat S4 END END Unlikely
Northern Bat (N. Long-eared bat) S3 END END Unlikely
Insects (1)
Rusty-patched Bumble Bee S1 END END Unlikely
Fish (3)
Silver shiner S2S3 SC THR Confirmed
Black Redhorse S2 NAR THR Confirmed
Pugnose Minnow S2 SC THR Unlikely
Mussels (8)
Wavy-rayed Lampmussel S1 SC THR Confirmed
Salamander Mussel S1 END END Potential
Hickorynut S1? No Status END Unlikely
Rainbow mussel S2S3 END SC Potential
Rayed bean S1 END END Potential
Round pigtoe S1 END END Potential
Kidneyshell S1 END END Potential
Mapleleaf mussel S2 THR SC Potential
Notes:
END = Endangered
NAR = Not at Risk
SC = Special Concern
THR = Threatened
3.1.9 Natural Environment Summary
The natural environment of the Thames River can be best described as a truly unique system known not
only for its ability to sustain a great variety of aquatic species, but also for its biological diversity that
attracts various terrestrial wildlife species. The steep forested valleys and wide, shallow watercourse
provides areas for many species to occupy, migrate and interact within the system. Since the non-
operation of the dam, the river and riparian corridor has continued to diversify following the new flow and
sediment regimes, trending toward a new dynamic equilibrium.
As the channel continues to change after the non-operation of the dam, a more meandering shape can be
expected to develop. In general, the channel response to the free-flowing system will be limited due to the
existing boundaries from natural confinement, and confinement imposed by urbanization and
infrastructure such as dykes. With recreational lands (i.e., parks) and infrastructure (i.e., dykes, bridges,
and treatments) extending along the entire study Area, there is little opportunity for lateral migration of the
river into the floodplain. Channel narrowing will continue; however, lateral confinement coupled with a
lack of available floodplain can still promote channel incision and associated instability. Although there
have been some clear channel trends and changes of the Thames River in the study Area, which is most
evident in the aerial photograph analysis, evolution of the Thames River channel will continue to adjust
and change slowly over time. The recovery/response to a river system can take decades (Marston and
Knighton, 1986) and will largely depend on the frequency and magnitude of flows that occur.
AX0212190922KWO 3-23You can also read