The Lower Thames Crossing - Kent County Council August 2010
←
→
Page content transcription
If your browser does not render page correctly, please read the page content below
The Lower
Thames Crossing
Kent County Council

KPMG Regeneration and Funding Report
Final Version

August 2010

Important notice
The information in this report is based upon information provided by or on behalf of Kent County Council and reflects
prevailing conditions and our views as of this date, all of which are accordingly subject to change. In preparing this
report, we have relied upon and assumed, without independent verification, the accuracy and completeness of all
information provided to us.
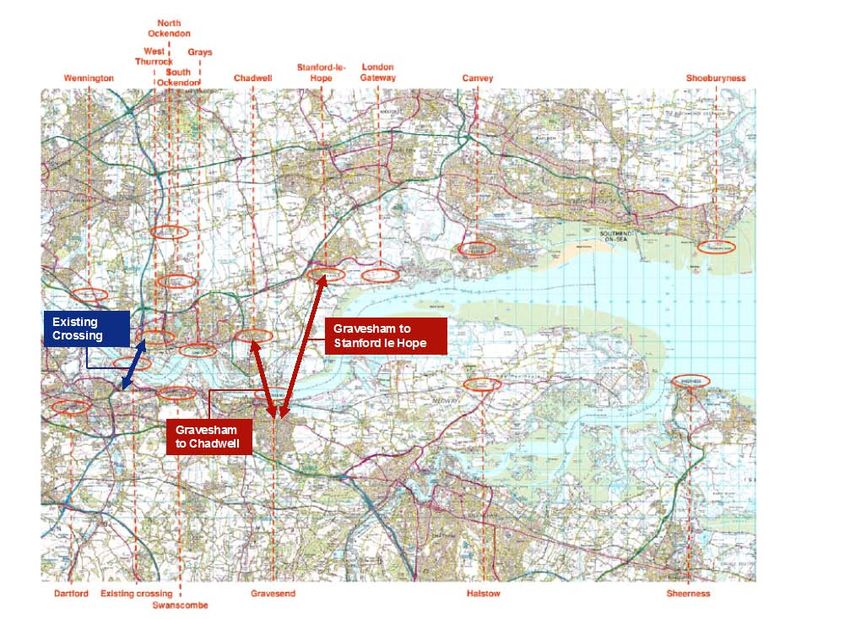
The quantitative economic analysis contained in this report is related to three alternative Lower Thames crossing options:
from east of Gravesham to Stanford-le-Hope; from east of Gravesham to Chadwell and close to or at the existing
Dartford crossing. Analysis of funding and procurement approaches relates to the proposed Gravesham to Stanford-le-
Hope crossing. Although we endeavour to provide accurate and timely information, there can be no guarantee that such
information is accurate as of the date it is received or that it will continue to be accurate in the future. No one should act
upon such information without appropriate professional advice after a thorough examination of the particular situation.
This report was prepared for Kent County Council and can only be circulated within the terms of the engagement
contract signed between the Council and KPMG LLP. Any party who obtains access to and chooses to rely on this report
(or any part of it) will do so at its own risk. Whilst the information presented and views expressed in this report and
related discussions have been prepared in good faith, Kent County Council and KPMG LLP accept no responsibility or
liability to any party in connection with such information or views.
The Lower Thames Crossing Kent County Council
@ 2010 KPMG LLP, a UK limited liability partnership, is a subsidiary of KPMG Europe LLP and a member firm of the KPMG
network of independent member firms affiliated with KPMG International Cooperative, a Swiss entity. All rights reserved.
Contents

1   Executive Summary ___________________________________________________________ 1
    1.1    Likely regeneration impacts                                                                                           1
    1.2    Funding                                                                                                               2
    1.3    Financing and procurement approaches                                                                                  5
    1.4    Conclusions                                                                                                           5
2   Introduction __________________________________________________________________ 7
    2.1    Background                                                                                                            7
    2.2    Purpose of this report                                                                                                7
3   Economic assessment framework ________________________________________________ 9
    3.1    Introduction                                                                                                          9
    3.2    Overview of methodology                                                                                               9
    3.3    Measuring connectivity                                                                                            10
    3.4    Data sources                                                                                                      13
    3.5    Assessing business location choice                                                                                18
    3.6    Considering relative connectivity and business mobility                                                           19
    3.7    Assessing agglomeration and productivity                                                                          20
    3.8    Testing scenarios                                                                                                 21
4   Strategic economic and regeneration impacts ______________________________________ 22
    4.1    The scenarios tested                                                                                              22
    4.2    Changes in business location                                                                                      23
    4.3    Changes in productivity                                                                                           23
    4.4    Implications for economic output                                                                                  24
5   Costs _____________________________________________________________________ 25
    5.1    Capital costs                                                                                                     25
    5.2    Maintenance costs                                                                                                 25
    5.3    Unitary charge under a PPP                                                                                        26
6   Toll revenues _______________________________________________________________ 27
    6.1    Toll revenues from a Stanford-le-Hope to Gravesham crossing                                                       27
    6.2    Relationship with the existing Dartford crossing                                                                  28
7   Funding ____________________________________________________________________ 30
    7.1    Distinguishing funding from finance                                                                               30
    7.2    Funding from Department for Transport                                                                             30
    7.3    European support                                                                                                  30
    7.4    Lorry road user charging                                                                                          31
    7.5    Capturing economic benefits                                                                                       31
8   Procurement and financing options ______________________________________________ 33

                                                                     The Lower Thames Crossing Kent County Council
     @ 2010 KPMG LLP, a UK limited liability partnership, is a subsidiary of KPMG Europe LLP and a member firm of the KPMG
      network of independent member firms affiliated with KPMG International Cooperative, a Swiss entity. All rights reserved.
8.1 Introduction 33
8.2 Review of the project from a procurement perspective 34
8.3 Conventional procurement and delivery partner approaches 36
8.4 Public Private Partnership 36
The Lower Thames Crossing Kent County Council
@ 2010 KPMG LLP, a UK limited liability partnership, is a subsidiary of KPMG Europe LLP and a member firm of the KPMG
network of independent member firms affiliated with KPMG International Cooperative, a Swiss entity. All rights reserved.1 Executive Summary
KPMG has been commissioned by Kent County Council to undertake a high level assessment of the wider
economic and regeneration impacts of a new Lower Thames crossing and potential funding, financing and
procurement options for delivering this. The analysis of wider economic and regeneration impacts on local areas
in North Kent and South Essex has considered three crossing options: new capacity at or near to the existing
crossing location; a new crossing between Chadwell and Gravesham and a new crossing from Eastern
Gravesham to Stanford-le-Hope. Assessments of how a new river crossing could be funded and financed as well
as high level procurement options are based on a proposed crossing from Eastern Gravesham to Stanford-le-
Hope.
1.1 Likely regeneration impacts
The proposed new crossing sits within the wider context of the Thames Gateway Growth Area, the UK’s largest
regeneration project. The Thames Gateway growth area stretches from East London to North Kent and South
Essex. The Thames Gateway delivery plan outlines an expected growth in jobs of 225,000, and 110,000 new
1
homes by 2016 although these projections however were produced before the recession of the recent years,
and may not now be achievable.
Improving connections between the north and south of the river in the Thames Gateway would make travel
between them easier, expanding the size and depth of local labour markets on both sides of the river and
enabling easier trade and business to business communication across the river. The economic evidence
suggests that improvements in connectivity could lead to improvements in productivity and in attracting increased
economic activity to the area.
Three scenarios have been considered in the quantitative analysis of regeneration impacts:
■ A scenario where capacity is increased at or close to the existing crossing;
■ A new crossing from Stanford-le-Hope to Eastern Gravesham; and
■ A new crossing from Chadwell to Gravesham.
See Figure 8 on page 22 for a map of crossing options considered. Relieving congestion at the existing Dartford
crossing would improve the experience of users of the existing crossing. However, this would not offer new
journey opportunities or connections between businesses in local areas on different sides of the Thames estuary.
The new crossing options that we have examined downstream of the existing bridge would provide decongestion
benefits on the existing crossing and a new range of journey opportunities offering larger journey time savings for
some trips. For example, both the Stanford-le-Hope to Eastern Gravesham and the Chadwell to Gravesham
options would improve connections from the Medway towns to the North and from Southend and Chelmsford to
areas in Kent and to Dover.
Analysis suggests that the productivity benefits through agglomeration of economic activity could be around:
■ £2m 2 per annum from reducing congestion on the existing crossing;
■ £15m per annum from a new crossing from Chadwell to Gravesham; and
■ £11m per annum from a new crossing from Stanford-le-Hope to Eastern Gravesham.
1
The Thames Gateway Delivery Plan, HM Government, 2007
2
Expressed as an annual benefit in 2021 in 2002 prices
The Lower Thames Crossing Kent County Council 1
@ 2010 KPMG LLP, a UK limited liability partnership, is a subsidiary of KPMG Europe LLP and a member firm of the KPMG
network of independent member firms affiliated with KPMG International Cooperative, a Swiss entity. All rights reserved.Note that these are annual figures and do not represent a discounted flow of benefits as is common in transport
appraisal. These results assume no changes in land use and have been estimated using parameters drawn from
the DfT’s WebTAG appraisal guidance.
There is evidence that the connectivity offered to businesses by the road network is related to business location
choice, although the economic evidence to quantify such relationships is unclear in the data that has been
available to us. While there is some uncertainty over the appropriate parameters for forecasting local employment
outcomes, assumptions consistent with the best fit statistical equations suggest that the increase in employment
in the areas of North Kent and South Essex could be around:
■ 1,000 from reducing congestion at the existing crossing;
■ 4,000 from a new crossing from Stanford-le-Hope to Eastern Gravesham; and
■ 6,000 from a new crossing from Chadwell to Gravesham.
Within this local geography, such employment impacts would have a larger influence on local economic output
than changes in business productivity. The overall GVA impacts of the Chadwell to Gravesham crossing could be
around £334m per annum in 2021 at 2002 prices. This implies that the discounted value of additional growth in
economic activity in the study area as a result of this scheme could be £12.7bn, although this should be treated
with caution as future changes in additional employment and productivity have been treated as constant over
time. Changes in these benefits over time will therefore affect this analysis.
The changes in connectivity brought about by the different crossing options indicates that a crossing to the east
of the existing Dartford crossing would have a significantly larger impact on the connectivity of the areas in North
Kent and South Essex where aspirations for future economic growth are high. If access to potential employees
and access to other businesses does affect the attractiveness of locations as places to do business, then the
impacts on employment in North Kent and South Essex could be up to eight times larger if new crossing capacity
is provided to the east of the existing crossing rather than simply relieving capacity at the current crossing
location.
The local economic growth implications of a proposed new crossing fit in well with the context of the new
government’s spending review and focus on economic outcomes for funding infrastructure schemes.
The modelling has not taken into account resilience and reliability impacts of a new Thames crossing.
Reassignment of traffic from the Dartford Crossing will enable bifurcation of traffic on an already very congested
part of the road network. This in turn will generate congestion relief benefits, and reduce variability in journey
times. The benefits of network resilience will not only be captured by local traffic, but also at a regional and
national level, and is in line with the recent London to Dover DaSTS study.
1.2 Funding
The total capital costs of the Lower Thames crossing have been estimated by MVA Gifford and Capita as being
in the region of £1.0bn in 2008 prices, including an allowance for risk and optimism bias of £0.4bn. These costs
have been used throughout the report but KPMG makes no comment as to their accuracy.
Our analysis of funding options has considered:
■ The role of toll revenues;
■ Alternative central government funding sources such as national networks capital budgets, the Regional
Funding Allocation or PFI credits; and
■ Alternative sources of funding such as lorry road user charging and mechanisms for capturing the economic
benefits that could be brought to the local area.
The Lower Thames Crossing Kent County Council 2
@ 2010 KPMG LLP, a UK limited liability partnership, is a subsidiary of KPMG Europe LLP and a member firm of the KPMG
network of independent member firms affiliated with KPMG International Cooperative, a Swiss entity. All rights reserved.The new crossing would work in tandem with the existing Queen Elizabeth II Bridge and Dartford tunnel, offering
a substitute route and relieving capacity constraints on the current crossings. The Thurrock-Dartford crossing is
currently tolled so we have assumed that the new crossing would also be tolled in order to avoid creating
incentives for people to make longer journeys. Tolling strategy for the two crossings must therefore be
considered together.
Toll income could contribute different amounts to the capital costs of the project depending on tolling policy and
which tolls are available to support the scheme costs.
The interrelationship with tolls on the existing crossing creates some complexity in determining the funding and
financing approach. If considered together, the combined crossing revenue could represent the single most
important potential source of funding for the scheme. The existing crossing currently generates a net operating
surplus of over £40m from its operations now that the capital costs of the crossing have been paid off.
Tolls on the existing crossing act as a tax on movement across the river which make these journeys less
attractive and could restrict the regeneration potential of the study area. Economic modelling of a scenario
without tolls on the existing bridge indicated a potential increase in local employment by around 2,000, and
additional annual economic output of over £115m if these tolls were taken away. As the capital cost of the bridge
has been paid for, an argument could be made that the net operating surplus of the existing bridge should accrue
to the local economic area that currently feels the impact of the toll and which could be used to fund additional
local economic development, for example to fund a new Lower Thames Crossing. In this case, the revenues from
the existing crossing could support around half of the debt required to pay for the capital costs of a new bridge.
However, the existing toll revenues accrue to the DfT and can be deployed for other uses. Hence, a case for the
crossing needs to be prepared that demonstrates both value for money and meets wider DfT objectives. More
broadly, the case must demonstrate that the proposed crossing is of national importance and warrants
redeployment of the revenue from the Dartford crossing or other sources to enable it.
If net revenues from the existing crossing are not made available to fund the new crossing, revenues on the new
crossing represent no more than perhaps 20% of the overall scheme costs, subject to the rate of growth of traffic
after completion. This figure assumes that current toll levels are maintained, and is based on current traffic and
revenue estimates provided to us. It is net of operating costs. Information about long term changes in toll incomes
associated with demand growth has not been available to us. The new crossing would provide relief for the
existing crossing which is effectively full, so demand growth for cross river traffic is likely to be accommodated by
the new crossing. This may imply faster than usual demand growth which could result in relatively high traffic
growth on the new crossing. This growth could increase the share of capital costs that could be supported by toll
income from the new bridge. If tolls on the new bridge are considered net of abstraction from the existing
crossing, then the ability of this funding stream to support the capital expenditure becomes very limited.
Potential revenue generation from tolling of the New Lower Thames crossing is limited by the current low tolls on
the existing Dartford crossing and the high level of substitutability of the crossings. A commercial toll on both
bridges could generate substantial additional income to support the cost of the new crossing. Demand for travel
across the crossing is thought to be relatively inelastic, so changes in tolls are likely to have only a small adverse
impact on traffic levels, although this could be significant for some user groups. Further work on tolling levels and
their impact on demand and the affordability of the new crossing is recommended.
Other central government funding is likely to be limited over the coming years. The existing indicative 10 year
RFA budget is already subscribed and is likely to come under pressure in the spending review in the autumn,
with expected cutbacks, the abolition of the regional tier and new prioritisation techniques. National networks
capital budgets are likely to come under similar pressure. Indeed, transport is not one of the departments that has
been protected from expenditure cuts and transport projects have already been targets of emergency cuts. In the
short term, it cannot be assumed that either direct capital grants or PPP credits will be available, although over a
longer timeframe, the growing capacity constraint and national significance of the crossing may make it a priority
for central government investment.
The Lower Thames Crossing Kent County Council 3
@ 2010 KPMG LLP, a UK limited liability partnership, is a subsidiary of KPMG Europe LLP and a member firm of the KPMG
network of independent member firms affiliated with KPMG International Cooperative, a Swiss entity. All rights reserved.Our indicative analysis suggests that other sources of possible funding towards meeting the costs of the New
Lower Thames crossing are not likely to be material to the scheme’s overall affordability unless the funding gap is
already narrowed by a material change to tolls or a substantial other funding source. One exception to this is lorry
3
road user charging. The new government’s coalition agreement commits it to introduce this if elected. If
implemented, it could provide additional income for central government and, if improvements to key freight routes
were part of a combined investment initiative, then a case could be made for some of this income to support the
Lower Thames crossing as a strategic national priority. If taken forward, a national initiative would overtake other
options to implement a local scheme. To deliver transport investment, innovative forms of local funding are
therefore likely to play a larger role. Transport for London, for example, is investigating tax increment financing
approaches from expected development to fund the Northern Line Extension.
Recent work by the Department for Transport indicates that the Lower Thames crossing is a strategic national
priority and that central government is actively considering options for it. In April 2009 the DfT published a study
outlining possible proposals to improve traffic flow at the Dartford crossing, and assessing possible options for a
new crossing in the longer-term. Following the Budget in March 2010, the Dartford crossing has been identified
as one of a number of assets within the Operational Efficiency Programme for which government is considering
ways of changing the ownership or management through the sale of a concession to operate for example, in
order to extract maximum value. This has given additional impetus to consideration of new crossing options and
how they could be accommodated within a revised framework for the existing crossing.
Other sources of possible funds could capture some of the local economic benefits that the scheme may deliver.
Using assumptions on employment densities set out in the English Partnerships guide to employment densities,
the additional employment numbers would require up to 170,000 sqm of new development to be built implying
developer contributions could be between £1.7 and £5m. This is insignificant compared to the capital cost of the
new bridge.
Overall impacts on economic output will also have implications for tax revenues. A tentative assumption would be
that 35% of the GVA impacts are captured in taxation and could thus contribute up to £117m per annum (35% of
£334m) in new tax income from local businesses within the study area implying additional business rate income
of around £6m per annum. This could represent a more significant funding stream if it can be captured. Tax
increment financing or supplementary business rate approaches could both be used to appropriate some of these
benefits. However, imposing any general business levy is likely to be seen as unacceptable because of its
negative impact on the local and regional economy. These will need to be explored more fully once the scheme
reaches a full business case development stage.
The Medway towns are expected to be some of the most significant beneficiaries of the enhanced connectivity
provided by the two new crossing options, with areas local to the new crossings also benefitting. Dispersion of
the potential regeneration benefits over a wider area suggests that potential financial mechanisms to capture
benefits (such as for example, Section 106 or Community Infrastructure Levy contributions, tax increment
financing approaches or local supplementary business rates) must target a wider area rather than the immediate
vicinity of new bridge infrastructure.
In parallel, Kent County Council should enter into dialogue with the EU to ascertain whether a case could be built
for TEN-T funding. EU grant support, equal to up to 10% (or exceptionally 20%) of total eligible costs, represents
a substantial building block to the affordability package. EIB funding of up to 50% of eligible borrowing, while it is
a loan and not a grant, could assist in the scheme’s affordability by helping to minimise cost of finance.
3
The Coalition: our programme for government, Cabinet Office, May 2010, Page 31
The Lower Thames Crossing Kent County Council 4
@ 2010 KPMG LLP, a UK limited liability partnership, is a subsidiary of KPMG Europe LLP and a member firm of the KPMG
network of independent member firms affiliated with KPMG International Cooperative, a Swiss entity. All rights reserved.1.3 Financing and procurement approaches
Two broad approaches towards procurement were considered, with different implications for the management of
risk and approach to whole life cost. These are:
1. conventional procurement (which, for the purposes of this review, means that Kent County Council and its
delivery partners take the majority of the asset specific risks); and
2. an approach which includes a greater involvement by the private sector in the whole life risks and project
costs through a Public Private Partnership (PPP) structure.
We are aware that the new government has made some adverse comments about the Private Finance Initiative
but they are understood to wish to encourage the use of third party revenues in infrastructure development. In
general, the features of undertaking a PPP are that the private sector will take the majority of the cost based risks
and will use more complex financing tools to fund the project than are available to the public sector. By
comparison, a conventional procurement approach involves a more selective approach to risk sharing and enjoys
lower costs of borrowing but with a less sophisticated range of financing arrangements.
There is a prima facie case for the formation of a PPP. The promoter could also consider the payment of
substantial milestone capital contributions, funded through PWLB borrowing, to further improve affordability. This
procurement approach should be reinvestigated once government transport policy and the project revenues and
costs are better understood. However, the cost of PPP borrowing remains high and any procurement analysis
should be undertaken under a twin-track of PPP and a conventional (possibly delivery partner based) approach
up to the point of development which allows and informed value for money choice to be made.
Although the requirement to manage considerable finance and construction risks suggest that PPP may be a
preferred option, any formal appraisal should however actively consider both approaches in tandem, focused on
the objective of securing best value for money.
1.4 Conclusions
The proposed New Lower Thames crossing project is a significant piece of infrastructure to reduce congestion at
one of the busiest parts of the national transport system. It is expected to provide alterative routes for long
distance traffic of national importance as well as offering enhanced local connectivity to support the economic
and social development of the region. The proposed crossing could also contribute to improved public transport
links between Kent Thameside and South Essex Growth Areas. It is the aspiration of both Kent and Essex
County Councils to connect the Fastrack and South Essex Rapid Transit (SERT) BRT schemes via the Dartford
and Lower Thames Crossings to provide a public transport link between the Kent Thameside and South Essex
Growth Areas.
Initial quantitative assessment of regeneration impacts suggest that a new crossing from Chadwell to Gravesham
could support up to an additional 6,000 jobs within the study area of North Kent and South Essex and productivity
benefits from agglomeration of around £15m per annum in 2021. Within this local geography, such employment
impacts would have a far larger influence on local economic output than changes in business productivity. The
overall GVA impacts of the Chadwell to Gravesham crossing could be around £334m in 2021 at 2002 prices, if
accounting for the GVA impacts of additional employment moving into the study area. Note that this is an annual
number and not a discounted value as is common in transport appraisal.
Given the traffic forecasts we have had access to and under current tolling arrangements, toll income is unlikely
to cover the capital cost of the project. If toll revenues on the existing crossing form part of the funding package,
then these could support around half of the debt required. However, new toll income generated by the crossing is
unlikely to meet a significant proportion of the capital costs of a new crossing. The Department for Transport is
likely to consider toll income, net of abstraction from the existing crossing and net of operating costs in the
business case for the project. A strong economic case is therefore required to demonstrate the case for use of
The Lower Thames Crossing Kent County Council 5
@ 2010 KPMG LLP, a UK limited liability partnership, is a subsidiary of KPMG Europe LLP and a member firm of the KPMG
network of independent member firms affiliated with KPMG International Cooperative, a Swiss entity. All rights reserved.existing tolls or other public funds. The strategic nature of the crossing, potential links to lorry road user charging
and potentially significant forecast growth from future suppressed demand indicate that there may be a case for
allocating national investment funds. In order to progress this, we recommend that a cost benefit analysis and
business case is developed.
The funding contribution from tolls could rise significantly if long term traffic growth projections net of changes in
the existing crossing on the new crossing are high. However, even in this case there is likely to be a significant
funding gap. It therefore seems likely that the majority of the shortfall would have to be met through changes to
tolling arrangement, cross subsidy from the existing crossing or from other central government sources.
The substitutability between the existing and new crossings argues for an integrated approach to tolling. The
extent of the funding shortfall will be driven by the user charging regime (if any) that is put in place. It is our view
that the option that may derive the largest income, and therefore make the largest contribution to the project cost,
is the development of a joint “Lower Thames crossing corridor” approach with user charges linked to the concept
of providing a high standard motorway route between Kent and the Channel ports, and the rest of the UK. Tolls
on both routes would need to be similar to avoid potentially biasing traffic towards longer and less efficient routes.
Differential tolls could also undermine the aspiration to introduce a system of bifurcation for traffic heading from
the North and East of London to the Channel Ports (via the LTC/M2/A2 and QEII/M20/A20 corridors
respectively). Under a joint crossing concept, tolling of the Lower Thames crossing could be enhanced by a share
of income from the existing crossing, potentially including some extra-inflationary toll increases to assist
affordability.
The resulting change in local economic activity and development may also provide opportunities for alternative
funding sources to contribute to the construction of a new crossing provided suitable mechanisms for capturing
them can be implemented.
The Lower Thames Crossing Kent County Council 6
@ 2010 KPMG LLP, a UK limited liability partnership, is a subsidiary of KPMG Europe LLP and a member firm of the KPMG
network of independent member firms affiliated with KPMG International Cooperative, a Swiss entity. All rights reserved.2 Introduction
2.1 Background
The proposed Lower Thames crossing is a strategically critical scheme, to meet current and future demand and
to reduce the high level of congestion currently affecting the Dartford crossing.
The current Dartford crossing is a highly congested arterial route, providing access between the main channel
crossings and areas north of the Thames, and for regional traffic between Essex and Kent. In response to the
high level of congestion on the route, The Department for Transport commissioned a report from Parsons
Brinckerhoff Ltd to identify options for adding capacity and outlining the technical issues relating to them. This
study, issued in January 2009, drew up a series of options ranging from operational improvements to the existing
Dartford crossing, to the development of an additional crossing. In 2009, the government also published the
Operational Efficiency Programme Asset Portfolio which highlighted the Dartford crossing as one of a number of
strategic national assets for which new delivery arrangements are being considered. This presented options for
alternative asset options taking into account the need for future capacity increases. Together, these documents
imply that the government considers the Dartford crossing to be of national significance and demonstrate their
active consideration of policy options for a new Lower Thames crossing.
Separately to the DfT commissioned report, in 2008, Kent and Essex County Councils jointly commissioned a
study from Gifford, MVA Consultancy and Capita (henceforth referred to in this report as the MVA study) to
evaluate similar options. This report builds on that study, and in particular takes the cost and traffic forecasts set
out in the MVA study as being correct.
Kent County Council has concluded that the so-called ‘Option C’ (a crossing between Stanford-le-Hope and East
of Gravesham) is the preferred crossing location. The funding and finance analysis in this report focuses on that
option and assumes that the crossing will be a bridge and not a tunnel.
The scheme is a major capital project. No dedicated budget for the New Lower Thames crossing Project has
been identified by local or Central Government, although we are aware that the Department for Transport is
considering the potential development of a new crossing as part of its assessment of the Dartford crossing. We
understand that current revenue budgets going forward are fully accounted for, and that the current capital
programme exceeds budgets. Therefore it is essential to determine from which sources the project might
ultimately be funded if it is to proceed to the procurement stages.
The project will have to compete against other projects for the allocation of public resources. As such, the
business case for funding will need to be compelling, demonstrating that:
■ There is a robust value for money case for government funding;
■ The crossing is of strategic national importance and importance in securing local development objectives; and
■ All of the viable options to secure external income have been fully explored.
This report considers the strategic economic benefits of supporting development in the Thames Gateway and
possible sources of revenue, such as toll charges, and considers the extent to which such sources might meet
the estimated costs of the project. As a part of the development of this paper we have considered recent revenue
generating schemes and funding alternatives from UK and worldwide experience.
2.2 Purpose of this report
Kent County Council has commissioned KPMG to appraise the scheme’s potential to support local economic
development and to provide an initial high level review of options for funding, financing and procurement.
The Lower Thames Crossing Kent County Council 7
@ 2010 KPMG LLP, a UK limited liability partnership, is a subsidiary of KPMG Europe LLP and a member firm of the KPMG
network of independent member firms affiliated with KPMG International Cooperative, a Swiss entity. All rights reserved.This report provides a high level assessment of:
■ Likely regeneration outcomes using a model of regeneration potential developed by KPMG; and
■ Options for funding, financing and procuring a new crossing based on indicative cost and revenue estimates
from early studies of engineering feasibility and traffic impacts.
Applying information currently available to Kent County Council, the funding, financing and procurement
evaluation is developed as follows:
a) Review of the estimated costs and revenues attributable to the New Lower Thames crossing Project;
b) Consideration of the potential funding sources may be available to fund the scheme; and
c) Consideration of the merits of conventional procurement against a PPP scheme are and what the issues that
will affect that decision will bring.
At the date of this report, the future availability of government funding for transport is uncertain. For the purpose
of this report however, it is assumed that the environment is considered to be similar to that currently in
existence, excepting that it is highly unlikely that significant new sources of grant funding will be available from
UK Central Government for the foreseeable future. However, once the estimated costs of the New Lower
Thames crossing project are fully understood and the political landscape clarified, options for funding may be re-
examined as a part of the Project Business Case. It is important that funding choices reflect a degree of realism
with regard to their potential future availability.
This study has been undertaken as a desk review, with additional information sourced from recent transactions in
the sector that have been advised on by KPMG. It is recommended that this report is updated once transport
policy has been confirmed by the new government, and that KPMG should commence a dialogue with each of
the parties named to extend our mutual understanding of the project and to clarify the opportunities that each
option may offer. As a precursor to formal discussions, however, Kent County Council should develop its
understanding of the costs and revenues associated with the project, leading ultimately the formation of a
Business Case.
The Lower Thames Crossing Kent County Council 8
@ 2010 KPMG LLP, a UK limited liability partnership, is a subsidiary of KPMG Europe LLP and a member firm of the KPMG
network of independent member firms affiliated with KPMG International Cooperative, a Swiss entity. All rights reserved.3 Economic assessment framework
3.1 Introduction
This section describes the methodology employed to assess the potential economic impact of crossing options
and data sources used for the economic assessment, including the South Essex Transport and Land use Model
(SETLUM) and the Kent Thameside model (KTS). Data from the SETLUM model has been kindly provided by
Essex County Council.
3.2 Overview of methodology
Transport is one of a number of factors that can affect business location decisions and the competitiveness of
places. The transport network makes possible journeys to different kinds of economic opportunities and
determines the ease or difficulty of accessing these opportunities.
To better understand the impacts that the construction of a second Thames crossing could have on local
communities and development, Kent County Council and its advisors have developed a methodology for
assessing the impacts of transport interventions on economic output as measured by Gross Value Added (GVA).
This methodology is based on how changes in connectivity to businesses and labour are related to productivity
and business location decisions.
The economic approach is based on the identity:
■ GVA (Gross Value Added) = employment * labour productivity
The analysis is therefore based on separately modelling impacts of changes in connectivity on employment and
on productivity.
The hypothesis that underlies the economic modelling work is that transport connectivity can affect the
attractiveness of different locations as places to do business. This hypothesis has been investigated using data
on transport supply and observed patterns of economic activity. Figure 1 on the next page shows some of the
links between transport change and economic outcomes within an area when transport can affect land use.
The Lower Thames Crossing Kent County Council 9
@ 2010 KPMG LLP, a UK limited liability partnership, is a subsidiary of KPMG Europe LLP and a member firm of the KPMG
network of independent member firms affiliated with KPMG International Cooperative, a Swiss entity. All rights reserved.Figure 1: Flow chart of impacts of transport change on GVA
Change in journey
times
Change in
connectivity
Move to more (or
Jobs and workers
less) productive
Agglomeration attracted from
business locations
outside study area
within study area
Change in Change in workplace
productivity employment
Change in GVA
The modelling approach deduces changes in business location decisions and agglomeration based on changes
in measures of connectivity. Figure 1 above shows that changes in productivity can come about from changes in
business location decisions as businesses move between areas which support different levels of productivity.
The key relationships used for forecasting have been derived from a cross-sectional statistical analysis of the
links between measures of connectivity and the economic outcomes found in different local areas across the
study area.
3.3 Measuring connectivity
Much of the approach to linking transport supply and economic performance is based on measures of
connectivity. For a particular area, a measure of connectivity captures how many economic opportunities there
are within a reasonable journey time of that area. This presents a number of challenges:
■ What represents an ‘opportunity’?
■ How should journey time and different journey opportunities (for example by different modes) be captured?
■ What represents a reasonable journey time? For example, how important is it for a business to be able to
access employees with 20 minutes of commuting time, or 40 minutes, or an hour?
The Lower Thames Crossing Kent County Council 10
@ 2010 KPMG LLP, a UK limited liability partnership, is a subsidiary of KPMG Europe LLP and a member firm of the KPMG
network of independent member firms affiliated with KPMG International Cooperative, a Swiss entity. All rights reserved.3.3.1 Opportunities and transport modes
The model has been developed to assess how different levels of connectivity affect businesses. Opportunities
have therefore been divided into two groups: access to labour and access to other businesses. The segmentation
enables the analysis to separately appraise connectivity to labour and to other businesses.
Socio-economic data has been used to provide the measures of ‘opportunities’ as follows:
■ Labour markets: measured by working age population in origin zone; and
■ Business to business markets: measured by workplace jobs in origin zone
3.3.2 Measuring the difficulty of travel
To capture the combined barriers of journey time and fare/cost, the difficulty of making a journey is captured
using a generalised cost including both of these elements. Generalised times are measured in minutes and
include financial costs by converting them into minutes using values of time taken from WebTAG.
Generalised time (including financial costs) has been sourced from the KTS and SETLUM models. Commuting
journeys are represented as journeys in the AM peak (7am – 10am). Business to business journeys are assumed
to take place during the inter-peak hours of 10am and 4pm.
3.3.3 Assessing reasonable journey times
Market sizes reflect the number of people willing to make a journey to a particular place for a particular purpose.
As the difficulty of a journey increases, the number of people willing to make the journey declines.
There are a number of options available for representing this relationship: a simple boundary (e.g. how many
people within one hour?); a simple linear decay function; a mathematically defined decay function such as an
exponential decay function; or a relationship based on observed travel behaviour. In this analysis a relationship
has been developed for each market segment which reflects the behaviour embodied in the demand data held
within the transport models which is based on observed travel patterns.
Demand and generalised cost data in the model has been used to generate generalised time decay curves or
deterrence functions. For car commuting for example, this represents the share of people that currently accept a
commute of different levels of generalised cost (e.g. Y% of people currently accept a commute of less than or
equal to X minutes). A similar decay curve has been calculated for the business to business market segment for
all journeys destinating within the core study area.
Demand data for Public Transport was insufficient in both SETLUM and KTS to provide a smooth function
describing how travel demand changes with generalised cost of travel. Therefore a simple linear function was
developed to assess Public Transport labour and business market catchments.
Higher demand for car traffic enabled decay curves to be created based on car travel behaviour. The KTS model
has a more finely grained zoning system and data that is more disaggregate than the SETLUM model, which
means demand for different lengths of trips is well represented. Car decay curves were therefore produced using
KTS generalised cost and demand data. The KTS and linear deterrence functions for car and Public Transport
are outlined in Figure 2 overleaf.
The Lower Thames Crossing Kent County Council 11
@ 2010 KPMG LLP, a UK limited liability partnership, is a subsidiary of KPMG Europe LLP and a member firm of the KPMG
network of independent member firms affiliated with KPMG International Cooperative, a Swiss entity. All rights reserved.Figure 2: Willingness to travel by mode and journey purpose
100%
Percentage willing to travel 90%
80%
70%
60%
50%
40%
30%
20%
10%
0%
0
0
0
0
0
0
0
0
0
0
0
0
0
0
0
0
0
0
0
0
50
00
10
15
20
25
30
35
40
45
50
55
60
65
70
75
80
85
90
95
1,
Generalised cost (minutes)
Car commute Car b2b PT commute and B2B
The deterrence functions represent the pattern of behaviour of car commuters and car business travellers, using
KTS for car travel and a linear function for public transport travel. It was assumed that willingness to travel of
public transport users gradually falls as generalised travel time increases, to reach 0% for 1,000 minutes of
generalised time. For car commute the decay curve shows that approximately 60% of car commuters accept a
total daily commute of up to 150 generalised minutes. This reduces to just 10% for a daily commute of 350
generalised minutes. For car business to business trips willingness to travel drops off at around 200 minutes to
reach 0% at around 450 generalised minutes of travel.
It has been assumed that the deterrence functions remain constant over time. If fuel, vehicle operating costs and
fares rise in line with average income, this would be consistent with people spending the same share of their time
and money on travel in future years.
3.3.4 Calculating overall market sizes
The effective labour market for any of core study areas zone is calculated as the sum of people of working age in
all origin zones willing to travel to that destination for work. The effective business to business markets are
similarly calculated as the sum of all workplace jobs that can be reached from an origin using a deterrence
function and value of time derived from observed business travel pattern.
The Lower Thames Crossing Kent County Council 12
@ 2010 KPMG LLP, a UK limited liability partnership, is a subsidiary of KPMG Europe LLP and a member firm of the KPMG
network of independent member firms affiliated with KPMG International Cooperative, a Swiss entity. All rights reserved.Figure 3: Illustrative example of contribution of origin zone to effective labour market in destination zone
B
z working
age
residents
y% willing
A to travel
x mins
y * z people in effective
labour market for zone A
from zone B
From the generalised cost of a journey to a particular zone it was then possible to use the corresponding decay
curve to assess the share of people willing to travel to that location from every other zone. Summing the share of
all people willing to travel from all other zones to the destination provides the measure of connectivity for that
market segment.
More formally:
MarketSize j = ∑Π
i
ij
Οi
Where i represents the origin and j the destination and where:
∏ij = Share of people willing to accept generalised cost based on the journey time between i and j; and
Oi = Opportunities in the origin zone i
3.4 Data sources
The economic analysis requires a detailed examination of the levels of connectivity offered to local areas in North
Kent and South Essex. This requires geographically disaggregate representations of journey options and the
difficulty of travel for journeys north of the river, south of the river and across the river. There are various
transport models covering the areas to the north and the south of the existing Dartford crossing and potential new
crossing points nearby. However none of them adequately capture local travel options on both sides of the river.
This is mainly because the river currently represents a significant barrier to movement and the transport models
developed have focussed on one side and only captured a limited representation of the other side.
The analysis undertaken for this project has therefore been based on combining datasets from different transport
models with different characteristics and should therefore be treated with caution.
The Lower Thames Crossing Kent County Council 13
@ 2010 KPMG LLP, a UK limited liability partnership, is a subsidiary of KPMG Europe LLP and a member firm of the KPMG
network of independent member firms affiliated with KPMG International Cooperative, a Swiss entity. All rights reserved.3.4.1 Generalised cost
Generalised costs have been sourced from the South Essex Transport and Land Use Model (SETLUM) and from
the Kent Thameside Model (KTS). Data and assistance on transport models was provided by Essex and Kent
County Councils.
SETLUM contains 163 model zones. 110 of these are in Basildon, Thurrock, Castle Point, Rochford and
Southend-on-Sea in Essex, 6 of these are in Kent and the remaining 47 are further afield. Matrices of generalised
cost have been sourced from SETLUM for the 2001 base year for car and public transport trips for AM peak
commute trips and interpeak business to business trips. The generalised costs include time costs, perceived
inconvenience (for example public transport interchanges) and financial elements of costs such as vehicle
operating costs, tolls and public transport fares. Where more than one public transport mode offers a viable
alternative, the lowest generalised cost or ‘best path’ option has been selected.
Figure 4: SETLUM model zone centroids in Thames Gateway area
Romford
Essex
London
Woolwich
Grays
Dartford
Gravesend
Gllingham
Kent
KTS contains 590 model zones. The vast majority of these zones represent areas in Kent Thameside with only a
few model zones representing local areas in Essex. This is shown in Figure 5 overleaf.
The Lower Thames Crossing Kent County Council 14
@ 2010 KPMG LLP, a UK limited liability partnership, is a subsidiary of KPMG Europe LLP and a member firm of the KPMG
network of independent member firms affiliated with KPMG International Cooperative, a Swiss entity. All rights reserved.Figure 5: KTS model zone centroids in Thames Gateway area
Romford
Essex
London
Woolwich
Grays
Dartford
Gravesend
Gllingham
Kent
Cost data from these two models has been merged to create a representation of a disaggregate matrix of
journeys with origins and destinations represented at ward level on both sides of the Thames in the districts of
Basildon, Brentwood, Castle Point, Dartford, Gravesham, Medway, Rochford, Southend-on-Sea, Swale and
Thurrock. Further afield, zones are represented using larger administrative areas such as districts/unitary
authorities (e.g. London boroughs), counties (e.g. Suffolk) and regions (e.g. the South West). The zoning system
is therefore consistent with UK administrative geography. This zoning system is shown in Figure 6 overleaf.
The Lower Thames Crossing Kent County Council 15
@ 2010 KPMG LLP, a UK limited liability partnership, is a subsidiary of KPMG Europe LLP and a member firm of the KPMG
network of independent member firms affiliated with KPMG International Cooperative, a Swiss entity. All rights reserved.Figure 6: Centroids of geographical zoning system used for analysis
Romford
Essex
London
Woolwich
Grays
Dartford
Gravesend
Gllingham
Kent
The core model areas consist of the districts of Medway, Dartford, Gravesham and Swale within Kent and of the
districts of Southend-on-Sea, Thurrock, Basildon, Brentwood, Castle Point and Rochford in Essex. This area is
covered at ward level in the modelling. A hinterland of zones has also been defined to enable the different labour
markets and business to business trip catchments of these core zones to be estimated.
To create the generalised journey time dataset for this model zoning, the following process was applied:
1. Calculate the closest zone centroid in KTS to each model zone centroid used in the analysis;
2. Create model zone to zone generalised cost matrices based on the closest KTS zone centroid to the model
origin centroid and the closest KTS zone centroid to the model destination centroid;
3. Repeat for SETLUM data to create the model zone matrices derived from the SETLUM model;
4. Identify flows which use the existing bridge;
5. For flows that are south of the river and do not use the bridge, use the KTS data as the best proxy for
generalised cost;
6. For flows that are north of the river and do not use the bridge, use the SETLUM data as the best proxy for
generalised cost;
7. For flows that travel south across the bridge, use the SETLUM cost from origin to the bridge plus the KTS
cost from the bridge to the destination, plus a representation of bridge tolls; and
8. For flows that travel north across the bridge, use the KTS cost from origin to the bridge plus the SETLUM cost
from the bridge to the destination, plus a representation of bridge tolls.
This approach provides a matrix of costs for travel on the north side of the river, the south side of the river and for
cross river trips. However, for cross river trips the cost data is a hybrid from different sources and data for trips on
the south side of the river is from a different source from trips in the north. The key similarities and differences
between the models are as follows:
The Lower Thames Crossing Kent County Council 16
@ 2010 KPMG LLP, a UK limited liability partnership, is a subsidiary of KPMG Europe LLP and a member firm of the KPMG
network of independent member firms affiliated with KPMG International Cooperative, a Swiss entity. All rights reserved.■ Both models share definitions of time periods, so for example, peak journeys represent the average hour
between 7AM and 10AM.
■ The SETLUM data represents 2001 while the KTS data represents 2005
■ All times and costs have been expressed in 2001 prices and values
Using this hybrid approach is unavoidable given the study timescales and budgets. The time and cost
components of generalised cost have been made consistent as far as possible but nevertheless represent
different underlying model assumptions. Figure 7 below shows the relationships between the car commuting
generalised costs in KTS and SETLUM for comparable origins and destinations.
Figure 7: Comparison of KTS and SETLUM car generalised costs, 2001 prices
Generalised cost (pence)
2,000
y = 1.7679x
1,800
1,600
1,400
1,200
KTS
1,000
800
600
400
200
0
0 200 400 600 800 1,000 1,200
SETLUM
Source: SETLUM and KTS models
The comparable origins and destinations selected are based on cross river origin to destination trips where the
centroids of both zones lie within 1km of each other. For these trips KTS shows consistently higher generalised
costs than SETLUM. The best fit line shows that the KTS generalised costs is some 1.8 times higher than the
SETLUM cost, although the two are closely related. More detailed analysis of differences between the models is
presented in Appendix A. We recommend that a suitable transport model with suitable geographical
representation to the north and south of the Thames is developed if the analysis of Lower Thames crossing
options is to be progressed further.
Journey times and costs have all been measured in pence using values of time from WebTAG to represent
commuting and business to business travellers. The costs are taken to be the best available representation of
generalised costs consistent with the most recent socioeconomic data available given the journey time and cost
data available.
3.4.2 Socioeconomic data
Population data has been sourced for each model zone from the Office for National Statistics experimental local
area population statistics by quinary group. To represent labour markets, working age population data has been
constructed using the quinary groups between 20-24 and 60-64 years old plus four fifths of the quinary age group
15-19. The latest available data from the Office for National Statistics is for 2007.
Workplace employment data by business sector has been collected from the Annual Business Inquiry. The latest
available data is for 2008.
The Lower Thames Crossing Kent County Council 17
@ 2010 KPMG LLP, a UK limited liability partnership, is a subsidiary of KPMG Europe LLP and a member firm of the KPMG
network of independent member firms affiliated with KPMG International Cooperative, a Swiss entity. All rights reserved.Data for 2010 has been constructed by applying the growth rates for the appropriate local authority sourced from
the DfT’s National Trip End Model (NTEM) version 5.4 which provides forecast data for transport planning
purposes. Data for the 2026 forecast year has been similarly constructed based on the NTEM datasets extracted
using the TEMPRO software.
3.4.3 Demand
Demand data has been sourced from both the Kent Thameside Model and the SETLUM model. These data sets
have been collected for commuting in the AM peak and business travel in the interpeak. For both models, this
data was split by mode and by journey purpose. SETLUM data was collected for 2001 (the model base year) and
for 2021, and KTS data for 2005 (again, the model base year) and 2025.
The demand data has only been used to determine the relationship between demand and the generalised cost of
travel for the different model segments and for assessing the generalised cost deterrence functions used in the
modelling (see for example Figure 2).
3.5 Assessing business location choice
The relationship between employment density and connectivity was assessed using econometric techniques and
other evidence for business location decision making.
The relationships between connectivity and employment density have been investigated using linear regression
formulations. This analysis has taken the form:
Log(employment density) = f (ln(connectivity measures), ln(other variables))
Where zones both north and south of the river have been considered in the same equation, a flag has been
introduced in the regression analysis to distinguish between these. This allows the differences in connectivity due
to model differences to be mitigated to some extent. However, given that the data has been drawn from two
separate models, we have also considered equations that look separately at zones to the north of the river and
zones to the south of the river.
Two connectivity measures were tested: access to labour by road, and access to other business by road. Access
to labour by public transport and access to other businesses by public transport were excluded from the analysis
due to the dominance of car travel which makes understanding the importance of public transport connectivity
more complex. The complexity of integrating public transport data from the KTS and SETLUM models also
makes the analysis of public transport catchments less reliable.
The only other variable considered as a driver of business location choice was proximity to the Thames ports
(and historic Thames ports). This reflects the current and historic importance of the Thames in providing
connectivity to markets by river and sea.
Cross sectional analysis alone cannot determine causation. To determine the extent to which any links are causal
requires analysis of time series data and analysis of lead and lag relationships. Such data is not available.
Without a time series analysis causation must be judged based on the underlying theory. There are reasons why
one would expect causation to run in both directions. Businesses are likely to move to places where they have
locational advantages which could come from better transport connectivity. However, high levels of employment
are also likely to lead to higher levels of transport connectivity as infrastructure provision follows demand. In this
analysis we present the results of what would occur if the statistical relationships did represent a causal
relationship between changes in transport connectivity and changes in employment density. This is the same as
the approach taken to measuring agglomeration by the Department for Transport.
The relationships between car connectivity to businesses and labour and employment density were assessed.
The model draws data from both the KTS and SETLUM models to estimate hybrid journey times. However, as
there are differences between these models, we have separately conducted statistical analysis for zones north of
The Lower Thames Crossing Kent County Council 18
@ 2010 KPMG LLP, a UK limited liability partnership, is a subsidiary of KPMG Europe LLP and a member firm of the KPMG
network of independent member firms affiliated with KPMG International Cooperative, a Swiss entity. All rights reserved.You can also read