REDD1 loss reprograms lipid metabolism to drive progression of RAS mutant tumors - Genes Dev
←
→
Page content transcription
If your browser does not render page correctly, please read the page content below
Downloaded from genesdev.cshlp.org on November 23, 2020 - Published by Cold Spring Harbor Laboratory Press

REDD1 loss reprograms lipid metabolism
to drive progression of RAS mutant tumors
Shuxi Qiao,1,2,6 Siang-Boon Koh,1,2,6 Varunika Vivekanandan,1 Devika Salunke,1
Krushna Chandra Patra,1,2 Elma Zaganjor,3 Kenneth Ross,1,2,4 Yusuke Mizukami,1,2 Sarah Jeanfavre,4
Athena Chen,2,5 Mari Mino-Kenudson,1,2,5 Sridhar Ramaswamy,1,2,3,4 Clary Clish,4 Marcia Haigis,3
Nabeel Bardeesy,1,2 and Leif W. Ellisen1,2
1
 Massachusetts General Hospital Cancer Center, Boston, Massachusetts 02114, USA; 2Harvard Medical School, Boston,
Massachusetts 02115, USA; 3Ludwig Cancer Center at Harvard, Harvard University, Boston, Massachusetts 02115, USA;
4
 Broad Institute of Massachusetts Institute of Technology and Harvard University, Cambridge, Massachusetts 02142, USA;
5
 Department of Pathology, Massachusetts General Hospital, Massachusetts 02114, USA

Human cancers with activating RAS mutations are typically highly aggressive and treatment-refractory, yet RAS
mutation itself is insufficient for tumorigenesis, due in part to profound metabolic stress induced by RAS activation.
Here we show that loss of REDD1, a stress-induced metabolic regulator, is sufficient to reprogram lipid metabolism
and drive progression of RAS mutant cancers. Redd1 deletion in genetically engineered mouse models (GEMMs) of
KRAS-dependent pancreatic and lung adenocarcinomas converts preneoplastic lesions into invasive and metastatic
carcinomas. Metabolic profiling reveals that REDD1-deficient/RAS mutant cells exhibit enhanced uptake of lyso-
phospholipids and lipid storage, coupled to augmented fatty acid oxidation that sustains both ATP levels and ROS-
detoxifying NADPH. Mechanistically, REDD1 loss triggers HIF-dependent activation of a lipid storage pathway
involving PPARγ and the prometastatic factor CD36. Correspondingly, decreased REDD1 expression and a signature
of REDD1 loss predict poor outcomes selectively in RAS mutant but not RAS wild-type human lung and pancreas
carcinomas. Collectively, our findings reveal the REDD1-mediated stress response as a novel tumor suppressor
whose loss defines a RAS mutant tumor subset characterized by reprogramming of lipid metabolism, invasive and
metastatic progression, and poor prognosis. This work thus provides new mechanistic and clinically relevant in-
sights into the phenotypic heterogeneity and metabolic rewiring that underlies these common cancers.
[Keywords: RAS; REDD1; metastasis; lipid metabolism; oxidative stress; energy stress; lysophospholipids; fatty acid
oxidation; glycolysis]
Supplemental material is available for this article.
Received November 18, 2019; revised version accepted March 19, 2020.

Activating mutations in RAS family members are ob-                          biosynthesis, energy generation, and detoxification of re-
served in a substantial proportion of human cancers,                        active oxygen species (ROS) (DeNicola et al. 2011; White
where they are associated with aggressive behavior and                      2013; Harris et al. 2015). Nonetheless, the observed het-
poor clinical outcomes (Pylayeva-Gupta et al. 2011). De-                    erogeneity in the genomic organization and clinical
spite a relatively detailed understanding of the pathways                   behavior of RAS mutant cancers strongly suggests distinct
downstream from RAS activation, selectively targeting                       mechanisms of metabolic rewiring in different tumor sub-
these pathways has met with limited clinical success.                       sets that remain incompletely characterized.
While this fact relates in part to the myriad downstream                      Pivotal studies on metabolism in the context of acti-
effects of RAS, it also reflects the various collateral adap-               vated RAS have revealed altered glucose utilization via
tations that the mutant cells undergo to cope with meta-                    aerobic glycolysis, the Warburg effect, which facilitates
bolic stress engendered by RAS activation. Numerous                         shunting of glycolytic intermediates into biosynthetic
studies in recent years have documented a fundamental                       pathways (Ying et al. 2012). This adaptation is accompa-
reconfiguring of metabolism in the context of RAS muta-                     nied by altered utilization of glutamine, which provides
tion, including up-regulation of nutrient acquisition path-                 a source of TCA cycle intermediates for oxidative ATP
ways, together with rewiring of mechanisms for                              generation and for cytosolic export and subsequent gener-
                                                                            ation of ROS-detoxifying NADPH (Son et al. 2013). Alter-
6                                                                           ations in lipid metabolism in RAS mutant tumors have
 These authors contributed equally to this work.
Corresponding author: lellisen@mgh.harvard.edu
Article published online ahead of print. Article and publication date are
online at http://www.genesdev.org/cgi/doi/10.1101/gad.335166.119. Free-     © 2020 Qiao et al. This article, published in Genes & Development, is
ly available online through the Genes & Development Open Access             available under a Creative Commons License (Attribution 4.0 Internation-
option.                                                                     al), as described at http://creativecommons.org/licenses/by/4.0/.

                  GENES & DEVELOPMENT 34:1–16 Published by Cold Spring Harbor Laboratory Press; ISSN 0890-9369/20; www.genesdev.org               1
Downloaded from genesdev.cshlp.org on November 23, 2020 - Published by Cold Spring Harbor Laboratory Press

Qiao et al.

generally received less attention, but recent studies have         mediated stress response underpins a previously unidenti-
implicated deregulated lipid synthesis, uptake, storage,           fied, metabolically distinct and poor-prognosis subset of
and catabolism as potential contributors in this context           RAS mutant cancers.
(Kamphorst et al. 2013; Bensaad et al. 2014; Padanad
et al. 2016; Svensson et al. 2016; Patra et al. 2018). Overall,
however, the mechanisms and phenotypic consequences                Results
of altered lipid metabolism in RAS-driven tumors are
                                                                   REDD1 deficiency cooperates with mutant KRAS
poorly understood.
                                                                   to drive tumor progression
   As RAS mutation induces profound metabolic stress,
endogenous stress response pathways may serve as barri-            To test the hypothesis that REDD1 may function as a
ers to RAS-mediated tumor progression (Biancur and                 barrier to RAS-driven tumorigenesis in vivo we created
Kimmelman 2018). An intriguing potential factor in this            GEMMs, intercrossing Redd1 −/− mice with the inducible
regard is REDD1, which is up-regulated in response to              knock-in Ras mutant allele loxP-stop-loxP (LSL) Kras G12D
hypoxia and energy stress, and functions as a pleiotropic          (KrasG12D/+) (Supplemental Fig. S1A; Jackson et al. 2001;
regulator of cell metabolism (Ellisen 2005; Gordon et al.          Sofer et al. 2005). Consistent with previous reports, we
2016b; Lipina and Hundal 2016). Both mammalian                     found that in B6 mice, crossing LSL-KrasG12D/+ alone to
REDD1 and its Drosophila orthologs inhibit TORC1 ki-               the pancreas-specific Cre recombinase allele p48-Cre (here-
nase activity in the acute response to hypoxia (Brugarolas         after p48K mice) results in preneoplastic lesions known as
et al. 2004; Reiling and Hafen 2004), while genetic and bio-       pancreatic intraepithelial neoplasm (PanIN) and a median
chemical studies have demonstrated both mTORC1-de-                 survival (to a humane endpoint) of ∼2 yr, but only rarely in-
pendent and TORC1-independent roles for REDD1 in                   vasive PDAC (Fig. 1A; Hingorani et al. 2003). These mice
control of glycolysis, autophagy, and mitochondrial oxida-         ultimately succumb to sequelae of pancreatic insufficiency
tive metabolism (DeYoung et al. 2008; Horak et al. 2010;           related to extensive PanIN (Hingorani et al. 2003). In con-
Qiao et al. 2015; Gordon et al. 2016a; Alvarez-Garcia et al.       trast, a matched cohort of mice with loss of REDD1 (p48-
2017). Phenotypes associated with REDD1 genetic loss               Cre;LSL-KrasG12D/+;Redd1 −/−; hereafter p48KR) had dra-
support its role as a physiological mediator of diverse path-      matically shortened survival (Fig. 1A; Supplemental Fig.
ologic cellular stress responses. In lung tissue, oxidative        S1B). These mice were universally found to have extensive
stress resulting from chronic cigarette smoke exposure in-         PanIN, and a nearly one-third had already progressed to in-
duces REDD1 and results in tissue destruction known as             vasive PDAC (Fig. 1B,C; Supplemental Fig. S1C). Notably,
emphysema, and Redd1-null mice exhibit protection                  the majority of PDAC-bearing p48KR mice exhibited ex-
against smoke-induced emphysema (Yoshida et al. 2010).             tensive metastatic disease, including to liver and lung. In
REDD1 has also been associated with stress responses in            contrast, both invasive PDAC and metastasis were rare in
the central nervous system (CNS), where REDD1 is acti-             p48K mice (Fig. 1C; Supplemental Fig. S1B).
vated in response to environmental stress to suppress                 We wished to determine whether this phenotype is
mTORC1-mediated phosphorylation. Redd1-null mice                   likely to result from a cell-autonomous effect of REDD1
are protected against both of these biochemical changes            loss. Thus, we isolated primary p48-Cre; LSL-KrasG12D/+
and the behavioral manifestations of stress-induced                pancreatic epithelial cells (hereafter, KPECs), then ablated
depression (Ota et al. 2014). The contribution of REDD1            REDD1 expression via lentiviral shRNA ex vivo and reim-
to human cancer has remained uncertain, as Redd1-null              planted cells into the pancreas of immunodeficient hosts
mice do not die prematurely or exhibit tumor predisposi-           (Supplemental Fig. S1D; Corcoran et al. 2011). At 4 wk af-
tion, and studies have reported mixed results regarding            ter implantation, vector-expressing KPECs formed small
the contribution of REDD1 to cell proliferation and sur-           masses of well-differentiated neoplasms, whereas the
vival relevant to tumorigenesis (DeYoung et al. 2008;              matched cells expressing REDD1 shRNA developed sig-
Reuschel et al. 2015; Lipina and Hundal 2016).                     nificantly larger, invasive tumors demonstrating histolog-
   Given the overlap and potential interaction of pathways         ical features consistent with poorly differentiated PDAC
controlled by REDD1 and RAS, we analyzed the pheno-                (Supplemental Fig. S1E,F). Thus, loss of REDD1 confers
typic and metabolic effects of REDD1 loss in the context           a cell-autonomous advantage to Kras mutant pancreatic
of RAS activation. While RAS mutation alone in lung and            epithelia in vivo, resulting in aggressive, invasive tumor
pancreatic epithelium induces preneoplastic lesions, loss          progression.
of REDD1 in RAS mutant cells promotes rapidly growing                 We then developed a second model to establish whether
invasive carcinomas and distant metastatic dissemina-              the cooperative effect of REDD1 loss on RAS-dependent
tion. Biochemical and metabolic studies reveal that loss           tumorigenesis was limited to the PDAC context. Thus,
of REDD1 activates lipid uptake and fatty acid oxidation           we exposed LSL-KrasG12D/+ mice to intratracheal adenovi-
to meet the metabolic and energetic demands of RAS ac-             ral Cre (Ad-Cre) (Supplemental Fig. S1A). As demonstrat-
tivation. Accordingly, in vivo studies demonstrate the             ed previously, such mice develop multifocal pulmonary
vulnerability of these tumors to antioxidant depletion,            adenomas that rarely progress to invasive adenocarcino-
while analysis of human tumors shows that decreased                mas, although these mice ultimately die of pulmonary
REDD1 expression predicts poor patient survival selec-             complications (Fig. 1D,E; Jackson et al. 2001). However,
tively in RAS mutant lung and pancreas carcinomas. Col-            when we compared LSL-KrasG12D/+; Redd1 +/+ and LSL-
lectively, our findings reveal that a deregulated REDD1-           KrasG12D/+; Redd1 −/− mice exposed to Ad-Cre (hereafter

2       GENES & DEVELOPMENT
Downloaded from genesdev.cshlp.org on November 23, 2020 - Published by Cold Spring Harbor Laboratory Press

                                                                                                      REDD1 loss drives RAS mutant tumors

A                                                                                           Figure 1. REDD1 deficiency cooperates
                                             B                                              with KRAS to drive tumor progression and
                                                                                            metastatic dissemination. (A) Kaplan-Meier
                                                                                            analysis of p48-Cre;KrasG12D; Redd1 −/−
                                                                                            (p48KR) mice (n = 6, median survival = 364
                                                                                            d) and p48-Cre;KrasG12D;Redd1 +/+ (p48K)
                                                                                            mice (n = 12, median survival = 610.5 d). All
                                                                                            animals euthanized exhibited PanIN and/or
                                                                                            PDAC. P = 0.0005 by log-rank test. (B, top)
                                                                                            representative gross photographs depicting
                                                                                            enlarged, nodule-studded pancreas and en-
C                                                                                           larged spleen (left) and liver with metastatic
                                                                                            foci (right) from 17-mo-old p48KR mice. (Bot-
                                                                                            tom) Hematoxylin and eosin (H&E)-stained
                                                                                            tissue sections from the indicated genotypes.
                                                                                            The right panels represent higher magnifica-
                                                                                            tion of the respective left panels. p48KR mice
                                                                                            show PDAC and liver metastasis (indicated
                                                                                            by an asterisk) compared with p48K mice
D                                                                                           that show early PanIN histology. Scale bars:
                                           E
                                                                                            left, 50 µm; right 20 µm. (C) Summary of his-
                                                                                            tological findings of PDAC and metastasis in-
                                                                                            cluding those reported in A and additional
                                                                                            mice sacrificed at 11 mo. Total n = 20 mice
                                                                                            analyzed per genotype. (D) Kaplan-Meier
                                                                                            analysis of Kras G12D; Redd1 +/+ and KrasG12D;
                                                                                            Redd1 −/−mice after intratracheal adenoviral
                                                                                            Cre (AdK and AdKR mice, respectively).
                                                                                            AdK mice (median survival = 229 d, n = 7);
                                                                                            AdKR mice, median survival = 196 d, n = 13.
F                                                                                           Survival times are after infection. P = 0.011
                                                                                            by log-rank test. (E, left) Representative
                                                                                            H&E-stained sections of whole-mount lung
                                                                                            tissues from a pair of age- and sex-matched
                                                                                            AdK and AdKR mice 20 wk after intratra-
                                                                                            cheal delivery of Cre. Tumors are indicated
                                                                                            by arrows. Scale bars, 2 mm. (Right) Quanti-
                                                                                            fication of lung tumor burden per lung lobe
                                                                                            from mice of the denoted genotypes. Each
                                                                                            dot indicates one lobe (n ≥ 2 mice for each
                                                                                            time point per genotype). Horizontal lines in-
                                                                                            dicate mean ± SEM. (∗ ) P = 0.01, by two-tailed
                                                                                            t-test. (F ) Necropsy of AdKR mice eutha-
nized 28 wk after intratracheal Cre treatment showing metastasis to kidney (K), diaphragm (D), and pancreas (P). H&E-stained sections
of primary lung tumor and metastatic foci (indicated by an asterisk) are shown. Scale bars, 100 µm. See also Supplemental Figure S1.

AdK and AdKR mice, respectively), we noted significantly                multiple cell-based models. We found that this coopera-
shorter survival for the AdKR mice (Fig. 1D). Necropsy re-              tion was not restricted to epithelial cells, as Redd1 −/−
vealed substantially greater tumor burden in the lungs of               MEFs immortalized with adenoviral E1A and expressing
AdKR mice, including frequent progression to invasive                   ectopic mutant KRAS rapidly formed tumors when inject-
adenocarcinomas (Fig. 1E,F; Supplemental Fig. S1G). Fur-                ed subcutaneously into immunodeficient mice, while
thermore, a subset of AdKR mice exhibited grossly evi-                  matched KRAS-expressing Redd1 +/+ cells and primary
dent hematogenous metastasis to distant organs                          Redd1 −/− cells without KRAS never formed tumors
including liver and kidney (Fig. 1F; Supplemental Fig.                  (Supplemental Fig. S2A). To reveal the relevant gene ex-
S1H). Collectively, these findings suggest that loss of                 pression programs associated with REDD1 loss we gener-
REDD1 promotes RAS-mediated tumor progression and                       ated primary LSL-KrasG12D/+; Redd1 −/− MEFs (KRMEFs)
metastasis.                                                             and matched LSL-KrasG12D/+; Redd1 +/+MEFs (KMEFs),
                                                                        exposed them to adenoviral Cre (Ad-Cre) and carried out
                                                                        RNA-seq analysis (Fig. 2A; Supplemental Fig. S2B). The
REDD1 loss is sufficient to activate lipid uptake
                                                                        most highly significant gene expression differences be-
and storage
                                                                        tween KRMEFs and KMEFs were evident under both nor-
As a first step to unravel the physiological basis for                  moxia and hypoxia, where Gene Set Enrichment Analysis
REDD1’s cooperation with mutant RAS, we developed                       (GSEA) revealed profound suppression of genes regulating

                                                                                                          GENES & DEVELOPMENT            3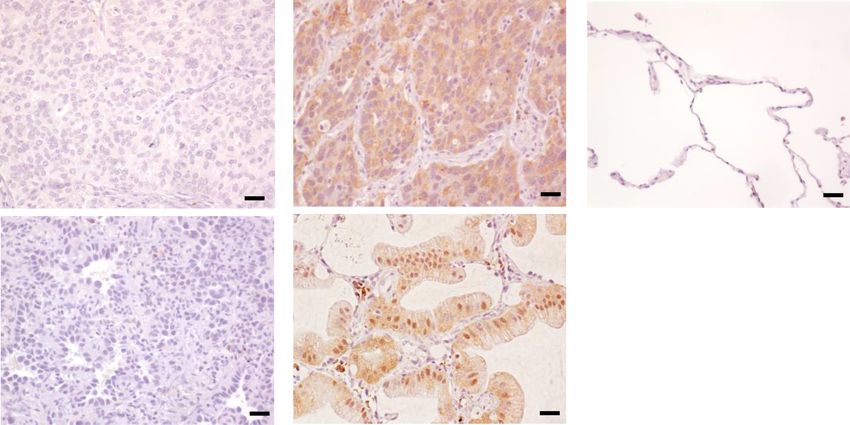
Downloaded from genesdev.cshlp.org on November 23, 2020 - Published by Cold Spring Harbor Laboratory Press

                       A                                                  B

                      C

                       D                                                 E

                      F                            G

Figure 2. REDD1 deficiency activates lipid uptake and suppresses de novo lipogenesis. (A) Gene set enrichment analysis (GSEA) reveals
SREBF targets (signature M3009) as the most significantly differentially expressed signature. (Left) GSEA plot of RNA-seq data showing sup-
pression of fatty acid (FA) and cholesterol synthesis genes in paired KrasG12D;Redd1 −/− versus KrasG12D; Redd1 +/+ primary MEFs (KRMEFs
and KMEFs, respectively, cultured under hypoxia (1% O2, 18 h). (NES) Normalized enrichment score; (FDR) false discovery rate. (Right) Heat
map of the entire gene signature shown at left. Asterisks indicate FA synthesis genes. (B) Levels of phospholipids in KMEFs and KRMEFs (top)
and their spent medium (bottom) collected during growth under hypoxia (1% O2) for 18 h as detected by UHPLC-MS lipidomics analysis.
Data were normalized by MetaboAnalyst. Vertical lines (whiskers) denote range, and boxes indicate one SD. Triplicate samples from two
mice per genotype were analyzed. (LPC) Lysophosphatidylcholine; (LPE) lysophosphatidylethanolamine; (PC) phosphatidylcholine; (PE)
phosphatidylethanolamine; (CE) cholesterol ester. (∗ ) P < 0.05; (∗∗ ) P < 0.01; (∗∗∗ ) P < 0.001. (C) Histogram showing increased uptake of Top-
Fluor-LPC in REDD1-ablated compared with control KRAS-activated primary pancreatic epithelial cells (KPECs) as assessed by flow cytom-
etry. (Right) Quantification of relative fluorescence intensity (RFU) from seven independent experiments is shown as a histogram at the right.
Error bars indicate SD. (∗∗∗ ) P < 0.001. (D) Unsaturated long chain triglyceride (TAG) levels in KRMEFs compared with KMEFs under hypoxia
as detected by lipidomic analysis. Vertical lines (whiskers) indicate range and boxes indicate one SD. Triplicate samples from two mice per
genotype were analyzed. (E) Lipid droplet (LD) staining via LD540 (green) in shCtrl and shRedd1 KPECs cultured in hypoxia (1% O2) for 48 h
and visualized by fluorescence microscopy. Nuclei were stained with DAPI (blue). (Right) Quantification of LD levels from at least five ran-
dom fields (dots) of >200 cells/field per genotype. LD numbers were normalized to cell numbers (nuclei) quantitated by DAPI. (∗ ) P = 0.013 by
two tailed. Scale bar, 20 µm. (F) De novo lipogenesis, determined from 14C-acetate incorporation in A549 cells stably expressing empty vector
control (shCtrl) or shRNA (shREDD1). Error bars denote ±SD of three independent experiments. (G) Loss of REDD1 decreases reliance on FA
synthesis. A549 cells were treated with the specific ACC2 inhibitor (ACC2i) {N-[1-(2′ -{4-isopropoxyphenoxy}-2,5′ -bithiazol-5-yl)ethyl] acet-
amide} or the isoform-nonselective ACC inhibitor CP640186 at denoted doses for 72 h. Error bars indicate SD from quintuplicate wells in
each of three independent experiments. (∗ ) P < 0.05; (∗∗ ) P < 0.01; (∗∗∗ ) P < 0.001 for all graphs unless noted otherwise. See also Supplemental
Figure S2.

4      GENES & DEVELOPMENT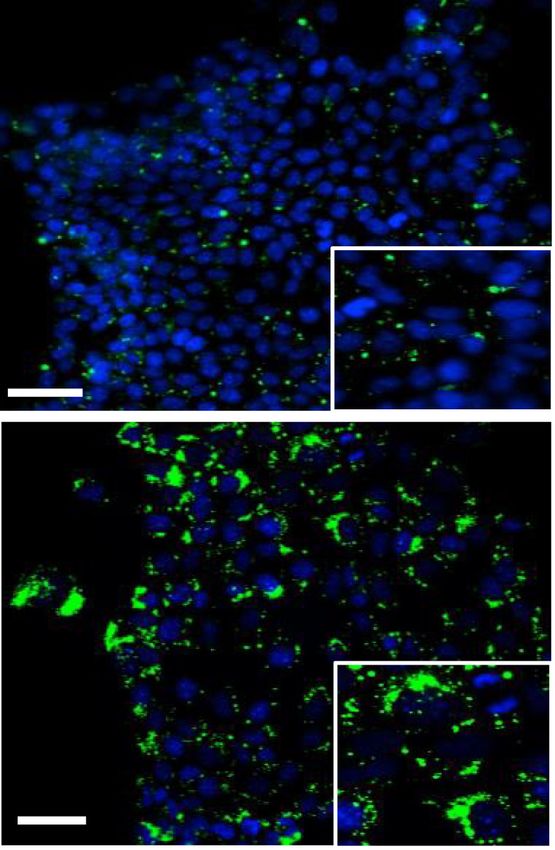
Downloaded from genesdev.cshlp.org on November 23, 2020 - Published by Cold Spring Harbor Laboratory Press

                                                                                              REDD1 loss drives RAS mutant tumors

cholesterol and fatty acid synthesis (FASyn) as the top           (i.e., de novo lipogenesis) directly through analysis of
                                                                  14
differentially expressed signature (Fig. 2A; Supplemental            C-acetate incorporation in these cells. We observed dra-
Fig. S2C–E; Engelking et al. 2017). Conversely, we ob-            matic suppression of de novo FASyn resulting from loss of
served increased expression of fatty acid transport genes         REDD1 (Fig. 2F). Correspondingly, REDD1-ablated cells
in KRMEFs compared with KMEFs, including Fabp3,                   were less reliant on FASyn, as loss of REDD1 conveyed
Fabp7, and Fabp4, the latter of which has been implicat-          significant resistance to inhibitors of acetyl CoA carboxyl-
ed in progression and metastasis of ovarian cancer (Sup-          ase (ACC), the first committed step of FASyn (Fig. 2G).
plemental Fig. S2E; Nieman et al. 2011; Bensaad et al.            Taken together, these results reveal that REDD1 loss
2014).                                                            activates a program of increased lipid uptake and storage,
   To unveil the consequences of these gene expression            together with suppressed de novo lipogenesis.
changes we then carried out analysis of lipid metabolites
in KRMEFs and matched KMEFs via ultra-high-perfor-
mance liquid chromatography-mass spectrometry
                                                                  REDD1 loss in RAS mutant cells promotes fatty acid
(UHPLC-MS) under both normoxia and hypoxia (Priolo
                                                                  oxidation for energy and redox homeostasis
et al. 2015). A marked intracellular increase in both satu-
rated and unsaturated long and very long chain lipid spe-         Under stress conditions including hypoxia, enhanced lipid
cies was noted in the absence of REDD1, including                 uptake and storage is linked to catabolism of stored lipids
phosphotidylcholine (PC), phosphoethanolamine (PE),               through fatty acid oxidation (FAO), which can contribute
and the lysophospholipidslysophosphotidylcholine (LPC)            to homeostasis through multiple mechanisms including
and lysophosphoethanolamine (LPE) (Fig. 2B; Supplemen-            ROS detoxification (via generation of NADPH) and relief
tal Fig. S2F). Concurrent analysis of culture media from          of energy stress (via oxidative ATP generation) (Fig. 3A;
these cells demonstrated consistent depletion of the              Bensaad et al. 2014; Patra and Hay 2014; Henne et al.
same lipid species from the medium, potentially suggest-          2018). We measured FAO by tracing the fate of tritiated
ing cellular uptake (Fig. 2B). Indeed, staining cells with        palmitate in Kras mutant KMEFs and KRMEFs, and dem-
fluorescent-labeled Topfluor-LPC revealed that LPC up-            onstrated that loss of REDD1 significantly induces FAO in
take was significantly increased in Redd1 −/− MEFs com-           this context (Fig. 3B). These Redd1-null cells were highly
pared with matched wild-type cells, even in the absence           dependent on FAO for ATP generation, as inhibition of
of RAS mutation (Supplemental Fig. S2G).                          FAO with etomoxir significantly attenuated ATP levels
   Importantly, this phenotype was recapitulated in pri-          in KRMEFs compared with KMEFs (Fig. 3C). Furthermore,
mary, RAS mutant pancreatic epithelial cells. Thus, abla-         increased FAO in KRMEFs was accompanied by decreased
tion of REDD1 expression via lentiviral shRNA in KPEC             ROS (Supplemental Fig. S3A), and conversely, restoration
cells followed by exposure to fluorescent-labeled Top-            of REDD1 expression increased ROS levels (Supplemental
fluor-LPC showed a highly significant increase in LPC             Fig. S3B). In agreement with these findings, NADPH
uptake (Fig. 2C; Supplemental Fig. S2H; Nguyen et al.             levels were substantially elevated in KRMEFs compared
2014). Thus, loss of REDD1 is associated with suppression         with KMEFs (Fig. 3D), as they were following REDD1
of fatty acid synthesis genes, together with increases in         knockdown in KPECs (Fig. 3E). Notably, REDD1-depen-
transport genes and uptake of selected lipid species.             dent differences in ROS between KRMEFs and KMEFs
   Consistent with these findings, increased uptake trig-         were not associated with any change in the antioxidant re-
gered by REDD1 loss was associated with increased stor-           sponse factor NRF2, which is increased in a subset of RAS
age of lipids in both epithelial cells and MEFs. We found         mutant tumors (Supplemental Fig. S3C; DeNicola et al.
evidence for increased intracellular synthesis of triglycer-      2011).
ides (TAGs), including elevated TAG levels in KRMEFs                 We then tested the functional consequences of in-
compared with matched primary KMEFs (Fig. 2D; Supple-             creased NADPH in this setting, demonstrating that
mental Fig. S2I). As anticipated, these same TAGs were            REDD1 knockdown in KPECs was sufficient to confer ox-
not depleted from the medium (Supplemental Fig. S2J).             idative stress resistance (Supplemental Fig. S3D). NADPH
Lysophospholipids are remodeled and stored together               provides reducing power to generate the key cellular anti-
with accumulated TAGs in lipid droplets (LDs), and we             oxidant reduced glutathione (GSH) and, as expected, both
therefore tested for the presence of LDs by staining cells        the relative and absolute levels of GSH were increased in
with the lipophilic fluorophore LD540 (Spandl et al.              the absence of REDD1 (Fig. 3F). Furthermore, we tested
2009). Indeed, we observed increased LD formation in pri-         the glutamine dependence of these cells, as glutamine
mary KPECs following REDD1 knockdown (Fig. 2E), and               has been reported to be required for NADPH generation,
in Redd1 −/− compared with WT MEFs (Supplemental                  ROS detoxification and proliferation in some RAS mutant
Fig. S2K). These findings suggest that loss of REDD1 is           cells (Son et al. 2013; Romero et al. 2017). Consistent with
sufficient to induce increased lipid uptake and storage in        the hypothesis that FAO rather than glutamine meets
both the presence and absence of RAS mutation.                    these metabolic demands in the setting of REDD1 loss,
   In order to test whether REDD1 loss induced these              knockdown of REDD1 rendered KPECs substantially
changes in human cells we ablated REDD1 via lentiviral            less sensitive to glutamine withdrawal than controls
shRNA in KRAS mutant A549 carcinoma cells. Loss of                (Fig. 3G). Thus, loss of REDD1 in RAS mutant cells in-
REDD1 indeed significantly increased LPC uptake (Sup-             creases FAO, on which these cells depend for ATP gener-
plemental Fig. S2L,M). We then measured de novo FASyn             ation and ROS detoxification.

                                                                                                  GENES & DEVELOPMENT          5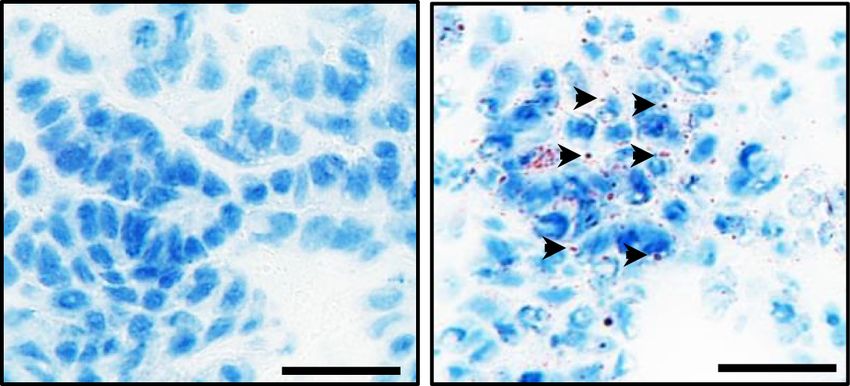
Downloaded from genesdev.cshlp.org on November 23, 2020 - Published by Cold Spring Harbor Laboratory Press

Qiao et al.

                                B                    C                               Figure 3. REDD1 loss potentiates fatty acid
    A
                                                                                     oxidation (FAO) to drive metabolic depen-
                                                                                     dencies on redox and energy homeostasis.
                                                                                     (A) Schematic showing proposed pathways
                                                                                     linking FAO to redox and energy homeostasis.
                                                                                     (B) Increased FAO in primary KRMEFs com-
                                                                                     pared with KMEFs under serum starvation for
                                                                                     3 h as measured by 3H palmitate labeling. Bar
                                                                                     graph shows mean of three experiments. Error
                                                                                     bars indicate SD. (C) Rapid ATP depletion in
                                                                                     KRMEFs compared with KMEFs with FAO in-
         D                                       E                                   hibition by etomoxir treatment (250 µM) for 1
                                                                                     h, assessed by ATP Cell Titer-Glo assay. Bar
                                                                                     graph shows mean from duplicate experi-
                                                                                     ments. (D) Increased NADPH/NADP+ ratio
                                                                                     in KRMEFs compared with KMEFs, assessed
                                                                                     as described in the Materials and Methods.
                                                                                     Graph shows mean of two experiments per-
                                                                                     formed in duplicate. (E) Increased NADPH/
                                                                                     NADP+ ratio in REDD1-ablated primary
                                                                                     KPECS. Bars indicate mean of two experiments
F                                     G                                              performed in duplicate. (F ) Increased GSH con-
                                                                                     centration and GSH/GSSG ratio in KRMEFs as
                                                                                     compared with KMEFs. (G) REDD1 ablation
                                                                                     renders KPECs resistant to glutamine with-
                                                                                     drawal. Cells were cultured in the denoted con-
                                                                                     centrations for 3 d. Data represents mean of
                                                                                     three independent experiments. See also Sup-
                                                                                     plemental Figure S3. Unless noted otherwise,
                                                                                     all error bars denote SD. (∗ ) P < 0.05; (∗∗ ) P <
                                                                                     0.01; (∗∗∗ ) P < 0.001; (∗∗∗∗ ) P < 0.0001 by two-
                                                                                     tailed t-test for all panels.

Increased lipid storage and redox dependence in RAS                tently arrested progression of AdKR tumors (Fig. 4B; Sup-
mutant, REDD1-deficient tumors in vivo                             plemental Fig. S4). Even more striking was the histologic
                                                                   appearance of posttreatment tumors. Untreated tumors
The key hallmark of rewired lipid metabolism we identi-
                                                                   showed uniform fields of viable cells with a high prolifer-
fied in RAS mutant/REDD1-deficient cells is increased
                                                                   ative index as assessed by Ki67 staining. In contrast, BSO-
lipid uptake, resulting in accumulation of Lipid Droplets
                                                                   treated tumors showed decreased Ki67 expression and in-
(LDs). To establish whether this phenotype was indeed re-
                                                                   creased apoptosis, evidenced by immunohistochemistry
flected in the in vivo models, we tested lipid storage by
                                                                   strongly positive for activated Caspase 3 (Fig. 4C–E).
staining primary Kras mutant lung and pancreas tumors
                                                                   Thus, loss of REDD1 increases GSH levels, on which
from Redd1 mutant or wild-type mice with Oil Red O
                                                                   these aggressive tumors are highly dependent for viability
(ORO). While LDs were not identified in the pancreatic
                                                                   in vivo.
or lung tumors of p48K or AdK mice, respectively, the tu-
mors in p48KR and AdKR mice demonstrated abundant
ORO-positive LDs (Fig. 4A). Thus, loss of REDD1 increas-
                                                                   A HIF1α/PPARγ/CD36 axis activated by REDD1
es lipid storage in RAS mutant tumors in vivo.
                                                                   deficiency contributes to lipid uptake and cell migration
   Our findings suggest that increased lipid storage and ac-
tivated FAO in this context promotes tumor progression             A clue to the mechanism of altered REDD1-dependent
through enhanced ROS detoxification via NADPH gener-               lipid metabolism was our observation that multiple genes
ation and increased reduced glutathione (GSH) (Fig. 3).            deregulated in REDD1/RAS mutant cells, including fatty
We therefore sought to assess the requirement for such             acid transport genes (Supplemental Fig. S2), are transcrip-
ROS detoxification in REDD1/RAS-associated tumors in               tional targets of the Hypoxia-Inducible Factor HIF1 (Ben-
vivo, using an allograft model involving implantation of           saad et al. 2014). Indeed, REDD1 is a hypoxia-regulated
primary AdKR lung carcinomas into immunodeficient                  gene whose loss has been linked to stabilization of
mice. We found that this approach produces visibly pro-            HIF1α (Brunelle et al. 2005; Horak et al. 2010). HIF1α lev-
gressive tumors within 2 wk (Fig. 4B). We assessed depen-          els were in fact increased in primary KPECs following
dence on GSH-mediated ROS detoxification in these                  REDD1 knockdown compared with controls, under both
tumors by blocking glutathione synthesis using buthio-             normoxia and hypoxia (Fig. 5A; Supplemental Fig. S5A),
nine sulfoxamine (BSO) (Harris et al. 2015; Chio et al.            and in KRMEFs compared with matched KMEFs (Supple-
2016). Treatment of tumor-bearing mice with BSO consis-            mental Fig. S5B). Accordingly, expression of the key HIF1

6       GENES & DEVELOPMENT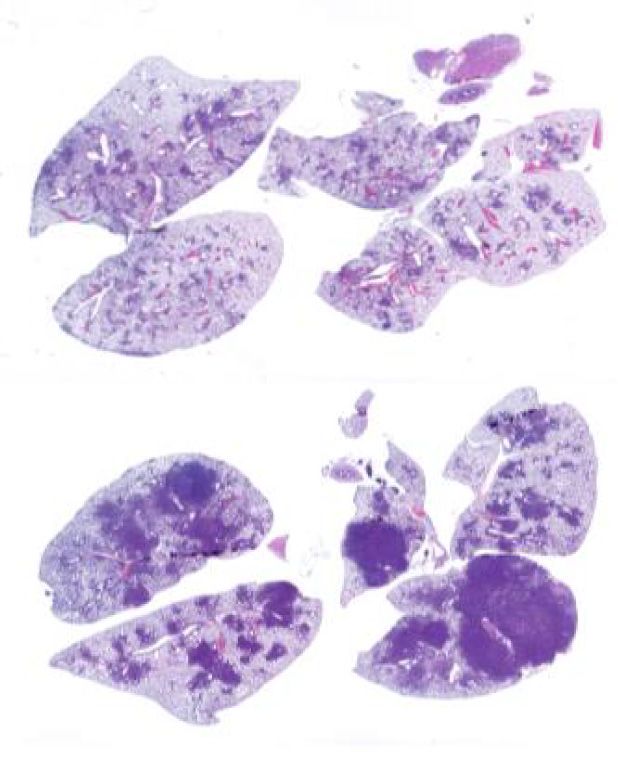
Downloaded from genesdev.cshlp.org on November 23, 2020 - Published by Cold Spring Harbor Laboratory Press
REDD1 loss drives RAS mutant tumors
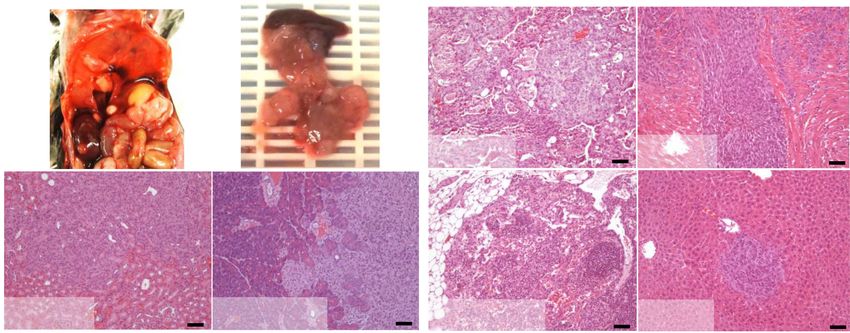
Figure 4. REDD1-deficient tumors show
A
increased lipid storage and glutathione de-
pendence. (A) Accumulation of neutral lipid
droplets analyzed by Oil Red O (ORO) stain-
ing of matched AdK and AdKR primary
lung tumor sections, showing characteristic
speckled droplets only in AdKR tumors.
Scale bars, 20 µm. (Right) Summary quantifi-
cation of ORO staining in lung and pancreat-
B C ic tumors of the indicated genotypes. Values
represent mean ± SEM. (∗ ) P = 0.030, by paired
t-test. (B) AdKR orthotopic tumors are re-
sponsive to glutathione synthase inhibitor
buthionine sulfoximine (BSO). Cells from tu-
mors shown in Figure 1E were implanted
subcutaneously, and BSO (10 mmol/kg, dai-
ly) was administered by i.p. injection 14 d af-
ter implantation (=day 0). (∗∗∗ ) P < 0.001
by one-way ANOVA. (C) Representative sec-
tions of AdKR orthotopic tumors stained
D E by H&E (top), Ki67 (middle), and cleaved
caspase-3 (bottom) after 12-d treatment
with vehicle or BSO. Scale bars, 20 µm.
(D) Quantification of Ki67-positive cell per-
centage from AdKR orthotopic mouse tu-
mor sections from C. (E) Quantification
of cleaved caspase-3 positive cells from
AdKR orthotopic mouse tumor sections
from C. For D and E, five random fields
per tumor from each of five randomly se-
lected tumors were quantitated. Data represent mean ± SD. (∗ ) P < 0.05; (∗∗ ) P < 0.01; (∗∗∗ ) P < 0.001, by two-tailed t-test. See also Supple-
mental Figure S4.
target gene encoding the glucose transporter GLUT1 was ing three distinct HIF1α inhibitors, we found that induc-
markedly elevated (Supplemental Fig. S5C), and was asso- tion of PPARγ in KPECs following REDD1 knockdown
ciated with increased glucose uptake in REDD1-deficient was HIF dependent (Fig. 5E; Supplemental Fig. S5G). Fur-
KPECs (Fig. 5B). Further supporting a glycolytic pheno- thermore, we found that lysophospholipid uptake was pro-
type, oxygen consumption and maximal respiratory ca- moted through this HIF1α/PPARγ pathway, as inhibition
pacity were suppressed in Ras mutant, REDD1-deficient of HIF1α or applying a PPARγ antagonist significantly re-
cells compared with Ras mutant controls (Supplemental duced LPC uptake in KPECs following REDD1 knock-
Fig. S5D). In addition, steady-state metabolite profiling down (Fig. 5F,G; Supplemental Fig. S5H,I).
using LC-MS demonstrated accumulation of pyruvate Among the key target genes of PPARγ we found to be in-
and lactate, with concurrent suppression of pentose phos- duced in the setting of REDD1 deficiency is the CD36 re-
phate pathway and TCA metabolites in the REDD1-defi- ceptor. We observed increased CD36 expression in KPECs
cient cells (Supplemental Fig. S5E). Thus, HIF1α, its after REDD1 knockdown (Fig. 5H), in KRMEFs compared
target genes and a glycolytic phenotype are induced due with KMEFs (Supplemental Fig. S5J), and in vivo in human
to REDD1 loss. pancreas carcinomas with low REDD1 levels (Supplemen-
HIF1α has been linked to fatty acid uptake and lipid stor- tal Fig. S5K). CD36 is at the apex of a signaling cascade in-
age in cardiomyocytes under pathologic stress through a volved in lipid uptake and storage, through which it has
novel pathway involving activation of the peroxisome pro- recently been shown to enable tumor metastasis (Pascual
liferator-activated receptor γ (PPARγ) (Krishnan et al. et al. 2017). We implicated CD36 in lipid transport in
2009). PPARγ is known to play an important role in lipid these cells, as treatment with the irreversible CD36 inhib-
metabolism, promoting fatty acid uptake and TAG accu- itor Sulfosuccinimidyl Oleate (SSO) substantially blocked
mulation in multiple tissues (Spiegelman 1998). We in- LPC uptake (Fig. 5I,J; Coort et al. 2002). CD36 engenders
deed found that the increase in HIF1α observed with loss metastasis by promoting a sub-population of slow-cycling
of REDD1 in both KPECs and MEFs was associated with cells with enhanced metastatic capacity (Pascual et al.
increased mRNA for PPARγ, which, like HIF1α itself, is 2017). To explore such phenotypes in the REDD1 context
further up-regulated under hypoxia (Fig. 5C; Supplemental we used an in vitro wound healing assay, in which migra-
Fig. S5F). Similarly, PPARγ protein was highly up-regulat- tion across a uniform gap is quantitated (Kramer et al.
ed in lung tumors of REDD1-deficient AdKR compared 2013). REDD1 knockdown in KPECs consistently en-
with AdK mice (Fig. 5D). We then tested whether HIF1α hanced migration across the gap, and this effect was abol-
was required for REDD1-associated PPARγ induction. Us- ished by inhibition of CD36 with SSO (Fig. 5K,L). Taken
GENES & DEVELOPMENT 7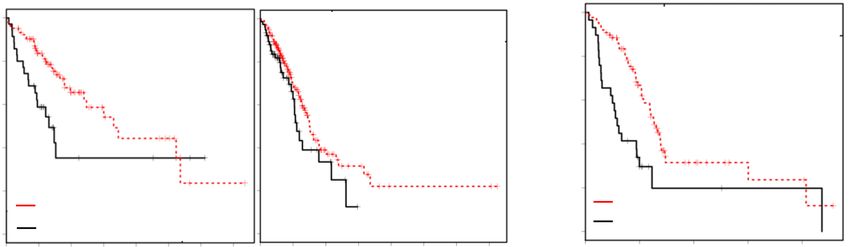
Downloaded from genesdev.cshlp.org on November 23, 2020 - Published by Cold Spring Harbor Laboratory Press

Qiao et al.

                                                                                             Figure 5. REDD1-dependent HIF1α activa-
 A                            B                                   C
                                                                                             tion induces the PPARγ-CD36 fatty acid
                                                                                             transport pathway and promotes cell migra-
                                                                                             tion. (A) Knockdown of REDD1 in primary
                                                                                             KPECs increases the protein level of HIF1α
                                                                                             as detected by IP/Western analysis. IgG
                                                                                             serves as a control for IP. (B) Histogram
                                                                                             showing increased uptake of fluorescent
                                                                                             glucose analog 2-NBDG in REDD1-ablated
                                                                                             KPECs, assessed by flow cytometry. (Right)
 D                                          E                    F                           Summary data from three independent ex-
                                                                                             periments. (C) mRNA expression levels of
                                                                                             PPARγ in KPECs following shCtrl and
                                                                                             shRedd1, as measured by qRT-PCR. Cells
                                                                                             were cultured under normoxia or hypoxia
                                                                                             (1% O2) for 18 h. Graph shows mean
                                                                                             of two experiments performed in duplicate.
                                                                                             (D) Western analysis of primary tumors
                                                                                             from AdK and AdKR mice, demonstrating
                                                                                             an increase in PPARγ protein in the absence
                                                                          J                  of REDD1. (E) Cotreatment with HIF1α in-
  G                        H                     I
                                                                                             hibitor C23 (60 µM) blocks induction of
                                                                                             PPARγ under hypoxia (1% O2) for 24 h in
                                                                                             shRedd1 primary KPECs, as measured by
                                                                                             qRT-PCR. Pioglitazone serves as a positive
                                                                                             control for PPARγ induction. (F ) C23 treat-
                                                                                             ment (40 µM) for 12 h decreased uptake of
                                                                                             Topfluor-LPC in shRedd1 primary KPECs
                                                                                             as measured by flow cytometry. (G) Sum-
                                                                                             mary of three independent experiments per-
 K                                                                                           formed as in F, using two distinct REDD1-
                                                                             L               directed shRNAs. (H) mRNA expression
                                                                                             levels of CD36 in shCtrl and shRedd1 pri-
                                                                                             mary KPECs, as measured by qRT-PCR.
                                                                                             Cells were cultured under normoxia or hyp-
                                                                                             oxia (1% O2) for 18 h. Graph shows mean of
                                                                                             two experiments performed in duplicate.
                                                                                             (I) CD36 inhibitor SSO (200 µM) for 12 h
                                                                                             blocked uptake of Topfluor-LPC in shRedd1
                                                                                             primary KPECs as measured by flow cytom-
                                                                                             etry. (J) Summary of three independent ex-
                                                                                             periments performed as in I, using two
distinct REDD1-directed shRNAs. (K ) Representative images showing the scratch (wound) at time 0 and 48 h with and without SSO treat-
ments (200 µM) in shRedd1 KPECs cultured under hypoxia (1% O2). Uniform cassette inserts were removed to create 0.9 mm wound at
time 0 h. The same area was pictured on time 0 and 48 h. (L) Quantification of wound closure. Percent wound closure was measured using
Image J. Shown are the means of three independent experiments. Error bars represent SEM. Unless otherwise noted, for all graphs. (∗∗ ) P <
0.01; (∗∗∗ ) P < 0.001, by two-tailed t-test. See also Supplemental Figure S5.

together, these observations imply that RAS mutant,                     mutant cells (see Materials and Methods), then we deter-
REDD1-deficient cells co-opt a HIF1α/PPARγ-dependent                    mined the ability of this signature to predict patient out-
pathway for pathological lipid storage characteristic of                comes in a large clinical data set (TCGA) (The Cancer
cardiomyocytes, while activating CD36 to promote lipid                  Genome Atlas Research Network 2014, 2017). Using a
uptake, altered metabolism and enhanced cell migration.                 signature of REDD1 loss was required, as tumor cell levels
                                                                        of REDD1 itself in bulk RNA-seq data are confounded by
                                                                        substantially higher expression in nonepithelial than epi-
Decreased REDD1 levels are associated with poor
                                                                        thelial cells (Supplemental Fig. S6A). We observed that the
outcomes selectively in RAS mutant human cancers
                                                                        median survival of patients with RAS mutant tumors ex-
Finally, we tested the hypothesis that RAS mutant human                 pressing the lowest levels of the REDD1 signature (that is,
tumors with loss of REDD1 expression, like their murine                 associated with REDD1 loss) was approximately one-third
counterparts, may behave particularly aggressively and                  that of those whose tumors expressed the highest levels of
therefore be associated with especially poor patient out-               the signature (P = 0.015, Fig. 6A). Remarkably, no statisti-
comes. Thus, we developed a gene expression signature                   cally significant association with survival was observed
of REDD1-loss from matched REDD1/RAS versus RAS                         based on the REDD1 signature among those with RAS

8       GENES & DEVELOPMENT
Downloaded from genesdev.cshlp.org on November 23, 2020 - Published by Cold Spring Harbor Laboratory Press

                                                                                                     REDD1 loss drives RAS mutant tumors

A                                                        B                                 Figure 6. Low REDD1 levels confer worse
                                                                                           outcomes in RAS mutant human cancers.
                                                                                           (A) Kaplan-Meier analysis of patient out-
                                                                                           comes in the TCGA lung adenocarcinoma
                                                                                           (LUAD) cohort, applying the REDD1 gene
                                                                                           expression signature (see the text). (Left)
                                                                                           Shorter survival is seen among RAS mutant
                                                                                           LUAD patients with low REDD1 signature.
                                                                                           Comparison of bottom (n = 35, median
                                                                                           survival 656 d) and top (n = 104, median sur-
                                                                                           vival 1653 d) quartiles of metagene values.
                                                                                           (Right) No significant difference in survival
                                                                                           among RAS WT patients based on the
C                                                                                          REDD1 signature. Comparison of bottom (n
                                                                                           = 77, median survival 1115 d) and top (n =
                                                                                           230, median survival 1499 d) quartiles of
                                                                                           metagene values. P-values calculated by
                                                                                           log-rank test. (B) Kaplan-Meier analysis of
                                                                                           patient outcomes in the TCGA pancreatic
                                                                                           adenocarcinoma (PDAC) cohort, applying
                                                                                           the REDD1 signature. Shorter survival is ob-
                                                                                           served among RAS mutant PDAC patients
                                                                                           with low REDD1 signature. Comparison of
                                                                                           bottom (n = 29, median survival 293 d) and
                                                                                           top (n = 87, median survival 634 d) quartiles
                                                                                           of metagene values. (C) IHC for REDD1 us-
                                                                                           ing affinity-purified anti-REDD1 antibody
                                                                                           on lung adenocarcinomas (LUAD; n = 47 cas-
                                                                                           es) and normal lung tissue. Representative
D                                  E                                 F                     photomicrographs of REDD1 low (left) and
                                                                                           high (middle) LUAD cases. Scale bars, 20
                                                                                           µm. (Bottom, right panel) Distribution of
                                                                                           REDD1 IHC scores among 47 cases. (D)
                                                                                           Kaplan-Meier analysis of clinical outcomes
                                                                                           based on tumor cell REDD1 protein expres-
                                                                                           sion, showing significantly shorter progres-
                                                                                           sion free survival (PFS) for patients with
                                                                                           RAS mutant adenocarcinomas in the bottom
                                                                                           50% of REDD1 IHC scores (median PFS: 749
                                                                                           d) compared with the top 50% of REDD1
IHC scores (median PFS: 1338 d). P-values calculated by log-rank test. (E) Among RAS WT patients, no statistically significant difference
in PFS is observed based on REDD1 protein expression. P-value by log-rank test. (F ) Lower REDD1 protein expression is associated with
larger primary tumors. Shown are tumors in the top and bottom quartiles of REDD1 expression. (∗ ) P = 0.045 by two tailed t-test.

wild-type tumors (P = 0.12) (Fig. 6A). Also of note, the asso-         mary lung adenocarcinomas (Huynh et al. 2016). REDD1
ciation between the REDD1 signature and outcomes in                    expression is moderate in normal pulmonary epithelia,
RAS mutant tumors was not confounded by smoking sta-                   and we developed a scoring system to identify subsets of
tus (Supplemental Fig. S6B) or by additional prognostic                RAS mutant tumors with both high and low/absent tu-
somatic mutations, as there was no statistically signifi-              mor cell expression of REDD1 (Fig. 6C). Despite the rela-
cant association between the REDD1 signature and the                   tively small numbers, patients with RAS mutant tumors
presence/absence of such mutations, including TP53 and                 exhibiting low REDD1 protein expression experienced
KEAP1 in this cohort. We then analyzed the TCGA cohort                 significantly worse progression-free survival (P = 0.029,
for PDAC, the large majority of which harbor RAS muta-                 Fig. 6D). As in the TCGA cohort, low REDD1 expression
tions (The Cancer Genome Atlas Research Network 2014,                  was not associated with worse progression-free survival
2017). Again, the REDD1 loss gene expression phenotype                 among those whose lung tumors lacked RAS mutation
predicted worse outcome with high statistical signifi-                 (Fig. 6E). Furthermore, RAS mutant tumors with low
cance (P = 0.00097), even considering the overall dismal               REDD1 protein levels were found to be significantly larger
survival of PDAC as a whole (Fig. 6B).                                 at time of diagnosis that REDD1-high tumors, consistent
   We further credentialed these findings by direct analy-             with a role for REDD1 loss in particularly aggressive dis-
sis of REDD1 protein in tumors via immunohistochemis-                  ease (Fig. 6F). All together, these findings reveal REDD1
try. We developed and validated a high specificity,                    loss as a hallmark and driver of a RAS mutant tumor sub-
affinity-purified anti-REDD1 antibody (DeYoung et al.                  set characterized by a reprogramming of lipid metabolism,
2008) that we applied to a clinically annotated set of pri-            rapid progression and poor outcomes (Fig. 7).

                                                                                                         GENES & DEVELOPMENT           9
Downloaded from genesdev.cshlp.org on November 23, 2020 - Published by Cold Spring Harbor Laboratory Press

Qiao et al.

                                                                      tential therapeutic target in the setting of RAS mutation
                                                                      (Singh et al. 2018), while others report reliance instead
                                                                      on uptake and oxidation of fatty acids (Padanad et al.
                                                                      2016). Here, we show that RAS mutant cells and tumors
                                                                      with REDD1 loss exhibit increased lipid uptake, storage,
                                                                      and fatty acid oxidation (FAO), and accordingly that de-
                                                                      creased reliance on FASyn is triggered by REDD1 loss
                                                                      even in established human tumor cells (Fig. 2). Taken to-
                                                                      gether, these findings speak to the potential for intertu-
                                                                      mor heterogeneity of lipid metabolism in this context,
                                                                      and they suggest REDD1 loss as a metabolic switch that
                                                                      activates a unique pathway for lipid deregulation.
                                                                         Our findings point to activation of HIF1α as a key con-
Figure 7. Model for REDD1 loss in RAS-driven tumorigenesis.           tributor to the metabolic effects associated with REDD1
REDD1 loss up-regulates HIF, PPARγ/CD36, and fatty acid-bind-         loss. The elevated HIF1α levels we observed are consistent
ing proteins (FABPs) to mediate uptake and lipid droplet storage.
                                                                      with previous work demonstrating that stabilization of
This effect is associated with increased fatty acid oxidation (FAO)
                                                                      HIF1α results from the increased mitochondrial (but not
that generates ATP as well as reducing equivalents (NADPH and
GSH) through the mitochondrial Krebs (TCA) cycle, resulting in        cytosolic) ROS that results from loss of REDD1 (Brunelle
relief from RAS-induced energy stress and oxidative stress, and       et al. 2005; Horak et al. 2010). Furthermore, our results
ultimately tumor progression. We hypothesize that combination         are also in keeping with prior work demonstrating a
therapies targeting the multiple metabolic nodes described here-      functional interaction between REDD1 and the stress-in-
in are likely to be effective against REDD1-deficient, RAS mutant     duced metabolic regulator TXNIP (Qiao et al. 2015). Like
cancers.                                                              REDD1, loss of TXNIP is associated with stabilization
                                                                      and activation of HIF1α in multiple cellular contexts
                                                                      (Shin et al. 2008; Ji Cho et al. 2019). We found that the ac-
Discussion                                                            tivation of HIF1α and PPARγ/CD36 that result from loss
                                                                      of REDD1 are associated with both increased glycolysis
Here we reveal that loss of the stress response gene,                 and fatty acid/lysophospholipid uptake. Similar effects
REDD1, underlies a particularly lethal subgroup of RAS                of HIF1α/PPARγ/CD36 are known to occur under patho-
mutant tumors. Our studies show that REDD1 deficiency                 logic stress in cardiomyocytes, leading to increased TAG
engenders markedly elevated lipid uptake and storage,                 generation from fatty acid conjugation to the glucose-
coupled to a glycolytic phenotype and activated FAO                   derived glycerol-3-phosphate backbone (Krishnan et al.
that sustains metabolic demands of the RAS mutant con-                2009). While in the latter context pathologic cardiac stea-
text to promote tumor progression including metastatic                tosis results, we provide evidence that HIF1α-dependent
dissemination. Notably, the contribution of REDD1 to                  lipid storage and an associated increase in FAO confer a
human cancer has to date been unclear, as deletion of                 distinct advantage to RAS mutant tumors. This finding
REDD1 alone is insufficient to confer tumor predisposi-               is in keeping with a prior report describing lipid droplet
tion in mice (Lipina and Hundal 2016). However, we found              formation and associated increased FAO as a HIF1α-medi-
that in the context of activated RAS, loss of REDD1 and               ated survival mechanism selectively in epithelial tumor
the ensuing metabolic rewiring convert preneoplastic                  cells (Bensaad et al. 2014). Thus, not only is HIF1α/
lesions into invasive and in some cases metastatic malig-             PPARγ/CD36 activation in RAS/REDD1 mutant tumors
nancies. A highly relevant functional interaction between             associated with dramatic accumulation of lipid storage
REDD1 and mutant RAS is further supported by our ob-                  droplets in vivo, this storage is coupled to increased
servation that REDD1 expression is associated with clin-              FAO that we found is important for generation of both
ical outcomes selectively in human RAS mutant, but not                ATP and ROS-detoxifying NADPH. We further link
RAS wild-type lung and pancreas tumors. Collectively,                 FAO and redox homeostasis to REDD1-dependent tumor
these findings suggest the REDD1-mediated stress re-                  progression in vivo, demonstrating the critical sensitivity
sponse as a novel tumor suppressor mechanism in the                   of RAS/REDD1 mutant tumors to NADPH/GSH-mediat-
context of RAS mutation.                                              ed detoxification. Thus, treatment with the glutathione
   Multiple aspects of lipid metabolism are deregulated in            synthesis inhibitor BSO induces growth arrest and cell
the setting of RAS mutation, yet the details of how this re-          death within these tumors in vivo.
wiring occurs and contributes to cancer pathogenesis re-                 A consistent feature of the RAS mutant, REDD1-defi-
mains to be fully elucidated (Biancur and Kimmelman                   cient phenotype is the progression to invasive malignancy
2018). For example, increased lipid uptake has been de-               including in some cases disseminated hematogenous me-
scribed in KRAS mutant pancreatic epithelial cells, but               tastasis. Our data suggest that this effect relates in part to
the upstream pathways and in vivo consequences were                   the up-regulation of the CD36 receptor in this context.
not established (Kamphorst et al. 2013). Furthermore, re-             CD36 has now been implicated as a mediator of poor
ports have varied regarding the role of fatty acid synthesis          outcomes and metastasis in multiple different cancers
(FASyn) in the context of RAS mutation, with some stud-               (Pascual et al. 2017; Ladanyi et al. 2018). Our findings
ies suggesting FASyn as an essential contributor and po-              that CD36 is required for lipid uptake and cell migration

10       GENES & DEVELOPMENT
Downloaded from genesdev.cshlp.org on November 23, 2020 - Published by Cold Spring Harbor Laboratory Press
REDD1 loss drives RAS mutant tumors
in REDD1-deficient cells provide new insight into CD36 the Bardeesy laboratory), which consisted of a mutant Kras G12D
activation in cancer, and they collectively suggest a direct allele knocked into the endogenous Kras locus, preceded by an
contribution of CD36 to the pathogenesis of REDD1-defi- LSL cassette.
cient tumors. Collectively, these results point to a poten-
tial role for lipid metabolism as a driver of invasive and Adenovirus-induced lung adenocarcinoma
ultimately metastatic disease.
LSL-KrasG12D (Kras) and LSL-KrasG12D; Redd1 −/− mice were
All the points noted above imply that the metabolic re-
treated with 5 × 10⁵ or 5 × 10⁶ plaque-forming units of adenovirus
wiring that characterizes RAS mutant, REDD1-deficient expressing Cre (University of Iowa Adenovirus Core) by intratra-
tumors may be of direct clinical relevance. For example, cheal infection as described previously (DuPage et al. 2009). Tu-
multiple studies have suggested a particular reliance of mors were analyzed 12 wk after infection.
certain KRAS mutant tumors on glutamine, and gluta-
minase inhibitors that aim to exploit this dependence
Allograft lung cancer mouse model
have now entered clinical trials (Son et al. 2013; Fung
and Chan 2017; Romero et al. 2017). However, the relative Kras G12D; Redd1 −/− primary tumors were dissociated by collage-
insensitivity to glutamine withdrawal we demonstrate in nase digestion containing soybean trypsin inhibitor, digested
the setting of REDD1 loss may predict that patients pre- samples were teased through a 100-mm filter, resuspended in cul-
senting with such tumors will be poor candidates for ture medium. CD31 and CD45 positive cells were discarded
through flow cytometry sorting. Tumor cells were then mixed
this therapy. Similarly, recent work has documented de-
with matrigel and were injected subcutaneously into nude mice
pendence of Kras mutant GEMMs on fatty acid synthesis,
in double-flanks. Two weeks later, when tumors reached an aver-
resulting in tumor sensitivity to inhibition of the key age diameter of 4–5 mm, tumor-bearing mice were randomized
committed step in this process catalyzed by ACC (Svens- into two groups with that day as day 0. For in vivo buthionine sul-
son et al. 2016). Again, the REDD1 phenotype is distinct, foximine (BSO; Sigma) treatment, tumor-bearing mice were treat-
as REDD1 loss is associated with suppressed fatty acid ed daily with intraperitoneal injections of vehicle or BSO at a dose
synthesis in the mutant RAS context, and we show of 10 mmol/kg dissolved in PBS. Tumors were measured every
directly that this effect confers substantial resistance to other day for up to 12 d, and tumor volumes were calculated
ACC inhibitors. Conversely, we found that REDD1-defi- with the formula: tumor volume (mm3) = 4/3π × length/2 ×
cient tumors are highly sensitive to glutathione depletion width/2.
with BSO. Clinical trials using this agent have not yielded
responses in a large proportion of tumors, yet our findings Orthotopic pancreatic cancer mouse model
suggest the possibility that targeting a metabolically de-
SCID mice (C3SnSmn.CB17-Prkdcscid/J,; Jackson Laboratories)
fined tumor subset, such as that discovered here, may be were subjected to general anesthesia according to Massachusetts
more successful (Kirkpatrick and Powis 2017). Finally, General Hospital Subcommittee on Research Animal Care poli-
CD36 itself is an attractive potential therapeutic target cies. Orthotopic injections of the pancreas were conducted as pre-
whose inhibition has proven relatively nontoxic in pre- viously described (Corcoran et al. 2011) using 2 × 10⁴ p48-Cre;
clinical models (Pascual et al. 2017). LSL-KrasG12D pancreatic ductal cells suspended in 50 mL of
In summary, we show that REDD1 deficiency defines duct medium mixed (Agbunag et al. 2006) with 50 mL of Matrigel
and drives progression and poor clinical outcomes in (BD Biosciences).
RAS mutant tumors. We reveal distinct metabolic rewir-
ing engendered by REDD1 that alleviates RAS-induced Primary pancreatic cancer epithelial cells
metabolic stress and is associated with the progression
Primary pancreatic epithelial cells were derived from 9-wk-old
to invasive disease and metastasis. Collectively, these
p48-Cre; LSL-KrasG12D mice as described previously (Agbunag
findings advance our understanding of the heterogeneity
et al. 2006). These Kras G12D-acitivated pancreatic epithelial cells
of common RAS mutant tumors, and they reveal loss of were propagated on surfaces coated with laminin (BD Bioscienc-
REDD1 as a clinically important and potentially thera- es) and in a specific pancreatic medium.
peutically actionable hallmark in these malignancies.
Primary mouse embryonic fibroblasts
Materials and methods Early passage MEFs (P < 5) were used for all of the experiments.
LSL-KrasG12D mice were crossed with Redd1 −/− mice to generate
GEMMs LSL-KrasG12D; Redd1 −/− MEFs. Mice and MEFs were on C57BL/6
Mice were housed in pathogen-free animal facilities at Massachu- background. Embryos were genotyped according to published
setts General Hospital. All experiments were performed under procedures. MEFs were grown in DMEM/10% FCS/Pen/Strep.
protocol 2004N000228, approved by the Subcommittee on Re- To activate Kras in the LSL-KrasG12D, cultures were infected
search Animal Care at Massachusetts General Hospital. Mice with Ad-Cre (500-1000 pfu/cell) leading to activation of Kras G12D
were maintained on a C57BL/6 background. Data presented in- in AdK and AdKR cells.
clude both male and female mice. All mice included in the sur-
vival analysis were killed when criteria for disease burden
Cell culture
(including abdominal distension that impeded movement, loss
of >15% of body weight, labored breathing, and/or abnormal pos- The REDD1 −/− allele was generated as previously described
ture) were reached. Redd1 −/− strain were crossed with p48-Cre (Sofer et al. 2005). MEFs not harboring LSL-KrasG12D were im-
strain and the LSL-KrasG12D strain (Jackson Laboratory, from mortalized by retroviral transduction of SV40 large T-antigen
GENES & DEVELOPMENT 11Downloaded from genesdev.cshlp.org on November 23, 2020 - Published by Cold Spring Harbor Laboratory Press
Qiao et al.
unless indicated otherwise, and were maintained in DMEM/10% instrument. Cell extracts (10 μL) were diluted using 90 μL of
FCS/Pen/Strep. Human non-small cell lung cancer cell line A549 74.9:24.9:0.2 (v/v/v) acetonitrile/methanol/formic acid contain-
was obtained from the American Type Culture Collection and ing stable isotope-labeled internal standards (valine-d8 [Isotec]
maintained in DMEM/10% FCS/pen/strep. Primary pancreatic and phenylalanine-d8 [Cambridge Isotope Laboratories]). The
intraepithelial cells (AH375) were isolated from LSL-KRAS G12D samples were centrifuged at 9000g for 10 min at 4°C and the su-
mice as described previously (Corcoran et al. 2011). All pancreatic pernatants were injected directly onto a 150 × 2-mm Atlantis
ductal epithelial cells were routinely maintained in ductal media HILIC column (Waters). The column was eluted isocratically at
on laminin-coated plates. Negative mycoplasma contamination a flow rate of 250 μL/min with 5% mobile phase A (10 mM ammo-
status of all cancer cell lines, 293T cell line and primary cells nium formate, 0.1% formic acid in water) for 1 min followed by a
used in the study was established using LookOut mycoplasma linear gradient to 40% mobile phase B (acetonitrile with 0.1% for-
PCR kit (Sigma MP0035). mic acid) over 10 min. The electrospray ionization voltage was
3.5 kV and data were taken using full scan analysis over m/z
70–800 at 70,000 resolution. HILIC analyses of water-soluble me-
Metabolite profiling tabolites in the negative-ion mode were performed using a Nexera
X2 U-HPLC (Shimadzu) coupled to a Q-Exactive Plus Orbitrap
IC method A Thermo Scientific Dionex ICS-5000+ HPIC ion mass spectrometer (Thermo Fisher Scientific). Cell extracts (10
chromatography system consisting of a dual pump, an eluent μL) were injected onto a 150 × 2.0-mm Luna NH2 column (Phe-
generator (EG) with a capillary KOH cartridge, and a detection nomenex) that was eluted at a flow rate of 400 μL/min with initial
compartment (DC) featuring an IC module with suppressed con- conditions of 10% mobile phase A (20 mM ammonium acetate,
ductivity detection was used in this study. The whole system was 20 mM ammonium hydroxide in water) and 90% mobile phase
metal free. The ERS 500 suppressor was operated in external-wa- B (10 mM ammonium hydroxide in 75:25 [v/v] acetonitrile/meth-
ter mode with ultrapure Milli-Q water, and regenerant was deliv- anol) followed by a 10-min linear gradient to 100% mobile phase
ered by pressure using an argon gas tank at a pressure of 20 psi. A. MS full-scan data were acquired over m/z 70–750. Instrument
The eluent of the IC system was converted to pure water after settings were source voltage −3.0 kV, source temperature 325°C,
the column and flowed directly to the MS source. To help with capillary temperature 350°C, sheath gas 55, auxiliary gas 10, and
the desolvation for better electrospray, makeup solvent of meth- resolution 70,000. LC-MS data were processed and visually in-
anol was delivered at 60 μL/min and mixed with the eluent via a spected using TraceFinder 3.1 software (Thermo Fisher Scientific)
low dead volume mixing tee, and passed through a grounding LC-MS (Mascanfroni et al. 2015).
union before entering the MS. The HPIC analysis was conducted
with the IonPac AS11HC-4 μm, 2.0 × 250-mm columns (2000 Å).
IC flow rate was 380 μL/min (at 30°C supplemented postcolumn Retroviral and lentiviral production
with makeup flow). The gradient conditions were as follows: An
initial 25 mM KOH was held for 3 min prior to injection, in- Viruses expressing pLPC-REDD1-HA, Redd1, and REDD1 were
creased linearly to 95 mM at 8 min, held at 95 mM for 1 min, fol- used in this study. shRedd1 clones were cotransfected into
lowed by a drop to 25 mM within 0.1 min, and held for 10 min to HEK293T cells with lentiviral packaging plasmids by using Cal-
re-equilibrate the column. The total run time was 23 min. The Phos mammalian transfection kit (Clontech Laboratories) accord-
ion spray voltage was −3 kV and the source temperature was ing to manufacturer’s instruction. The conditioned medium
350°C. Raw data were taken using full scan analysis over m/z containing lentiviral particles was collected 36 h after transfection
67–1000 at 140,000 resolution. LC-MS data were processed and and filtered with a 0.45-μm pore filter (Milipore). The filtered me-
visually checked using TraceFinder 3.3 software (Thermo Fisher dia was then used to infect target cells. Polybrene (Sigma) was sup-
Scientific). Medium samples (30 μL) were derived using 120 μL plemented at final concentration of 10 μg/mL to increase infection
of 80% methanol (VWR) containing the internal standards efficiency. The infected cells were selected using 1 μg/μL puromy-
inosine-15N4, thymine-d4, and glycocholate-d4 (Cambridge Iso- cin (Sigma) 72 h after infection. Genetic knockdown of Redd1 was
tope Laboratories). The samples were centrifuged at 9000g for confirmed via either immunoblotting or qRT-PCR analysis.
10 min at 4°C, and 5 µL of supernatant was transferred to an auto- shRNA sequences for Redd1 were GCTATCTTACAGACGCAT
sampler vial and injected on to the HPIC. Cellular extracts were GAA and GTGTAGCATGTACCTTATTAT. shRNA sequences
put directly into the system. for REDD1 were GCTATCTTACAGACGCATGAA and GCTA
TCTTACAGACGCATGAA.
C8-pos and HILIC-pos methods Lipid extracts were analyzed using
a Nexera X2 U-HPLC (Shimadzu) coupled to an Exactive Plus
Immunohistochemistry
orbitrap mass spectrometer (Thermo Fisher Scientific). Extracts
(10 μL) were injected onto an Acquity UPLC BEH C8 column Mouse tissue specimens were fixed in 4% buffered formalin for 24
(1.7 μm, 2.1 × 100 mm; Waters). The column was initially eluted h and kept in 70% ethanol until paraffin embedding. Assistance
isocratically at a flow rate of 450 μL/min with 80% mobile phase in processing of murine tumor samples was offered by the
A (95:5:0.1 [v/v/v] 10 mM ammonium acetate/methanol/formic Dana-Farber/Harvard Cancer Center Specialized Histopathology
acid) for 1 min, followed by a linear gradient to 80% mobile-phase Core Facility. Five-micron sections were taken from formalin-
B (99.9:0.1 [v/v] methanol/formic acid) over 2 min, a linear gradi- fixed, paraffin-embedded tumors and stained using standard pro-
ent to 100% mobile phase B over 7 min, and then 3 min at 100% tocols. Lung cancer patient tissue microarray were generated at
mobile phase B. MS analyses were performed using electrospray Massachusetts General Hospital Pathology department. Staining
ionization in the positive ion mode (source voltage was 3 kV, for cleaved caspase 3 was performed by Massachusetts General
source temperature was 300°C, sheath gas was 50.0, auxillary Hospital Histopathology Research Core. Staining for human
gas was 15) using full scan analysis over m/z 200–1100 and at REDD1 using affinity-purified antibody were conducted by the
70,000 resolution. Hydrophilic interaction liquid chromatogra- core staff. IHC results were further evaluated by H-score system
phy (HILIC) analyses of water soluble metabolites were carried or (“histo” score) to tumor samples. The H-score included the
out in the positive ion mode using a Nexera X2 U-HPLC (Shi- sum of individual H-scores for each intensity level seen (score
madzu)-Q Exactive Orbitrap (Thermo Fisher Scientific) LC-MS 0: no positive staining; score 3: strongest staining) using the
12 GENES & DEVELOPMENTYou can also read