Topoisomerase II contributes to DNA secondary structure-mediated double-stranded breaks
←
→
Page content transcription
If your browser does not render page correctly, please read the page content below
6654–6671 Nucleic Acids Research, 2020, Vol. 48, No. 12                                                                         Published online 5 June 2020
doi: 10.1093/nar/gkaa483

Topoisomerase II contributes to DNA secondary
structure-mediated double-stranded breaks
Karol Szlachta1,† , Arkadi Manukyan1,† , Heather M. Raimer1,† , Sandeep Singh 1 ,
Anita Salamon 1 , Wenying Guo2 , Kirill S. Lobachev2 and Yuh-Hwa Wang 1,*
1
 Department of Biochemistry and Molecular Genetics, University of Virginia, Charlottesville, VA 22908-0733, USA
and 2 School of Biological Sciences and Institute for Bioengineering and Bioscience, Georgia Institute of Technology,
Atlanta, GA 30332, USA

                                                                                                                                                                  Downloaded from https://academic.oup.com/nar/article/48/12/6654/5851738 by guest on 08 December 2020
Received April 21, 2020; Revised May 20, 2020; Editorial Decision May 23, 2020; Accepted June 01, 2020

ABSTRACT                                                                                 rangements, deletions, and amplifications resulting in hu-
                                                                                         man genome instability. These modifications of the genome
DNA double-stranded breaks (DSBs) trigger human                                          can introduce genomic diversity and impact evolutionary
genome instability, therefore identifying what factors                                   outcomes (1), however, disease-causing mutations gener-
contribute to DSB induction is critical for our under-                                   ated by these changes involving tumor suppressor genes or
standing of human disease etiology. Using an un-                                         oncogenes could lead to cancer development (2).
biased, genome-wide approach, we found that ge-                                             While a substantial amount of work has shown DNA re-
nomic regions with the ability to form highly stable                                     pair and cell cycle checkpoint proteins to be vital for main-
DNA secondary structures are enriched for endoge-                                        taining genome stability (3), alternative DNA secondary
nous DSBs in human cells. Human genomic regions                                          structures, which vary from the B-DNA conformation, have
predicted to form non-B-form DNA induced gross                                           been demonstrated to lead to DSBs (4). DNA secondary
chromosomal rearrangements in yeast and displayed                                        structure-forming sequences are often found at chromo-
                                                                                         somal fragile sites (5,6). We have shown that aphidicolin-
high indel frequency in human genomes. The ex-
                                                                                         induced common fragile sites are predicted to form more
tent of instability in both analyses is in concordance                                   stable DNA secondary structures and with greater density
with the structure forming ability of these regions.                                     than non-fragile regions (7). Using DNA secondary struc-
We also observed an enrichment of DNA secondary                                          ture calculation programs (Mfold and ViennaRNA with
structure-prone sites overlapping transcription start                                    DNA thermodynamic parameters), we have shown that
sites (TSSs) and CCCTC-binding factor (CTCF) bind-                                       the potential for DNA stem–loop structure formation is
ing sites, and uncovered an increase in DSBs at                                          prevalent throughout the human genome (8). Formation of
highly stable DNA secondary structure regions, in re-                                    these structures can occur in single-stranded DNA when the
sponse to etoposide, an inhibitor of topoisomerase II                                    DNA duplex is unwound during processes such as replica-
(TOP2) re-ligation activity. Importantly, we found that                                  tion and transcription, and can thus be influenced by nu-
TOP2 deficiency in both yeast and human leads to a                                       cleotide sequence and cellular activities. Once formed, sta-
                                                                                         ble DNA secondary structures can present a barrier for
significant reduction in DSBs at structure-prone loci,
                                                                                         polymerase progression, resulting in incomplete replication
and that sites of TOP2 cleavage have a greater abil-                                     at fragile sites and ultimately leading to DNA breakage (9).
ity to form highly stable DNA secondary structures.                                      This provides a passive role for the involvement of DNA
This study reveals a direct role for TOP2 in generat-                                    secondary structure in the initiation of DNA breaks. Sev-
ing secondary structure-mediated DNA fragility, ad-                                      eral studies showed that DSBs can also occur during active
vancing our understanding of mechanisms underly-                                         transcription (10–14), and we found that DNA stem-loop
ing human genome instability.                                                            structure formation is significantly enriched at transcription
                                                                                         start sites (TSSs) (8). Canela et al., Gothe et al. and Gittens
INTRODUCTION                                                                             et al. have recently demonstrated the involvement of topoi-
                                                                                         somerase II (TOP2) in the generation of DSBs at highly
DNA double-stranded breaks (DSBs) can arise during                                       expressed genes (13–15). However, the genome-wide anal-
DNA metabolic processes and/or from responding to a                                      ysis of DSBs with respect to sites of secondary structure-
wide range of stresses. When unrepaired or illegitimately                                forming potentials and whether there is any correlation of
repaired, DSBs contribute to the formation of gene rear-

* To   whom correspondence should be addressed. Tel: +1 434 243 2785; Fax: +1 434 924 5069; Email: yw4b@virginia.edu
†
    The author wish it to be known that, in their opinion, the first three authors should be regarded as joint First Authors.

C The Author(s) 2020. Published by Oxford University Press on behalf of Nucleic Acids Research.
This is an Open Access article distributed under the terms of the Creative Commons Attribution Non-Commercial License
(http://creativecommons.org/licenses/by-nc/4.0/), which permits non-commercial re-use, distribution, and reproduction in any medium, provided the original work
is properly cited. For commercial re-use, please contact journals.permissions@oup.com
Nucleic Acids Research, 2020, Vol. 48, No. 12 6655
TOP2-induced DSBs with the ability to form DNA sec- Stable DNA secondary structures are indeed detected in
ondary structure has not been explored. these regions in human cells, and their locations validate
DNA TOP1 and TOP2 play a critical and broad role in the computational structure predictions. Furthermore, us-
maintaining chromosome structural integrity during DNA ing human DNA fragments with distinct secondary struc-
processes in which strand separation generates DNA super- ture folding capability, we demonstrated that highly sta-
coiling (16,17). TOP1 and TOP2 alleviate DNA topological ble DNA secondary structure sequences induce fragility in
problems by transiently inducing a covalently-bound DNA yeast and display more insertions and deletions in the hu-
break (single-stranded for TOP1 and double-stranded for man genome, and the extent of instability in both analy-
TOP2), facilitating DNA strand passage, and then re- ses is in concordance with the ability to form secondary
ligating at the cleavage site. Recently, Hoa et al. (18) re- structure. In addition, TOP2 contributes to the formation
vealed that TOP2 frequently fails to re-ligate the endoge- of endogenous DSBs, which are enriched at the highly sta-
nous, transiently-cleaved products even without the pres- ble DNA secondary structure regions, and the enrichment
ence of inhibitors, which can therefore be processed into increases upon increasing concentration of etoposide (a
Downloaded from https://academic.oup.com/nar/article/48/12/6654/5851738 by guest on 08 December 2020
persistent DSBs. These persistent DSBs can occur when ei- TOP2 inhibitor that prevents the re-ligation activity). The
ther a covalently bound pair of TOP2s are both processed direct involvement of TOP2 at these structural regions was
by DNA repair machinery to result in free DNA ends, or demonstrated in TOP2-deficient yeast and human cells, in
when two single-stranded breaks occur in close proximity which DSBs at high propensity structure regions are sig-
to one another (potentially from the action of two sepa- nificantly reduced compared to TOP2 wild-type cells. The
rate TOP2 activities occurring on opposing strands and pro- DSB regions sensitive to TOP2B knockout are energetically
cessed to free ends). TOP2 covalently bound to DNA can be favorable to form secondary structure and the predicted
repaired by both non-homologous end-joining (NHEJ) and structures are located at break summits. Overall support-
homologous recombination (HR) repair pathways. To un- ing the contribution of TOP2 in DNA secondary structure-
dergo NHEJ repair, the covalently bound TOP2 is first de- mediated breaks.
graded by the proteasome and then the remaining tyrosine-
linked end can be freed by TDP2 (19–24). To undergo MATERIALS AND METHODS
HR, or other pathways involving end resection, the MRN
complex in cooperation with other repair proteins (such as Genome-wide DNA secondary structure prediction
BRCA1 and CtIP) can directly cleave off a small segment of Using DNA secondary structure calculation programs, we
the DNA end containing the covalently bound TOP2. This have provided an energetic potential for secondary structure
process then leaves free DNA ends that can undergo con- formation across the human genome (build GRCh37/hg19)
tinued resection and eventual repair (25–29). The conver- (8). Here, we applied the same analysis (ViennaRNA pro-
sion of the covalently bound TOP2 DNA end to a protein grams with parameters for analyzing DNA (40)), to the
free end creates the persistent break that then needs repair available sequence in the genome assembly GRCh38/hg38.
through these DNA repair pathways, compared to the tran- With a window of 300 nt and a step of 150 nt, a total
sient nature of the TOP2 bound ends which if allowed to of 19 490 090 segments were analyzed, and the average
complete the catalytic cycle would then re-ligate the DNA G of DNA secondary structure formation was –30.1 ±
ends faithfully (24). 11.8 kcal/mol. Using a threshold that we identified (7),
Both TOP1 and TOP2 have very loose recognition se- we defined sites of highly stable DNA secondary struc-
quences and DNA supercoiling is not an absolute require- ture as having at least seven consecutive windows with a
ment for TOP1 and TOP2 cleavage (22,30,31). Interestingly, G value in the top 5% most stable structures predicted
several studies demonstrated a property of TOP1 and TOP2 across the genome (below –51.3 kcal/mol). The 23 331
to recognize and preferentially cleave DNA at regions ca- sites were identified, with sizes ranging from a minimum
pable of forming stable DNA secondary structures (32–37), of 1200 nt up to over 20 000 nt in length (ordered by size
similar to those predicted or formed at fragile sites. Addi- in Figure 1B, the leftmost panel), and these sites consist
tionally, some features found in DNA secondary structures, of ∼1.5% of the genome, indicating the stringency of the
such as mismatched bases, are known to poison TOP2 simi- threshold.
lar to chemotherapeutic drugs (38,39). This possibility leads
to a very interesting notion––whether TOP1 and TOP2 rec-
ognize non-B-DNA structural features, in addition to DNA Cell culture and treatments
supercoiling, and contributes to DNA secondary structure- HeLa cells (ATCC) and GM13069 cells (ATCC) were
mediated DNA fragility. grown in DMEM (Gibco) and RPMI 1640 medium
Here, we performed a non-biased, comprehensive study (Gibco), respectively, and supplemented with 10% fetal
to evaluate the connection between DNA secondary struc- bovine serum. Human neural progenitor cells (NPC9429)
ture formation and DNA fragility on a genome-wide scale. derived from an apparently healthy individual (41), were
We further investigated the processes/proteins involved in grown in DMEM/F12 (Gibco) media containing 1% N-
secondary structure-mediated DNA fragility, which lead to 2 (Gibco), 2% B27-A (Gibco), 1g/mL laminin (Life
the focus on TOP2. We found that DSBs are enriched in Technology) and fibroblast growth factor (Peprotech), and
the regions predicted to form highly stable DNA secondary maintained in matrigel (Corning)-coated dishes. Etoposide
structure at a genome-wide level, and this DSB enrichment (Sigma) treatment of GM13069 cells were at 0.15, 1.5 or 15
in a subset of sites is conserved across different cell types. M for 24 h, along with untreated cells.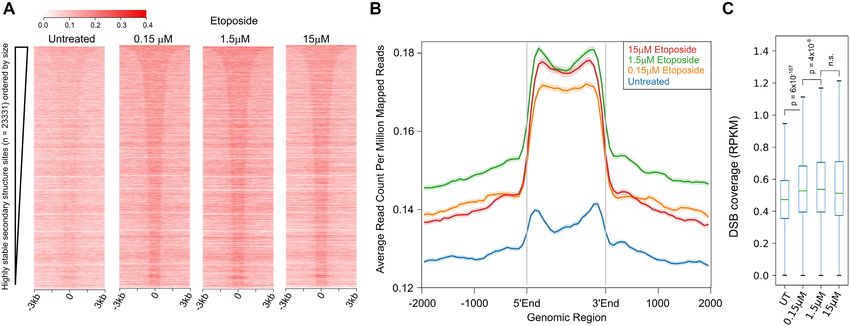
6656 Nucleic Acids Research, 2020, Vol. 48, No. 12

Yeast GCR assay                                                   breaks during purification. Purified genomic DNA was sub-
                                                                  jected to blunting/A-tailing reactions, Illumina P5 adap-
The yeast GCR assay has been used previously (42–44) and
                                                                  tor ligation to capture broken DNA ends, and subse-
is based on the loss of CAN1 and ADE2 genes located on
                                                                  quent reactions as described above. Genome-wide break
chromosome V. ADE2 is placed between CAN1 and the
                                                                  mapping/sequencing data between experiments performed
sequence insertion site to help differentiate between DSB-
                                                                  in nuclei and using purified genomic DNA from GM13069
mediated arm loss coupled with repair of the broken end
                                                                  cells are compared and discussed in the main text (see ‘Re-
and mutations in CAN1. Mutations in CAN1 give rise to
                                                                  sults’).
canavanine-resistant white colonies while GCR isolates re-
sulting from DSBs are canavanine-resistant red colonies.
The spontaneous rate of GCRs in the control strains (with-        Processing of DSB reads
out insert) is low: 3 × 10⁻⁹ /division. Each selected human
                                                                  Sequencing reads were aligned to the human genome
sequence (AT30, chr 9: 129 987 361–129 988 350, 990 bp;
                                                                  (GRCh38/hg38) with bowtie2 (v.2.3.4.1) aligner running in

                                                                                                                                   Downloaded from https://academic.oup.com/nar/article/48/12/6654/5851738 by guest on 08 December 2020
AT54, chr 20: 55 532 105–55 533 500, 1396 bp; AT80, chr
                                                                  high sensitivity mode (- -very-sensitive). Restriction on the
11: 103 024 986–103 026 515, 1530 bp; AT85, chr 6: 61
                                                                  fragment length from 100 nt to 2000 nt (-X 2000 -I 100 op-
954 246–61 955 895, 1650 bp) was PCR amplified with two
                                                                  tions) was imposed. Unmapped, non-primary, supplemen-
sets of hybrid primers containing homology to LYS2. Using
                                                                  tary and low-quality reads were filtered out with SAMtools
delitto perfetto approach (45), human motifs were inserted
                                                                  (v. 1.7) (-F 2820). Further, PCR duplicates were marked
into chromosome V in two different orientations with re-
                                                                  with picard-tools (v. 1.95) MarkDuplicates, and finally, the
spect to the direction of replication. Top2-1 allele was intro-
                                                                  first mate of non-duplicated pairs (-f 67 -F 1024) were fil-
duced into the AT80-containing strains via ‘pop in – pop
                                                                  tered with SAMtools for continued analysis. For each de-
out’ techniques using yIP5 top2-1 plasmid (46). The cells
                                                                  tected break, the most 5 nucleotide of the first mate defined
were grown on YPD at 30◦ C (at semi-permissive tempera-
                                                                  the DNA break position. Sequencing and alignment statis-
ture for the top2-1 strains). The rates and 95% confidence
                                                                  tics for the DSB mapping/sequencing libraries prepared
intervals of the GCRs was estimated in fluctuation tests us-
                                                                  from HeLa, GM13069 and NPC9429 cells are listed in Sup-
ing at least 14 independent cultures.
                                                                  plementary Table S1. Biological duplicates of each sam-
                                                                  ple (N1 and N2, Supplementary Table S1) which showed
Indel analysis using the 10 000 human genome database             very high reproducibility of genomic coverage (Pearson’s
Indels were manually retrieved from the 10 000 human              correlation r ≥ 0.85, P ∼  = 0), are combined for down-
genome database (47). The 2 kb regions contain AT30 (chr          stream data analysis. This strong correlation confirms that
9: 129 986 800–129 988 800), AT54 (chr 20: 55 531 800–55          the break mapping procedure does not introduce signifi-
533 800), AT80 (chr 11: 103 024 750–103 026 750), AT85            cant amounts of random DNA breaks which could convert
(chr 6: 61 954 000–61 956 000) were queried for variations        single-stranded nicks into DSBs.
within 100 bp windows (due to database browser limita-
tions). Next, each variation, except SNPs, were classified as     Processing of Raji ssDNA data
an insertion or a deletion, and the length of the aberration
was calculated based on the sequence. Resulting data were         The publicly available data for Raji ssDNA sequencing
used in further analysis.                                         (SRA072844) (50) was downloaded and aligned to the
                                                                  GRCh38/hg38 genome using bowtie2 (v 2.3.4.1). The pro-
                                                                  cessed data was used to generate heatmaps based on the
Genome-wide break mapping and sequencing
                                                                  23 331 highly stable DNA secondary structure regions
Detection of DNA breaks (DSBCapture) was performed                (described in ‘heatmaps and average plots’), compute fre-
as previously described (48). Briefly, fixed nuclei of HeLa,      quency among the highly stable structure, flanking, and ran-
GM13069 and NPC9429 were subjected to blunting/A-                 dom regions, and generate the bar graph of genomic feature
tailing reactions, and Illumina P5 adaptor ligation to cap-       distribution (described in ‘Genomic region annotation’).
ture broken DNA ends. Genomic DNA was then puri-
fied and fragmented by sonication, and subsequently lig-
                                                                  Processing of RNA-seq data
ated to Illumina P7 adaptor, and the libraries were PCR-
amplified for 15 cycles. Prepared libraries were then sub-        The publicly available data for GM12878 RNA-seq (SRA-
jected to whole-genome, 75-bp and 150-bp paired-end se-           SRR1153470) (51) was downloaded and aligned to the
quencing with the Illumina NextSeq 500 and HiSeq X Ten            GRCh38/hg38 genome using HISAT2 (52) aligner, and
platform, respectively.                                           the gene expression (FPKM values) were quantified using
   DNA break mapping with purified genomic DNA                    StringTie (53). In individual analyses, the expression of the
from GM13069 was described (49). Genomic DNA from                 genes was used to define different numbers of bins for fur-
etoposide-treated and untreated GM13069 cells was puri-           ther analysis.
fied by gently lysing cells in 50 mM Tris–HCl (pH 8.0), 100
mM EDTA, 100 mM NaCl, 1% SDS, 1mg/mL Proteinase
                                                                  Processing of ChIP-seq data
K for 3 h at 55 ◦ C followed by organic extraction purifi-
cation and ethanol precipitation. Precaution such as gentle       The publicly available ChIP-seq data for HeLa
pipetting with wide-opening pipette tips to avoid/minimize        CTCF (ENCSR000AKJ) (54), GM12878 CTCF
shearing DNA was taken to avoid introduction of DNA               (ENCSR000AKB) (54), MCF10A TOP2B (SRR5136803)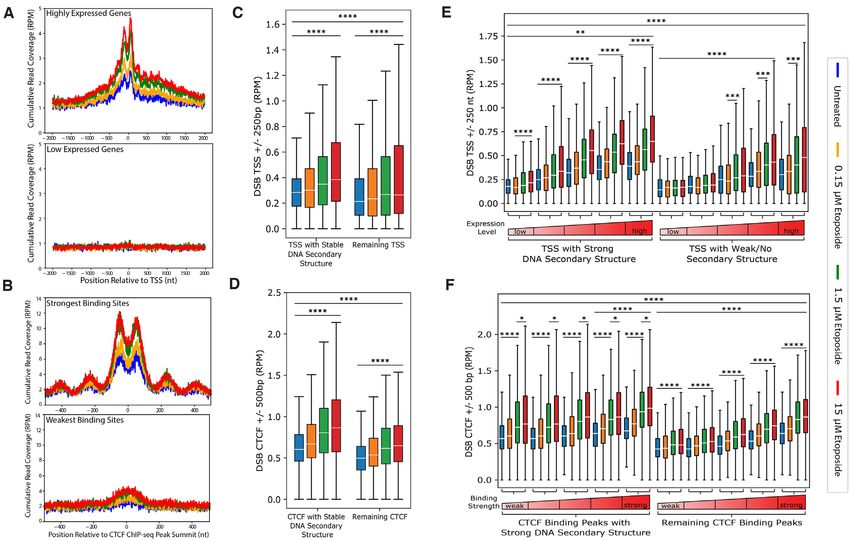
Nucleic Acids Research, 2020, Vol. 48, No. 12 6657

(55), and each associated input data were downloaded              region was then normalized to the size of the genomic re-
and aligned to the GRCh38/hg38 genome using bowtie2               gion in megabases. The GRCh38/hg38 build RefSeq genes
(v 2.3.4.1). Binding peaks were called by the macs2               were downloaded from the UCSC browser. The definitions
(2.1.1.20160309) as described below. In individual analyses       used for each genomic feature is as follows: promoter region
the peak strength as defined by macs2 was used to define          ranging from TSS –1000 nt to –250 nt, TSS region ranging
different numbers of bins for further analyses.                   from TSS −250 to +250 nt, gene body region ranging from
                                                                  TSS +250 nt to TTS −250 nt, and TTS regions ranging from
                                                                  TTS −250 nt to +250 nt. The CTCF annotation used the
Peak calling
                                                                  HeLa CTCF data and defined CTCF regions as the peak
The macs2 (2.1.1.20160309) software tool was used to call         summit −2000 nt to +2000 nt.
peaks. For ChIP-seq data macs2 was run with default set-
tings with each dataset controlled for with the matching in-
                                                                  Single-nucleotide cumulative plots around TSS and CTCF
put data. Peak summits were then used to center the regions

                                                                                                                                 Downloaded from https://academic.oup.com/nar/article/48/12/6654/5851738 by guest on 08 December 2020
of interest in all other analyses.                                To analyze DSBs located at the TSS regions of genes
   For peak calling of GM13069 etoposide-treated samples          with high and low expression levels and at strong and
(PRJNA497476) (49), no input data was used and a no-shift         weak CTCF-binding sites, GM12878 RNA-seq (SRA-
model was employed because the break data is defined by           SRR1153470) and CTCF ChIP-seq (Encode Project
the 5 end of read 1 alone. The total of 18 791 unique break      ENCSR000AKB) was used, because both GM13069 and
peaks were merged for the average plots, heatmaps, and box        GM12878 are non-malignant lymphbloastoid cells. Based
plots.                                                            on the expression value of the genes, the TSS positions of
                                                                  the highest (top 10%) and lowest (bottom 10%) expressed
                                                                  genes were extracted (n = 2542 each). The strongest (top
Heatmaps and average plots
                                                                  10%) and weakest (bottom 10%) CTCF-binding sites were
Heat maps and accompanying average plots were generated           determined based on macs2 score (n = 4019 each) of
using ngs.plot.r (v 2.61). For all heatmaps using the 23 331      CTCF ChIP-seq data. DSB coverage in these regions was
highly stable DNA secondary structure peaks, the reference        determined using BEDtools coverage reporting the depth
bedfile (-E bedfile) was sorted from longest to shortest re-      at each position in the reference regions (-d), and then the
gion, and this order was maintained in the heatmap (-GO           merge function was used to compile each region’s coverage
none). For heatmaps for the etoposide merged peaks (n =           into a single line readable to python3. Using Python3 (v.
18 791), because the region was scaled to the same size for       3.6.5) with matplotlib (v. 2.2.2), numpy (v. 1.15.0) and
all regions, the order for the heatmap was set to be based        pandas (v. 0.23.3), the cumulative single-nucleotide break
on the untreated sample strength of coverage in each region       profiles were plotted over the relative nucleotide position
(-GO total) and the scale was set consistent across all plots     to the TSS or the CTCF ChIP-seq peak summit, and in
(-SC global).                                                     the ±2000 bp flanking regions with read normalization
                                                                  (reads per million, RPM). For TSS plots the direction
                                                                  of transcription (on the positive or negative strand) was
Correlation plots
                                                                  considered to orient the DSB profiles all in the same
The human genome build GRCh38/hg38 was binned into                direction.
100 kb windows using BEDtools makewindows tool. The
coverage in each 100 kb bin was calculated for the bam file
                                                                  Genome track images
of each replicate using BEDtools coverage (n = 30 895). The
read coverage in each bin is normalized to total read num-        Genome track images were made by using igvtools (v.
ber (reads per million, RPM), then the absolute difference        2.3.68) count with the options to have windows of 5 bp and
in coverage in each bin between replicates is calculated, and     precompute only 5 bp (-w 5 -z 5) for the GRCh38/hg38
the top 0.05% most different (outliers) were removed. Bins        build of the human genome. The resulting tdf files were
where both replicates showed zero coverage were removed.          loaded into the IGV browser, with the track normalization
Finally, data was read into python3, read normalized cov-         function checked in the track options to read-normalize the
erage was plotted between the two replicates, and Pearson         data, and break data tracks were set to group auto-scale.
correlation was calculated.                                       Images were then saved out from the current IGV browser
                                                                  view.
Genomic region annotation
                                                                  Analysis of CC-seq data
To assign genomic annotations BEDtools (v. 2.27.1) inter-
sect was used to sequentially assign genomic features with        The CC-seq data from Gittens et al. (15) was downloaded
each read only being assigned to one genomic feature. The         as fastq files from (GSE136943) and then aligned to the
sequential feature assignment filters out reads as they are as-   human genome (build GRCh38/hg38) following the same
signed to a feature. The sequence for checking features was       processing as break data (as detailed above in ‘Processing
TSS, promoter, TTS, gene body, and those not assigned to          of DSB reads’). The combined data from four replicates
any of these features is coded as intergenic. CTCF was sep-       of VP16 (etoposide)-treated WT RPE-1 cells was merged
arately assessed because it overlaps all of the other genomic     into one bam file using samtools merge, and peaks were
features. The number of regions overlapping each genomic          called (as detailed above in ‘Peak calling’) (n = 65 989).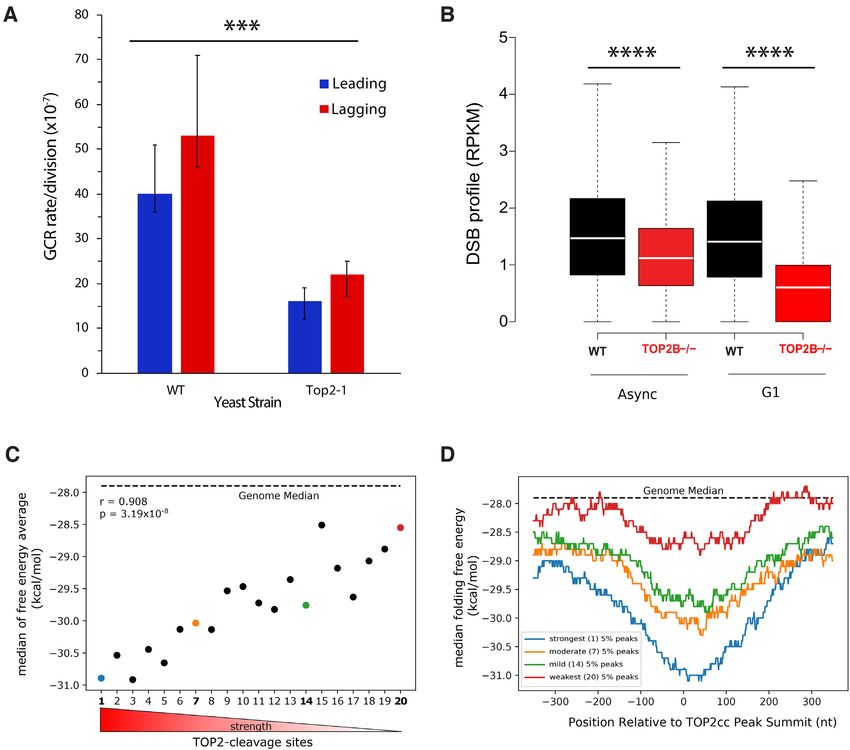
6658 Nucleic Acids Research, 2020, Vol. 48, No. 12

These peaks represent sites across the genome where active         the total size of each class of genomic regions, highly stable
TOP2B enzymatically cleaves the DNA. The matched sets              secondary structure sites are greatly enriched at TSSs (Sup-
of VP16-treated WT and TOP2B−/− RPE-1 cells in both                plementary Figure S1, further discussion below).
asynchronous and G1 arrested cells had replicates merged,             To determine the propensity of these regions to break
respectively, and the coverage from each was calculated in         in the genome, we carried out the genome-wide single nu-
the active TOP2B enzymatic cleavage peaks.                         cleotide resolution break mapping protocol, DSBCapture,
   The ‘strength’ of the TOP2B enzymatic cleavage site             adapted from Lensing et al. (48) (Supplementary Figure
was defined as the difference in coverage between WT and           S2) in three different cell types, human neural progeni-
TOP2B−/− cells (strength = TOP2B−/− - WT), where the               tor cells (NPC) derived from an apparently healthy indi-
strongest sites were those with the most negative values in-       vidual, HeLa, and non-malignant human lymphoblastoid
dicating a more severe loss of activity in the knockdown           cells, GM13069 (Supplementary Table S1). Two biologi-
line. This strength value was used to bin the peaks into 20        cal replicates for each cell type were performed, displayed
groups. For all sites the potential free energy profile was de-    high correlation of genomic coverage (Pearson’s correlation

                                                                                                                                     Downloaded from https://academic.oup.com/nar/article/48/12/6654/5851738 by guest on 08 December 2020
termined in the region ±500 bp around the peak summit us-          r ≥ 0.85, P ∼ = 0, Supplementary Figure S3A), and pooled
ing a 300-nt window with 1-nt steps and the DNA parame-            for analysis. DSB coverage over the 23 331 sites of highly
ters for ViennaRNA. The resulting free energy profiles were        stable DNA secondary structure showed that DNA DSBs
either plotted as average of medians for the entire strength       are enriched at those sites in all three cell types (Figure
bin to plot free energy compared to site strength, or the en-      1B). The DSB enrichment at the stable DNA secondary
tire profile was plotted for four example strength bins.           sites was observed in each replicate as well (Supplementary
                                                                   Figure S3B). Additionally, analyzing previously published
Statistical analysis                                               DSB data (48) of DSBs mapped in normal human epider-
                                                                   mal keratinocytes (NHEK) demonstrated a similar enrich-
Statistical tests were performed using Python3 (v. 3.6.5)          ment of breaks in the highly stable secondary structure sites
with scipy (v. 0.19.1) and R (v. 3.4.3). Specific tests used are   compared to flanking regions (Supplementary Figure S4).
detailed in figure panels and text.                                   To evaluate whether the enrichment of DSBs at the highly
                                                                   stable structure sites (low G intervals) was meaningful,
RESULTS                                                            the DSB coverage at these sites was compared to those at
                                                                   sites generated by random shuffling (random) and to 1 kb
Endogenous DSBs are enriched in the genomic regions pre-
                                                                   regions flanking the highly stable structure sites (flanking).
dicted to form highly stable DNA secondary structures
                                                                   In all three cell types examined, DSB coverage is signifi-
To directly evaluate whether DNA fragility correlates with         cantly higher within the highly stable secondary structure
the propensity to form highly stable DNA secondary struc-          sites than within the two control groups (P ∼  = 0, one sided
ture, we identified endogenous genome-wide DSBs at sin-            Mann-Whitney U test) (Supplementary Figure S5). These
gle nucleotide resolution and mapped these breaks to the           results suggest that genomic regions with a high potential
genomic regions predicted to form highly stable secondary          to form stable DNA secondary structure are more prone
structure. Using DNA secondary structure calculation pro-          to DNA breakage compared to both random and flank-
grams, we have provided an energetic potential for sec-            ing sequences. Furthermore, the similarity in DSB enrich-
ondary structure formation across the human genome                 ment across the tested cell types at these sites of highly sta-
(build GRCh37/hg19) (8). Here, we applied the same anal-           ble secondary structure argues for a contribution of DNA
ysis (ViennaRNA programs with parameters for analyzing             secondary structure in the promotion of DNA fragility ir-
DNA (40), to the available sequence in the genome assem-           respective of cell specificity.
bly GRCh38/hg38 (Figure 1A). Sliding windows of 300-nt
with a 150-nt step were used across the GRC38/hg38 assem-
                                                                   DNA secondary structures experimentally identified in hu-
bly, and energetic potential (as G) was assigned to each
                                                                   man cells validate computational structure prediction
300-nt segment. A total of 19 490 090 segments were an-
alyzed, and the average G of DNA secondary structure              Genome-wide non-B DNA secondary structures have been
formation was –30.1 ± 11.8 kcal/mol. Based on previous             recently, experimentally determined in Raji cells, a human
studies of the DNA secondary structures known to interfere         lymphoblastoid cell line, using the combination of perman-
with cellular processes (7,56), the highly stable DNA sec-         ganate footprinting, high-throughput sequencing, and the
ondary structure site was defined as having seven or more          sequence motifs of non-B DNA (50). This method utilized
consecutive segments with a G value within the top 5%             the ability of permanganate to modify exposed DNA bases
most stable secondary structure potential (G below –51.3          and prevents the re-annealing of these modified bases. The
kcal/mol). Using this threshold, 23 331 sites that are pre-        inability of the exposed and modified bases to re-anneal
dicted to form highly stable DNA secondary structures were         then made the sites vulnerable to mung-bean nuclease di-
identified with sizes ranging from a minimum of 1200 nt            gestion to generate DNA breaks which allowed for the cap-
up to over 20 000 nt in length (ordered by size in Figure          ture and high-throughput sequencing of these sites (57).
1B, the leftmost panel). These sites consist of ∼1.5% of the       The comparison of these sequenced regions to known non-
genome, indicating the stringency of the threshold that we         B DNA secondary structure motifs determined that these
used. Among these sites, 6086 are found overlapping with           single-stranded regions were enriched for motifs of non-
a TSS ± 250 nt, and 9960 and 5765 sites exist in gene bod-         B DNA secondary structures (50). Therefore, to examine
ies and intergenic regions, respectively. When normalized to       whether non-B DNA structures detected in cells are present
Nucleic Acids Research, 2020, Vol. 48, No. 12 6659
Downloaded from https://academic.oup.com/nar/article/48/12/6654/5851738 by guest on 08 December 2020
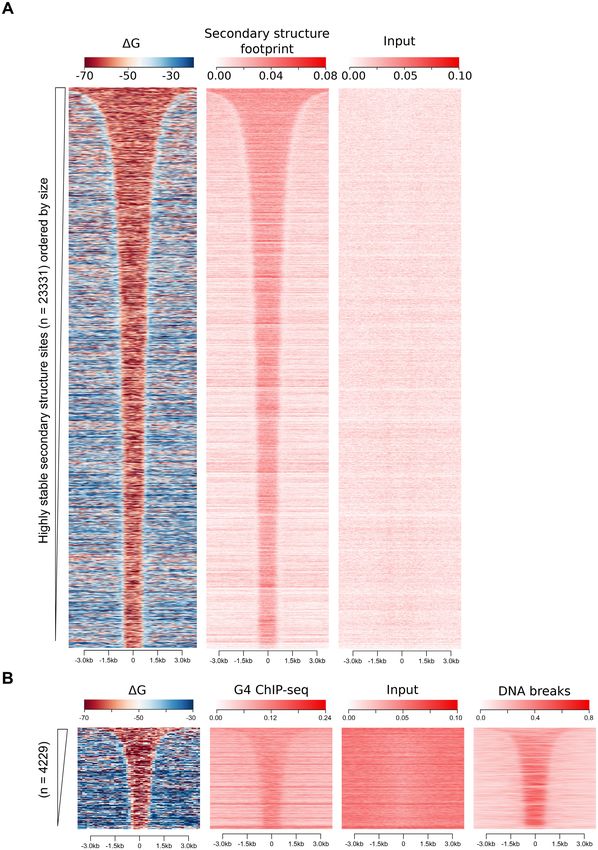
Figure 1. Highly stable DNA secondary structures (low folding G) correlates with elevated DSBs. (A) A schematic depicting how highly stable DNA
secondary structure sites were selected. DNA secondary structure folding G of the human genome (GRCh38/hg38) was calculated in 300-nt windows
with a 150-nt step, represented by the 300-nt bars across the top. Regions with at least seven consecutive segments having folding Gs in the top 5% most
stable structures predicted across the genome (5% threshold indicated by the red dashed line) were defined as highly stable DNA secondary structures (low
G intervals, shown in red). Dots indicate the center of each 300-nt segment to which the calculated G is attributed. (B) Heatmap representations of
folding Gs (left panel) and DSB coverage in three cell lines, human neural progenitor cells (NPC), HeLa and non-malignant human lymphoblastoid cells,
GM13069, are shown in the 6 kb regions centered on the highly stable DNA secondary structure intervals (ordered by size) as defined in panel A. Heatmap
of highly stable secondary structure interval folding Gs (left panel) represents the potential folding energy of each 300-nt segment (as shown in panel A)
within the interval (ranging from 1200 to 20 000 nt in size) and the flanking region for the 23 331 identified regions. DSB coverage heatmaps presents the
read coverage across the stable secondary structure intervals and associated flanking regions.6660 Nucleic Acids Research, 2020, Vol. 48, No. 12
in the regions predicted to form highly stable secondary kcal/mole (similar to the average G of the human genome,
structures, we compared our computationally identified –30.1 ± 11.8 kcal/mol (standard deviation, SD)), AT54
highly stable secondary structure regions with the genome- with –53.84 kcal/mol (similar to the average plus 2 SDs),
wide measurement of non-B DNA secondary structures in AT80 with –80.29 kcal/mol (as the average plus 4 SDs), and
Raji cells. We found that the secondary structures detected AT85 with –85.32 kcal/mol (Supplementary Table S2), with
in Raji cells are preferentially enriched in these regions (Fig- the length ranging from 990 to 1650 bp. These four AT-rich
ure 2A), and the predicted regions of highly stable sec- sequences were named in a manner that the numbers in their
ondary structure contain significantly more detectable non- name represent their negative G values. The AT-rich char-
B form structures than the randomly shuffled regions and acteristic of the fragments was chosen to emphasize the abil-
the adjacent regions (P ∼ = 0, one-sided Mann–Whitney U ity to fold DNA secondary structure, rather than high GC
test) (Supplementary Figure S6). Altogether, this demon- content which can potentially form multiple kinds of non-
strates that stable DNA secondary structures are present B DNA structures. To experimentally validate the poten-
in human cells, and their locations validate our computa- tial to form secondary structure, AT30 and AT85 fragments
Downloaded from https://academic.oup.com/nar/article/48/12/6654/5851738 by guest on 08 December 2020
tional structure predictions. Combined with the observa- were generated and subjected to re-duplexing assays to ex-
tion in Figure 1B, we found an overall correlation among amine the propensity to form stem–loop structures. This in
the secondary structure footprints, the predicted low G in- vitro re-duplexing assay, which allows re-annealing of the
tervals, and the DSB profile, with an example of a genomic single-stranded DNA at low concentrations following de-
region shown in Supplementary Figure S7. naturation, has been used to analyze the formation of DNA
To further validate the computationally-identified highly secondary structures generated by a variety of sequences
stable secondary structure regions for structure-forming ca- (7,59–61). Upon separation on native polyacrylamide gels,
pacity in cells, the presence of G-quadruplex structures in the re-duplexed AT85 displays more slow-migrating prod-
human cells was assessed. The existence of G-quadruplexes ucts compared to AT30, indicating AT85 has a greater ten-
(G4), a subtype of non-B DNA secondary structures, has dency than AT30 to form stable secondary structures under
already been experimentally demonstrated in NHEK cells, single-stranded conditions (Supplemental Figure S9A). The
using an antibody specific to G4 structures followed by Il- major parameter contributing to the stability of secondary
lumina DNA sequencing (58). The ViennaRNA program structure folded from a single-stranded DNA is the extent
(with thermodynamic parameters for DNA analysis) that of base-paired regions within each structure. Next, the re-
we used for secondary DNA structure prediction can cal- duplexed AT30 and AT85 were digested with mung bean
culate the potential formation of G4 in addition to stem- nuclease (degrading single-stranded regions) to examine the
loop structures. Therefore, we calculated the coverage of distribution of base paired regions. The structural probing
predicted highly stable secondary structure at the experi- experiments demonstrated that indeed AT85 contains more
mentally detected G4 regions, and identified 4229 intersect- stems and longer stem lengths than AT30 (Supplemental
ing regions genome-wide that are prone to form G4 struc- Figure S9B), again validating the secondary structure pre-
ture. We then analyzed the relationship of the computed sec- diction that AT85 is more favorable to form stable DNA sec-
ondary structures including G4 (G), and both G4 ChIP- ondary structure under single-stranded state. In addition,
seq reads and DNA breaks detected in NHEK cells (Figure examination of all four AT-rich sequence regions for sec-
2B). We found that the distribution of G4 structures cor- ondary structure footprinting reads in Raji cells suggests
responds with the computed structure, indicating the pres- that DNA secondary structure can form at these sequences
ence of G4 structures at the predicted sites, thereby adding in cells.
another validation of the computational secondary struc- Because of the similarity in DSB enrichment across cell
ture predictions. More importantly, the DSB coverage pro- types (Figure 1B and Supplementary Figures S3 and S4),
file shows the enrichment of DSB at the 4229 predicted we next examine the structure-driven fragility of these four
secondary structure sites containing the experimentally de- AT-rich sequences in yeast to further exclude any cell type
tected G4 structure. specific effects. Using the gross chromosomal rearrange-
These two experimental structural analyses provide direct ment (GCR) assay in yeast (42–44), these four human DNA
evidence for the existence of non-B form DNA secondary fragments were integrated into a LYS2 cassette on chro-
structures in human cells at computationally predicted loci, mosome V of the yeast genome (Figure 3A). In this as-
and more importantly, support the presence of DNA sec- say, canavanine-resistant red colonies (CanR Ade− ) occur
ondary structures at DSB sites, strongly suggesting the in- due to DSBs in the LYS2 region and repair of the broken
volvement of non-B form DNA secondary structure in DSB chromosome. Therefore, the GCR rates reflect the break
generation. frequency of the inserted DNA. All four human DNA se-
quences showed an increase in the GCR rates compared to
the background (no insert). This induction of GCRs is pro-
Regions of highly stable secondary structure induce fragility
portional to increasing secondary structure-forming abil-
in yeast and display instability in the human genome
ity (G decreasing) (Figure 3B), with the AT85 sequence
To determine the fragility and instability of non-B DNA showing the highest GCR rate (>15 000-fold) (Supplemen-
secondary structure-forming sequences, we selected se- tary Table S2). This demonstrates that DNA fragility, mea-
quences to test more directly. Four AT-rich (∼65% AT- sured by the GCR rate in yeast, reflects the ability of these
content) human DNA fragments with distinct potential human sequences to form stable DNA secondary structure.
secondary structure folding Gs (Supplementary Figure Each human sequence was inserted into the chromosome
S8) were selected: AT30 with an average G of –29.97 V arm in two orientations relative to the replication ori-Nucleic Acids Research, 2020, Vol. 48, No. 12 6661
Downloaded from https://academic.oup.com/nar/article/48/12/6654/5851738 by guest on 08 December 2020
Figure 2. Stable DNA secondary structures detected in human cells are preferentially enriched in the region with computed highly stable DNA secondary
structures. (A) Heatmap profiles of DNA secondary structure footprint coverage in Raji cells (middle panel) are shown over the regions of highly stable
DNA secondary structures (low G intervals, as defined in Figure 1A) (left panel). The input data from the secondary structure footprint study in Raji
cells is also included (right panel). (B) Heatmap representation of G4 ChIP-seq (58) and DSB break (48) coverage in NHEK cells over the low G intervals
that contain G4 ChIP-seq peaks.6662 Nucleic Acids Research, 2020, Vol. 48, No. 12
Downloaded from https://academic.oup.com/nar/article/48/12/6654/5851738 by guest on 08 December 2020
Figure 3. Secondary structure-rich human sequences are prone to DSBs in yeast. (A) Schematic representation of the GCR assay, based on the loss of
CAN1 and ADE2 genes located on chromosome V. Four human DNA sequences (AT30, AT54, AT80 and AT85) with distinct secondary structure folding
Gs (Supplementary Table S2 and Supplementary Figure S8) were inserted into the LYS2 gene with two orientations relative to the ARS 507 replication
origin. (B) DSB detection by GCR assay shows that DSBs proportionally increase as the ability to form secondary structure increases (G decreases) in
these four AT-rich human sequences. Both GCR rates and fold increases over the background (no insert) of all sequences are listed in Supplementary Table
S2.
gin ARS 507, and this design places the positive strand of respectively) than those found in the 2 kb region of AT30
the human sequence in either leading or lagging strand dur- and AT54 (20 and 96, respectively). Additionally, the size
ing replication from ARS507. Each sequence regardless of of indels are larger in AT80 and AT85 (both have a median
the strand location during DNA replication shows simi- indel size of 41 bp) when compared to those in AT30 and
lar GCR rates, possibly because the positive and negative AT54 (median indel size 1 and 4 bp, respectively) (Figure
strands of each sequence have very similar average Gs 4A). To account for the abundance of variants, the num-
(the ability to fold secondary structure). The LYS2 gene, ber of occurrences of each indel variant, by genomic coor-
in which the sequences were inserted, has an active pro- dinate, is plotted in 50-bp bins, and the total number of in-
moter, and therefore GCR events could occur from DNA del occurrences in the 10 000 genomes cohort is higher in
secondary structure formation during transcription of the AT80 and AT85 than AT30 and AT54 (Figure 4B). AT30
LYS2 gene. which has an average folding G at a level of the genome
We next examined whether the instability observed in the average has few variants. AT54 has more indels than AT30
yeast genome among these four sequences correlates with in types, sizes, and total numbers, but they are not of the
genetic variations in the flanking regions for these motifs same extent as in AT80 and AT85. In AT80 and AT85, vari-
in the human population. Using the 10 000 human genome ants are clustered within regions of very stable DNA sec-
database (47), we identified sequence variants within the 2 ondary structure. These results indicate that sequences that
kb regions containing AT30, AT54, AT80, and AT85 se- are break-prone in yeast and have potential to form stable
quences for the presence of insertions and deletions (indels) DNA secondary structures (AT80 and AT85) display ge-
and excluding point mutations. The 2 kb region containing netic polymorphism with more types and numbers of indels
AT80 and AT85 has a greater variety of indels (466 and 529, and larger sizes of these indels, compared to less-structuredNucleic Acids Research, 2020, Vol. 48, No. 12 6663
Downloaded from https://academic.oup.com/nar/article/48/12/6654/5851738 by guest on 08 December 2020
Figure 4. Analysis of indels retrieved from the 10 000 human genomes database (47) shows that the break-prone regions with stable secondary structure
(AT80 and AT85) cluster with more and larger indels than less structured low-break regions (AT30 and AT54). (A) Location and length of unique insertions
and deletions observed in healthy humans are shown within the 2 kb regions containing AT30, AT54, AT80 and AT85 sequences, from top to bottom
respectively. (B) Occurrence of each insertion and deletion from the 10 000 genomes cohort shown in panel A are presented in 50-bp bins across the 2 kb
regions. Indel frequencies ranged from 0.1% to 47% of the 10 000 genomes cohort. The AT30, AT54, AT80 and AT85 sequences are indicated within each
2 kb region (grey horizontal bars).
regions of lower breakage with a similar AT-content, sug- ture sites are enriched at transcription start sites (TSSs) and
gesting a possible impact of structure-driven fragility in the CTCF-binding sites based on the computational prediction
human genome. (Supplementary Figure S1) (8) and experimental probing
data in Raji cells (Supplementary Figure S10) (50). TSS and
TOP2 contributes to DSBs at DNA secondary structure-rich CTCF-binding sites are two major TOP2 activity sites, and
regions are known to accumulate DNA supercoiling, which invites
TOP2 activity. To test whether TOP2 contributes to the gen-
We next investigated which processes/proteins are involved eration of DSBs at these sites, GM13069 cells were treated
in the generation of DNA secondary structure-mediated with increasing concentrations of etoposide, an inhibitor
DNA breaks. DNA secondary structure formation is preva- of the ligation activity of TOP2, and DSBs were measured
lent throughout the human genome, and highly stable struc- and compared to DSBs of untreated cells (49). To lower the6664 Nucleic Acids Research, 2020, Vol. 48, No. 12
necessary starting materials, here the mapping/sequencing In Figure 5 A and B (top panels), we noticed endoge-
experiments were performed using purified genomic DNA nous DSBs in untreated cells also showed an enrichment
with precautionary steps to minimize the introduction of at both TSSs and CTCF-binding sites compared to the ad-
DNA breaks (49). The reproducibility of the mapped break jacent gene regions and displayed a similar DSB distribu-
data between using purified genomic DNA and DSBCap- tion pattern as for etoposide-induced samples. Therefore,
ture in nuclei in untreated GM13069 samples was highly we next examined the endogenous DSBs and its relation-
correlated (Pearson’s correlation r = 0.98, P ∼ = 0; Supple- ship to TOP2. We found that DSBs tend to occur in clusters,
mentary Figure S11). with the number of identified break cluster peaks increas-
We then analyzed the differences in DSB frequency be- ing upon etoposide treatment (214, 618, 9,097 and 14,961
tween treatments across all TSSs and CTCF binding sites, break peaks, respectively, for untreated, 0.15, 1.5 and 15 M
each in ten bins based on expression level and CTCF bind- of etoposide) (Supplementary Figure S14A). Interestingly,
ing strength, respectively (Supplementary Figure S12). A there is a substantial overlap among the peaks identified
clear, strong relationship between DSB frequency and both across treatments, specifically higher etoposide concentra-
Downloaded from https://academic.oup.com/nar/article/48/12/6654/5851738 by guest on 08 December 2020
expression level and binding strength is observed, and the tion peaks overlap with peaks from low etoposide and un-
increasing etoposide-induced breaks are most apparent at treated samples. Within the total 18 791 unique break peaks
stronger CTCF binding sites and higher expressing TSSs. merged from all treatments, DSB coverage in these peaks
The distribution of DSB around these sites revealed that increases with increasing inhibition of TOP2 re-ligation ac-
TSSs of highly expressed genes and peaks of strong CTCF- tivity (Supplementary Figure S14B and C). Additionally,
binding sites display a DSB enrichment over the back- heatmaps of DSB coverage over these peaks (Supplemen-
ground of untreated cells, and the DNA break increase cor- tary Figure S14C) also reveal that in untreated cells, a snap-
responds to the increased concentrations of etoposide (Fig- shot of endogenous breaks was captured, and etoposide
ure 5A and B, top panels). In contrast, neither the DSB traps these breaks as the concentration increases.
enrichment nor the increasing etoposide-induced breaks To explore the possibility that TOP2 contributes to DNA
were observed at the TSS regions of low expressed genes or secondary structure-mediated DSBs, the ability of these
among weak CTCF-binding sites (Figure 5A and B, bottom break peaks to form DNA secondary structures was ana-
panels). lyzed, and indeed, the TOP2 break peak regions have sig-
To directly assess the relationship between DNA sec- nificantly greater potential (lower G) to form stable DNA
ondary structure and DSBs at these regions, we divided all secondary structure than the rest of the genome (P ∼ = 0,
TSSs and CTCF binding sites into those that were overlap- one sided Mann–Whitney U test) (Supplementary Figure
ping our 23 331 highly stable DNA secondary structure re- S14D). We then asked whether the 23 331 highly stable
gions, and those in the remaining regions. We found that DNA secondary structure sites (Figure 1B, the leftmost
the TSS and CTCF regions overlapping the highly stable panel) are enriched with TOP2-mediated DSBs. DSB cover-
regions were significantly more enriched with DSBs and age across these stable secondary structure regions showed
maintained the strong increase in breaks upon etoposide that etoposide treatment increased DSBs as compared to
treatment compared to those not found in the strong DNA untreated, and the intensity of DSBs significantly increases
structure regions (Figure 5C and D, p ∼ = 0 Kruskal–Wallis with increasing etoposide concentrations (Figure 6), indi-
with Benjamini–Hochberg corrected Dunn test). Further- cating that TOP2-mediated DSBs preferentially present at
more, when TSSs and CTCF binding sites in the highly sta- highly stable DNA secondary structure regions.
ble secondary structure and the remaining region groups To assess the direct role of TOP2 in genomic fragility, we
were binned by either expression level or CTCF binding first revisited the yeast GCR assay with one of the previ-
strength, respectively, we found that the strongest response ously tested AT-rich sequences, AT80, and introduced the
of etoposide-induced breaks in accordance with expression temperature sensitive top2-1 allele, which has significantly
and binding strength is within the strong secondary struc- reduced enzyme activity (46) (Supplementary Table S2).
ture group (Figure 5E and F). The remaining or no sec- The top2-1 strain with the AT80 fragment in both the lead-
ondary structure groups in TSS and CTCF still do have ing and lagging position has a significantly lower GCR rate
a response to both etoposide and expression or binding compared to the wild-type strain (Figure 7A, P < 0.01,
stength with respect to DSBs, but no to the same extent unpaired t-test), further indicating that TOP2 contributes
as those in strong secondary structure groups. These re- to the genomic fragility of these non-B DNA secondary
sults suggest that genomic regions enriched with DNA sec- structure sequences, independent of cell type. Next, we ex-
ondary structures (such as TSS and CTCF) could gener- amined the effect of TOP2B knockout in the generation
ate DSBs by the action of TOP2, which can be stimulated of DNA breaks in human cells using the recent CC-seq
by both gene expression levels and CTCF binding strength. data in RPE-1 cells by Gittens et al. (15), that maps TOP2
One such example is the intron10/exon 11 junction of the cleavage complex-associated DSBs at single-nucleotide res-
KMT2A gene known to form a multiple stem-loop structure olution. We first identified DSB peaks from wild-type cells
(62) and to contain rearrangement breakpoints in therapy- treated with etoposide, to indicate genomic regions targeted
related leukemia patients with exposure to TOP2 inhibitors by TOP2 activity (n = 65 989). Then we evaluated the
(63,64). We found that this region displays preferential DSB etoposide-induced DSBs of paired wild-type and TOP2B
in untreated cells and increased DSB frequency with in- knockout (TOP2B−/− ) cells in both asynchronous and G1
creasing etoposide treatment (Supplementary Figure S13), arrested states at the identified peak regions. The DSB pro-
supporting the contribution of TOP2 in DNA breakage at file reveals that in both asynchronous and G1 states there is
a DNA secondary structure-rich region. a significantly lower break frequency in the TOP2B−/− cellsNucleic Acids Research, 2020, Vol. 48, No. 12 6665
Downloaded from https://academic.oup.com/nar/article/48/12/6654/5851738 by guest on 08 December 2020
Figure 5. Etoposide induces DSBs at TSSs and at CTCF-binding sites, and those sites with stable DNA secondary structures are more prominent with
etoposide-induced DSBs than sites of weak/no secondary structures. Cumulative, read normalized, single nucleotide resolution profiles of DSBs over TSS
(A, top panel, the top 10% highly expressed genes, n = 2542; bottom panel, the 10% least expressed genes, n = 2542) and CTCF-binding sites (B, top
panel, the top 10% strongest binding sites, n = 4019; bottom panel, the 10% weakest binding sites, n = 4019), present an enrichment over background in
untreated cells, and the enrichment increases with increased concentrations of etoposide. (C) DSBs at TSS ±250 bp (RPM, reads per million) are compared
between TSSs intersecting with the 23 331 highly stable DNA secondary structure regions (n = 7350, ‘TSS with Stable DNA Secondary Structure’) and
those outside these regions (n = 18 067, ‘Remaining TSS’). (D) DSBs at CTCF ± 500 bp (RPM) are compared between CTCF sites overlapping the 23
331 highly stable DNA secondary structure regions (n = 4127, ‘CTCF with Stable DNA Secondary Structure’) and those outside these regions (n = 36
062, ‘Remaining CTCF’). (E) The TSS regions belonging to the highly stable and the weak DNA secondary structure groups respectively, were further
binned into five groups based on the gene expression level of all genes. (F) The CTCF regions belonging to the highly stable and the weak DNA secondary
structure groups respectively, were further binned into five groups based on their CTCF binding strength determined by the strength of all ChIP-seq peaks.
Boxes denote 25th and 75th percentiles, middle bar shows median, whiskers span from 5% to 95%, and outliers are not shown. * P < 0.025; ** P < 0.02;
*** P < 0.01; **** P ∼ = 0, Kruskal–Wallis followed by Dunn Test post-hoc with Benjamini–Hochberg correction.
compared to the wild-type cells at these regions (Figure 7B, DNA secondary structure propensity was calculated and re-
P∼ = 0, two-sided Wilcoxon signed-rank test), demonstrat- vealed that stronger TOP2 activity correlates with more sta-
ing that TOP2 is involved in generating these breaks. In- ble DNA secondary structure formation (Figure 7C, Pear-
terestingly, the DSB reduction by knocking out TOP2B is son’s correlation r = 0.908, P = 3.19 × 10⁻⁸ ). Furthermore,
more prominent in G1 cells versus in asynchronous cells, in- we evaluated the folding energy profiles around the TOP2
dicating TOP2B is a major contributor to generate cleavage activity peaks for four of the twenty groups, representing
complex-associated DSBs (TOP2B, the main TOP2 in G1), the strongest, weakest, and two intermediate strength bins.
and in asynchronous cells TOP2A can compensate the ac- Comparing the median free energy of folding between these
tion of TOP2B when it is knocked out. In addition, we also four sets of peaks again indicates that the most sensitive
examined TOP2 cleavage complex-associated DSBs in the regions to TOP2 activity have a more favorable secondary
untreated G1-arrested wild-type and TOP2B−/− cells, and structure-forming potential and that the most stable DNA
similarly saw a significant decrease with the TOP2B knock- secondary structures occur at cleavage complex-associated
out (Supplementary Figure S15, P ∼ = 0, two-sided Wilcoxon break summits, as indicated by the free energy minima cen-
signed-rank test). tered at the peak summits (Figure 7D). Interestingly, all
To understand the structure forming propensity of these regions assessed have median free energies lower than the
TOP2 activity peaks, we separated the 65 989 peaks into genome-wide median. Finally, we compared the CC-seq
twenty groups (n = 3283 per group) based on the strength captured, TOP2-activity breaks to TOP2B ChIP-seq peaks
of TOP2 activity at the peak defined as the difference in (55) to evaluate the overlap of TOP2 binding and cleavage
breaks between the wild-type and knockout cells. Then activity. We observed that there is a sharp, defined peak of6666 Nucleic Acids Research, 2020, Vol. 48, No. 12
Downloaded from https://academic.oup.com/nar/article/48/12/6654/5851738 by guest on 08 December 2020
Figure 6. Etoposide-induced DSBs are enriched at the highly stable DNA secondary structure regions (low G intervals). (A) Heatmaps demonstrate
DSB coverage at the highly stable secondary structure regions ordered by size as the leftmost panels in Figures 1B and 2A. (B) Mean coverage of DSBs at
the stable structure regions ±2 kb of flanking region as presented in the heatmaps in panel A. Highly stable secondary structure regions are scaled to the
same size and are represented as 5 to 3 end of each individual region. (C) Box plot representation of DSB density at the highly stable DNA secondary
structure regions (low G intervals) (RPKM, reads per kilobase million). DSB intensity is significantly increased with increasing etoposide concentration
(one sided Mann–Whitney U test).
TOP2 CC-seq signal at the summits of TOP2B ChIP-seq The DNA secondary structure prediction program that
peaks (Supplementary Figure S16). Furthermore, in con- we employed can compute the formation of hairpin, G4,
cordance with the strong peak of TOP2 cleavage activity, and multiple stem-loop structures. In addition to identify-
these TOP2B peak summits also have a greater likelihood ing genomic regions with the potential to form DNA sec-
to form stable DNA secondary structures, indicated by the ondary structures from single-stranded DNA, the strength
strong minima for folding energy at these peaks (Supple- of this analysis is to estimate the relative propensity for these
mentary Figures S16). Overall, these results demonstrate regions to actually form such structures. This allows us to
that the regions that are particularly prone to TOP2 bind- discover and rank regions based on the structure-forming
ing and cleavage are those that are also most likely to form potential which might be overlooked when relying only on
highly stable DNA secondary structures, suggesting a likely the primary sequences of the region. Studies of multiple
role for TOP2 cleavage activity at these secondary structure stem-loop structures have been limited to DNA sequences
forming regions. at specific known loci such as fragile sites (5,6). The abun-
dance of these break-prone structure-rich regions observed
in our studies suggests DNA secondary structure-mediated
DISCUSSION
DSBs as a common mechanism for DNA fragility.
Our genome-wide, non-biased study demonstrated endoge- Alternative DNA secondary structures have been
nous DNA breaks enriched at regions forming highly sta- mapped to breakpoint regions of disease-causing chromo-
ble DNA secondary structure, and a set of break-prone somal rearrangement in human. The palindromic AT-rich
structure-rich regions are conserved across different cell repeats which form multiple stem-loop structures are
types, supporting a structure-driven mechanism for DNA present at translocations t(11;22) in parents of Emmanuel
fragility. The yeast GCR assay and the indel analysis of syndrome children (65) and t(3;8) translocation found in
a human population both showed that the ability of a re- renal cell carcinoma (66). Polypurine or polypyrimidine
gion to form alternative DNA secondary structure is posi- sequences with mirror repeat symmetry can form intra-
tively related with an increase in fragility/instability of the molecular triplex known as H-DNA, which is shown to
region. The observation of enrichment of alternative DNA be overrepresented in chromosomal translocation break-
secondary structure at TSS regions and CTCF-binding sites points in human cancer (67). Enrichment of DSBs at the
reveals the contribution of TOP2 to the endogenous breaks highly stable DNA secondary structure regions shown in
at these genomic feature regions. Etoposide-induced break our study provide direct support that alternative DNA
sites have a higher potential to form alternative DNA sec- structure can contribute to the generation of chromosomal
ondary structure than the rest of the genome and highly sta- rearrangements.
ble secondary structure sites are enriched with increasing DNA breaks mediated by DNA secondary structure have
etoposide-induced breaks. Finally, top2-1 yeast GCR as- been indirectly observed during DNA replication, tran-
says and analysis of the TOP2 cleavage complex-associated scription, and DNA repair. Multiple stem-loop structures
DSBs demonstrates that TOP2 has a direct role in the at fragile site regions have been shown to stall replication
fragility at regions of highly stable DNA secondary struc- fork progress, which causes fork collapse and/or fork rever-
tures. sal, and both could lead to DNA breaks (60,68). SeveralYou can also read