DNA methylation epitypes highlight underlying developmental and disease pathways in acute myeloid leukemia - OPUS
←
→
Page content transcription
If your browser does not render page correctly, please read the page content below
Downloaded from genome.cshlp.org on May 9, 2021 - Published by Cold Spring Harbor Laboratory Press

Research

DNA methylation epitypes highlight
underlying developmental and disease pathways
in acute myeloid leukemia
Brian Giacopelli,1,2 Min Wang,3 Ada Cleary,1,2 Yue-Zhong Wu,1,2 Anna Reister Schultz,4
Maximilian Schmutz,5 James S. Blachly,1,2,3 Ann-Kathrin Eisfeld,1,2
Bethany Mundy-Bosse,1,2 Sebastian Vosberg,6,7 Philipp A. Greif,6,8,9 Rainer Claus,10
Lars Bullinger,11 Ramiro Garzon,1,2 Kevin R. Coombes,3 Clara D. Bloomfield,1,2
Brian J. Druker,4 Jeffrey W. Tyner,4 John C. Byrd,1,2 and Christopher C. Oakes1,2,3
1
 Division of Hematology, Department of Internal Medicine, The Ohio State University, Columbus, Ohio 43210, USA; 2The Ohio State
University Comprehensive Cancer Center, Columbus, Ohio 43210, USA; 3Department of Biomedical Informatics, The Ohio State
University, Columbus, Ohio 43210, USA; 4Knight Cancer Institute, Oregon Health and Science University, Portland, Oregon 97239,
USA; 5Hematology and Oncology, Medical Faculty, University of Augsburg, 86159 Augsburg, Germany; 6Department of Medicine III,
University Hospital, LMU Munich, 80539 Munich, Germany; 7Institute of Computational Biology, Helmholtz Zentrum München–
German Research Center for Environmental Health, 85764 Munich, Germany; 8German Cancer Consortium (DKTK), Partner Site
Munich, 69120 Heidelberg, Germany; 9German Cancer Research Center (DKFZ), 69120 Heidelberg, Germany; 10Department of
Medicine II, Stem Cell Transplantation Unit, Klinikum Augsburg, Ludwig-Maximilians University Munich, 86156 Munich, Germany;
11
   Department of Hematology, Oncology and Tumorimmunology, Charité–Universitätsmedizin, 13353 Berlin, Germany

        Acute myeloid leukemia (AML) is a molecularly complex disease characterized by heterogeneous tumor genetic profiles
        and involving numerous pathogenic mechanisms and pathways. Integration of molecular data types across multiple patient
        cohorts may advance current genetic approaches for improved subclassification and understanding of the biology of the
        disease. Here, we analyzed genome-wide DNA methylation in 649 AML patients using Illumina arrays and identified a con-
        figuration of 13 subtypes (termed “epitypes”) using unbiased clustering. Integration of genetic data revealed that most epi-
        types were associated with a certain recurrent mutation (or combination) in a majority of patients, yet other epitypes were
        largely independent. Epitypes showed developmental blockage at discrete stages of myeloid differentiation, revealing epi-
        types that retain arrested hematopoietic stem-cell-like phenotypes. Detailed analyses of DNA methylation patterns identi-
        fied unique patterns of aberrant hyper- and hypomethylation among epitypes, with variable involvement of transcription
        factors influencing promoter, enhancer, and repressed regions. Patients in epitypes with stem-cell-like methylation features
        showed inferior overall survival along with up-regulated stem cell gene expression signatures. We further identified a DNA
        methylation signature involving STAT motifs associated with FLT3-ITD mutations. Finally, DNA methylation signatures
        were stable at relapse for the large majority of patients, and rare epitype switching accompanied loss of the dominant epi-
        type mutations and reversion to stem-cell-like methylation patterns. These results show that DNA methylation-based
        classification integrates important molecular features of AML to reveal the diverse pathogenic and biological aspects of
        the disease.
        [Supplemental material is available for this article.]

Acute myeloid leukemia (AML) is a clinically and molecularly het-                   markers do not completely explain the range of phenotypes ob-
erogeneous disease. Recurrent genetic aberrations, such as chro-                    served in tumor cells and disease outcomes.
mosomal rearrangements and gene mutations, primarily form                                Efforts have been made to classify AML based on the pheno-
the basis of our current understanding of pathogenesis and are                      type rather than the genotype in the form of morphology or gene
used for patient classification (Lowenberg et al. 1999; Döhner                      expression (Bennett et al. 1982; Mrózek et al. 2009; Ng et al. 2016).
et al. 2010, 2017; The Cancer Genome Atlas Research Network                         AML arises from cells developing from hematopoietic stem and
2013). AML has a low level of genetic aberrations relative to other                 progenitor cells (HSPCs) into a wide range of developmental phe-
cancers, but several recurrent aberrations are significantly associat-              notypes within the myeloid lineage, and developmental arrest is a
ed with prognosis and to tumor cell phenotypes. However, genetic                    key aspect of AML pathogenesis. Epigenetic mechanisms are
                                                                                    central to cellular differentiation by governing the control ex-
                                                                                    pression of key developmental gene expression programs. DNA

Corresponding author: Christopher.Oakes@osumc.edu
Article published online before print. Article, supplemental material, and publi-   © 2021 Giacopelli et al. This article, published in Genome Research, is available
cation date are at https://www.genome.org/cgi/doi/10.1101/gr.269233.120.            under a Creative Commons License (Attribution-NonCommercial 4.0 Interna-
Freely available online through the Genome Research Open Access option.             tional), as described at http://creativecommons.org/licenses/by-nc/4.0/.

31:747–761 Published by Cold Spring Harbor Laboratory Press; ISSN 1088-9051/21; www.genome.org                                 Genome Research                747
                                                                                                                                  www.genome.org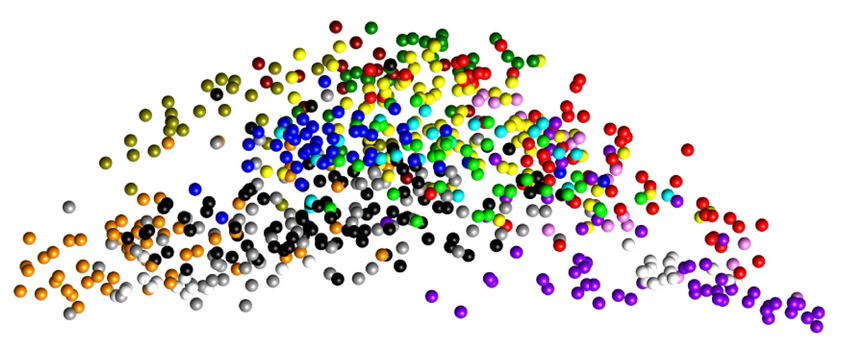
Downloaded from genome.cshlp.org on May 9, 2021 - Published by Cold Spring Harbor Laboratory Press

Giacopelli et al.

methylation, the addition of a methyl group to the 5′ carbon of cy-        uniformly available, tumor cell content inferred from somatic mu-
tosines, is the most broadly studied epigenetic mark. Differential         tation data revealed similar sample purity levels across epitypes
DNA methylation patterns among AML patients has been used                  (Supplemental Fig. S1E). Hierarchical clustering revealed three
to classify patients with varying results identifying between two          primary clusters (superclusters) each containing 3–5 distinct
and 16 subgroups depending on the study design (Bullinger                  DNA methylation epitypes (Fig. 1A). Owing to the high degree
et al. 2010; Figueroa et al. 2010; Melnick 2010; Glass et al. 2017).       of complexity of epitype-specific patterns, t-distributed stochastic
Many of these subgroups showed associations with genetic aberra-           neighbor embedding (t-SNE) plots were used for subsequent visu-
tions but others represented novel subgroups. Decoding altered ge-         alization of epitypes and largely agreed with k-medoids-based clus-
nome-wide DNA methylation patterns can provide insight into                tering (Fig. 1B). Several CpGs in this signature were proximal to
novel disease-relevant pathways by association to global chroma-           genes implicated in AML pathogenesis, such as MEIS1 and several
tin states and enrichment of genomic features. DNA methylation             within the HOXB locus (Supplemental Table S1; Ferreira et al.
is an attractive biomarker owing to its stability and has been effec-      2016). However, the majority of the CpGs composing the epityp-
tively used in multiple cancers to guide therapy (Koch et al. 2018).       ing signature were located in loci with undescribed associations to
      Because of the high degree of heterogeneity in AML, we               AML.
sought to assemble a large cohort of AML samples to uncover
the breadth of distinct genome-wide DNA methylation states                 Epitypes frequently associate with genetic aberrations
and to use this classification structure as a basis for a novel inves-
                                                                           To explore the underlying basis of distinct epitypes, we first con-
tigation of aberrant disease pathways. Here, we analyzed ge-
                                                                           sidered the relationship to recurrent genetic aberrations. We found
nome-wide DNA methylation profiles from well-characterized
                                                                           associations between epitypes and common genetic aberrations
AML samples from the Beat AML project combined with published
                                                                           consistent with past studies (Figueroa et al. 2010; Glass et al.
data, compiling the largest number of methylation profiles studied
                                                                           2017); however, we found that this linkage was not universal
to date. We used an unbiased clustering approach to define distinct
                                                                           (Fig. 1C; Supplemental Table S2). Four epitypes were enriched for
subtypes of AML patients and integration with genomic and gene
                                                                           alterations in key myeloid transcription factors (TFs): E1–E3 were
expression data uncovered that each subtype is associated with a
                                                                           enriched for the TF fusions PML-RARA, inv(16)/CBFB, AML-ETO,
unique combination of developmental and disease-specific fea-
                                                                           respectively, and E4 was enriched for CEBPA mutations. These epi-
tures. Our findings highlight prevalent, subtype-specific activa-
                                                                           types showed the highest association of genetic aberrations (Fig.
tion of inflammatory pathways as a key mechanism uniting
                                                                           1C). Epitypes E1–E4 together formed a distinct supercluster (Fig.
epigenetic, expression and genetic features with poor survival in
                                                                           1A) with dominant, epitype-defining genetic aberrations known
AML.
                                                                           to result in arrest of myeloid development and associate with fa-
                                                                           vorable outcomes (Speck and Gilliland 2002; Pabst and Mueller
                                                                           2007; De Braekeleer et al. 2014). Epitypes 5 and 6 were enriched
Results
                                                                           in a variety of chromosomal rearrangements generating fusions in-
Classification of AML patients into distinct epitypes using                volving KMT2A (previously known as MLL) on 11q23. Multiple
genome-wide DNA methylation                                                KMT2A fusion partners have been described in acute leukemias
                                                                           (Winters and Bernt 2017), and we observed common AML fusion
AML patients were classified in an unbiased fashion by DNA meth-
                                                                           partners in both epitypes. Epitypes E7–E10 were strongly enriched
ylation patterns using samples from newly diagnosed patients ob-
                                                                           for cytogenetically normal genotypes carrying mutations in the
tained from the Beat AML Consortium (n = 226) (Tyner et al. 2018)
                                                                           NPM1 gene. Epitype 8 was enriched for NPM1 mutations alone,
and the Ohio State University (OSU) n = 27, combined with TCGA
                                                                           whereas E7, E9, and E10 were enriched for NPM1 mutations in con-
(n = 190) (The Cancer Genome Atlas Research Network 2013) and
                                                                           junction with DNMT3A, TET2, and IDH1/2 mutations, respective-
five other independent studies comprising n = 206 patients
                                                                           ly. E11–E13 formed a patient supercluster with relative epigenetic
(Schmutz et al. 2013; Leonard et al. 2014; Jung et al. 2015; Ferreira
                                                                           similarity among patterns (Fig. 1D). E11 was enriched in IDH1/2
et al. 2016; Eisfeld et al. 2017; Qu et al. 2017) for a total of n = 649
                                                                           mutations lacking accompanying NPM1 mutations. Epitypes E12
patients. DNA methylation was interrogated by Illumina methyla-
                                                                           and E13 lacked a consistent mutation pattern involving a majority
tion arrays, which provide the DNA methylation levels of CpG
                                                                           of samples, yet retained mutations associated with genomic insta-
dinucleotides primarily in promoter and regulatory regions (Bibi-
                                                                           bility, such as TP53 mutations and complex karyotype, in a minor-
kova et al. 2011). We reduced the data based on overall variance us-
                                                                           ity of samples. These results show that there is a close association
ing the 500 most variable probes for cluster analysis and performed
                                                                           between recurrent genetic aberrations in many AML epitypes,
unsupervised k-medoids-based clustering. The total number of
                                                                           yet others lack a dominant, epitype-defining genotype. In addi-
groups (k) was determined using the Auer-Gervini method (Auer
                                                                           tion, many samples lack the dominant mutation within a particu-
and Gervini 2008; Wang et al. 2018) that uncovered a minimum
                                                                           lar epitype (Fig. 1D), indicating that other cellular events may
of 11 informative principal components (Supplemental Fig. S1A).
                                                                           converge within epitypes to phenocopy the impact on the epige-
By performing clustering and subsequent silhouette analyses
                                                                           nome, termed “epiphenocopy” events.
with increasing k from 11, we determined the optimal group num-
ber to be 13 (Supplemental Fig. S1B,C). We termed these clusters
AML DNA methylation epitypes 1–13 (E1–E13). All epitypes                   Differences between differentiation states reveal nonmutational
comprised samples from multiple studies (median = 5, range =               features of epitypes
3–8). Epitype classification remained largely stable upon varying          Unlike identifying somatic mutations from germline sequences,
the number of most variable probes used, with ∼90% sample as-              all cell types have distinct epigenetic patterns, thus patterns origi-
signments unchanged and variation in epitype assignment primar-            nating from normal counterparts must be accounted for when de-
ily restricted within E5,E6 and E11–E13 (Supplemental Fig. S1D).           termining tumor cell–specific epigenetic changes. We have
Although sample purity from publicly available sources was not             previously shown this to be important for deriving tumor-specific

748     Genome Research
           www.genome.org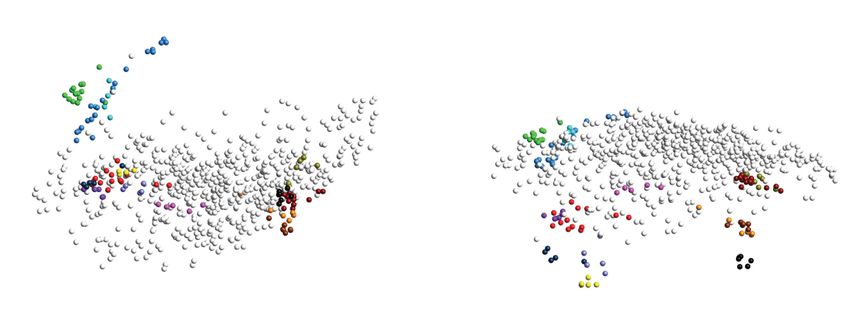
Downloaded from genome.cshlp.org on May 9, 2021 - Published by Cold Spring Harbor Laboratory Press

                                                                                   DNA methylation subtypes and development in AML

          A                                                                    B

         C                                                                D

Figure 1. Unsupervised clustering of 649 AML samples using DNA methylation and relationship with genetic mutations. (A) Heatmap of the 500 most
variable CpGs across all samples organized by hierarchical clustering. Samples are annotated by epitype assignment using PAM clustering (colors). (B) The
same 500 most variable displayed by t-SNE plot. (C) The distribution of the most common recurrent genetic aberrations in AML within the epitypes. Bubble
size represents the percentage of patients within the epitype with the corresponding aberration. (D) Pie charts displaying the frequency of the most com-
mon (dominant mutation/combination) within each epitype.

events in chronic lymphocytic leukemia (CLL) (Oakes et al. 2016).              granulocytes, and, on the progenitor side, are more similar to
AML is known to display a wide range of hematopoietic differenti-              HSPC than other progenitors, such as CMP and MEP (Fig. 2A,
ation states, from undifferentiated, stem-cell-like phenotypes, to             right). Taken together, this analysis supports that AML DNA meth-
differentiated mature cells of the myeloid lineage (Bennett et al.             ylation states generally occur between HSPCs and monocytes/
1982; Griffin et al. 1983). In addition, some AML cells retain                 macrophages. Indeed, GMPs are a known intermediate transition-
immunophenotypic features of granulocytic, erythrocytic, or lym-               al subtype between progenitors and mature myeloid cells and were
phocytic lineages (Bradstock et al. 1989; Macedo et al. 1995;                  located centrally in PC1. We further consolidated the develop-
Matutes et al. 1997). To clearly identify AML epitype-specific                 mental signature to the 5000 most differentially methylated
DNA methylation events, we first expanded our analysis to include              probes between HSPC and monocyte samples. Using this signa-
all CpGs measured across all samples (n = 426,862). We generated               ture, we observed that AML epitypes occupy specific ranges within
Illumina array DNA methylation profiles of sorted hematopoietic                the HSPC to monocyte developmental spectrum (Fig. 2B). E11,
populations and combined with publicly available sources (Rein-                E12, and E13 fell closer to HSPCs, with E11 (IDH1/2) generally
ius et al. 2012; The Cancer Genome Atlas Research Network                      less differentiated than HSPCs. E5 (KMT2A) and E7 (NPM1
2013; Jung et al. 2015; Qu et al. 2017). We generated a DNA meth-              +DNMT3A) fell closer to monocytes, with some samples showing
ylation signature that encompasses normal hematopoietic devel-                 further differentiation toward macrophages, likely caused by tu-
opment by assembling a probe set of differential methylation                   mor-specific methylation changes at developmentally regulated
between each subpopulation and HSPC. This signature recapitulat-               CpGs. The French-American-British (FAB) classification is a mor-
ed the branches of the hematopoietic lineages (Supplemental Fig.               phological assessment incorporating the differentiation stage of
S2A). Investigation of this signature together with all AML samples            AML cells that has historically been used as a prognostic marker
revealed that the largest proportion of the variation (principal               (Bennett et al. 1982). Comparing FAB classifications across epi-
component 1 [PC1]) among AML samples occurred between                          types with available annotation (n = 247), we observed a discrete
HSPC/myeloid progenitors and mature myeloid cells as expected                  pattern across epitypes, with M0 (undifferentiated leukemia)
(Fig. 2A, left). Lymphocytes were positioned on the side of PC1                scores occurring almost exclusively in E11–E13 and M5 scores
with the myeloid progenitors, indicating that PC1 relates to mye-              (monocytic leukemia) highly enriched in E5, E7, E8 (Supplemental
loid-specific development. PC2 primarily related to a lymphoid-                Fig. S2B). To further control for potential HSPC-monocyte devel-
dominant signature distinct from the vast majority of AML sam-                 opmental signature in AML samples, we investigated the enrich-
ples. PC3 largely separated some myeloid progenitors from HSPCs,               ment of transcription factor recognition sequence motifs in
as well as granulocytes from monocytes and macrophages, reveal-                regions displaying altered methylation in monocytes versus
ing that AMLs were more similar to monocytes/macrophages than                  HSPCs. Several TF motifs were highly enriched in monocyte-

                                                                                                                       Genome Research             749
                                                                                                                          www.genome.org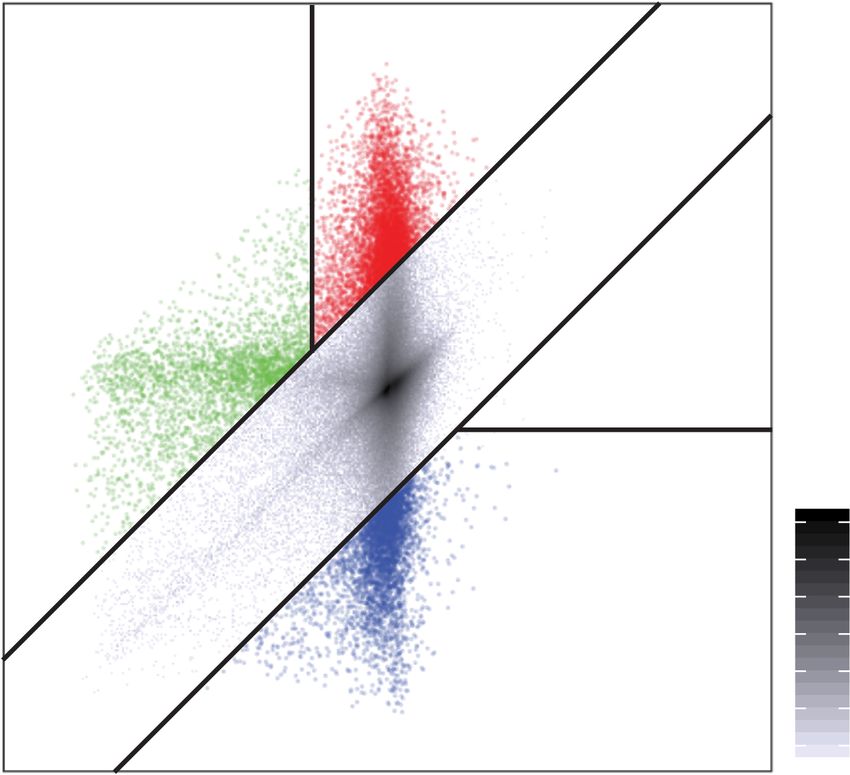
Downloaded from genome.cshlp.org on May 9, 2021 - Published by Cold Spring Harbor Laboratory Press
Giacopelli et al.
A
B C
D E
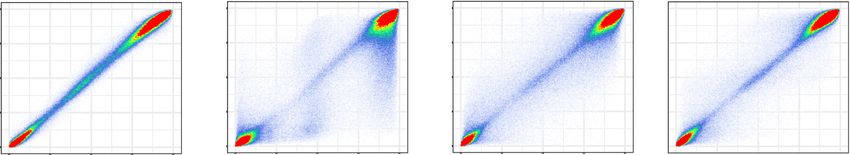
Figure 2. Assessment of DNA methylation associated with normal myeloid development enables identification of tumor-specific methylation. (A)
Principal component analysis including healthy cell populations (colored) and AML samples (white) using the hematological developmental probe set
(left, principal component [PC] 1 vs. PC2; right, PC1 vs. PC3). (B) Principal component analysis using a probe set of differentially methylated CpGs between
HSPC and monocytes (white), including AML samples (colored by epitype). (Below) Density plot showing the distribution of samples with each epitype
across PC1. (C) Bubble scatterplot of transcription factor motif enrichment in regions hypomethylated in monocytes compared to HSPC. Bubble size cor-
responds to the P-value, and color corresponds to transcription factor family. (D) A representative scatterplot simultaneously visualizing the DNA methyl-
ation differences in monocyte development (HSPCs to monocytes, x-axis) versus AML development using HSPCs as a reference (y-axis). Values represent
average levels within HSPCs, monocytes, and AML epitype. Tumor-specific methylation changes are categorized as having aberrant hypermethylation (red)
or aberrant hypomethylation (blue), separately from changes occurring in parallel with normal development (gray) or failing to occur as normally observed
in monocytes (green). (E) Distribution of the tumor-specific methylation changes in each epitype. DNA methylation changes were compared simultane-
ously between normal and tumors (as shown in D) for all 13 epitypes.
750 Genome Research
www.genome.org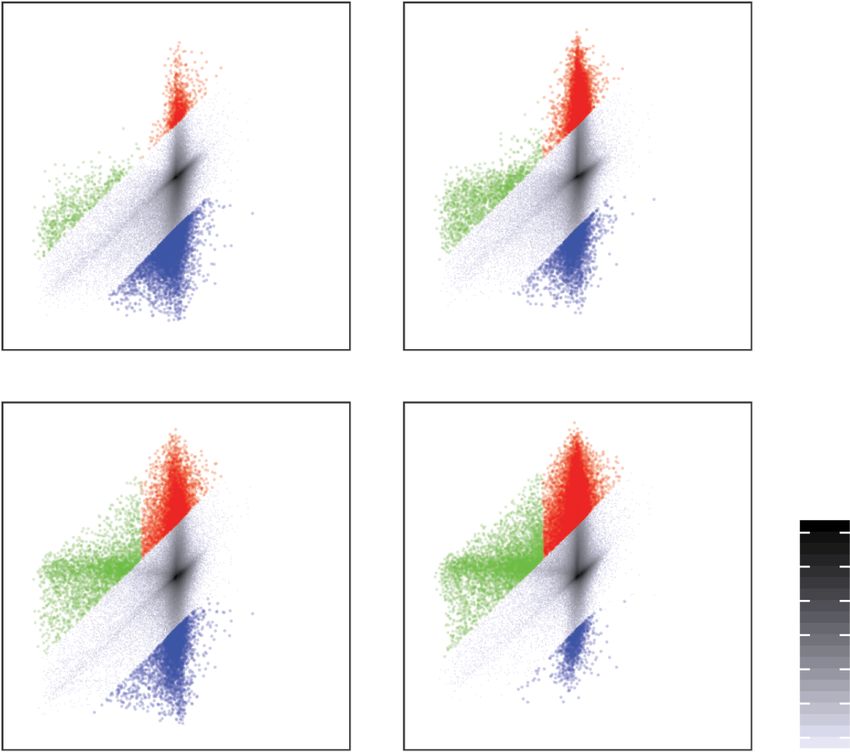
Downloaded from genome.cshlp.org on May 9, 2021 - Published by Cold Spring Harbor Laboratory Press

                                                                         DNA methylation subtypes and development in AML

specific hypomethylated regions, including CEBP, AP-1, ETS, IRF,       activation of these pathways in the NPM1 supercluster. E7 and E8
and RUNX TF families (Fig. 2C). Disruption of several members          showed enrichment for HOX motifs, consistent with known acti-
of these TF families are associated with a block in AML differenti-    vation of HOX genes in NPM1-mutated AML (Spencer et al. 2015).
ation (Tenen 2003).                                                    Epitype E9 displayed selective enrichment for FOX motifs, suggest-
      We next used changes associated with normal development          ing a novel activation of this TF family coincident with TET2 mu-
to independently identify tumor-specific methylation alterations.      tations. Despite the combination of DNMT3A and 262 NPM1
We visualized DNA methylation changes in individual AML epi-           mutations, E7 displayed significantly more hypomethylation
types versus the change that normally occurs in monocyte differ-       than others in the NPM1 supercluster (Fig. 3B), there was little dif-
entiation using HSPCs as a fixed reference (Fig. 2D). The probes       ference in the TF enrichments, indicating that loss of DNMT3A
that change methylation equally in both comparisons represent          function is not associated with specific pathway activation. These
normal differentiation, whereas those that diverge from this axis      findings suggest that NPM1 loss is a strong modifier of DNA meth-
represent tumor-specific methylation changes. DNA methylation          ylation patterns, which amplify methylation changes when com-
gains and losses that were not observed to involve normal differen-    bined with the disruption of an epigenetic regulator. Investigation
tiation were termed aberrant hyper- or hypomethylation, respec-        of aberrant hypermethylation within the NPM1 supercluster re-
tively. As we consider AML samples that have not reached the           vealed that E9 (TET2) and E10 (IDH) displayed higher levels of
differentiation state of mature myeloid cells to developmentally ar-   largely overlapping hypermethylation, which differed from those
rested, hypomethylation events that occurred during normal dif-        observed in E8 (NPM1 alone) (Fig. 3D). TET2 and IDH1/2 muta-
ferentiation but failed to occur developmentally in AML were           tions largely act through the same pathway leading to the inhibi-
termed failed (developmental) hypomethylation. Each epitype            tion of TET2-dependent demethylation in cancer (Scourzic et al.
displayed unique amounts and proportions of these classes of           2015).
methylation change (Fig. 2E). TF-rearranged epitypes (E1–E4) gen-            To gain insight into the targeting and functional impact of
erally displayed less variation of differentially methylated CpGs      hypermethylation, we partitioned the genome into chromatin
among samples, whereas variation was higher in more differentiat-      states. These states functionally define regions as active, poised,
ed epitypes (E5–E7) (Supplemental Fig. S3). AML epitypes dis-          repressed, or quiescent states in combination with enhancer, pro-
played variable amounts of failed hypomethylation that closely         moter, transcribed, and heterochromatic function by a combina-
correlated with the degree of differentiation in the HSPC-mono-        tion of histone modifications using HSPCs as a reference (Ernst
cyte signature (median PC1) (Supplemental Fig. S2C). Motif en-         and Kellis 2010). Hypermethylated regions in E8 (NPM1 alone)
richment analyses revealed that all AML epitypes that show             were enriched in regions containing the polycomb repressive his-
differentiation block (all except E5–E7) involve loss of hypomethy-    tone modification, H3K27me3, and chromatin states containing
lation programming associated with CEBP, SPI1/ETS, RUNX, AP-1,         this mark, such as poised promoters and enhancers as well as poly-
and IRF TFs, suggesting attenuated activity of these TF pathways       comb repressed regions (Fig. 3E; Supplemental Table S5). Con-
broadly in AML (Supplemental Table S3).                                versely, hypermethylation in E9 (TET2) and E10 (IDH1/2)
                                                                       showed depletion in polycomb repressed regions and instead
                                                                       were enriched for active enhancers and regions flanking promot-
Aberrant DNA methylation patterns reveal disease features              ers/transcriptional start sites. Furthermore, hypermethylated en-
associated with NPM1 mutations                                         hancers in E9 and E10 were selectively enriched with TF motifs
NPM1 is one of the most commonly mutated genes in AML, occur-          belonging to MEF2 and SPI1/ETS (Fig. 3F; Supplemental Table
ring in 30% of patients and is usually associated with a favorable     S6). Aberrant hypermethylation indicates not only the selective
outcome except in cases with certain co-occurring mutations            loss of the normal activity of these TFs in myeloid differentiation,
(Papaemmanuil et al. 2016; Tyner et al. 2018). The vast majority       but a further reversion to a state for these enhancer regions that is
(91%) of NPM1 mutations were found in epitypes E7–E10 (Supple-         more immature than HSPC in TET2 and IDH-mutant AML (Schüler
mental Table S2) either occurring alone (E8) or frequently in com-     et al. 2008; Will et al. 2015). These findings illustrate commonali-
bination with known epigenetic modifier genes DNMT3A (E7),             ties among AML methylation epitypes containing NPM1 muta-
TET2 (E9), or IDH (E10) (Fig. 1C,D). Although NPM1 by itself is        tions (E7–E10) and highlight the distinct differential impact of
not described as an epigenetic modifier or regulator, epitype E8 re-   mutations in epigenetic modifying enzymes when co-occurring
tained among the most aberrant DNA methylation changes, in-            with NPM1 mutations.
volving both hyper- and hypomethylation (Fig. 2E). This pattern
of aberrant methylation was modulated in combination with oth-
er epigenetic modifiers, skewing toward either hyper- or hypo-         AML epitypes E11–E13 display undifferentiated, HSPC-like features
methylation by IDH1/2, TET2, or DNMT3A, respectively (Fig.             Epitypes E11–E13 formed a distinct constellation of AML samples
3A). Regions of tumor-specific methylation can be used to infer        separate from clusters with highly prevalent NPM1 mutations, re-
pathway activation by investigation of TF motif enrichment in se-      current chromosomal rearrangements, and other genetic abnor-
lectively hypomethylated regions (Hovestadt et al. 2014). Analysis     malities. Although E11 contained IDH1/2 mutations, E12 and
of hypomethylated CpGs among E7–E10 revealed that E10 and E8           E13 lacked highly recurrent genetic features (Fig. 1C,D), thus we
were largely subsets of the hypomethylation observed in E7, with       further endeavored to uncover unique features associated with
E9 demonstrating a subset of uniquely hypomethylated CpGs (Fig.        these enigmatic epitypes. E13 revealed little difference in the
3B). E7–E10 shared enrichment of RUNX, AP-1, and SPI1 motifs in        DNA methylation pattern to normal cells, with almost all changes
the aberrant hypomethylated regions, which along with enrich-          representing failed hypomethylation (Fig. 4A). DNMT3A was the
ment in failed hypomethylation (Supplemental Table S4), suggests       most commonly mutated gene in E13, but it was not associated
that activity of these TFs are redirected from patterns of binding     with methylation loss in this epitype. CpGs displaying failed
that occur normally (Fig. 3C). E7–E9 shared enrichment for EGR         hypomethylation in E13 overlap almost entirely with E11 and
and TCF sequence motifs in tumor cells only, suggesting aberrant       E12 (Fig. 4B). These three epitypes were among the most

                                                                                                            Genome Research            751
                                                                                                               www.genome.org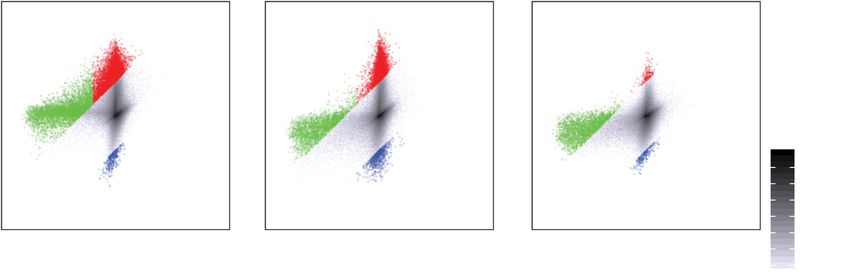
Downloaded from genome.cshlp.org on May 9, 2021 - Published by Cold Spring Harbor Laboratory Press

Giacopelli et al.

                A                                                                   B

                C

                D                                                   F

                E

Figure 3. Analysis of tumor-specific methylation in the NPM1 constellation of epitypes (E7–E10). (A) Scatterplots comparing normal and tumor devel-
opmental methylation changes in E7–E10 highlight differential degrees of failed hypomethylation (green), aberrant hypermethylation (red), or aberrant
hypomethylation (blue). (B) Venn diagram illustrating the numbers and overlap of aberrantly hypomethylated CpGs in E7–E10, with the dominant mu-
tations within each epitype indicated (NPM1 alone or NPM1 plus a modifier mutation). (C) Bubble scatterplot of transcription factor motif enrichment
in regions aberrantly hypomethylated in E7–E10. Bubble size corresponds to the P-value and color corresponds to transcription factor family. (D) Venn
diagram of the aberrant hypermethylation in epitypes E7–E10. (E) Enrichment of aberrantly hypermethylated regions in selected chromatin states defined
using the 15-state ChromHMM model in three independent HSPC samples. (F) Bubble scatterplot of transcription factor motif enrichment in regions ab-
errantly hypermethylated in epitypes 9 and 10.

undifferentiated in epigenetic developmental analyses (Fig. 2B)              cell types cluster in the vicinity of E11–E13, with HSPCs clustering
and furthermore contained all samples with undifferentiated                  within E13 (Supplemental Fig. S4A). We next incorporated gene
(FAB M0) morphology (Supplemental Fig. S2B). Thus, we explored               expression data available in Beat AML and TCGA cohorts to exam-
if these epitypes represent samples showing a stem-cell-like pheno-          ine the degree that these epitypes show hematopoietic stem cell
type. We first performed t-SNE clustering using the 500-probe sub-           gene expression signatures, such as the LSC17 signature (Ng
typing signature of all AML samples combined with normal                     et al. 2016). We found that epitypes E11–E13 showed the highest
hematopoietic lineage populations, and we found that normal                  LSC17 scores across both data sets (P < 0.001) (Fig. 4C,D), which

752     Genome Research
           www.genome.org
Downloaded from genome.cshlp.org on May 9, 2021 - Published by Cold Spring Harbor Laboratory Press
DNA methylation subtypes and development in AML
A B
C D
E F G
Figure 4. AML epitypes E11–E13 display stem-cell-like features. (A) Differential methylation scatterplots of E11–E13 highlight tumor-specific methylation
changes. (B) Venn diagram showing overlap of failed hypomethylation in E11–E13. (C,D) LSC17 gene expression scores in the Beat AML (C) and the TCGA
(D) cohort arranged by epitype. Cohort median value is indicated by the dotted line; significance evaluated by ANOVA test followed by comparison of E11–
E13 individually versus E1–E10; adjusted P-values: (∗ ) P < 0.05; (∗ ∗ ) P < 0.01; (∗∗∗ ) P < 0.001. (E) Kaplan-Meier analysis of overall survival of E11–E13 com-
pared to the other epitypes (E1–E10) in the Beat AML and TCGA cohorts. (F,G) Kaplan-Meier analysis of overall survival of E11–E13 compared to the other
epitypes in the Beat AML and TCGA cohorts following separation into LSC17-high (F) and LSC17-low (G) groups using median dichotomization indicated
above in C and D, respectively.
were further supported by high overall enrichment in two other tigated if stem-cell-like epitypes E11–E13 retained independent
independent stem cell signatures (Supplemental Fig. S4B; Gal prognostic impact relative to LSC17. Following median dichoto-
et al. 2006; Gentles et al. 2010). Because stemness has been associ- mization of LSC17 scores, stem-cell-like epitypes further separated
ated with poor outcomes (Amadori et al. 1996; Barbaric et al. the overall survival of AML patients in the Beat AML cohort, with a
2007), we next investigated if patients from E11–E13 showed sig- similar trend observed in TCGA samples (Fig. 4F,G). In multivari-
nificantly poorer outcomes than other epitypes. We found that ate analyses, in the TCGA cohort, E11–E13 retained significance
E11–E13 displayed inferior overall survival in both Beat AML and (P < 0.001) and LSC17 did not (Supplemental Table S7).
TCGA cohorts (Fig. 4E), which was also generally observed when Further investigation of stem-cell-like epitypes revealed sub-
considering individual epitypes (Supplemental Fig. S5). As LSC17 stantial tumor-specific aberrant hypermethylation in E11 and
is a well-described prognostic signature of stemness, we next inves- E12, and no enrichment was found for E13 owing to the paucity
Genome Research 753
www.genome.orgDownloaded from genome.cshlp.org on May 9, 2021 - Published by Cold Spring Harbor Laboratory Press
Giacopelli et al.
of hypermethylated CpGs (Supplemental Fig. S6A). E11 showed specific to epitypes with less frequent FLT3 mutations. We identi-
hypermethylation enriched in enhancer regions (Supplemental fied 253 probes significantly hypomethylated in FLT3-ITD sam-
Fig. S6B), as expected with prevalent IDH1/2 mutations. However, ples (20% methylation change, FDR Q < 0.01). Motif enrichment
E12 did not display a dominant mutation or TF enrichment that analysis revealed hypomethylated regions were highly enriched
potentially explained aberrant hypermethylation. E12 hyperme- for STAT family sequence motifs, with STAT5A as the top match
thylation was highly enriched in regions marked by polycomb re- (Fig. 5A), consistent with known activation of STAT5A (previously
pressed/poised regions. We next examined differential gene known as STAT5) in FLT3-ITD AMLs (Choudhary et al. 2007). We
expression between E11–E13 and healthy HSPCs. We identified further selected probes in FLT3-ITD-associated hypomethylated
52, 54, and 107 differentially expressed genes in E11, E12, and regions that contained a proximal STAT motif to create a probe
E13, respectively (greater than or equal to twofold change, adjust- set of 101 CpGs that we termed the STAT hypomethylation signa-
ed P ≤ 0.01), with 68/218 genes showing evidence of differential ture (SHS) (Supplemental Table S9). We next expanded our analy-
promoter methylation (Supplemental Table S8). Ingenuity path- sis to investigate this signature across all AML samples.
way analysis comparing relative activation of upstream regulators Hierarchical clustering in all samples identified a subset of SHS-en-
revealed that the top results in E13 were enriched for inflammatory riched samples we designated as SHS+ AMLs (Fig. 5B). SHS positiv-
pathways, including TNF, IL1B, and IFNG (Supplemental Fig. ity was not limited to E7–E10 and was found across epitypes (Fig.
S6C). We found similar results in E11 and E12, an absence in 5C). SHS positivity was not restricted to FLT3-ITD cases: 73% of
E7–E10, and variable enrichment in E1–E6 (Supplemental Fig. SHS+ were FLT3-ITD, 6% had a FLT3 mutation other than ITD
S6D). Hypermethylation of polycomb-marked regions is common- (commonly single-nucleotide mutations in the kinase domain),
ly observed in tumors, especially in tu-
mors with activating mutations in
signaling pathways (Gal-Yam et al.
A B
2008; Sproul and Meehan 2013).
Indeed, hematopoietic cells chronically
exposed to inflammatory chemokines
STAT5A
induces hypermethylation of polycomb
regions (Spencer et al. 2017). Combining
observations of DNA methylation and
gene expression changes, our findings
suggest that stem-cell-like epitypes that
lack a dominant driver mutation may
use pro-inflammatory signaling to drive BCL6
AML cell proliferation and survival.
FLT3-ITD is linked to a distinct C
DNA methylation signature
targeting STAT sites
Pro-inflammatory signaling is common-
ly associated with cancer and often gen-
erated by mutations in tumor cells
(Balkwill and Coussens 2004). In AML,
gain-of-function FLT3-internal tandem
duplication (FLT3-ITD) mutations acti-
vate the JAK/STAT pathway and are asso-
ciated with poor outcomes (Meshinchi
and Appelbaum 2009). FLT3-ITD muta-
tions were spread across several epitypes
(Fig. 1C) and were not enriched in D
stem-cell-like epitypes (E11–E13) consis-
tent with past studies (Figueroa et al.
2010; Döhner et al. 2017; Glass et al.
2017). Thus, we next sought to deter-
mine if there was a DNA methylation
signature associated with FLT3-ITD in-
dicative of pro-inflammatory signaling
that was not captured in the most vari-
able methylation signature that defined
the AML epitypes. Because FLT3-ITD mu- Figure 5. A hypomethylation signature involving STAT is associated with FLT3-ITD mutations. (A)
tations were most frequent in the NPM1 Bubble scatterplot of transcription factor motif enrichment in hypomethylated regions in FLT3-ITD-mu-
tated AMLs. Bubble size corresponds to the P-value, and color corresponds to transcription factor family.
supercluster, we compared FLT3-ITD to
(B) Heatmap of the STAT hypomethylation signature with samples arranged by hierarchical clustering.
FLT3 wild-type samples within E7–E10 (C) Distribution of STAT hypomethylation signature-positive (SHS+) samples across AML epitypes. (D)
only to avoid introducing differences Breakdown of FLT3 mutations in SHS+ (left) and SHS− (right) groups.
754 Genome Research
www.genome.orgDownloaded from genome.cshlp.org on May 9, 2021 - Published by Cold Spring Harbor Laboratory Press
DNA methylation subtypes and development in AML
and 20% of SHS+ cases were devoid of FLT3 mutations. We did not evolution of DNA methylation patterns, all (4/4) showed reversion
observe statistically significant enrichment of other pathway mu- to an epigenetic pattern consistent with a more stem-cell-like
tations in SHS+/FLT3 mutation-negative samples. Conversely, phenotype.
70% of SHS negative cases lacked FLT3 mutations, 14% were
FLT3-ITD, and 17% had a non-ITD FLT3 mutation (Fig. 5D). These
results indicate that hypomethylation of STAT binding sites may Discussion
occur by other aberrant biological events converging on activation
of the STAT pathway. In this study, we used global DNA methylation patterns to gain a
better understanding of the molecular heterogeneity observed in
AML. Using unbiased clustering on a large cohort of AML samples
DNA methylation patterns at relapse we identified 13 distinct epitypes. Several epitypes associated with
Most AML patients relapse despite achieving a complete remission. common AML genetic aberrations and different stages of myeloid
Relapse can involve regrowth of the major clone at diagnosis or development. Analysis of tumor-specific methylation changes
outgrowth of a small resistant tumor cell population that exists identified potential mechanisms for tumor development in some
at baseline (Vosberg and Greif 2019). To examine if reexpanded tu- of the less well-defined epitypes. Gene expression analysis identi-
mor populations at relapse stably maintain or evolve novel DNA fied epitypes displaying a stem-cell-like phenotype that was associ-
methylation patterns, we analyzed 26 paired diagnosis and relapse ated with overexpression of inflammatory pathways and not
samples using Illumina arrays. Patients achieved a complete remis- associated with a particular recurrent mutational pattern. We
sion of at least 6 mo before relapse, and samples were sort-purified also identified a separate DNA methylation signature associated
or had a BLAST percentage >80% to avoid methylation differences with FLT3-ITD that detects additional patients that use the STAT
caused by impurity. Using the epityping probe set, 22/26 (85%) of inflammatory pathway. Finally, we found that epitypes are stable
patient epitypes remained stable at relapse, often producing nearly between diagnosis and relapse, with the majority of cases retaining
identical (overlapping) profiles following clustering (Fig. 6A). the same epitype and those that change epitype do so with evi-
However, four of the patients fell into a different epitype at relapse dence of clonal genetic evolution. Collectively, these findings pro-
than observed at diagnosis. In each of these cases, the relapse vide evidence of AML development based upon acquisition of
sample migrated to one of the stem-cell-like epitypes (E11–E13), developmental pattern of methylation similar to what we have de-
suggesting the relapse tumor cell population retained a more scribed in CLL. Notably, mutations identified in AML are not de-
immature differentiation state. To determine if the change in the fining of subgroups when classification is approached in an
epigenetic pattern was associated with genetic evolution, samples unbiased manner.
were sequenced for 80 commonly recurrent genetic mutations in Prior studies have used DNA methylation patterns to cluster
AML (Supplemental Table S10; Eisfeld et al. 2017). All patients AML patients using varying technologies and cohort sizes (Bullin-
showing different epitypes at relapse showed evidence of clonal ger et al. 2010; Figueroa et al. 2010; Melnick 2010; Glass et al.
evolution, with the relapse sample often losing the dominant epi- 2017). Studies have found a general relationship of methylation-
type mutation found in the diagnosis sample (Fig. 6B). Patients based clusters and genetic aberrations (Bullinger et al. 2010; Figue-
showing the same epitypes at relapse showed minimal genetic var- roa et al. 2010; Glass et al. 2017), and uncovered methylation gains
iation between time points. To validate these findings, we ob- and losses associated with these aberrations in epigenetic regula-
tained a second cohort of 41 patients with paired diagnosis/ tors (Glass et al. 2017). In support of these previous studies, we
relapse samples. We observed the same epitype at diagnosis and re- found tight associations with three of the epigenetic subgroups
lapse in 39/41 (95%) patients (Supplemental Fig. S7; Supplemental and chromosomal rearrangements t(15;17), t(8;21), and inv(16).
Table S11). The two patients that showed a change of epitype Although past studies identified multiple epitypes associated
evolved to E13 and showed genetic changes between time points, with CEBPA mutations (Figueroa et al. 2010), we found CEBPA mu-
consistent with the preceding findings. We next determined if tations enriched in a single subgroup. Unlike the previous studies,
there were global methylation changes between diagnosis and re- we did not find clear differences between the epigenetic patterns
lapse. We found that many of the samples showed similar epige- associated with mutations in IDH1 and IDH2 (Glass et al. 2017). In-
netic patterns at diagnosis and relapse. For the cases that did not stead, we found that differences among IDH1/2 mutant AMLs were
change epitype, on average only 5% of the probes showed a differ- dependent on whether an accompanying NPM1 mutation was pre-
ence (Δ±20% methylation) compared to 11% for cases that sent or absent (E10 vs. E11, respectively). We found the IDH2 R172
changed epitype (P=0.0099) (Fig. 6C). We did however observe a mutation exclusively in E11, consistent with previous studies
minority of cases that did not change epitype, yet still displayed showing mutual exclusivity with NPM1 (Patel et al. 2011). Although
a relatively large proportion of altered methylation. These tended the previous studies indicated some altered DNA methylation pat-
to show gain- or loss-of-signaling pathway mutations, such as RAS terns associated with NPM1 mutations, we found that the NPM1
or FLT3 (Supplemental Table S10), that were not found to be mutation has an impact on tumor-specific epigenetic patterns and
strongly associated with epitypes. Methylation differences be- is a dominant mutation in 4/13 epitypes. We found the impact
tween diagnosis and relapse in these patients were generally gains that mutations in known epigenetic regulators DNMT3A, IDH1/2,
and losses at subclonal (30%) differences (Fig. 6D). These findings indicate a role for NPM1 in epigenetic regulation.
that DNA methylation patterns are generally stable through ther- Because the genetic picture of AML is complex (The Cancer
apy, likely owing to overall high stability and homogeneity of Genome Atlas Research Network 2013), classification of patients
DNA methylation patterns in tumor cells enabling the clonal pop- using DNA methylation patterns may help to describe a simplified
ulation that arises at relapse to be phenotypically similar to the number of phenotypes and also include patients with the same un-
population at diagnosis. Of the relatively few patients that showed derlying biology yet lack the recurrent marker mutation. We have
Genome Research 755
www.genome.orgDownloaded from genome.cshlp.org on May 9, 2021 - Published by Cold Spring Harbor Laboratory Press
Giacopelli et al.
A
B C
D
Figure 6. DNA methylation patterns are stable at relapse except in a minority of cases. (A) t-SNE plot of the AML epityping probe set including all AML
samples along with paired diagnosis/relapse samples. The diagnosis and relapse sample (often completely overlapping) are indicated by the same color
within pairs, and those pairs not changing epitype are circled in blue. Red arrows indicate pairs in which the relapse sample changed epitype. Epitypes are
illustrated by standard colors in the inset. (B) Changes in mutant variant allele fraction between diagnosis and relapse in the 4/26 pairs that changed epi-
genetic epitype. (C) The number of probes that change by >20% between diagnosis and relapse; patients that showed change of epigenetic epitype are
displayed separately. (D) Correlation of methylation values from all 426,862 probes at diagnosis and relapse in a representative sample that displayed a
stable pattern, one that changed epitype, and two that remained within the same epitype but gained a signaling pathway mutation at relapse as indicated.
uncovered that epiphenocopying broadly occurs across the spec- mutation. A noteworthy example is E9, which displays an enrich-
trum of recurrent mutations in AML. Indeed, phenotypic studies ment for TET2 mutations yet half of the cases within this epitype
have revealed CEBPA wild-type AMLs may mimic the biology of have wild-type TET2. These epiphenocopies have attained the
CEBPA mutant AML (Wouters et al. 2007). In our study, epipheno- same epigenetic pattern through other means, such as potentially
copying was particularly observed in epitypes we explored in more altered α-ketoglutarate metabolism (Morin et al. 2014; Raffel et al.
detail (E7–E13), where many patients lacked the dominant epitype 2017).
756 Genome Research
www.genome.orgDownloaded from genome.cshlp.org on May 9, 2021 - Published by Cold Spring Harbor Laboratory Press
DNA methylation subtypes and development in AML
Mutations in epigenetic modifying genes are common in quently targets promoters that are marked by the polycomb repres-
AML, but characterization of their role in disease development sive mark H3K27me3 in developmental precursors, which
has been difficult. Mouse models carrying disrupted epigenetic commonly mark poised promoters of developmentally regulated
modifiers, such as DNMT3A, TET2, and IDH1/2, do not alone result genes (Bernstein et al. 2006; Ohm et al. 2007; Schlesinger et al.
in frank leukemia and require serial transplantation for an overt 2007; Widschwendter et al. 2007). In our studies, the association
AML phenotype to develop (Li et al. 2011; Quivoron et al. 2011; of aberrant hypermethylation was highly epitype-dependent, be-
Sasaki et al. 2012; Celik et al. 2015). The presence of these muta- ing either largely absent (E5, E7, E13), enriched at enhancers
tions in asymptomatic individuals, described as clonal hematopoi- (E9–E11), or enriched in polycomb repressed and poised regions,
esis of indeterminate potential (Steensma et al. 2015), suggests that which include CpG islands (E1–E4, E6, E8, E12). CIMP is associat-
these mutations occur early in disease development, and may loos- ed with prolonged inflammation and stress (Jones and Baylin
en control of the epigenome, allowing for other events to more 2007), and prolonged treatment of HSPCs from healthy donors
readily cause phenotypic reprogramming and disease develop- with inflammatory cytokines induces hypermethylation of poly-
ment (Feinberg et al. 2016). Indeed, we observed methyla- comb repressed and poised regions (Spencer et al. 2017). Work in
tion losses and gains in E7 (NPM1+DNMT3A) and E9,E10 other cancers suggests CIMP tumors may not respond well to
(NPM1+TET2, IDH1/2) occurred in addition to changes that oc- DNA damaging treatments but may respond better to hypomethy-
curred in NPM1-mutated alone (E8). Although DNMT3A-associat- lating agents (Mack et al. 2014). Some AML patients with high-risk
ed global methylation loss occurred in conjunction with NPM1 genetic markers, such as complex karyotype and TP53 mutations,
mutations, DNMT3A mutations did not cause hypomethylation have achieved favorable responses with hypomethylating agents
in E13, despite being the most common genetic aberration in in some patients (Santini and Ossenkoppele 2019). Of interest,
the epitype. This indicates that DNMT3A loss alone does not E12 was associated with high-risk genetics, and poor overall sur-
induce global DNA hypomethylation, supporting findings in vival. Elevated methylation of polycomb regions may predict fa-
DNMT3A-null mice (Guryanova et al. 2016). Because we have un- vorable responses to hypomethylating agents in this epitype that
covered that E13 uses other disease-specific pathways, DNMT3A in responds poorly to standard chemotherapy. In addition, as we
the context of E13 may have primarily played a role in premalig- have shown activation of inflammatory pathways coincident
nant stages or has a non-DNA methylation-dependent role. with polycomb hypermethylation in this epitype, targeting path-
Because DNA methylation is an important factor controlling ways such as JAK/STAT may provide additional benefit to these
gene regulation, in addition to epitype classification, it can also patients.
convey critical aspects of the biology underling AML epitypes. Our findings show that DNA methylation is a useful
We found that most AMLs retain developmental DNA methyla- approach for classifying this genetically heterogeneous, complex
tion signatures restricted within the development of monocytes disease, and significantly adds to our understanding of distinct bi-
from HSPCs, consistent with results from chromatin accessibility ological aspects of individual patients. We have shown that epi-
landscapes performed on a small AML cohort versus a wide variety types integrate the majority of highly recurrent mutations,
of hematopoietic cell types (Corces et al. 2016). AML cells with developmental states, and other phenotypes. Our approach fur-
granulocytic morphologies may be depleted from samples as a re- ther incorporated patients lacking recurrent mutations based on
sult of the routine use of ficoll to purify AML cells. We found that epigenetic and phenotypic similarity (epiphenocopies). Epitypes
the spread across the developmental axis is associated with the dis- use different pathways, several of which involve activation of in-
crete epitypes we identified. Accounting for normal development flammatory pathways and are associated with poor survival. The
enabled us to identify tumor-specific changes to the epigenome, use of epitypes as a biomarker in AML is further supported by
which in turn inferred disease-specific TF activity and chromatin the stability of the methylation patterns throughout disease course
states. The changes in E13 relative to HSPCs may represent initial in the vast majority of patients. Future development of a targeted
changes in AML development common to the majority of AMLs, approach for classification of individual patients will be vital to un-
because only failed hypomethylation was observed without aber- lock potential clinical utility of assessing epitypes. Coordinated
rant (tumor-specific) changes. Most epitypes are deficient in nor- evolution of epitype and genetic markers may identify patients
mal development similarly involving loss of key developmental that may benefit from a change in therapy, including hypometh-
TFs activities to varying degrees. This initial step is likely the block ylating and novel agents.
in differentiation that can be achieved by a variety of mechanisms
and is then followed by some form of proliferation as is suggested
by the two-hit hypothesis of AML development (Lagunas-Rangel
Methods
et al. 2017). Our data indicate that NPM1-mutant epitypes univer- AML patients and Illumina DNA methylation array data
sally show activation of components of RUNX, AP-1, EGR, TCF,
AML patient samples were collected as part of the Beat AML study
and HOX TF families implicating a variety of upstream pathway ac-
(Tyner et al. 2018), and genomic DNA from 226 bone marrow
tivation. E9,E10 (NPM1+TET2, IDH1/2) show loss of MEF2, ETS,
samples was obtained at diagnosis along with 13 matched relapse
and IRF sites focused on enhancer regions, potentially further re-
samples. DNA was obtained from an additional 27 patients at diag-
pressing their normal development.
nosis with t(v;11) rearrangements and 22 patients sampled at diag-
A common feature of tumor methylomes is hypermethyla- nosis and relapse from the Leukemia Tissue Bank Shared Resource
tion of CpG islands located in gene promoter regions, referred to at the Ohio State University Comprehensive Cancer Center.
as the CpG island hypermethylator phenotype (CIMP) (Toyota Mononuclear cells from AML samples were isolated using density
et al. 1999). CIMP subtypes have been described within several tu- gradient separation. Samples with low variant allele frequency
mor types, including colorectal, breast, brain, and gastric cancers, (VAF) of recurrent mutations in myeloid malignancies suggestive
as well as AML (Roman-Gomez et al. 2005; Weisenberger et al. of low tumor cell purity were excluded. Leukemic cells from low
2006; Noushmehr et al. 2010; Zouridis et al. 2012; Mack et al. (Downloaded from genome.cshlp.org on May 9, 2021 - Published by Cold Spring Harbor Laboratory Press
Giacopelli et al.
(CD34+), monocyte (CD14+) populations were isolated using FACS most variable probes between HSPCs (n = 14) and monocytes (n =
from bone marrow and peripheral blood. Macrophages were ob- 15). To identify tumor-specific differences occurring outside of
tained by plating sorted monocyte populations for 14 d. All pa- normal development, we compared changes in individual AML
tients and donors provided informed consent according to the epitypes versus the change that normally occurs in monocyte dif-
Declaration of Helsinki. Genomic DNA was isolated using col- ferentiation using HSPCs as a fixed reference across all analyzed
umn-based preparation (Qiagen). DNA (500 ng) was bisulfite con- probes. The methylation values of all probes were averaged within
verted using the EZ DNA Methylation Gold Kit (Zymo Research). each AML and normal subtype in scatterplots. The probes that di-
The Infinium methylationEPIC assay was carried out following verged from the expected normal development value greater than
standard protocol (Illumina) at the Molecular Genetics a mean of 30% and maintained a false discovery rate (FDR) of Q <
Laboratory at the Cincinnati Children’s Hospital. Illumina 450K 0.05 when considering individual tumor samples were retained
Human Methylation Array raw data files for additional AML sam- and classified as tumor specific.
ples and sorted healthy populations were obtained from previous-
ly published studies (Kulis et al. 2012; Reinius et al. 2012; The Gene expression analysis
Cancer Genome Atlas Research Network 2013; Schmutz et al.
2013; Leonard et al. 2014; Jung et al. 2015; Ferreira et al. 2016; Differential gene expression was performed using DESeq2 (Love
Qu et al. 2017). For the diagnosis/relapse validation cohort, gene et al. 2014) on raw counts were obtained from the Beat AML
mutation data for 33 patients at diagnosis, remission, and relapse Consortium (Tyner et al. 2018). Samples within each epitype
were obtained from Greif et al. (2018) along with Illumina methyl- were treated as biological replicates and compared to HSPCs.
ation array beta values composing the epityping signature. Differentially expressed genes were defined as greater than twofold
Patients were excluded from the study that did not show high fre- change and FDR Q < 0.01 were used. The upstream regulator tool in
quency tumor-specific mutations (VAF > 0.3) at both diagnosis and the Ingenuity Pathway Analysis software was used to interpret the
relapse. The absence of tumor-specific mutations at remission were results. LSC17 score was calculated using the 17 genes weighted by
also required to indicate clearance of tumor cells following treat- regression coefficients as reported in Ng et al. (2016). Beat AML ex-
ment. Data from the Infinium methylationEPIC Array and pression value was calculated from RPKM-normalized RNA-seq
Illumina HumanMethylation450 Array were normalized by the data (Tyner et al. 2018), and TCGA was calculated from
beta mixture quantile (BMIQ) method (Teschendorff et al. 2013) Affymetrix U133 Plus 2 platform (The Cancer Genome Atlas
using the RnBeads analysis software package (Müller et al. 2019). Research Network 2013). The stem cell signature scores of Gal
Only intersecting probes on both platforms were included, and et al. (2006) and Gentles et al. (2010) were calculated by the medi-
probes targeting sex chromosomes, non-CpG sites, and single-nu- an expression of the genes in each gene set within each sample us-
cleotide polymorphisms were removed, resulting in a final probe ing RPKM-normalized RNA-seq data. ANOVA was used to
set of 426,862 probes. Heatmaps, t-SNE plots, and principal com- determine significant differences between epitypes, followed by
ponent analysis plots of combined data were visualized using the group-specific t-tests adjusting for multiple comparisons using
Qlucore Omics Explorer software. the Bonferroni method.
Gene mutation analysis
DNA methylation analysis
Annotation of genetic mutations and other aberrations were ob-
For clustering analysis, k-medoids-based clustering was used tained from each respective study where available (n = 511 samples
because of the uneven levels of similarity within clusters. An total) (The Cancer Genome Atlas Research Network 2013;
Auer-Gervini plot was used to identify the minimum number of di- Schmutz et al. 2013; Jung et al. 2015; Eisfeld et al. 2017; Tyner
mensions as the first long step, determined by twice the length of et al. 2018). For the analysis of paired diagnosis and relapse sam-
the average (Wang et al. 2018). k was set using silhouette analysis ples from Ohio State University, a panel of 80 genes including
(Rousseeuw 1987). common recurrent AML mutations was targeted using a capture
Transcription factor sequence motif enrichment for known oligo-based approach followed by sequencing on the MiSeq plat-
motifs was performed using HOMER software (Heinz et al. 2010). form (Illumina) as previously described in Eisfeld et al. (2017).
Windows containing 100 bp of sequence upstream of and down- For paired diagnosis and relapse samples from the Beat AML pro-
stream from selected probes were searched against a background ject, mutation data were obtained from published whole exome
assembled from the remaining probes that were adjusted for GC data (Tyner et al. 2018).
and CpG content as well as a similar methylation distribution in
HSPCs. Motifs with a high degree of similarity were replaced
with a single consensus motif. Chromatin states were defined us- Data access
ing the standard 15-state model previously described using the
All raw and processed sequencing data generated in this study have
ChromHMM algorithm (Ernst et al. 2011). Chromatin states
been submitted to the NCBI Gene Expression Omnibus (GEO;
were defined in three HSPC samples using data available through
https://www.ncbi.nlm.nih.gov/geo/) under accession number
the Roadmap Epigenomics Project (Roadmap Epigenomics
GSE159907.
Consortium et al. 2015). Enrichment analysis was performed using
the EpiAnnotator R version 4.02 package (Pageaud et al. 2018;
R Core Team 2021). Competing interest statement
To generate a DNA methylation signature that encompasses
normal hematopoietic development we used published methyla- The authors declare no competing interests.
tion array data from sorted healthy cell populations. We deter-
mined the probes significantly differentially methylated between
each cell population and HSPCs (20% methylation change, FDR
Acknowledgments
Q < 0.01). These individual probe lists were then combined to cre- We thank all the patients who contributed to this study. We also
ate the hematopoietic development signature (n = 28,361). To gen- thank the Beat AML Consortium and affiliated members for collab-
erate a normal myeloid development signature, we used the 5000 oration and support of the project. This work was supported by the
758 Genome Research
www.genome.orgYou can also read