Non-CG methylation and multiple histone profiles associate child abuse with immune and small GTPase dysregulation - Nature
←
→
Page content transcription
If your browser does not render page correctly, please read the page content below
ARTICLE
                  https://doi.org/10.1038/s41467-021-21365-3                 OPEN

                  Non-CG methylation and multiple histone profiles
                  associate child abuse with immune and small
                  GTPase dysregulation
                  Pierre-Eric Lutz 1,8,11, Marc-Aurèle Chay1,11, Alain Pacis2, Gary G. Chen1, Zahia Aouabed1,
                  Elisabetta Maffioletti3, Jean-François Théroux1, Jean-Christophe Grenier 2,9, Jennie Yang1, Maria Aguirre4,
                  Carl Ernst 1,5, Adriana Redensek6, Léon C. van Kempen4, Ipek Yalcin7, Tony Kwan 6, Naguib Mechawar1,5,
                  Tomi Pastinen6,10 & Gustavo Turecki 1,5 ✉
1234567890():,;

                  Early-life adversity (ELA) is a major predictor of psychopathology, and is thought to increase
                  lifetime risk by epigenetically regulating the genome. Here, focusing on the lateral amygdala,
                  a major brain site for emotional homeostasis, we describe molecular cross-talk among
                  multiple mechanisms of genomic regulation, including 6 histone marks and DNA methylation,
                  and the transcriptome, in subjects with a history of ELA and controls. In the healthy brain
                  tissue, we first uncover interactions between different histone marks and non-CG methyla-
                  tion in the CAC context. Additionally, we find that ELA associates with methylomic changes
                  that are as frequent in the CAC as in the canonical CG context, while these two forms of
                  plasticity occur in sharply distinct genomic regions, features, and chromatin states. Com-
                  bining these multiple data indicates that immune-related and small GTPase signaling path-
                  ways are most consistently impaired in the amygdala of ELA individuals. Overall, this work
                  provides insights into genomic brain regulation as a function of early-life experience.

                  1 McGill Group for Suicide Studies, Douglas Mental Health University Institute, McGill University, Montréal, Canada. 2 Department of Genetics, CHU Sainte-

                  Justine Research Center, Montréal, Canada. 3 Genetics Unit, IRCCS Istituto Centro San Giovanni di Dio Fatebenefratelli, Brescia, Italy. 4 Segal Cancer Centre,
                  Lady Davis Institute, Jewish General Hospital, McGill University, Montréal, Canada. 5 Department of Psychiatry, McGill University, Montréal, Canada.
                  6 Department of Human Genetics, McGill University, Montréal, Canada. 7 Centre National de la Recherche Scientifique, Institut des Neurosciences Cellulaires

                  et Intégratives, Université de Strasbourg, Fédération de Médecine Translationnelle de Strasbourg, Strasbourg, France. 8Present address: Centre National de la
                  Recherche Scientifique, Institut des Neurosciences Cellulaires et Intégratives, Université de Strasbourg, Fédération de Médecine Translationnelle de
                  Strasbourg, Strasbourg, France. 9Present address: Institut de Cardiologie de Montréal, Montréal, Canada. 10Present address: Center for Pediatric Genomic
                  Medicine, University of Missouri-Kansas City School of Medicine, Kansas City, MO, USA. 11These authors contributed equally: Pierre-Eric Lutz, Marc-
                  Aurèle Chay. ✉email: gustavo.turecki@mcgill.ca

                  NATURE COMMUNICATIONS | (2021)12:1132 | https://doi.org/10.1038/s41467-021-21365-3 | www.nature.com/naturecommunications                                    1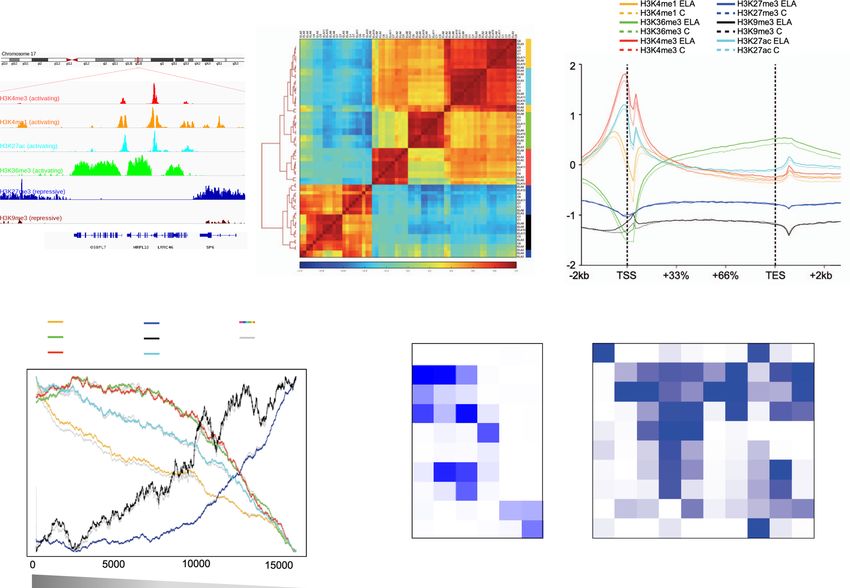
ARTICLE                                                                   NATURE COMMUNICATIONS | https://doi.org/10.1038/s41467-021-21365-3

E
       arly-life adversity (ELA), including sexual and physical               Altogether, these data uncover previously unforeseen sources of
       abuse, as well as other forms of child maltreatment, is a              epigenetic and transcriptomic plasticity, which may contribute to
       major public health problem that affects children of all               the severe and lifelong impact of ELA on behavioral regulation,
socio-economic backgrounds1. ELA is a strong predictor of                     and the risk of depression.
increased lifetime risk of negative mental health outcomes,
including depressive disorders2. Among other findings, a large
number of studies suggest an association between ELA and                      Results
morphological and functional changes in the amygdala3, a brain                Histone landscapes. Six histone modifications were assessed in
structure critically involved in emotional regulation4. It is possi-          depressed subjects with histories of ELA, and healthy controls (C)
ble, thus, that amygdala changes observed in individuals who                  with no such history (Supplementary Tables1 and 2). Because of
experienced ELA may contribute to increased risk of                           the small size of the lateral amygdala, and the significant amount
psychopathology.                                                              of tissue required for multiple immuno-precipitations and ChIP-
   The amygdala is composed of interconnected nuclei, among                   seq analysis of six marks, tissues were distributed into 7 ELA and
which the basal and lateral sub-divisions are responsible for                 4 C pools (see Supplementary Table 3). In contrast, WGBS and
receiving and integrating external information. In turn, these                RNA-Seq data (see below) were generated for each individual
nuclei innervate the central amygdala, the primary nucleus pro-               sample (C, n = 17; ELA, n = 21). Following the International
jecting outside the amygdalar complex to mediate behavioral                   Human Epigenome Consortium (IHEC) procedures, we achieved
outputs4. While specific properties of these nuclei remain difficult            >60 and >30 million reads for broad (H3K4me1, H3K36me3,
to assess in humans, animal studies indicate that the basal and               H3K27me3, and H3K9me3) and narrow (H3K27ac and
lateral sub-divisions exhibit differential responsivity to stress, in         H3K4me3) histone marks, respectively (4.0 billion reads total;
particular as a function of the developmental timing of exposure              Supplementary Fig. 1a and Supplementary Data 1). Quality
(adolescence versus adulthood)5,6. Here, we focused on homo-                  controls confirmed that all samples for the two narrow marks
geneous, carefully dissected tissue from the human lateral                    showed relative and normalized strand cross-correlations greater
amygdala.                                                                     than 0.8 and 1.05 (Supplementary Fig. 1b), respectively, according
   Childhood is a sensitive period during which the brain is more             to expectations14. Relative to genes (Fig. 1a, c), reads obtained for
responsive to the effect of life experiences7. Proper emotional               H3K27ac, H3K4me3 and H3K4me1 were strongly enriched
development is contingent on the availability of a supportive                 around Transcription Start Sites (TSS), while H3K27me3 and
caregiver, with whom children develop secure attachments8. On                 H3K36me3 showed antagonistic distributions, consistent with
the other hand, ELA signals an unreliable environment that                    patterns seen in other tissues10. Samples clustered by histone
triggers adaptive responses and deprives the organism of essential            mark, with a strong distinction between activating and repressive
experience. A growing body of evidence now supports the                       marks (Fig. 1b). To investigate the tissue specificity of our dataset,
hypothesis that epigenetic mechanisms play a major role in the                we compared it with data from other brain regions and blood
persistent impact of ELA on gene expression and behavior9.                    tissue (Supplementary Fig. 2). For each modification, we observed
While DNA methylation has received considerable attention,                    higher correlations among amygdalar samples (r = 0.75–0.92
available data also point toward histone modifications as another              across the six marks) than when compared with samples from
critical and possibly interacting factor9.                                    other brain regions (r = 0.51–0.81), and even lower correlations
   Therefore, in this study, we conduct a comprehensive char-                 with blood mononuclear cells (r = 0.35–0.64), consistent with the
acterization of epigenetic changes occurring in individuals with a            role of histones in tissue identity.
history of severe ELA and carry out genome-wide investigations                   We next investigated relationships between histones and gene
of multiple epigenetic layers, and their cross-talk. Using post-              expression (Fig. 1d). As expected, we observed activating
mortem brain tissue from a well-defined cohort of depressed                    functions for H3K27ac, H3K4me1, H3K36me3, and H3K4me3,
individuals with histories of ELA, and controls with no such                  and repressive functions for H3K27me3 and H3K9me3. Distinct
history, we characterize six histone marks, DNA methylation, as               correlative profiles were found between marks along the spectrum
well as their final endpoint at the gene expression level. We first             of gene expression, indicating that multiple marks likely better
generate data for six histone modifications: H3K4me1, H3K4me3,                 predict gene expression than individual ones. Comparisons
H3K27ac, H3K36me3, H3K9me3, and H3K27me310, using                             between ELA and C groups found no significant overall
chromatin immunoprecipitation sequencing (ChIP-Seq). This                     differences in terms of read distribution (Fig. 1c) or relationship
allows us to create high-resolution maps for each mark, and to                to gene expression (Fig. 1d), indicating that ELA does not globally
define chromatin states throughout the epigenome. In parallel, we              reconfigure amygdalar histone landscapes.
characterize DNA methylation using whole-genome bisulfite                         Considering that different combinations of histone modifica-
sequencing (WGBS). While previous studies in psychiatry                       tions define so-called “chromatin states”, we then conducted an
focused on the canonical form of DNA methylation that occurs at               integrative analysis of all marks using ChromHMM15. Maps of
CG dinucleotides (mCG), here we investigate both CG and non-                  chromatin states were generated as described previously16, with
CG contexts. Indeed, recent data has shown that non-CG                        each state corresponding to a distinct combination of individual
methylation is not restricted to stem cells, and can be detected              marks. This unbiased approach defined a consensus map
in brain tissue at even higher levels11. Available evidence also              (corresponding to regions showing ≥50% agreement across all
indicates that it progressively accumulates, preferentially in                samples; see Fig. 1e, Supplementary Fig. 3a–d and “Methods”)
neurons, during the first decade of life12,13, a period when ELA               consistent with studies in the brain and other tissues: for
typically occurs. Thus, we postulate that changes in non-CG                   example16–18, regions defined by H3K27ac and H3K4me1, or by
methylation might contribute to lifelong consequences of ELA,                 H3K36me3, corresponded to known enhancers (Gen Enh and
and focus in particular on the CAC context, where non-CG                      Enh) and transcribed regions (Str-Trans and Wk-Trans),
methylation is most abundant. Our results indicate that ELA                   respectively (Supplementary Fig. 3e, f)19. Compared with known
leaves distinct, albeit equally frequent, traces at CG and CAC                genomic features (Fig. 1f), this map showed expected enrichments
sites. Further, analyses of all epigenetic layers and the tran-               of promoter chromatin states (Act, Wk, or Flk-Prom) at
scriptome converge to identify immune system processes and                    transcription start sites and CpG islands, and of transcription
small GTPases as critical pathways associated with ELA.                       states (Str-Trans and Wk-Trans) within genes. Finally, the

2                 NATURE COMMUNICATIONS | (2021)12:1132 | https://doi.org/10.1038/s41467-021-21365-3 | www.nature.com/naturecommunications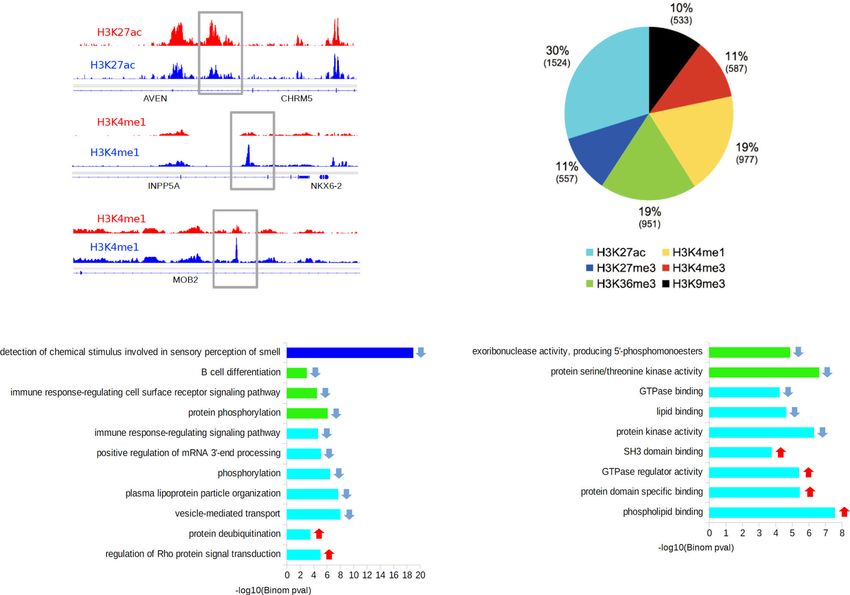
NATURE COMMUNICATIONS | https://doi.org/10.1038/s41467-021-21365-3 ARTICLE
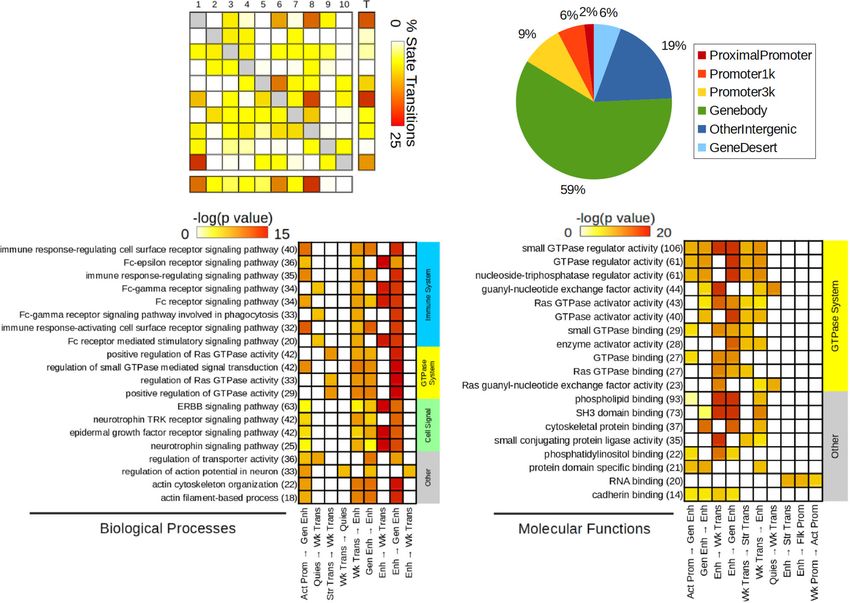
Fig. 1 Characterization of six histone post-translational modifications in the human brain lateral amygdala. a Snapshot of typical ChIP-seq read
distribution for the six histone marks. b Unsupervised hierarchical clustering using Pearson correlations for all marks. Correlations were computed using
read number per 10 kb-bins across the whole genome and normalized to input and library size. Note the expected separation between activating (H3K27ac,
H3K36me3, H3K4me1, H3K4me3) and repressive (H3K27me3, H3K9me3) marks. c Average enrichment over the input of ChIP-seq reads across all gene
bodies and their flanking regions (+/− 2 kilobases, kb) in the human genome, for each histone mark. Note the expected biphasic distribution of reads
around the TSS for H3K27ac, H3K4me3, and H3K4me1. No significant differences were observed for any mark across C and ELA groups (two-sided two-
way repeated-measures ANOVA, group effects: H3K4me1, P = 0.89; H3K36me3, P = 0.87; H3K4me3, P = 0.64; H3K27me3, P = 0.35; H3K9me3, P =
0.88; H3K27ac, P = 0.86). Averages for the healthy controls group (C) are shown as dashed lines, while averages for the early-life adversity group (ELA)
are shown as solid lines. d Average enrichment of reads over gene bodies (for H3K27me3, H3K36me3, H3K4me1, and H3K9me3) or TSS + /− 1 kb (for
H3K27ac and H3K4me3) for all genes ranked from most highly (left) to least (right) expressed. Strongly significant effects of gene ranking on ChIP-Seq
reads were observed for all marks (P < 0.0001). Again, no difference was observed as a function of ELA for any group (two-sided two-way repeated-
measures ANOVA, group effects: H3K4me1, P = 0.66; H3K36me3, P = 0.67; H3K4me3, P = 0.98; H3K27me3, P = 0.31; H3K9me3, P = 0.74; H3K27ac,
P = 0.48). e ChromHMM emission parameters (see main text and “Methods”) for the 10-state model of chromatin generated using data from the six
histone marks, at a resolution of 200 bp, as described previously16. Maps of chromatin states have already been characterized in other brain regions (e.g.,
cingulate cortex, caudate nucleus, substantia nigra49) but, to our knowledge, not in the amygdala. f Intersections of chromatin states with gene features
(from RefSeq) and methylomic features (lowly methylated and unmethylated regions, LMR and UMR, defined using methylseekR; see “Methods”) were
computed using chromHMM’s OverlapEnrichment function. As expected, CpG-dense UMRs mostly overlapped with Promoter chromatin states, while
LMRs associated with more diverse chromatin states, including Enhancers (Fig. 1f and Supplementary Fig. 10a), consistent with their role as distant
regulatory sites31. Act-Prom active promoter, Enh enhancer, Flk-Prom flanking promoter, Heterochr heterochromatin, LADs lamina-associated domains,
PcR polycomb repressed, Str-Enh strong enhancer, Str-Trans strong transcription, TES transcription end site, TSS transcription start site, Wk-Prom weak
promoter, Wk-Trans weak transcription. Source data are provided as a Source Data file.
chromatin states exhibit expected correlations with gene expres- diversity met IHEC standards and were similar across groups
sion (Supplementary Fig. 4). As detailed below, these maps (Supplementary Fig. 5a–d). In this large dataset, >13 million CGs
allowed us to characterize cross-talks between chromatin and showed an average coverage ≥5 in the cohort (Supplementary
DNA methylation, and differences between groups. Fig. 5e), which favorably compares with recent human brain
studies in terms of sample size20 or CGs covered21,22.
Because non-CG methylation is enriched in mammalian
CG and non-CG methylation patterns. We used WGBS to brains11,23, we first computed average genome-wide levels of
characterize the amygdala methylome (C, n = 17; ELA, n = 21). methylation in multiple cytosine contexts. Focusing on three-
Rates of bisulfite conversion, sequencing depth, and library letter contexts (Fig. 2a), we observed that, as expected,
NATURE COMMUNICATIONS | (2021)12:1132 | https://doi.org/10.1038/s41467-021-21365-3 | www.nature.com/naturecommunications 3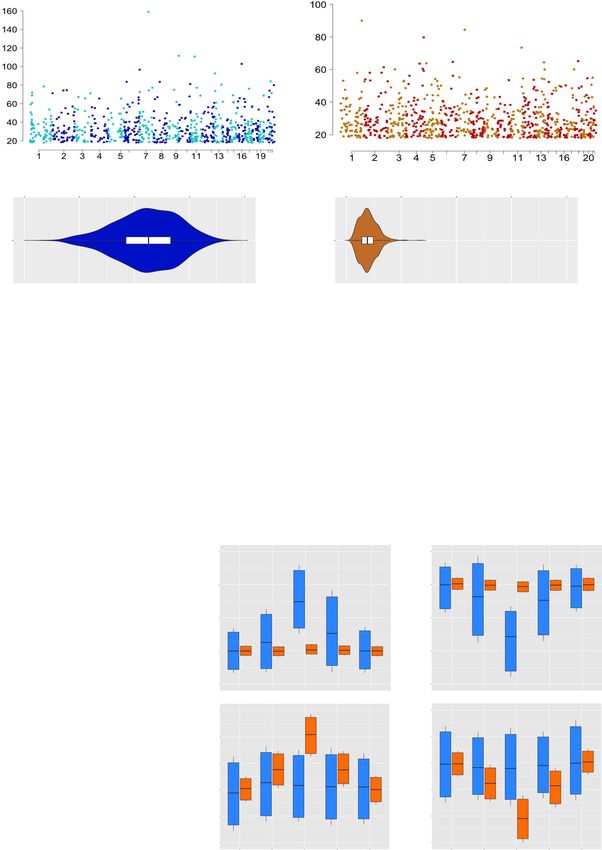
ARTICLE                                                                    NATURE COMMUNICATIONS | https://doi.org/10.1038/s41467-021-21365-3

Fig. 2 Characterization of non-CG methylation in the human brain lateral amygdala. a Average genome-wide levels of DNA methylation were measured
among the sixteen three-letter cytosine contexts (CNN, where N stands for any base) in the human brain lateral amygdala, using whole-genome bisulfite
sequencing. While highest DNA methylation levels were observed in the four CGN contexts (CGC: 84.1 ± 0.2%; CGA: 81.9 ± 0.1%; CGC: 81.4 ± 0.2%, CGT:
80.2 ± 0.1%; mean ± sem in the whole cohort), detectable non-CG methylation was also observed in CHN context (where H stands for A, C, and T), most
notably at CAC sites (4.1 ± 0.1% in combined control, C, and early-life adversity, ELA, groups; n = 38 subjects total), with no detectable differences
between groups for any context (two-way repeated-measures ANOVA; group effect: [F(1,36) = 0.12; P = 0.73]). b DNA methylation in the CG context
mostly corresponded to highly methylated sites. In contrast, as previously described in the mouse hippocampus29, most CAC sites were unmethylated (c),
with only a minority of them showing low methylation levels, between 10 and 20% (n = 38 subjects). This likely reflects the fact that non-CG methylation
does not occur in all cell types, and is notably enriched in neuronal cells and, to a lesser extent, in glial cells11. In the CG or CAC contexts (two-way
ANOVA; group effect: CG, [F(1,720) = 5.0E-11; P > 0.99]; CAC, [F(1,36) = 0; P > 0.99]), ELA did not associate with any significant change in these global
distributions. Box plots show median and interquartile range, with whiskers representing minimum and maximum values. d In both contexts, patterns of
DNA methylation along gene bodies showed the expected anti-correlation with gene expression, as shown here comparing 1000 most highly (top 1000) or
lowly (bottom 1000) expressed genes, consistent with previous rodent data. In the CG (e) or CAC (f) contexts, no difference in DNA methylation levels
was observed between C and ELA groups for any chromatin state (values are mean ± sem in each C or ELA group; n = 17 and 21 subjects, respectively). We
observed, however, dissociations in the relationship of DNA methylation and histone marks across the CG and CAC contexts (see main text). Values are
mean ± sem. Act-Prom active promoter, Enh enhancer, Flk-Prom flanking promoter, Heterochr heterochromatin, PcR polycomb repressed, Str-Enh strong
enhancer, Str-Trans strong transcription, TES transcription end site, TSS transcription start site, Wk-Prom weak promoter, Wk-Trans weak transcription.
Source data are provided as a Source Data file.

methylation levels were highly variable among the 16 possibilities             methylation (hereafter mCAC) was most abundant, we focused
(two-way ANOVA; context effect: [F(15,540) = 196283; P <                       on this context.
0.0001]), with much higher methylation levels in the CGN                          We first compared mCG and mCAC. While CG sites were
contexts than in the 12 non-CG contexts. Of note, no difference                highly methylated, CAC (Fig. 2b, c) or other non-CG (Supple-
was found in overall methylation between groups ([F(1,36) =                    mentary Fig. 6c) sites were mostly unmethylated, with a minority
0.12; P = 0.73]), indicating that ELA does not associate with a                of them showing methylation levels between 10 and 20%,
global dysregulation of the methylome. Among non-CG contexts,                  consistent with mouse data29. Regarding distinct genomic
as previously described by others in mice24 or humans25,26                     features and chromosomal location, we confirmed that (i) while
(Supplementary Fig. 6a, b), methylation levels were highest at                 mCG is lower within promoters, this effect is much less
CACs (4.1 ± 0.1%), followed by a group of contexts between 1.8                 pronounced for mCAC (Supplementary Fig. 7a)11; (ii) compared
and 1.1% (CTC, CAG, CAT, and CAA), and remaining ones                          with CGs30, depletion of methylation from pericentromeric
below 0.4%. Considering that methylation at CA27 or CAC28 sites                regions is even stronger at CACs, and (iii) as expected,
may have specific functions in the brain, and because CAC                       methylation levels were very low in both contexts in the

4                  NATURE COMMUNICATIONS | (2021)12:1132 | https://doi.org/10.1038/s41467-021-21365-3 | www.nature.com/naturecommunications
NATURE COMMUNICATIONS | https://doi.org/10.1038/s41467-021-21365-3                                                                 ARTICLE

mitochondrial genome (Supplementary Fig. 7b). We also                            P = 0.55]) or mCAC ([F(1,36) = 0.07; P = 0.80]) were observed
confronted methylation data with gene expression, regardless of                  across C and ELA groups for any state.
group status, and found the expected anti-correlation in both
contexts (Fig. 2d; CG: [F(1,37) = 557; P = 6.7E-24]; CAC: [F
                                                                                 Changes in histone marks and chromatin states as a function
(1,37) = 3283; P = 9.7E-38]). Because CAC sites, in contrast with
                                                                                 of ELA. We investigated local histone adaptations in ELA subjects
CGs, are asymmetric on the two DNA strands, we wondered
                                                                                 using diffReps34. A total of 5126 differential sites (DS) were
whether this anti-correlation would be different when contrasting
                                                                                 identified across the 6 marks (Fig. 3a, b, Supplementary Fig. 11,
gene expression with mCAC levels on its sense or antisense
                                                                                 and Supplementary Data 2) using consensus significance
strand (Supplementary Fig. 8). No difference was found,
                                                                                 thresholds35 (P < 10−4, FDR-q < 0.1). H3K27ac contributed to
indicating that gene expression is predicted to the same extent
                                                                                 30% of all DS, suggesting a prominent role of this mark. Anno-
by mCAC on either strand, at least for the coverage achieved here.
                                                                                 tation to genomic features revealed distinct distributions of DS
Finally, we used methylseekR to characterize active regulatory
                                                                                 across marks (df = 25, χ2 = 1244, P < 0.001; Supplementary
sites in the human brain defined as unmethylated (UMR) and
                                                                                 Fig. 12a): H3K4me1- and H3K4me3-DS were equally found in
lowly methylated (LMR) regions (Supplementary Fig. 9a–e). As
                                                                                 promoter regions and gene bodies, while H3K36me3- and
observed in other tissues, CG-dense UMRs mostly overlapped
                                                                                 H3K27ac-DS were highly gene-body enriched, and H3K27me3-
with CpG islands and promoter chromatin states (Fig. 1f,
                                                                                 and H3K9me3-DS found in intergenic/gene desert regions. Sites
Supplementary Fig. 9d, and Supplementary Fig. 10a), while
                                                                                 showing enrichment (up-DS) or depletion (down DS) of reads in
LMRs associated with more diverse states (including enhancers;
                                                                                 ELA subjects were found for each mark, with an increased pro-
Supplementary Fig. 1f, and Supplementary Fig. 10a), consistent
                                                                                 portion of down DS associated within H3K4me1, H3K4me3,
with their role as distant regulatory sites31. Among each LMR and
                                                                                 H3K36me3, and H3K27me3 changes (Supplementary Fig. 12b).
UMR category, significant variations in levels of mCG or mCAC
                                                                                    We then used GREAT (Supplementary Data 3), a tool that
were observed across various chromatin states (Supplementary
                                                                                 maps regulatory elements to genes based on proximity, to test
Fig. 9f). Regarding individual histone marks at LMR and UMR,
                                                                                 whether ELA subjects had histone modifications affecting genes
we further documented specific associations, including patterns of
                                                                                 in specific pathways36. We performed this GO analysis on each
depletion and enrichment specific to UMR shores not character-
                                                                                 mark and found significant enrichments for three of them
ized previously (see Supplementary Fig. 10b–g for details).
                                                                                 (Fig. 3c, d). Importantly, overlaps between enriched GO terms
Overall, these differences and similarities between mCG and
                                                                                 were observed across these three marks: notably, terms related to
mCAC extend previous results obtained in smaller cohorts of
                                                                                 immune processes, as well as small GTPases and Integrin
mouse or human samples29,32.
                                                                                 signaling (Supplementary Fig. 12c) were enriched for
   Regarding histone modifications, while mechanisms mediating
                                                                                 H3K36me3- and H3K27ac-DS, suggesting these pathways may
their interactions with mCG have been documented, no data are
                                                                                 play a significant role in ELA.
available to describe such a relationship for non-CG contexts. To
                                                                                    To strengthen these findings, a complementary analysis was
address this gap, we confronted our consensus model of
                                                                                 conducted using chromatin state maps15. First, we identified
chromatin states with DNA methylation (Fig. 2e, f). Levels of
                                                                                 genomic regions where a state transition (ST; n = 61,922)
mCG ([F(9,324) = 5127; P < 0.0001]) and mCAC ([F(9,324) =
                                                                                 occurred between groups (Supplementary Data 4). Across the
910.7; P < 0.0001]) strongly differed between states, unraveling
                                                                                 90 possible ST in our 10-state model, only 56 were observed, with
previously uncharacterized patterns. First, the lowest levels of
                                                                                 a high proportion (50.2%; * in Fig. 4a) involving regions in
mCG were found in the three promoter states (Fig. 2e),
                                                                                 quiescent (Quies), Wk-Trans or Enh states in the C group that
corresponding to a strong anti-correlation between DNA
                                                                                 mostly turned into Quies, Str-Trans, Wk-Trans, and Heteroch
methylation and both forms of H3K4me1,3 methylation,
                                                                                 states in the ELA group. Furthermore, 17% and 59% of ST
consistent with previous findings in other cell types33. Accord-
                                                                                 occurred in regions within 3 kb of a promoter or in gene bodies
ingly, these three promoter states were defined (Fig. 1e) by high
                                                                                 (Fig. 4b), respectively, suggesting that ELA-associated changes
levels of H3K4me3 in combination with either: (i) high H3K4me1
                                                                                 affected selected chromatin states, and mostly occurred within
(flanking promoter, Flk-Prom; P < 0.0001 for every post hoc
                                                                                 genes.
comparison, except against the Polycomb repressed state, PcR);
                                                                                    We next investigated GO enrichment of ST using GREAT
(ii) high H3K27ac (active promoter, Act-Prom; P < 0.0001 for
                                                                                 (Fig. 4c, d, Supplementary Data 5) and a co-occurrence score
every comparison against other states), or (iii) intermediate levels
                                                                                 reflecting both the significance of GO terms and their recurrence
of both H3K27ac and H3K4me1 (weak promoter, Wk-Prom; P <
                                                                                 across multiple ST35. Importantly, biological processes (Fig. 4c)
0.0001 against other states). In contrast, among these three
                                                                                 with the highest co-occurrence scores were similar to those found
promoter states, mCAC was particularly enriched in Wk-Prom
                                                                                 from the GO analysis of individual histone marks, and clustered
regions (P < 0.0001 against Act-Prom and Flk-Prom; Fig. 2f,
                                                                                 in two main categories: immune system and small GTPases.
Supplementary Fig. 3d). Second, mCG was abundant in
                                                                                 These terms were significant for ST involving transcription,
transcribed regions defined by either intermediate (weak
                                                                                 quiescent, and enhancer states. Regarding molecular functions
transcription, Wk-Trans) or high (strong transcription, Str-
                                                                                 (Fig. 4d), most enriched categories were related to GTPases, and
Trans) H3K36me3. By contrast, mCAC was selectively decreased
                                                                                 involved the same types of ST. Therefore, analyses of individual
in the Str-Trans state (P < 0.0001 against Wk-Trans). Third, while
                                                                                 histone marks and chromatin states converged to suggest
mCG levels were high in heterochromatin (Heteroch, defined by
                                                                                 impairments in similar GO pathways.
high H3K9me3), consistent with its role in chromatin condensa-
tion, mCAC appeared depleted from these regions (P < 0.0001 for
every comparison against other states, except PcR and Flk-Prom).                 Differential DNA methylation in ELA. We next sought to
These results indicate that interactions between DNA methyla-                    identify changes in DNA methylation. As mCG and mCAC were
tion, histones, and chromatin strikingly differ across mCG and                   very different, and considering data suggesting possible mCAC-
mCAC, possibly as a result of brain-specific epigenetic processes                 specific processes28, we used BSmooth37 to identify DMRs
in the latter three-letter context32. Finally, as expected, ELA                  separately in each context, with strictly similar parameters (see
did not associate with a global disruption of this cross talk,                   “Methods”). DMRs were defined as regions of ≥5 clustered
as no changes in genome-wide levels of mCG ([F(1,36) = 0.36;                     cytosines that each exhibited a significant group difference in

NATURE COMMUNICATIONS | (2021)12:1132 | https://doi.org/10.1038/s41467-021-21365-3 | www.nature.com/naturecommunications                        5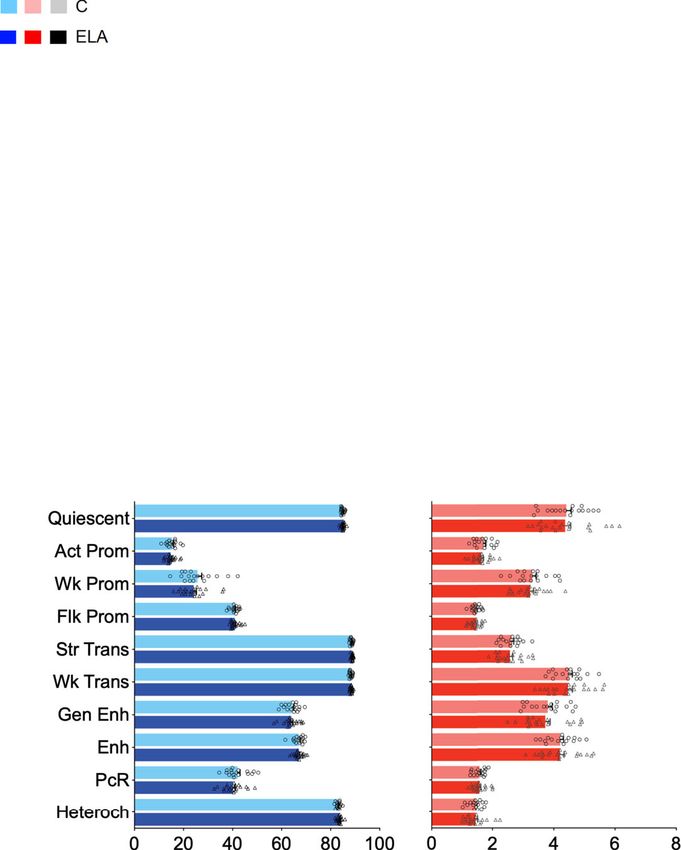
ARTICLE                                                                     NATURE COMMUNICATIONS | https://doi.org/10.1038/s41467-021-21365-3

Fig. 3 Analysis of genomic sites showing differential enrichment for individual histone marks in subjects with a history of early-life adversity (ELA).
a Representation of three top Differential Sites (DS), identified using diffReps34. ELA is shown in red, healthy controls (C) are shown in blue. Gray
rectangles delineate the coordinates of each DS. b Relative proportion of DS contributed by each histone mark. Percentages of the total number of DS, and
absolute number of DS (in brackets) are shown for each mark. Both depletion- and enrichment-DS were observed for each of the six marks (Supplementary
Fig. 12b). Among genes most strongly affected (Supplementary Table 5), several have been previously associated with psychopathology, such as QKI
(H3K27ac top hit)40,95 or HTR1A (H3K4me3 top hit)96. c, d Top five most significant non-redundant gene ontology “Biological Processes” (c) or
“Molecular Functions” (d) terms enriched for each histone mark DS, as identified by GREAT36 using hypergeometric and binomial testing (fold change ≥
1.5 and FDR-q ≤ 0.1 for both tests). Surprisingly, the single most significant result implicated epigenetic dysregulation of odor perception in ELA subjects
(consistent with recent clinical studies97), while immune processes (indicated by *), and small GTPases (+) were consistently found affected across
different marks. Negative logarithmic P values are shown for binomial testing. The color indicates histone mark concerned, arrows indicate the direction of
event: terms associated with depletion- (down arrow) or enrichment-DS (up arrow). Source data are provided as a Source Data file.

methylation (P < 0.001). Also, because age and sex are known to                 Further strengthening differences between the two contexts,
affect DNA methylation38,39, generalized linear models were                     CG- and CAC-DMRs showed no genomic overlap (Supplemen-
computed for each DMR, and only those that remained sig-                        tary Fig. 13e) and very distinct distributions among UMR and
nificant when taking these two covariates into account were kept                 LMR features (Fig. 5g). Finally, when considered collectively,
for downstream analyses. Surprisingly, we found that as many                    genomic regions where CG-DMRs were identified as a function of
DMRs could be identified in the CAC (n = 840) as in the cano-                    ELA showed no group difference in the CAC context (and vice
nical CG (n = 795) context, suggesting that cytosines in the CAC                versa for mCG levels at CAC-DMRs; see Fig. 5h), indicating that
context may represent a significant form of plasticity.                          ELA-related processes do not simultaneously affect both cytosine
   While both types of DMRs were similarly abundant and                         contexts.
distributed throughout the genome (Fig. 5a, b), they nevertheless                  We next characterized genomic features where DMRs occurred
showed striking differences. Compared with CG-DMRs, CAC-                        and observed that their distribution again strikingly differed (P <
DMRs were composed of slightly fewer cytosines (Supplementary                   2.2E-16; Fig. 6a, b, Supplementary Table 9): CG-DMRs were
Fig. 13a, P = 2.9E-04) and smaller (Supplementary Fig. 13b, P <                 located in promoters (38.5% in the proximal promoter,
2.2E-16). CG-DMRs also affected sites showing a wide range of                   promoter1k and promoter3k) and gene bodies (35.4%), while
methylation levels, while CAC-DMRs were located in lowly                        CAC-DMRs were mostly in gene bodies (53%) and intergenic
methylated regions (Fig. 5c, d), consistent with genome-wide                    regions (28.1%). Second, we characterized histone modifications
lower mCAC levels. In addition, the magnitude of methylation                    around DMRs (Fig. 6c, d, and Supplementary Fig. 14): CG-DMRs
changes detected in the ELA group were less pronounced in the                   were enriched with H3K4me1, H3K4me3 and H3K27ac (Fig. 6c),
CAC context, with smaller % changes (P < 2.2E-16; Fig. 5e, f and                coherent with our observations that these histone marks (Fig. 1e)
Supplementary Fig. 13c) and areaStat values (the statistical                    and DMRs (Fig. 6a) preferentially located at promoters. In sharp
strength of DMRs37; P = 5.8E-08, Supplementary Fig. 13d).                       contrast, the two main features characterizing CAC-DMRs were

6                   NATURE COMMUNICATIONS | (2021)12:1132 | https://doi.org/10.1038/s41467-021-21365-3 | www.nature.com/naturecommunications
NATURE COMMUNICATIONS | https://doi.org/10.1038/s41467-021-21365-3                                                                       ARTICLE

Fig. 4 Analysis of genomic sites showing a switch between chromatin states as a function of early-life adversity (ELA). a Percentage of each state
transition (ST) type relative to the total number of transitions. For the healthy control (C) versus ELA group comparison, the cumulative percentages of ST
from a specific state to any other state are shown in the “Total” and “T” rows/columns. * indicates most frequent STs (see main text). b Distribution of ST
localizations relative to genomic features, assessed using region_analysis34 (see “Methods”). c, d Gene ontology “Biological Processes” (c) or “Molecular
Functions” (d) terms significantly associated with at least three types of ST (for each ST type, each GO term met the following criteria: fold change ≥ 1.5
and FDR-q ≤ 0.1, for both hypergeometric and binomial tests). Terms are grouped based on the overall system involved and ranked by co-occurrence score
(in parentheses after each term), which reflects both their significance and their recurrence across multiple ST (see main text and ref. 35). Individual
binomial P values for each type of ST and each term are shown by the color gradient. Immune-related and small GTPase terms were most strongly affected,
across multiple ST. Of note, a complementary GREAT pathway analysis using MSigDB further strengthened these findings by revealing recurrent
enrichment of the integrin signaling pathway (across six types of ST, as well as for H3K27ac down DS; see Supplementary Fig. 12c), which is known to
interact extensively with small GTPases98. Act-Prom active promoter, Enh enhancer, Flk-Prom flanking promoter, Heterochr heterochromatin, PcR
polycomb repressed, Str-Enh strong enhancer, Str-Trans strong transcription, Wk-Prom weak promoter, Wk-Trans weak transcription. Source data are
provided as a Source Data file.

an enrichment in H3K36me3 and a depletion in H3K9me3                             previously observed with histone DS and ST. Altogether, while
(Fig. 6d and Supplementary Fig. 14d, f). These differences were                  ELA associates with similar numbers of mCG and mCAC
further supported by the analysis of chromatin states (P < 2.2E-                 adaptations, these two types of plasticity occur in genomic regions
16; Fig. 6e, Supplementary Fig. 14g, and Supplementary Table 10).                characterized by different histone marks, chromatin states, and
CAC-DMRs were largely absent from promoter (Act-Prom, Flk-                       GO categories, possibly reflecting the implication of distinct
Prom, and Wk-Prom) and enhancer (Str-Enh and Enh) states                         molecular mechanisms.
that were all defined, to varying degrees, by the three marks that
primarily characterize CG-DMRs: H3K4me1, H3K4me3, and
H3K27ac (Fig. 1e). In addition, CAC-DMRs were (i) enriched in                    Differential gene expression in ELA and combined GO ana-
the Wk-Trans state, defined by the presence of H3K36me3, and                      lyses. Analyses of histones and DNA methylation identified GO
(ii) depleted from the two states (PcR, Heteroch) characterized by               terms consistently affected in ELA individuals. To determine how
H3K9me3.                                                                         these epigenetic adaptations may ultimately modulate amygdalar
   Finally, we conducted a GREAT analysis of GO terms enriched                   function, we characterized gene expression in C (n = 17) and
for DMRs: CG-DMRs notably associated with terms related to the                   ELA (n = 21) groups using RNA-Sequencing. Samples with
regulation of neuronal transmembrane potential (Fig. 6f and                      similar RNA integrity across groups were sequenced at >50
Supplementary Data 6), in agreement with histone results                         million reads/sample (Supplementary Fig. 15). Quantification of
(Fig. 4c), while CAC-DMRs were enriched for terms related to                     gene expression was conducted using HTSeq-count40 and vali-
glial cells (Fig. 6g), consistent with the immune dysregulation                  dated by an alternative pseudo-alignment approach, Kallisto41,

NATURE COMMUNICATIONS | (2021)12:1132 | https://doi.org/10.1038/s41467-021-21365-3 | www.nature.com/naturecommunications                                 7
ARTICLE                                                                  NATURE COMMUNICATIONS | https://doi.org/10.1038/s41467-021-21365-3

generating very similar results (r = 0.82, P < 2.2E-16; Supple-              identified numerous terms consistent with previous analyses at
mentary Fig. 16a). A differential expression analysis between                the epigenetic level, including immune and small GTPase func-
groups was then performed using DESeq2 (Supplementary                        tions (Fig. 7b). We also used GSEA42, which does not rely on an
Data 7). Similar to our epigenetic analyses, we searched for pat-            arbitrary threshold for significance, and takes the directionality of
terns of global functional enrichment, using GO and Gene Set                 gene expression changes into account. GSEA identified 163
Enrichment Analysis (GSEA)42. Enrichment of GO categories                    genome-wide significant sets, among which 109 were related to
using genes that showed nominal differential expression in the               immune processes and negatively correlated with ELA (Supple-
ELA group (P < 0.05, n = 735, Fig. 7a, Supplementary Data 8)                 mentary Data 9, Fig. 7c, d, Supplementary Fig. 16d, e). Therefore,

8                NATURE COMMUNICATIONS | (2021)12:1132 | https://doi.org/10.1038/s41467-021-21365-3 | www.nature.com/naturecommunications
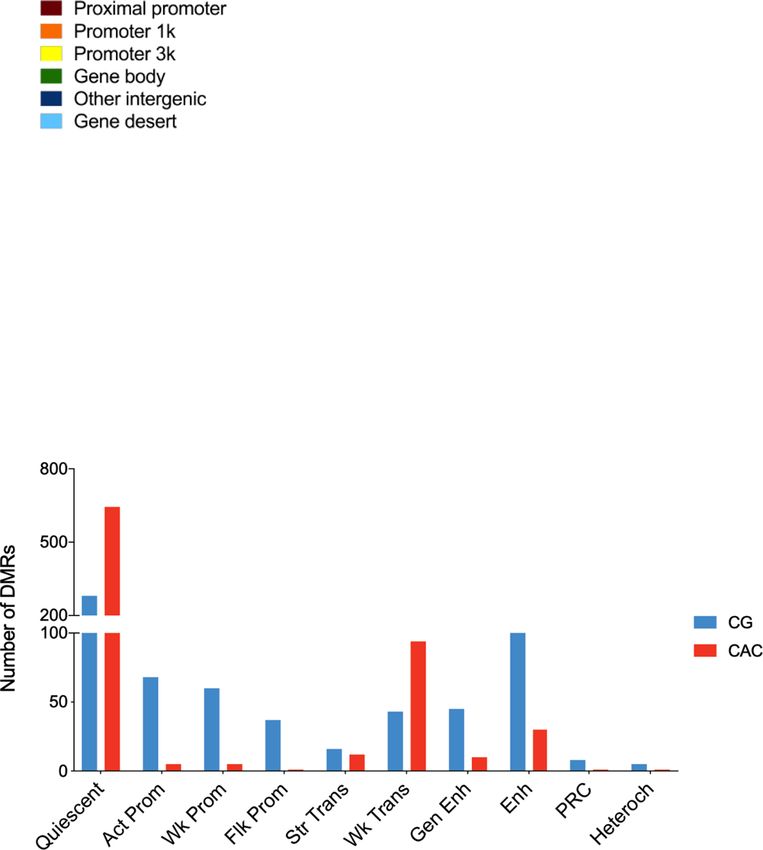
NATURE COMMUNICATIONS | https://doi.org/10.1038/s41467-021-21365-3                                                                     ARTICLE

Fig. 5 Differential DNA methylation in the CG and CAC contexts in subjects with a history of early-life adversity (ELA). a, b Manhattan plots of
differentially methylated regions (DMR) identified using the BSmooth algorithm in the CG and CAC contexts, comparing control (C) and ELA groups.
DMRs were identified separately in each context using the BSmooth algorithm37, with strictly similar parameters (see “Methods”). They were defined as
regions of ≥5 clustered cytosines that each exhibited a significant difference in methylation (P < 0.001) and an absolute methylation difference ≥1%
between groups. Surprisingly, as many DMRs were identified in the CAC context (n = 840) as in the canonical CG context (n = 795). c, d Methylation
abundance in the C group in regions where DMRs were identified in the CG and CAC contexts (n = 840 CAC-DMRs, n = 795 CG-DMRs). CG-DMRs
affected genomic sites showing a wide range of methylation levels (mean ± sem = 55.3 ± 0.5%), while CAC-DMRs occurred in lowly methylated regions
(mean ± sem = 10.0 ± 0.1%), resulting in significantly different distributions (Mann–Whitney U test: U = 686; P < 0.0001). Box and violin plots show
median and interquartile range (IQR), with whiskers representing 1.5 IQR. e DNA methylation differences observed in ELA subjects compared to the C
group in CG- and CAC-DMRs, as a function of the number of cytosines composing each DMR. f DNA methylation differences observed in ELA subjects
compared to the C group in CG- and CAC-DMRs, as a function of areaStat values, the measure of statistical significance of each DMR implemented by
BSmooth. g Distinct distributions (chi-square test: χ2 = 884.3, df = 2, P < 1E-15) of CG- and CAC-DMRs among lowly methylated (LMR) and unmethylated
(UMR) regions. h DNA methylation levels observed in CG and CAC contexts at DMRs (n = 840 CAC-DMRs, n = 795 CG-DMRs; raw, unsmoothed values)
and flanking regions (+/− 1.2 kilobases, kb). No average difference in mCAC levels was observed among C and ELA groups at CG-DMRs (upper panels)
that showed either increased (HYPER-DMR, left panels) or decreased (HYPO-DMR, right panels) levels of methylation in ELA subjects (and vice versa for
CAC-DMRs, lower panels). Box plots show median and interquartile range, with whiskers representing 0.1 IQR. Source data are provided as a Source
Data file.

Fig. 6 Individual histone marks and global chromatin states defining genomic regions where early-life adversity (ELA) associated with differential
DNA methylation. a, b Localization of differentially methylated regions (DMR) in genomic features, identified using region_analysis34. Distributions were
strongly different among CG and CAC contexts (chi-square test: χ2 = 221.2, df = 6, P < 2.2E-16). c, d Histone modifications measured at the level of DMRs
and their flanking regions (+/− 2 kilobases, kb). Distributions were very distinct between CG- and CAC-DMRs, with significant interactions between
cytosine context and cytosine position along DMRs, for each of the six marks (two-way repeated-measures ANOVA interactions, P < 0.0001 for all; see
also Supplementary Fig. 14a). Values are mean ± sem. e Chromatin states found at DMRs. Similarly, CG- and CAC-DMRs occurred in very different
chromatin states (chi-square test: χ2 = 390.4, df = 9, P < 2.2E-16). f, g Gene Ontology analysis of CG- and CAC-DMRs using GREAT36 (see main text).
Act-Prom active promoter, Enh enhancer, Flk-Prom flanking promoter, Heterochr heterochromatin, PcR polycomb repressed, Str-Enh strong enhancer, Str-
Trans strong transcription, Wk-Prom weak promoter, Wk-Trans weak transcription. Source data are provided as a Source Data file.

NATURE COMMUNICATIONS | (2021)12:1132 | https://doi.org/10.1038/s41467-021-21365-3 | www.nature.com/naturecommunications                              9
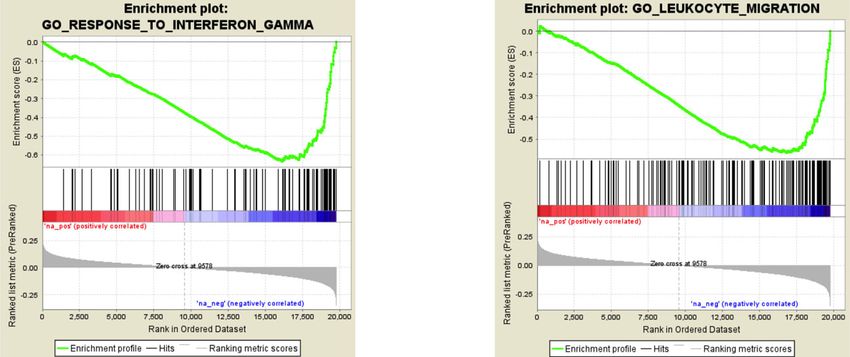
ARTICLE                                                                     NATURE COMMUNICATIONS | https://doi.org/10.1038/s41467-021-21365-3

Fig. 7 Differential gene expression in subjects with a history of early-life adversity (ELA). a Volcano plot of RNA-Seq data showing the 261 and 474
genes that were up- (green circles) or downregulated (red circles) in the ELA group compared with the control (C) group (GLM model using gender, age,
pH, PMI, and RIN as covariates; nominal P value < 0.05). b Gene Ontology analysis of the 735 differentially expressed genes in the ELA group. Terms
showing evidence of enrichment for differential methylation, histone profile or chromatin state are shown in yellow (small GTPase) or blue (immune
processes; see also Supplementary Fig. 16f). c, d Gene Set Enrichment Analysis (GSEA) of gene expression changes in ELA subjects. Genes were ranked
based on log2 fold changes from the C versus ELA differential expression analysis (“Ranked list metric”, in grey in the lower portion of each panel). Genes
with the highest positive fold changes (in red, upregulated in the ELA group) are at the extreme left of the distribution, and those with the lowest negative
fold changes (in blue, downregulated in the ELA group) are at the extreme right. A running enrichment score (green line, the upper portion of each panel)
was computed for gene sets from the MSigDB curated molecular signatures database and used to identify enriched gene sets42. Among the numerous
gene sets related to the immune function that showed evidence of genome-wide significant negative correlation with ELA (see main text, and
Supplementary Table 14), two representative gene sets are shown (with the middle portion of each panel showing vertical black lines where members of
the gene set appear in the ranked list of genes): c “Interferon-gamma”, and d “Leukocyte migration”. Of note, an oligodendrocyte-specific gene collection,
which we recently found downregulated in the anterior cingulate cortex of subjects with a history of ELA40, positively correlated with ELA in the amygdala
(see Supplementary Fig. 16d), suggesting opposite adaptations in this glial population between cortical and subcortical structures. Source data are provided
as a Source Data file.

transcriptomic data revealed gene pathways that in part overlap                 groups (Supplementary Fig. 17d), reinforcing the hypothesis that
with those identified using histone marks and DNA methylation.                   ELA-related adaptations reflect changes in cellular phenotypes
   Because epigenetic and transcriptomic patterns determine and                 rather than abundance.
reflect cellular identity, adaptations associating with ELA in the                  To combine analyses conducted for histones, chromatin states,
present work may stem from changes in the cellular composition                  DNA methylation, and gene expression, we finally grouped GO
of the amygdala. To explore this possibility, we deconvoluted our               terms enriched at each level to identify biological mechanisms
bulk tissue measures of gene expression and DNA methylation                     most consistently affected (Supplementary Fig. 16f). Overall, a
using BSEQ-sc43 and the CIBERSORT44 algorithm. For gene                         clear pattern emerged whereby the highest number of genome-
expression, we used as reference single-nucleus transcriptomes                  wide significant terms (n = 101 GO terms) were related to
recently generated by our group using cortical tissue45. Results                immune processes, with contributions from each of the four types
showed proportions of excitatory (80%) and inhibitory (20%)                     of data. Second came terms related to small GTPases, which were
neuronal subtypes consistent with expectations (Supplementary                   documented by histone modifications, chromatin states, and gene
Fig. 17a) while, importantly, no changes in abundance of                        expression (n = 24), followed by terms related to neuronal
neuronal populations, microglia, astrocytes, or oligodendrocytes                physiology (n = 19, mostly linked with neuronal excitability and
could be identified as a function of ELA in these analyses                       sensory processing; Supplementary Data 10), cellular adhesion
(Supplementary Fig. 17b, c). For DNA methylation, we used as                    (n = 13), and the cytoskeleton (n = 5). Altogether, these com-
reference single-cell non-CG methylomes recently published46                    bined analyses defined major epigenetic and transcriptomic
and found some convergence with cellular estimates generated                    pathways affected by ELA in the lateral amygdala.
using RNA-Sequencing (Supplementary Fig. 17e). Again, esti-                        Finally, we sought to determine whether molecular changes
mated proportions of different classes of excitatory and                        associated with ELA in the lateral amygdala might also affect
inhibitory neurons were unchanged across C and ELA                              other brain structures implicated in emotional regulation. To do

10                  NATURE COMMUNICATIONS | (2021)12:1132 | https://doi.org/10.1038/s41467-021-21365-3 | www.nature.com/naturecommunications
NATURE COMMUNICATIONS | https://doi.org/10.1038/s41467-021-21365-3                                                                     ARTICLE

so, we took advantage of gene expression RNA-Seq data recently                   H3K9me351. Therefore, the possibility exists that H3K9me3 may
published by our group using anterior cingulate cortex (ACC)                     be implicated in the regulation of mCAC in the brain, a
tissue from a cohort of C and ELA individuals (n = 50) that,                     hypothesis that warrants further investigation.
importantly, included all subjects from the present amygdala                        Beyond molecular interactions in physiological conditions, this
study. To identify patterns of shared transcriptional adaptations                study was primarily designed to investigate molecular con-
associated with ELA in both regions, we used Rank–Rank                           sequences of ELA. Over the last two decades, considerable evi-
Hypergeometric Overlay (RRHO247). Results uncovered strongly                     dence has associated enhanced inflammation with stress-related
significant overlapping groups of genes that were either                          phenotypes such as depression, in particular, based on measures
commonly downregulated (P-adj = 10−487, Benjamini–Yekutieli),                    of cytokines and inflammatory factors in blood samples52. Lim-
 or commonly upregulated (P-adj = 10−388), in both the lateral                   ited molecular data, however, document how this pro-
amygdala and ACC (Supplementary Fig. 16b). Strikingly,                           inflammatory state may translate in the brain. Available studies
enrichment analyses (see Supplementary Fig. 16c and full results                 focused on cortical structures of the frontal lobe and reported
in Supplementary Data 11) showed that a large majority of GO                     conflicting results for the expression of related genes53–55. At the
terms previously identified during the multi-epigenetic investiga-                histological level, while the prevailing view holds that stress-
tion of the single amygdala dataset were also recovered by this                  related psychopathology associates with tissue inflammation52,
combined analysis of transcriptomes from two distinct brain                      studies conducted on the amygdala showed discordant results,
regions. Future studies will be necessary to better understand                   with lower densities of glial cells in some56,57 but not all58 studies.
whether similar or divergent epigenetic processes underlie such                  In this work, integration of genome-wide data on DNA methy-
common transcriptional effects across various brain regions as a                 lation, histone, and gene expression found converging evidence
function of ELA.                                                                 for significant enrichment in immune-related GO terms (Figs. 3,
                                                                                 4, 6, 7, and Supplementary Fig. 17). This included decreased
                                                                                 expression of genes encoding the complement system, Toll-like
Discussion                                                                       receptors, clusters of differentiation, and the major histo-
Imaging studies3 have consistently demonstrated that ELA                         compatibility complex, altogether arguing for a meaningful con-
associates with impaired function of the amygdala. Here, going                   tribution to psychopathological risk. Of note, deconvolutions of
beyond previous studies9, we conducted a comprehensive analysis                  transcriptomic or methylomic data provided no indications of
of its potential molecular consequences in this brain region across              changes in amygdala cellular composition as a function of ELA,
multiple transcriptional and epigenetic mechanisms. Below, we                    suggesting that the reported molecular adaptations may reflect
discuss the implications of our results: first, in the healthy brain;             decreased activity rather than impaired recruitment or pro-
second, in relation to ELA.                                                      liferation of microglial and astrocytic cells, the main immune
   Over the last few years, the significance of non-CG methyla-                   actors in the brain. Altogether, our data suggest that dysregula-
tion, and the possibility that it may fulfill biological functions,               tion of immune-related processes in the amygdala may play an
have been supported by several lines of evidence, including (i)                  important role in long-term consequences of ELA and in the
distinct methylation patterns shown to preferentially affect CAG                 pathophysiology of depression.
sites in embryonic stem cells, or CACs in neuronal and glial                        While proteins from immune pathways have been historically
cells11, (ii) higher abundance of non-CG methylation in long                     identified and studied in the context of immune function and
genes in the human brain27, and (iii) specific binding of the                     associated circulating cells (eg lymphocytes, monocytes, and
methyl-CpG-binding domain protein Mecp2 to both mCG and                          granulocytes), a growing and significant literature now indicate
mCAC in the mouse brain28,48. Here, we provide additional                        that they are also largely expressed by neuronal cells, and play
evidence reinforcing this notion and found that mCG and mCAC                     important role in the regulation of synaptic plasticity59–64.
exhibit distinct profiles across genomic features and chromatin                   Consistently, other pathways most significantly altered in ELA
states, which extends on interactions previously identified in                    subjects were related to small GTPases, a large family of GTP
other tissues49,50, or in the brain for mCG49. First, among the                  hydrolases that regulate synaptic structural plasticity, notably
three chromatin promoter states (Act-Prom, Wk-Prom, Flk-                         through interactions with the cytoskeleton65. The association
Prom, see Fig. 2e, f), mCAC was selectively enriched in Wk-                      observed for small GTPases was also accompanied by changes
Prom, which was not observed for mCG. Considering that Wk-                       affecting GO terms related to the cytoskeleton. Overall, our
Prom was relatively depleted in H3K27ac and H3K4me1 com-                         findings, therefore, point toward altered synaptic plasticity in the
pared to the two other promoter states, it is possible to hypo-                  lateral amygdala in relation to ELA and depression and reveals
thesize that these two histone modifications may potentially                      part of underlying epigenetic mechanisms at DNA methylation
repress mCAC accumulation in brain tissue. A second dissocia-                    and histone levels. While few molecular studies in humans pre-
tion consisted in the fact that lower mCAC levels were measured                  viously documented this hypothesis66, it strongly resonates with
in Str-Trans compared with Wk-Trans regions, while no such                       the wealth of human imaging and animal data that shows
difference was observed in the CG context. This may result at                    structural and functional plasticity in this brain region as a
least in part from higher levels of H3K36me3 observed in the Str-                function of stressful experiences4.
Trans state. Third, among the two tightly compacted chromatin                       Finally, we wondered whether mCAC may also contribute to
states defined by the repressive mark H3K9me3, PcR and Het-                       molecular responses to ELA in the brain. We found that similar
eroch, the latter state was characterized by higher DNA methy-                   numbers of differential methylation events could be detected
lation in the CG, but not in the CAC, context, as well as by a                   across CAC and CG contexts in ELA subjects, suggesting that
relative increase in H3K9me3 and a decrease in H3K27me3.                         both contexts might be sensitive to behavioral regulation. While
While there is currently no data, to our knowledge, supporting a                 previous studies already showed that ELA associates with wide-
potential interaction between H3K27me3 and non-CG methyla-                       spread effects on mCG throughout the genome, they were con-
tion11, a role for H3K9me3 can be speculated considering studies                 ducted using methodologies primarily designed for the
of cellular reprogramming. Indeed, in vitro dedifferentiation of                 investigation of mCG (methylated DNA immunoprecipitation
fibroblasts into induced pluripotent stem cells associates with the               coupled to microarrays67, reduced representation bisulfite
restoration of non-CG methylation patterns characteristic of stem                sequencing40). In comparison, the present WGBS study provides
cells, except in genomic regions characterized by high levels of                 a more comprehensive and unbiased assessment of the overall

NATURE COMMUNICATIONS | (2021)12:1132 | https://doi.org/10.1038/s41467-021-21365-3 | www.nature.com/naturecommunications                             11
ARTICLE NATURE COMMUNICATIONS | https://doi.org/10.1038/s41467-021-21365-3
Fig. 8 Methylomic adaptations associated with early-life adversity (ELA) in the CG and CAC contexts show multiple distinct properties. The figure
depicts a summary of methylomic and gene features, as well as histone marks and chromatin states that characterize genomic sites where differentially
methylated regions (DMR) were identified as a function of ELA in the CG and CAC contexts. See main text for details. LMR lowly methylated regions, UMR
unmethylated regions, + and − indicate enrichment and depletion in the corresponding histone mark, for each DMR category.
methylome, and represents, to our knowledge, the first indication mCAC and specific histone modifications (H3K27ac, H3K4me1,
in humans that the mCAC form of DNA methylation might be H3K36me3, and H3K9me3). Therefore, future investigations
affected by ELA and related depressive phenotypes. This is con- should focus on these marks, and related histone-modifying
sistent with recent mouse work68 that provided evidence for an enzymes, to better decipher the lifelong impact of ELA on
effect of early-life positive experiences (in the form of environ- molecular epigenetic interactions.
mental enrichment during the adolescence period) on non-CG Of note, this study has limitations. First, due to technical
methylation, suggesting that both beneficial and detrimental constraints at the beginning of the project, pools of amygdala
experiences may modulate this noncanonical epigenetic tissue from several subjects were analyzed for ChIP-Seq, while
mechanism. Importantly, our combined investigation of DNA RNA-Seq and WGBS were conducted separately for each sample.
methylation and histone marks provides further characterization While this may have affected our results (for example, by
of this form of plasticity. Strikingly, mCAC and mCG changes obscuring subtle subject-specific histone changes not detected at
occurred in genomic regions that appeared distinct at every level pool level), the convergence of functional annotations observed
of analysis (see summary in Fig. 8), including genic or methy- across multiple types of data suggests a modest detrimental
lomic features, individual histone marks, chromatin states, and impact of the pooling approach. Second, the field of genomics is
GO categories. Accordingly, CG-DMRs primarily located among currently moving towards the molecular analysis of single-cells,
promoter regions and gene bodies; they were enriched in with the hope of achieving higher resolution and a better
H3K4me1, H3K4me3, and H3K27ac, and present across all understanding of psychopathology. In comparison, this work
chromatin states, but mostly in Prom and Enh. In comparison, focused on bulk tissue only and, as such, may have missed epi-
CAC-DMRs were less frequently found in promoters, enriched in genetic processes affecting individual or rare cell types. Finally, all
H3K36me3 and depleted in H3K9me3, and mostly associated ELA subjects died during a major depressive episode by means of
with Quiescent and Wk-Trans chromatin states. Furthermore, suicide. Therefore, it is possible that part of the molecular
previous studies on non-CG methylation focused on the com- adaptations that we uncovered, and cautiously associate with
parison of distinct cell types (glial vs neuronal cells12, or excita- ELA, derive from these complex phenotypes rather than stem
tory vs inhibitory neurons24), and identified parallel and specifically from ELA. Exploring this hypothesis will require
significant differences in both CG and non-CG contexts at replication in larger cohorts and additional clinical groups (eg,
common genomic sites. In sharp contrast, regions showing dif- depressed suicides with no history of ELA).
ferential methylation as a function of ELA in the present study In conclusion, the epigenetic and transcriptomic landscape of
were clearly context-specific (Fig. 5h and Supplementary the lateral amygdala exhibit targeted reconfigurations as a func-
Fig. 13e), indicating a more subtle and specific modulation of tion of ELA. This reprogramming can be detected consistently
DNA methylation by ELA than by cell identity. Overall, these across multiple epigenetic mechanisms, including the newly
results are consistent with a model whereby the cascades of recognized form of DNA methylation affecting CAC sites. Future
neurobiological adaptations associated with ELA result from and studies will hopefully define the extent to which non-CG
contribute to distinct pathophysiological phenomena that differ- methylation at CACs, and potentially at other cytosine contexts,
entially manifest at the level of CG and CAC sites. It is possible contribute to the adaptive and maladaptive encoding of life
also to speculate that part of these adaptations may result from experiences in the brain.
the impact of ELA on mechanisms that drive the developmental
emergence of mCAC. Along this line, a molecular pathway has
recently started to be unraveled in the mouse: the methyl- Methods
Human samples and tissue dissections. Postmortem lateral amygdala brain
transferase Dnmt3a was shown to mediate the progressive post- tissue was obtained in collaboration with the Quebec Coroner’s Office, from the
natal accumulation of DNA methylation in the CA context13, Douglas-Bell Canada Brain bank (douglasbrainbank.ca/, Montreal, Canada). This
while in vivo recruitment of MeCP2 primarily relies on mCG and study included (i) subjects who died suddenly without prolonged agonal state or
mCAC levels (rather than methylation at other contexts, protracted medical illness, and with no history of psychiatric disorder (Controls, C,
N = 17), and (ii) subjects with a history of severe child abuse, who died by suicide
including CAT, CAA, or CAG28). These 2 studies suggest that in the context of a major depressive episode (Early-life adversity, ELA, N = 21).
DNMT3a and MeCP2 may be implicated in human in the par- Sample characteristics are presented in Supplementary Table 1, while the type of
ticular cross-talk that emerges during brain maturation between abuse and mean of death are detailed in Supplementary Table 2. Groups were
12 NATURE COMMUNICATIONS | (2021)12:1132 | https://doi.org/10.1038/s41467-021-21365-3 | www.nature.com/naturecommunicationsYou can also read