Goods Trade Under Siege: Early Indications of Industry Shifts in Global Sourcing during the U.S.-China Trade War
←
→
Page content transcription
If your browser does not render page correctly, please read the page content below
Brandeis University International Business School
            Student Research for HSBC Global Research

      Goods Trade Under Siege: Early Indications of
        Industry Shifts in Global Sourcing during
               the U.S.-China Trade War
Differential Responses in Apparel, Footwear, Communications Equipment,
     Semiconductors, Medical Devices, and Pharmaceuticals in 2019

Zhiyu Guo, Luisa S. Reyes, Muneeb A. Naseem, Maneesh Ramanadham
              ECON286a: International Institutions Lab
                        Professor Peter Petri
                            May 29, 2020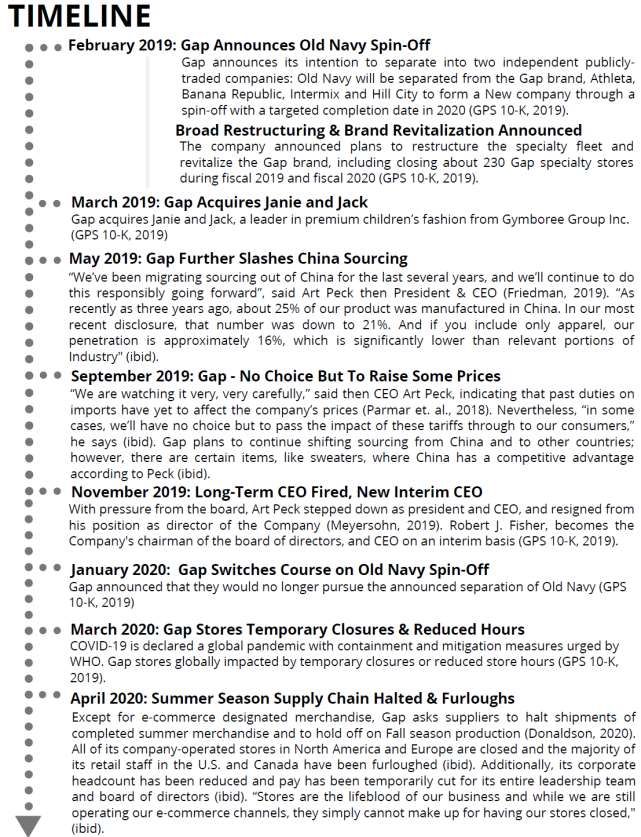
Table of Contents
Executive Summary ...................................................................................................................... 2
I.    Introduction ............................................................................................................................. 3
II. How Tariffs Escalated ............................................................................................................. 5
       Economic Uncertainty ............................................................................................................. 8
      Tariff Rates .............................................................................................................................. 9
      Comparing Overall Duty Paid to Chapter 99 Tariffs ............................................................. 11
III. Aggregate Trade Responses ................................................................................................ 13
      U.S. Imports in Manufacturing .............................................................................................. 13
      Global Imports in Manufacturing .......................................................................................... 14
IV. Sectoral Trade Responses: How and Why They Varied .................................................. 25
      Consumer Goods: Apparel & Footwear ................................................................................ 25
           Apparel Analysis and Case Study on Gap, Inc. ................................................................ 25
           Footwear Analysis and Case Study on Crocs, Inc............................................................. 33
      Electronics: Semiconductors & Communications Equipment ............................................... 39
           Semiconductors and Communications Equipment Analysis............................................. 39
           Case Studies on Huawei Technologies and Qualcomm Incorporated .............................. 47
      Medicine: Pharmaceuticals & Medical Devices .................................................................... 51
           Pharmaceuticals Analysis and Case Study on Pfizer, Inc. ................................................ 51
           Medical Devices Analysis and Case Study on Medtronics PLC....................................... 59
V. Conclusion ............................................................................................................................. 67
Appendices ................................................................................................................................... 70
References .................................................................................................................................... 74

Acknowledgements
The authors would like to extend sincere thanks to Douglas Lippoldt PhD and Shanella L.
Rajanayagam of HSBC who provided guidance and feedback that greatly assisted in completing
this research. We thank Professor Peter Petri and Meenal Banga (Brandeis) for general supervision,
feedback on earlier drafts, and support through each stage of the process. We want to acknowledge
Professor Judith Dean (Brandeis) for early guidance on how to approach this research.

                                                                                                                                                      1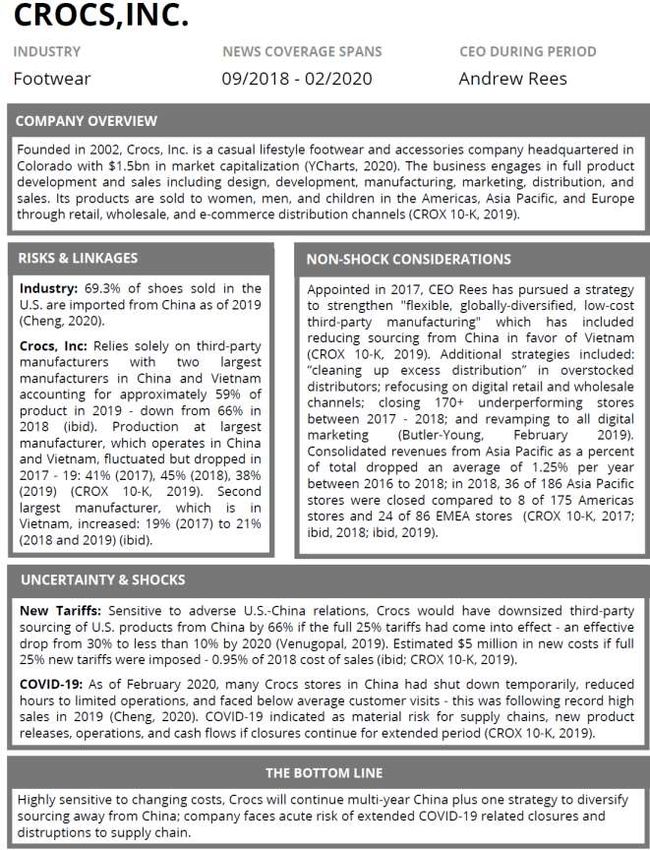
Executive Summary
          The world economy has become integrated since the end of World War II and the creation
of international institutions (e.g. GATT), which helped countries draw up favorable terms of trade.
The inflow and outflow of intermediate goods, comparative advantage and emergence of global
manufacturing hubs, role of bilateral and regional free trade agreements, and relative ease of doing
business around the world have facilitated the formation of global value chains. While global value
chains capitalize on each economy’s area of comparative advantage (e.g. resource endowments,
human capital stock etc.) that may change only gradually, they can also be impacted by factors
that may change in the short to medium term, such as trade protectionism. The implications of
these measures are seen by the U.S.-China trade tensions that spiked in 2018 and the tariff
escalation between the two economies. The volley of import tariffs on Chinese imports and
retaliatory tariffs on American imports acted as a shock in global sourcing with differential impacts
dependent on industry structure, risks, and environments alongside external factors such as
country-level economic development strategies. This report aims to identify early shifts in sourcing
patterns to the U.S. and to describe differences between selected high-volume trade industries
between 2018 and 2019. Business case studies and regional analysis of pull and push factors are
utilized alongside trade data to analyze U.S. imports from top suppliers by industry.
          Our study finds that China has in fact been severely affected by the series of tariffs imposed
on its exports to the U.S. with the level of trade between the two economies dropping. Countries
like Vietnam, Mexico and India have all increased their exports to the U.S., demonstrating that
trade diversion is taking place, albeit the ramifications of trade destruction are much more dire. In
combination, this analysis was able to identify how global value chains have responded to the new
tariffs beyond latent shifts that would otherwise be expected. Two primary results appeared:
apparel     and   footwear    industries   began    shifting   sourcing   whereas     communications,
semiconductors, pharmaceuticals, and medical devices have not. Case studies about the former
indicate that long-term “China plus one” strategies to diversify sourcing were in play before tariffs
were imposed while case studies about the latter illustrate business strategy of doubling-down on
Chinese markets and long-term investment.

                                                                                                           2
I.    Introduction
         The United States and China are the biggest economies in today’s global economy. China’s

growth has transformed it from a developing country in the 1980s into an absolute economic size

that by 2004 that has surpassed many OECD countries, through an average growth of GDP per

capita of 8.1% from 1987 through the early 2000s (Angang, 2005). Among multiple factors

shaping businesses strategy, the new tariffs imposed during the U.S.-China trade-war between

2018 - 2019 are considered in this paper to identify differential responses per industry covered.

This paper begins with background on the trade story behind the U.S. and China and a discussion

of how the tariffs escalated. To analyze differential industry responses, trade import data to the

U.S. is analyzed alongside company-specific case studies after a review of findings at the aggregate

level.

         Trade between China and the U.S. was underway prior to 2000 and accelerated post-2000

once the formal relationship between the two economies was approved for Permanent Normal

Trade Relations by the U.S. House of Representatives, granting China most favored nation status

(U.S. Department of State, 2000). Soon after, China became a member of the WTO in 2001 and

emerged as the U.S’ largest trading partner. The level of bilateral trade in goods and services

increased from $116bn in 2000 to $558bn in 2018 as a result of this trade relationship (Palumbo,

2019; Lea, 2019).

         However, there has been opposition to this growth by groups that have been committed to

keeping U.S. manufacturing employment at a high level. Correspondingly, groups attributed the

17% reported loss of manufacturing jobs between 2000-03 to the permanent trade agreement

signed with China (Pierce, 2018). Although this figure is dwarfed by the manufacturing jobs lost

due to substitution by technology which accounts for 75% of the losses (Autor et. al, 2013), and

                                                                                                       3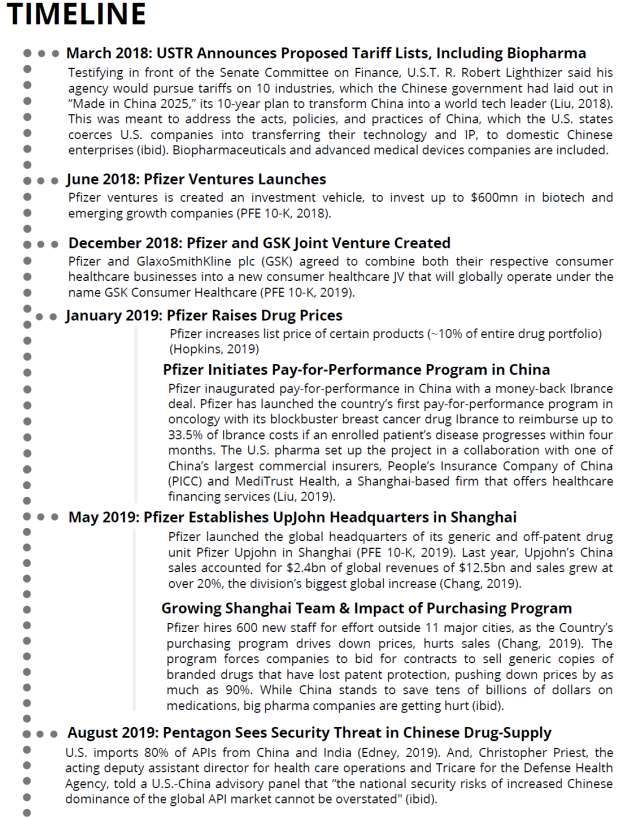
U.S. real manufacturing output is up quite significantly since 1990, this rationale has nevertheless

influenced U.S. politics today. A second rationale employed by the current Trump administration,

also not accepted by economists, is that a U.S. bilateral trade deficit with China indicates that the

U.S. is “losing” from its trade with China. This bilateral trade deficit was a substantial $345.6bn

in 2019, albeit below its 2018 high of $419.5bn (Palmer, 2018). However, the purpose of this paper

is not to test the rationale put forth by the Trump administration but rather to test the immediate

effects of the trade barriers that the administration has implemented to pursue its objectives.

       Following Section 201 and 301 investigations, the U.S. imposed a series of additional

import tariffs between 2018 - 19 which raised bilateral tensions and increased uncertainty in global

supply chains and investment. Section 301 of the Trade Act of 1974 broadly permits the U.S.

government to impose tariffs against any foreign action that is “unjustified, unreasonable, or

discriminatory, and that burdens or restricts U.S. commerce” (USTR, 2018). The U.S. findings in

this case (Figure 1a) concluded that China violated U.S. intellectual property (IP) rights in various

ways and thus justified trade war tariff escalation in technological and IP intensive industries

(ibid). However, tariffs were not restricted to these goods later in the trade war and, as our analysis

shows, had some of their most important effects on simple manufactured products. During the

trade war, $280 bn of U.S. imports were affected and the average tariff increased by 24% (Handley

et al.,2020; Amiti et al., 2019). The scale of the tariffs affected imports and spurred subsequent

retaliation from China; the European Union, Russia, and Canada among others have drawn

comparison to the Depression-era tariff wars of the 1930s. However, a key difference between that

era and today is that the structure of world trade has become increasingly complex and

interconnected across global supply chains.

                                                                                                          4
Figure 1a: Section 301 Findings Behind Targeted Tariffs

                   Source data: USTR “Findings of The Investigation Into China’s Acts, etc.” 2018

        From the beginning of the trade war through Phase I in January 2020, the trade tension that

was brewing during the Obama administration burst into the open under the Trump

administration.1 The intense trade relationship that China and the U.S. had built has now, in part,

collapsed and this report utilizes the first available data from late 2019 to analyze how sourcing

patterns have responded in consumer goods (apparel and footwear), high-tech electronics

(semiconductors and communications equipment), and medicine (pharmaceuticals and medical

devices). U.S. import trade data is utilized to observe results and compared against press reports

about specific firm responses per industry. Previous studies have analyzed short-term price pass-

through whereas the goal of this analysis is to understand the early changes in trade patterns

(Appendix 1 summarizes prior research). Outside of the trade war, non-tariff factors are

considered including wage rates, improving business conditions in ASEAN economies, and long-

term business strategy.

                               II.      How Tariffs Escalated
        The first round of tariffs was enacted in February 2018 against approximately $10bn solar

panels and washing machines (The Economist, 2018). The second round began in March 2018,

1
 Each year by March 31st, the Office of the U.S. Trade Representative releases an annual National Trade Estimate
Report and describes the trade turbulence year to year (USTR, 2020).

                                                                                                                   5
imposing tariffs on steel and aluminum (Bown et al, 2020). The third round targets $506B of

Chinese industrial goods (intermediate inputs and capital goods) as well as some consumer goods,

motivated in part by U.S. concerns with shortfalls in Chinese intellectual property protection and

forced technology transfer, among other issues (ibid, 2020). Figure 1b details the month to month

changes in average tariff rates.

        Amiti et al (2019) estimates that the rising import tariffs by December 2018 were costing

U.S. customers and importers an additional $3.2 billion per month and another $1.4 billion per

month in deadweight welfare losses. They estimate if the tariffs continue that approximately $165

billion of trade per year will be redirected (ibid, 2019). Figure 1c summarizes tariff escalation

between the U.S. and China.

                         Figure 1b: Average Tariff Rates by Percent Between 2018 - 20

    Source: Peterson Institute for International Economics, “US-China Trade War Tariffs: An Up-to-Date Chart.” Bown

                                                                                                                      6
Figure 1c: Timeline of Tariff Escalation Between 2018-20

   Source data: PIIE, “Trump’s Trade War Timeline: An Up-to-Date Guide” Bown et al.

                                                                                      7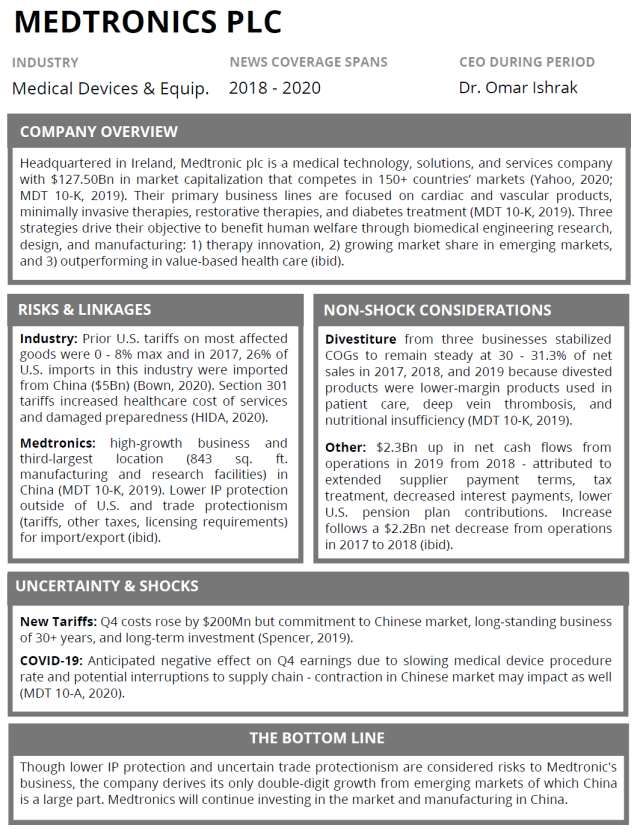
Economic Uncertainty Implications:

       Tariff escalation and earlier risk of a trade war under the Trump administration speak to

cases of policy uncertainty and alongside the microeconomic impact of tariffs on specific firms

and sourcing patterns, it is important to consider uncertainty at the macroeconomic level during

2018 - 20. Figure 2 indicates jumps in uncertainty at key points in the tariff timeline and shows

an overall average rise in economic policy uncertainty in China and the U.S. between 2018 - 20.

              Figure 2: Economic Policy Uncertainty in China and the U.S. (2018-20)

                                                         Source: Economic Policy Uncertainty Index

       For China, periods that coincide with trade war events include: January to June 2018 (steel

and aluminum tariffs, the initial round of U.S. tariffs, and retaliatory tariffs), September to

December 2018 (U.S. tariffs on $200bn Chinese goods and Chinese tariffs on $60bn U.S. goods),

May to July 2019 (trade talks falter and the inclusion of Huawei in the U.S.’s NDAA), and August

to September 2019 (U.S. tariffs on $300bn Chinese goods and Chinese tariffs on $75bn U.S.

goods). Three of the same periods are meaningful in the U.S. uncertainty index: September -

December 2018 and May to September 2019. The latter indicates a steady increase in uncertainty

which differs from a dip in uncertainty on China’s index during the same window.

                                                                                                     8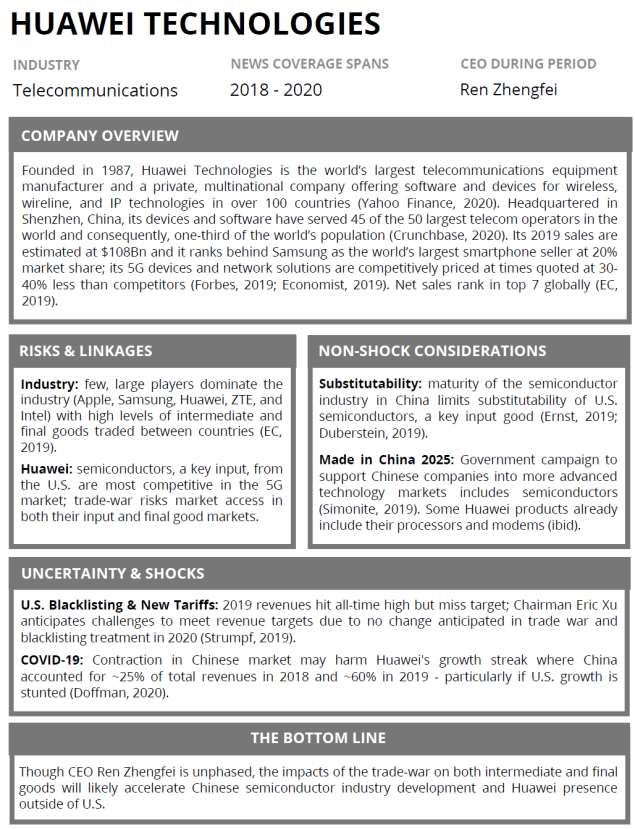
A. Tariff Rates

       This section describes tariff rate growth in apparel, footwear, high tech equipment and

medical devices from 2018 - 20 in order to provide background for sectors that are analyzed in

Section III. This data is taken from the United States International Trade Commission (USITC)

database and industries are defined in the Harmonized Tariff Schedule (HTS) classifications.

                Figure 3: Industry Relevant Sub-Sectors in Harmonized Tariff System

       HTS          Industry Name                         Description
    Classificatio
         n
         61         Apparel and clothing accessories      Knitted and Crocheted
         62         Apparel and clothing accessories      Not knitted or Crocheted
         64         Footwear, gaiters etc.,               Articles relevant to footwear
         85         Electrical Machinery and              Articles such as sound recorders,
                    equipment                             television etc., and their parts
           90       Optical, photo, medical, surgical     Articles which include apparatus of all
                    instruments etc.                      kinds, including medical and surgical

       The methodology used to arrive at the tariff level utilizes both “dutiable value” and

“calculated duties” from the USITC database on the respective industries. This is a rough measure

which calculates the duty paid as a percentage of the total value of imports on which duty is

applicable in each month. The method gives a relative idea on how much duty is paid on the value

of goods that come in each month. Two limitations of this method are that: 1) it does not account

for whether the duty paid is under the Most Favored Nation (MFN) tariffs or a special import

program, and 2) it does not account for inter-category variation in duties collected (e.g. the tariff

on men’s overcoats made of cotton is 15.9% whereas overcoats made of leather are 5.6%). Instead,

this method takes a weighted average based on how much volume of each good is imported each

month to arrive at the aggregate duty paid and the next section attempts to deal with the first

problem.

                                                                                                        9
Figure 4 below shows how much duty is paid on each product code (e.g. apparel is 18.1%
in January 2018). As observed, the duty paid on product code 90 (medical devices proxy) sharply
increased between June - September 2018 from 2.4% to 15.5%. Similarly, the tariff on product
code 90 rose in July and settled near 10.3% in October 2018. Recall that the Trump administration
initially began its tariff escalation using the Section 301 rationale imposing tariffs on IP-intensive
products on July 6, 2018 and that average tariffs rose by 8% for HTS 85 (electronics proxy) and
90 (medical devices proxy) by the end of September. This implies that high tech equipment and
medical instruments were affected beginning in the second half of 2018 whereas apparel (61-2)
and footwear (64) were not targeted initially as tariff levels remained constant during this time.
The latter pair faced higher standing tariffs before new tariff imposition whereas electronics and
medical devices faced the opposite.
Figure 4 & 5: U.S. Tariff Levels in 2018 and 2019 for Specific Industries
Source data: USITC
Figure 5 shows that the duty paid on all proxy categories rose sharply in the second half
of 2019, beginning in August. This closely follows the announcement by the U.S. administration
on August 1, 2019 to target $300 billion worth of imports from China. Up from 16 - 20%, the
average tariff on apparel rose up to 29.0% whereas the average tariffs on electronics and medical
instruments proxies increased to approximately 17.5% and 22% respectively.
10This data analysis shows that, on average, the duty paid on goods coming in from China
rose sharply for all highlighted sectors. Electronics and medical instruments proxies were impacted
by higher relative increases due to the categories’ initial tariffs being around 2%. It is important to
note that this analysis and the next section do not account for non-tariff trade barriers (e.g. quotas,
subsidies), which contribute to elevated trade protectionism.
B. Comparing Overall Duty Paid to Chapter 99 Tariffs
This section aims to provide a deeper understanding of tariff increases which were
attributed to U.S. Chapter 99 tariffs (eg. imposed on China as a result of the trade war). The original
levels of tariffs are detailed in sub-section A above; however, the MFN tariffs in place are less
obvious due to change based on the quantity/weight of specific goods imported. To address this,
data from the University of Iowa was utilized. This analysis relies on the University of Iowa data
to aggregate tariffs imposed at the 8-digit HTS level with 2-digit HTS industries selected as proxies
for apparel (61, 62), footwear (64), electronics (85) and medical instruments (90).
Figure 6 below explains the weighted average marginal increase in tariffs due to the U.S.-
China trade war in these selected categories. This figure only includes the tariffs imposed since
2018 as a result of the trade war and the average does not contain the products which do not have
any tariffs imposed on them. Note that this entails the averages will be upward-biased due to only
representing the non-zero tariffs imposed. Also, it only includes additional tariffs after MFN or
preferential tariffs which are already in place for these products.
This figure shows that the highest affected sector is HTS 85 (electronics proxy) which is
synonymous to the Trump administration’s claim that China was allowing intellectual property
theft and that high-tech companies should be penalized - ZTE and Huawei are highlighted in this
regard. This confirms that tariffs were targeted at the sub-sector level compared to an initially low
11duty on electronics products as seen in the prior section; however, note that the marginal tariff
increase estimate is slightly inflated owing product codes which were zero in this sector.
Figure 6: Marginal Tariffs Added Per HTS Category (Aggregated)
Source data: University of Iowa - Trade war data
Similarly, medical instruments and footwear faced an additional ~16% tariff levied on their
products; the initial tariffs on medical instruments was low and the trade war tariffs raised the rate
by ~22%. The tariff in footwear rose by 16.2%, although there were significant zeros in this sub-
sector which skews the average upwards. Thus, a number of specific products were targeted and
increased the average marginal tariff in effect.
Lastly, the marginal tariff on apparel is lower than the other industries but as seen in Figure
4, apparel faced a significant tariff before the imposition of new trade war tariffs; this marginal
increase led to the average tariff reaching 30%. Accordingly, apparel manufacturing imports from
China were already facing trade protection before the trade war and the marginal increase in tariffs
raised this cost to producers to even higher rates - incentivizing the shifts discussed in Section IV.
12III. Aggregate Trade Responses
The marginal spike in tariffs discussed above has contributed to both trade destruction and
diversion. Trade diversion, as put forth by Viner in 1924 and 1950, leads to the welfare loss that
is attributable to not importing from the country that produces a good at the lowest expense, due
to a discriminatory duty imposed on its good, instead importing from a higher-cost source (Viner,
1924). 2 Total U.S. imports in 2019 shrank by 1.67% to $2,498bn during the same period of new
tariff imposition and protectionism, which is referred to as trade destruction. China faced severe
change in total exports to the U.S in 2019 which dropped to $452bn; for scale, this is $16bn below
the 2013 level of $468bn, which is referred to as trade diversion. China was the largest supplier of
U.S. imports at around $540bn of goods in its peak year of 2017. To provide an overview of how
severely the trade war has impacted U.S. imports from China, Section III consists of a broad
manufacturing sector analysis. Figure 7: NAICS 3-digit Manufacturing3
A. U.S. Imports in Manufacturing
This is a 3-digit analysis derived from the North
American Industry Classification System (NAICS) and each
code represents one manufacturing industry (Figure 7). Further,
this analysis highlights China’s role as a powerhouse trading
partner for the U.S. with China placing among the leading
suppliers in most categories of manufactured goods imports.
For instance, the imports from China in product code 331 are
nearly 22x bigger than imports from Vietnam in the same
2
Viner described the economic theory of trade creation and trade diversion in 1924 with The Most-Favored Nation
Clause in American Commercial Treaties and The Customs Union Issue in 1950.
3 Source data: USITC
13product code. The analysis stays at this level of aggregation for Section III because it provides a
comparative view between countries and insight into how the new tariff impositions affected not
only China, but other countries as well.
B. Global Imports in Manufacturing
It is prudent to note that the Trump administration tariffs on almost all imports from China
were counterintuitive due to China’s role as the U.S.’ biggest trading partner, primarily in limited
manufacturing goods. Figure 8 showcases China’s relative size with a snapshot of the share of all
manufacturing imports that are received from each country for each month in 2018.
Figure 8: Monthly Manufacturing Imports for Consumption from Selected Countries4
Source data: USITC
4
In USITC data, “Imports for Consumption” indicates all imports that have cleared U.S. customs for use in the U.S.
market as either intermediate or final goods (USITC Trade Measure Definitions, 2018). Appendix 2 details the flow
and categorization of U.S. imports under this definition in more detail.
14China led with the largest contribution in manufacturing imports and Mexico and Canada
followed close behind. Figure 9 shows negative effects felt in the manufacturing sector during
2019 when new tariffs escalated to their highest points; simultaneously, it is important to note that
U.S. imports grew very slowly from 2018 to 2019. This figure showcases the annual change of
imports between 2018 – 19 for each country in each sub sector where the red highlighted cells
represent a decrease in imports from the previous period. The primary takeaway from this table is
that Chinese imports have decreased in 19 out of the 20 manufacturing subsectors. None of the
other countries were as adversely affected as China and it serves as a stark reminder that, although
the U.S.-China trade war was tit-for-tat tariff imposition, U.S. tariff imposition had far-reaching
implications - including acting as a driver of policy uncertainty discussed in Section II.
Figure 9: Annual Change in U.S. Manufacturing Imports in all NAICS Codes
Source data: USITC
Notably, Vietnam has observed an increase in its exports to the U.S. in all manufacturing
subsectors except two (petroleum and coal products and primary metal manufacturing). The
15magnitude of change differed based on how much Vietnam exported to the U.S. in 2018 though
there is enough evidence to conclude that Vietnam has gained in a macroeconomic sense due to
trade diversion from China. Further, Vietnam has exact or near exact 1:1 growth parallel to China’s
losses in: apparel, leather and allied products, transportation equipment and beverage and tobacco
products; for this analysis, apparel is a paramount observation for Vietnam. Similarly, countries
like Mexico, India, Taiwan and Malaysia observed a rise in their exports to the U,S. in 2019.
Importantly, 1:1 gains should not be expected when limited to top suppliers alone because
domestic U.S. supply substitutions or year over year market growth may have also played roles.
To dive deeper into the largest percent decreases, three subsectors were analyzed:
petroleum and coal products (324), food (311) and wood product manufacturing (321). Figure 10a
visualizes gross loss/gain of top suppliers of petroleum and coal products to the U.S. in millions
USD in 2019 whereas Figure 10b highlights the relative percent changes for these suppliers
(Appendix 3 describes input data). Subsequent figures describe similar gains/losses for food and
wood products and clear linkages to ASEAN countries were found in petroleum and wood
products. Before concluding this section with food manufacturing where no clear linkages are
observed, a discussion of improving ASEAN business conditions helps to contextualize these
linked third-country effects.
In petroleum and coal products, Mexico is one of the leaders in imports with a 15.6%
increase equivalent to a $300 million increase from its $1.7 billion share of imports in 2018. India
dominates in absolute terms since imports increased by $1.46 billion, followed by South Korea
($1.263 billion) and Brazil ($1.261 billion). One does not expect India to be such a big exporter of
energy products but the country had a good year in 2018 with an overall increase in petroleum
16product exports to the rest of the world (India Department of Commerce, 2019).5 China dropped
from ninth place in 2018 to eleventh during 2019 after its share of U.S. relevant imports fell by
67.4%, the equivalent of approximately $738 million. Interestingly, imports from Vietnam also
fell sharply with a $131 million drop from an initial $132 million import value in 2018. Malaysia
observed a similar drop in exports of $147 million from an initial $330 million value in 2018. This
shows losses in this subsector were not isolated to China and impacted other ASEAN countries.
In wood products manufacturing, there are also clear linkages to ASEAN and southeast Asian
countries experiencing third-country effects while China’s share of U.S. imports dropped.
Figure 10a: Changes in Millions USD for Petroleum & Coal Suppliers to U.S. in 2019
Source data: USITC
5
An Indian Chamber of Commerce report highlights that India’s exports in this sector increased by $32.22 billion
from an initial $1.086 trillion (India Department of Commerce, 2019).
17Figure 10b: Percent Change for Top Petroleum & Coal Suppliers to U.S. in 2019
Source data: USITC
In wood product manufacturing, China is second in terms of the magnitude. Surprisingly,
both Canada and China had an annual decline in supply of U.S. imports with China’s exports
decreasing by around $2.5 billion in 2019 from 2018 level of $8.15 billion. The loss in U.S.
imports from China were recovered through three countries, namely Vietnam, India and Ireland.
Vietnam crossed the billion-dollar mark and its imports increased by $300 million. Similarly, India
observed a rise in its exports to the U.S. in wood products by $100 million. Ireland’s percentage
change was high but the absolute increase in exports to the U.S. was low in magnitude at $6
million. Figure 11a describes the gross loss/gain of top suppliers of wood products to the U.S. in
millions USD in 2019 whereas Figure 11b highlights the relative percent changes for these
suppliers (Appendix 3 describes input data).
18Figure 11a: Changes in Millions USD for Wood Suppliers to U.S. in 2019
Source data: USITC
Figure 11b: Percent Change for Top Wood Suppliers to U.S. in 2019
Source data: USITC
19In wood products, petroleum and coal products, apparel, and many of the industries
summarized in Figure 9, gain/loss linkages to Vietnam and Malaysia need to be contextualized
within regional non-trade-war factors that likely impacted industrial organization and trade
economics. Generally, these non-tariff factors within the ASEAN region act as pull factors and
evidence of improving business conditions and relative comparative advantages facilitate positive
gains for countries that are targets for companies in response to the push factor of the trade war.
However, it is pertinent to remember that how fast supply chains adjust depends on the nature of
the industry (e.g. raw material requirements, cost of acquiring capital etc.,) and can increase the
time required to adjust fully. Regardless, pull factors are being quantified and potential countries
can be assessed with regard to FDI, human capital, free-trade agreements, wage rates, and EDB
ratings among other factors.
ASEAN countries appear to be a major winner of new investments with respect to the push
factor created by the trade war and as discussed below, pull factors as well. ASEAN has witnessed
an increasing influx of FDIs in 2018 to $155bn up from $147bn in 2017 - capturing 11.5% of
global FDI inflows. Member states including Cambodia, Indonesia, Singapore and Vietnam
received record levels of inflows in 2018 Figure 12: FDI to ASEAN: 2016 - 20186
(UNCTAD, 2019). This jump in FDI was fueled
significantly by an increase in FDI in the
manufacturing sector: $55bn in 2018 up from
$30bn in 2017; this 83% increase provides insight
for Vietnam, Malaysia, and other member country
6 Source: UNCTAD, ASEAN Investment Report 2019, FDI in Services: Focus on Healthcare
20gains (Figure 12). The majority of increased flows came from the EU, Japan, Hong Kong (China),
India and Korea (UNCTAD, 2019).
Further, the role of countries pursuing change impacts international supply chain decisions
and progress in this change can be measured through metrics including World Bank’s Ease of
Doing Business and Human Capital Index. Lastly, increasing wage rates in China and relatively
lower wage rates in ASEAN countries is important to note as an additional push factor for
industries with sensitive cost curves, such as apparel which faces the ~30% cumulative tariff
discussed in Section II when producers source from China. Push and pull factors in combination
can provide compelling motivations for sourcing to shift in such industries.
As Figure 13 shows, Figure 13: Gross Minimum Wages of ASEAN & China7
countries including
Indonesia, Lao PDR and
Cambodia had
significantly lower
minimum wages
compared to China;
though, it is important to
note that the time of
measurement of this data varies per last available data and that the statutory regimes in place for
minimum wage likely differ between countries. ASEAN’s position relative to China is further
described in Figure 14 which shows that Thailand, Malaysia and Singapore have better EDB
scores compared to China as of 2020 and over the last few years (2016-2020). The EDB score is a
7 Source: International Labor Organization, ILOSTAT DataBase
21cumulative score out of 100 that accounts for factors such as how long it takes to acquire a new
business permit and the average cost of starting a new business (eg. 100 indicates high ease). A
final metric investigated is the relative level of human capital development in countries (Figure
15) which shows that Singapore performed well over China and that Malaysia, Thailand and
Vietnam are not far away from China - this is significant for companies considering where higher-
tech manufacturing can be conducted, such as for semiconductors and communications equipment.
Figure 14: Ease of Doing Business Scores Among ASEAN and China
Source Data: World Bank Ease of Doing Business
Figure 15: Human Capital Index for ASEAN & China in 2018
Source data: Human Capital Index, World Bank Development Indicators
ASEAN push and pull factors are significant for understanding the regional trade story in
ASEAN, China, and southeast Asia as a whole. Meanwhile, the trade war and external factors
should also be considered in terms of the U.S.-based suppliers and their levels of production,
particularly in industries where China lost volume but there were no clear winners in countries that
22gained volume. This presents a third case that may have occurred in the case of food manufacturing
though the data on U.S.-based suppliers was not available at the time of this analysis. Briefly, the
food manufacturing data available is discussed before this report continues into industry-specific
analyses in the final section, Section IV.
In food manufacturing, Mexico and Canada are leaders and the dramatic fall in China’s
imports (31.1%) was worth $2.63 bn from an $8.46 bn share of U.S. imports in 2018. There is no
country that is a clear winner from China’s loss in terms of trade volume though smaller volume
countries including Vietnam, South Korea, Ireland and Taiwan have seen a steady rise in their
exports to the U.S.8 Figure 16a describes the gross loss/gain of top suppliers of food
manufacturing products to the U.S. in millions USD in 2019 whereas Figure 16b highlights the
relative percent changes for these suppliers (Appendix 2 describes input data).
Figure 16a: Change in Millions USD for Top Food Manufacturing Suppliers to U.S. in 2019
Source data: USITC
8
Interestingly, food manufacturing imports declined from Brazil in 2019 too.
23Figure 16b: Percent Change for Top Food Manufacturing Suppliers to U.S. in 2019
Source data: USITC
In conclusion, this analysis shows that there has been trade destruction and diversion in
2019. The observed trade destruction was larger than diversion, which may be attributable to gains
in U.S.-based production, economic uncertainty in investment, and U.S. tariff imposition on other
trading partners in addition to China. Manufacturing industries faced these variable tariff rates and
changing business conditions in China, the U.S., and neighboring third countries, where improving
business conditions stood in contrast to rising wage rates in Chinese manufacturing. To further
investigate, Section IV describes early shifts in global sourcing of U.S. imports for six selected
industries.
24IV. Sectoral Trade Responses: How and Why They Varied
This section analyzes U.S import data and company case studies to understand how trade
patterns changed and differed between industries in late 2019.9 The six industries analyzed range
from apparel and footwear in consumer goods, semiconductors and communications equipment in
high-tech electronics, and pharmaceuticals and medical devices within medicine.10 Industries were
selected due to high levels of trade, U.S.-China linkages pre-trade war, and anecdotal evidence
that responses between industries differed. Expected differences have to do with varying levels of
complexity in product manufacturing required, sensitivity to highly-specialized inputs (including
human resources), and varying cost-curves per industry. Per industry, the differences and
similarities are discussed and business strategy becomes an important consideration among others;
namely, pursuit of a China plus one strategy appears in industries that faced less friction to
relocating manufacturing. Pairs of industries are grouped per subsection and each follows a
common structure: i) exposure to new and existing tariffs by trade volume, ii) year-over-year
analysis of shifts amongst top suppliers between 2017 - 19 to explain how and when industries
responded, and iii) how trade data links to business strategy with a company case study.11
A. Consumer Goods: Apparel & Footwear
i) Apparel Exposure to New & Existing Tariffs
Trade volume under Chapter 99, which has a section for Chinese imports targeted during
the trade war, illustrate apparel’s steep exposure in Figure 17. 12
9
Identical HTS classifications discussed in Section II are used in this trade data analysis, as taken from The United
States Census Bureau. The timeline that is included follows the announcements made by the U.S. administration in
regard to the tariffs on Chinese goods (2018 - 19).
10
Corresponding NAICS codes are: apparel (3152), footwear (3162), semiconductors (3344), communication
equipment (3342), medical devices (3391), and pharmaceuticals (3254).
11
Where relevant, non-tariff factors are discussed in components ii) and iv); in the high-tech electronics category, a
comparative case study follows the completion of both industries’ analyses to illustrate parallel items.
12
The Harmonized Tariff Schedule for Chapter 99 has a special section for Chinese imports that have been included
as a result of the trade war. This report measures the volume of Chinese imports in each sector that falls under Chapter
25Figure 17: Knitted Apparel Trade Volume Under General Rates and Chapter 99 (% Total)
Source data: USA Trade Online
On the left, imports of knitted or crocheted apparel traded under general rates, rates that do
not fall under a preferential trade agreement, such as the USMCA, show a steep drop in percent of
total trade under general rates. On the right, the volume of this apparel that falls under Chapter 99,
the temporary restrictions on Chinese imports, illustrate a simultaneous increase in goods traded
when the volume drops under general rates. This volume change is attributed to the imposition of
the U.S.-China trade war tariffs in late 2018 with steep escalation post July 2019. An identical shift
and timeline are observed with the volume of non-knitted apparel (Figure 18).
Figure 18: Non-Knitted Apparel Volume Under General Rates and Chapter 99 (% Total)
Source data: USA Trade Online
99 as a percentage of total trade in that sector. Chapter 99 is temporary legislation used by the U.S. to add import
restrictions before being characterized under Chapter 1 - 97 or discontinued.
26Approximately 90% of imported apparel volume from China before the trade war was
falling under general rates. Then, the second round of tariffs in August 2019 severely impacted the
apparel sector with around 85% of the incoming trade now falling under Chapter 99 restrictions.
Though the marginal apparel tariff increase was lower (discussed in Section II), the total tariff
neared ~30% and the volume of goods impacted was very high, which showcases that this industry
was heavily impacted.
ii) Year-over-Year Analysis of Top Suppliers: How & When Apparel Responded
Described in Figure 19, apparel constitutes 60% of the apparel, textile, and footwear
sectors with steady U.S. import levels of $152bn, $161bn, and $162 billion in 2017, 2018, and
2019 respectively. Imports increased moderately by 1% in 2019 from 2018 and 7% from 2017.
The suppliers have remained stable and concentrated; the top 20 suppliers took 92.25% of all
apparel import volume in 2019. The top five suppliers were consistent from 2017 – 2019 with
China, Vietnam, Bangladesh, Indonesia, and India. The largest supplier, China, experienced
severe declines in both absolute value and percentage of total in 2019 (Figures 20a and 20b).
Vietnam, the second largest supplier, has steadily closed the gap between itself and China since
2017 which suggests that the driving factors pre-dated the new trade war tariffs - already high
tariffs as of 2017 are an important factor here.
Figure 19: Top 10 Apparel Suppliers to U.S. (Annual Value in Millions USD, % of Total)
Source Data: USITC
27Typically, China has supplied about $50 bn of apparel to the U.S in 2017 and 2018 - 31%
of the U.S. apparel imports in 2018 - and it experienced a loss in share of apparel imports in 2019
instead of continuing its modest upward growth (Figure 19). This dramatic drop of apparel imports
from China, $5 bn (10%) less than that in 2018, illustrates the impact of the 15% new tariffs applied
to $112 billion of Chinese imports of apparel and textiles took effect on September 1, 2019 which
hit 91.6% of Chinese apparel, 68.4% of home textiles and 52.5% of footwear imports (American
Apparel and Footwear Association, 2019). The shock of the imposed additional tariffs led to an
abnormal and shorter peak in U.S. imports of apparel from China; this abnormality accompanied
the drastic drop of volume in August 2019 (Figure 20b). Whereas, Vietnam, the second largest
exporter, increased its exports to the U.S. with an always positive y-o-y increase from 2017 to
2019 and generated a $2.5 billion (10%) increase in 2019 compared with 2018. Instead of China
maintaining its share and modest growth, Chinese imports dropped to three year low and this loss
is not fully captured by the most likely substitute candidates, Vietnam and Bangladesh. The other
seven suppliers out of the top 10 took a total $1.2 bn increase. The imposition of new trade war
tariffs had accelerated sourcing shifts away from China that were already happening in the sector.
Still, Vietnam was far from catching up to total volume from China and would have needed to
more than double its apparel exports to reach the current level from China.
Figure 20a: Top 5 Apparel (NAICS = 3152) Suppliers to U.S. in Million USD
Source Data: USITC
28Figure 20b: Year over Year Percent Change in Top 5 Apparel Suppliers to U.S.
Source Data: USITC
iii) Business Strategy Linkages for Apparel
The pattern observed indicates a long-term China plus one business strategy to move
sourcing that can move outside of China to suitable neighbors such as Vietnam and Bangladesh.
These shifts alleviate the high-tariff burden that apparel suppliers face when exporting to the U.S.
from China by a minimum of 15% tariff added as a result of the trade war and reduces long-term
uncertainty in sourcing mix based on country-specific exposure to risk. The pattern observed
during 2017-2018 confirms that the U.S. apparel sector has become less dependent on Chinese
imports which can be jointly attributed to high-tariffs and changing business environments
including the increasing labor cost in Chinese cities and relatively lower labor costs among
ASEAN neighbors such as Vietnam. When Donald Trump was elected U.S. president in 2017, this
decoupling trend accelerated and was in-part attributable to increased uncertainty about
international manufacturing relationships, especially with China, as referenced in Section I & II.
This effect became dramatically visible in China’s drop in 2019 and Vietnam’s jump up when the
new tariffs went into effect in late 2019.
In a case study of Gap, there is evidence of this sourcing shift where its sourcing from
China went down from 22% in 2017 to 16% in 2019 and its Vietnamese sourcing went up to 32%,
up from 25% in 2017. Further, there is likely price sensitivity to the effect of tariffs when Gap’s
29former long-term CEO indicated that “in some cases, we’ll have no choice but to pass the impact
of these tariffs through our consumers” (Chang, 2018). This case study provides a consolidated
picture of how it navigated uncertainty and rising tariffs in 2018 - 20 which shows the role of non-
tariff and tariff factors alike on business strategy. For Gap, a long-term China plus one strategy to
shift sourcing away from China to neighboring countries was already playing an important role
and, for some products, there was low friction to switching sourcing due to comparable industry
development in Vietnam.
3031
32
In summary, apparel trade data about U.S. imports and the case of Gap support the same

conclusion: rising costs and political uncertainty affecting China are leading to shifting apparel

outside of China and into substitutable countries, including Vietnam. The Trump administration’s

tariffs further catalyzed these shifts that were already occurring prior to the trade war; notably, the

shifts observed and accelerated are evidence of a China plus one strategy. Then in 2020, sourcing

from all countries became more volatile due to the COVID-19 pandemic as Gap retail stores

closed, demand slumped, sourcing of summer products planned for in-store sales were held abroad,

and fall production was asked to halt.

B. Consumer Goods: Footwear-Specific Analysis
i) Footwear Exposure to New & Existing Tariffs
       This section extends the analysis from apparel to how footwear was impacted by the trade

war in late 2019. By volume, footwear imports falling under Chapter 99 grew sharply in August

2019 and peaked at 40%, which was lower than apparel’s exposure by volume. The volume of

footwear traded fell and imports under general rates stabilized at 60% of total trade in this industry

at the end of January 2020. This indicates that only a small fraction of trade in footwear fell under

preferential agreements. Though, a similar trend of tariff and non-tariff factors played a role in

supply chain movements out of China as illustrated in the case of Crocs, Inc.

       Figure 21: Trade Volume Under General Rates and Chapter 99 (as % of total)

                                                                          Source data: USA Trade Online

                                                                                                          33
ii) Year-over-Year Analysis of Top Suppliers: How & When Footwear Responded
Total U.S imports of footwear reached $26 bn, a slow increase of 2% compared to that in
2018 and 7% increase compared to $25 billion in 2017. The top suppliers for U.S footwear, China
and Vietnam, supply 76% of the total imports while the remaining top eight suppliers account for
19%. Among the top 10 suppliers, China and Spain were the only two countries that experienced
negative growth rates in both 2018 and 2019; Vietnam, Indonesia, India, and Cambodia rapidly
increased their supply of imports with growth rates between 11% - 81%.
Figure 22: Top Suppliers of Footwear (NAICS: 3162) for U.S
Source data: USITC
China supplied about $13bn of goods in the footwear sector each year during 2017 – 2019,
which accounted for over half of the total import from outside the U.S. and steadily declined in
growth rate year to year in 2018 and 2019. This shrinkage accelerated in 2019 with a -4% shrinkage
up from -1% in 2018. Affected by 15% Section 301 tariffs, 52.5% of footwear imported from
China was hit which caused the monthly growth rate (y-o-y change) of Chinese imports dropped
down to -20% in October 2019 (American Apparel and Footwear Association, 2019). Similar to
apparel, it was visible from the trade data that the peak for Chinese footwear imports from during
the summer ended earlier in August 2019; before this decline, there was a small bump of increasing
supply in July 2019 which may indicate that stockpiling occurred in anticipation of tariffs. Both
peaks proceeded to negative growth rates after the 15% tariffs took effect in September 2019.
34While Chinese supply suffered, major competitors including Vietnam, India, and Indonesia
experienced increases of over 10% monthly, which indicated a pattern of searching for substitution
of Chinese suppliers in the industry. However, given the large proportion of footwear imports from
China, in the short run it was difficult to observe other competitors gaining significant market
share comparable to China’s predominant position.
Figure 23: Top Suppliers of Footwear for U.S. Imports: 2018-19
Source data: USITC
Figure 24: Top Suppliers of Footwear for U.S. Imports: 2018-19 (Y-o-Y Changes)
Source data: USITC
iii) Business Strategy Linkages for Footwear
In the case of Crocs, Inc., the reduction of U.S. imports from China is evidenced through
long-term business strategy to diversify supply chains out of China due to rising costs and relative
35ease of substituting alternative countries in the region. This provides preliminary evidence that the
imposition of tariffs further affected cost-curves which suggests that the tariffs have driven
diversification out of China more quickly than otherwise might have been seen. Further, the
combination of U.S. import data analysis, Crocs’ case, and non-tariff factors discussed in Section
II suggest that Vietnam and other economies in the ASEAN region have become the alternative
destination of choice for both footwear and apparel brands alike – evidencing a China plus one
strategy.
3637
38
To quickly recap, this section dissects the trend of trade volume and the U.S imports in

apparel and footwear sectors and confirms the negative shock of Trump’s tariffs on U.S.-China

linkages in the apparel and footwear sectors. Further, the case studies of Gap and Crocs confirm

the pursuit of China plus one strategies to respond to the acceleration of rising costs through the

new tariffs and rising costs that pre-date the trade war as Chinese labor costs rose and business

conditions improved favorably in neighboring countries. This trend has been accelerated by

Trump’s tariffs and suppliers were further affected by the COVID-19 pandemic in early 2020.

C. Electronics: Communications & Semiconductors
i) Electronics Exposure to New & Existing Tariffs
       Electronics is a key sector for U.S-China industrial linkages with one third of the total

supply to the U.S. being computer and electronic products (Vietor et al., 2016). In this industry,

trade volume under general rates was already very low at 25% at the start of the period. This

implies that electronics trade with China occurred under special import programs with low tariffs

before the trade war. However, there is a rise in volume trade under Chapter 99 restrictions that

happened in May 2018, earlier than apparel and footwear. By the end of the period, 40% of

electronics imports fell under the Chapter 99 restrictions which suggests that electronic equipment

may not have been as negatively impacted as apparel and footwear by volume.

       Figure 24: Trade Volume under General Rates and Chapter 99 (% of total)

                                                                       Source data: USA Trade Online

                                                                                                   39
Monthly U.S. electronics import data covers a wide range on a 4-digit level from 3341 to
3346. Among those, communications equipment (NAICS: 3342) took almost one third in 2018,
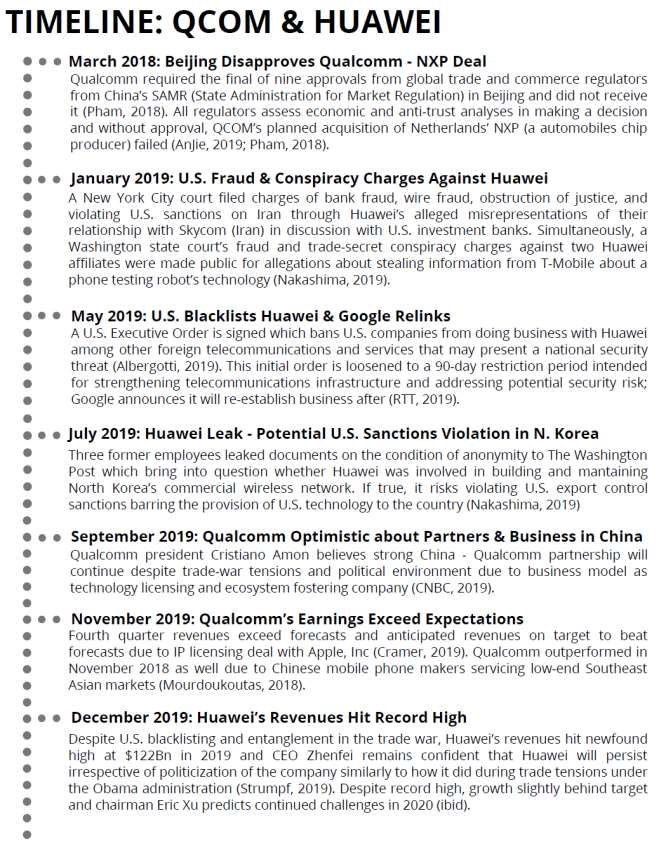
and was at the center of key debates in cases like Huawei. Semiconductors (NAICS: 3344) was
similarly in the spotlight with Qualcomm’s case and was directly affected by Section 301 tariffs.
These two industries are linked as part of the same supply chain for telecommunications and
related emerging technologies in 5G. Thus, in this section, the analysis of semiconductors and
communications equipment industries are considered sequentially before side by side cases of
Qualcomm and Huawei at the end of this section.
Figure 25: 4-digit Categories of Electronics Sector
Source data: USITC
ii - a) Year-over-Year Analysis of Top Suppliers: How & When Semiconductors Responded
U.S. imports in semiconductors shrank by 15% in 2019 when only $73bn of goods was
imported, compared with $85bn in 2018 and $81bn in 2017 - a loss of over $10bn in semiconductor
imports. Affected by the Section 301 tariffs, imports from the largest supplier, China, dropped
sharply by 167% in 2019 to $9bn, down from $23bn and $24 bn in 2017 and 2018 respectively.
China drops to third place in 2019 after front-runners Malaysia (1st) and Taiwan (2nd). It is visibly
shown in Figure 26a when the second round of tariffs hitting semiconductor products was enacted
on August 23, 2018; the monthly imports dropped from over $2.2bn to $1.25bn in only one month.
During 2019, monthly imports from China remained at a low level of less than $1bn and were on
average 70% less than the same numbers in 2018.
40Figure 26a: Top Suppliers of Semiconductors to U.S: 2018-19 (in Million U.S.D)
Source Data: USITC
Figure 26b: Top Suppliers of Semiconductors to U.S: 2018-19 (Y-o-Y Changes)
Source Data: USITC
Who benefits from the tariffs?
Looking at the suppliers in 2019 who surpassed China, Malaysia jumped to the top in 2019
by remaining at a 4% growth rate of annual supply which translates to about $18bn. The previous
third place, Taiwan, experienced a 17% annual increase: a jump from $7.6bn in 2018 to $9.2bn in
2019 which raised Taiwan to the position of second largest supplier. During 2019, Vietnam and
Taiwan were those countries with extremely high y-o-y increases of 60 - 159% and 20 - 30%
41respectively. Alongside China, countries like South Korea, Japan, Philippines, and Canada also
experienced reductions in their prior shares of supplied semiconductors.
Undoubtedly, China suffered a severe loss in 2019 for semiconductors supply to the U.S.
market due to the imposition of new tariffs and relevant trade war politicization of
telecommunications. However, none of the competitors in the data analyzed have been able to
capture the size of the pie lost from China, since a $15bn decrease of Chinese imports in 2019 led
to a drop of $12bn in total U.S. semiconductor imports. Among the top ten suppliers who take 88%
of the pie, only Taiwan and Vietnam took over $1bn increases each in 2019; $1.6bn for Taiwan
and $1.4bn for Vietnam. Suppliers outside the top ten only contributed $62 million of increased
supply to U.S. imports in 2019. A preliminary reason for this is that it is not easy to build and
expand complex semiconductor manufacturing in the short term when confronted with an
unexpected shock, like a trade war. It also suggests the possible external factor of U.S.-based firms
supplementing U.S. supply that was referenced in Section II may play a role.
ii - b) Year-over-Year Analysis of Top Suppliers: How & When Communications
Equipment Responded
Semiconductors are an intermediate good for multiple goods within the communications
equipment industry. This analysis provides insight into whether the changes in semiconductor
imports bear on communications equipment. U.S. imports of communication equipment (NAICS:
3342) shrank 11% in 2019. Compared with the $124bn in imports from outside the U.S in 2017,
the imports value in 2019 reduced to only $113.7bn, which is 11% less than that in 2018 ($127.5
bn) and 9% less than that in 2017 ($124.7bn).
42Figure 27: Top 10 Suppliers U.S Imports of Communication Equipment (NAICS: 3342)
Source data: USITC
Six out of the top ten suppliers of communication equipment provided at least 10% less in
2019 than amounts supplied in 2017. Among main competitors, only Vietnam and Taiwan
experienced a rigorous increase of imports supplied, 49% and 38% respectively, in 2019; this
occurred alongside total imports from outside the U.S. declined 11%. China, the largest supplier,
taking up over 60% of total U.S. imports for communication equipment, provides only $69.6 bn,
which is 11% less than the $78bn in 2017. Other main players included Mexico, China’s runner-
up in 2017 – 2018 that dropped to third position in 2019, Malaysia, which held fourth - sixth
position in 2017-2019, and Thailand which held sixth position in 2017-18 and seventh in 2019.
However, others also experienced negative growth when comparing months on a year to year scale
for 2018 and 2019. South Korea, which was the third largest supplier in 2017, was the country
jumping up and down since 08/2018 and dropped to fifth position in 2019 with $3.5bn supplied,
45% less than that in 2017. Apart from China and South Korea, other suppliers recovered to an
increase in growth since 12/2019.
43You can also read