Review of aeronautical fatigue and
structural integrity investigations in
the Netherlands during the period
March 2017 - March 2019
←
→
Page content transcription
If your browser does not render page correctly, please read the page content below
Review of aeronautical fatigue and structural integrity investigations in the Netherlands during the period March 2017 - March 2019
Review of aeronautical fatigue and structural integrity investigations in the
          Netherlands during the period March 2017 - March 2019

                                                R.C. Alderliesten

Abstract
This report is a review of the aeronautical fatigue and structural integrity activities in the Netherlands during
the period March 2017 to March 2019. The review is the Netherlands National Delegate’s contribution to the
36th Conference of the International Committee on Aeronautical Fatigue and Structural Integrity (ICAF) in
Krakow, Poland, on 2 and 3 June 2019.

An electronic version of this review is available at http://repository.tudelft.nl/.

                                                         2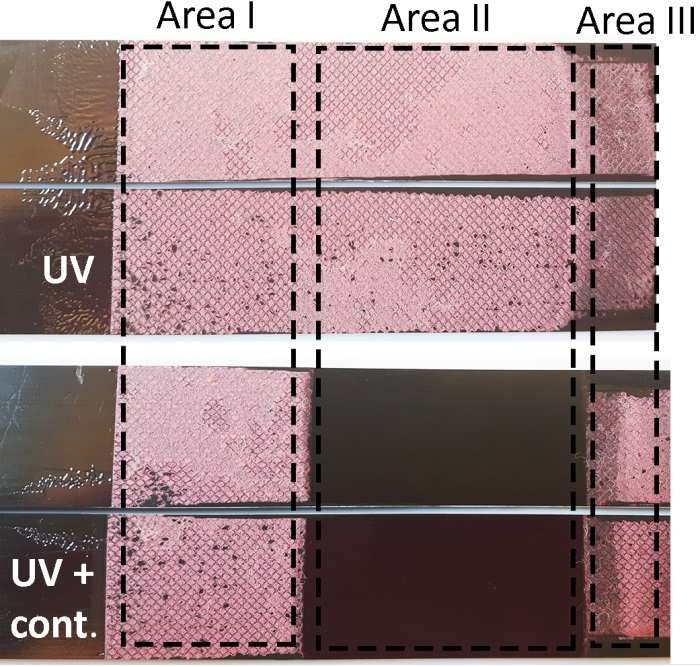
Table of Contents
Abbreviations ..................................................................................................................................... 5
1.           Introduction ......................................................................................................................... 6
2.           Metal Fatigue ....................................................................................................................... 7
     2.1.    Interaction between stress ranges and stress ratios during variable amplitude .................... 7
     2.2.    Prediction of fatigue in engineering alloys (PROF) ................................................................ 8
     2.3.    On the plastic dissipation during fatigue crack growth.......................................................... 9
     2.4.    Stress-life properties of laser powder bed fusion Inconel 718 fatigue specimens ................ 10
     2.5.    Additive Manufacturing and Certification of Flight Critical part .......................................... 11
     2.6.    Methodology for predicting the fatigue life of lug joints subjected to combined in-plane and
             out-of-plane loading........................................................................................................... 14
     2.7.    Stress Intensity Factor solution development ..................................................................... 15
     2.8.    Analysis of weight reduction of Al-Li high-altitude fuselage ................................................ 16
3.           Adhesively Bonded Interfaces ............................................................................................ 21
     3.1.    The use of acoustic emission and composite peel tests to detect weak adhesion in
             composite structures ......................................................................................................... 21
     3.2.    How pure mode I can be obtained in bi-material bonded DCB joints: a longitudinal strain-
             based criterion ................................................................................................................... 22
4.           Composites & Fibre Metal Laminates ................................................................................. 25
     4.1.    Determination of Mode I Fatigue Delamination Propagation in Unidirectional Fibre-
             Reinforced Polymer Composites......................................................................................... 25
     4.2.    The effect of frequency on the fatigue delamination growth rate in composites ................ 25
     4.3.    Investigating energy dissipation for a methodology with fatigue master curves ................. 27
     4.4.    Towards the certification of bonded primary Fiber Metal Laminate structures by bolted
             Disbond Arrest Features ..................................................................................................... 29
     4.5.    No growth of butt joint damage in thermoplastic orthogrid fuselage panels ...................... 30
5.           Prognostics & Risk Analysis ................................................................................................ 32
     5.1.    Extreme Prognostics of Composite Structures .................................................................... 32
     5.2.    Structural risk assessment tool ........................................................................................... 34
6.           Non-Destructive Evaluation................................................................................................ 36
     6.1.    NDI of hybrid structures ..................................................................................................... 36
     6.2.    Characterisation of Matrix Cracks in Composite Materials Using Data from Fibre Bragg
             Grating Sensors .................................................................................................................. 36
     6.3.    Friction stir weldbonding defect inspection using phased array ultrasonic testing .............. 38
     6.4.    Transducer Placement Option of Lamb Wave SHM System for Hotspot Damage
             Monitoring ......................................................................................................................... 39
     6.5.    Fibre Optic Sensing for Structural Health Monitoring ......................................................... 40

                                                                         3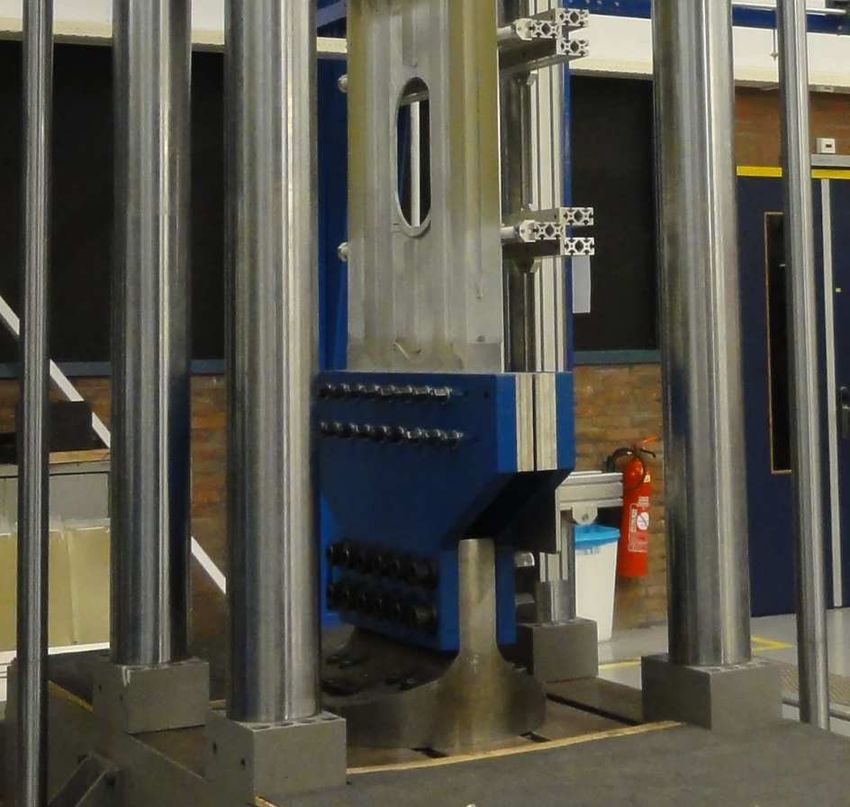
6.6.    New damage indicators for structural health monitoring applications ................................ 41
     6.7.    Experimental assessment of the influence of welding process parameters on Lamb wave
             transmission across ultrasonically welded thermoplastic composite joints ......................... 42
7.           Structural Health & Usage Monitoring ................................................................................ 44
     7.1.    Landing gear health monitoring ......................................................................................... 44
8.           Fleet Life Management ...................................................................................................... 45
     8.1.    Individual tracking of RNLAF aircraft................................................................................... 45
9.           Special Category................................................................................................................. 46
     9.1.    Fatigue Crack Growth Failure and Lifing Analyses for Metallic Aircraft Structures and
             Components ...................................................................................................................... 46
References........................................................................................................................................ 47

                                                                         4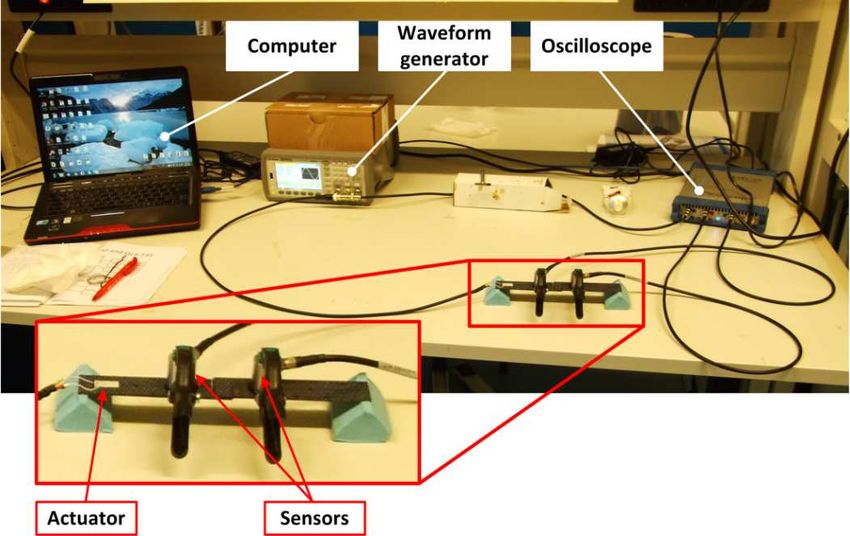
Abbreviations

AE     Acoustic Emission
AM     Additive Manufacturing
CA     Constant Amplitude
CBP    Composite Bell Peel
CFRP   Carbon fibre reinforced polymer composites
CLS    Cracked Lap Shear
DAF    Disbond Arrest Feature
DCB    Double Cantilever Beam
DIC    Digital Image Correlation
EIFS   Equivalent Initial Flaw Size
FBG    Fibre-Bragg Grating
FCG    Fatigue Crack Growth
FE     Finite Element
FML    Fibre Metal Laminate
FOS    Fibre Optic Sensing
FSW    Friction Stir Welding
GFRP   Glass fibre reinforced polymer composites
GW     Guided waves
HIP    High Isostatic Pressure
LEFM Linear Elastic Fracture Mechanics
POF    Probability of Failure
PROF   PRrediction Of Fatigue in engineering alloys
QF     Quantitative Fractography
RNLAF Royal Netherlands Air Force
RUL    Remaining Useful Life
SERR   Strain Energy Release Rate
SHM    Structural Health Monitoring
SIF    Stress Intensity Factor
SRA    Structural Risk Analysis
TRL    Technology Readiness Level
UD     Unidirectional
UW     Ultrasonic Welding
VA     Variable Amplitude

                                                 5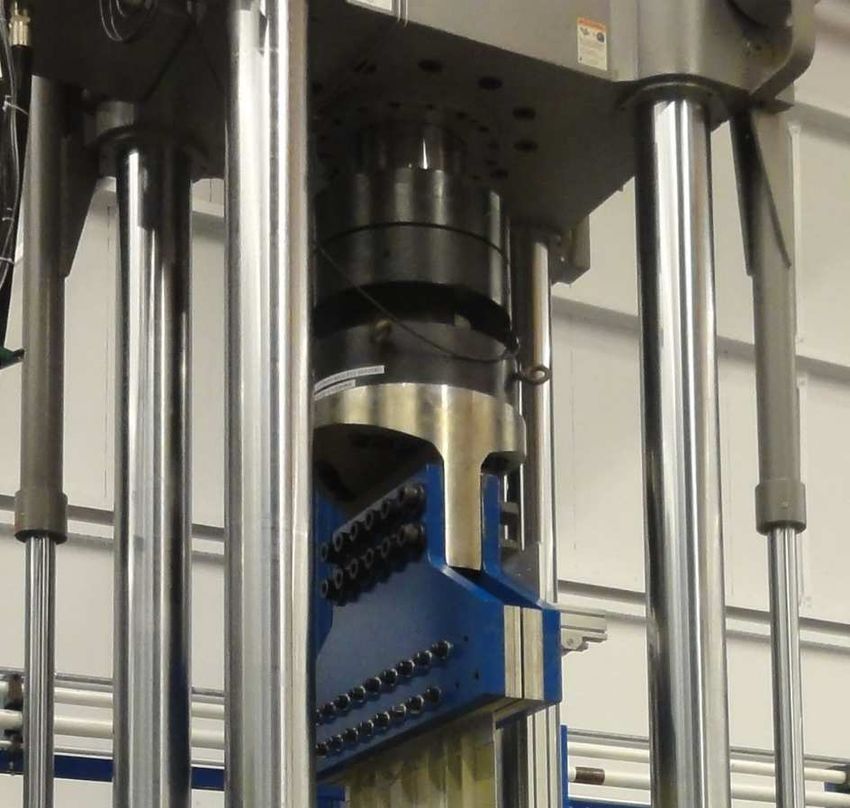
1. Introduction

The present report provides an overview of the work and research performed in the Netherlands in
the field of aeronautical fatigue and structural integrity during the period from March 2017 until
March 2019. The subjects in this review come from the following contributors:

    •   Delft University of Technology (TU Delft)
    •   GKN Aerospace-Fokker (GKN Fokker)
    •   Netherlands Aerospace Centre (NLR)
    •   Royal Netherlands Air Force (RNLAF)
    •   University of Twente (UT)

Additionally, collaborative work between the NLR and the Defence Science and technology Group
(DST-G) of Australia, and between TU Delft and various European universities and institutes is
included.

The names of the principal investigators and their affiliations are provided at the start of each
subject. The format and arrangement of this review is similar to that of previous national reviews.

                                                    6
2. Metal Fatigue

2.1. Interaction between stress ranges and stress ratios during variable amplitude
Jesse van Kuijk, René Alderliesten, TU Delft

This PhD research project focuses on the physics underlying constant and variable amplitude (VA)
fatigue crack growth in relation to stress ranges and opening/closing stresses. The concepts of
physics considered are the application of strain energy (work) when loading, and the dissipation of
energy through plasticity and the formation crack surfaces.

The latter was initially explored through correlating the formation of crack surface area with the
more common one-dimensional crack length. The main question addressed was whether the use of
the crack surface area as base parameter rather than crack length would improve existing models, or
at least explain certain observations reported in literature. Correlating a model based on crack area
with cracks observed developing in laboratory experiments suggested indeed an improvement,
which tends to indicate that crack area is a better base parameter than crack length, in particular for
small cracks propagating in a planar fashion. This study was presented at the Fatigue 2018
Conference in Poitiers, France [1].

Fatigue tests on aluminium 2024-T3 CCT specimens containing through- and corner-cracks were
performed to study the crack front growth post-mortem through optical and electron microscopy.
The measurements of crack lengths through digital photography and the measurement of plastic
crack tip fields through digital image correlation systems proved successful in capturing crack growth
rate and plasticity development. Crack lengths were accurately measured with the potential drop
technique, allowing measurement of the pivot points [2] in the crack growth curve.

An energy approach to crack growth is currently investigated, assessing the elastic, plastic, and crack
growth energy (dissipation) components of a cracked plate undergoing constant amplitude fatigue
loading, and later also VA loading. To understand how these components change with increasing
crack length and time, a theoretical model is in development to explicitly describe the various energy
components during one crack growth cycle. The development of this model is supported with finite
element simulations, replicating the physical fatigue crack growth experiments as digital twin, to gain
insight and quantitative information on the different energy components. Integrating this through-
the-cycle model expressed in d/dt yields a crack growth rate d/dN, to be related to experimental data
and legacy prediction models.
The role of the opening stress Sop in the ΔKeff similitude parameter in relation to crack closure
phenomena has been studied with finite element analyses and theoretical modelling. A new physical
model based on the cyclic energy per half cycle is proposed (schematically illustrated in Figure 1).
This study will soon be published.

                                                   7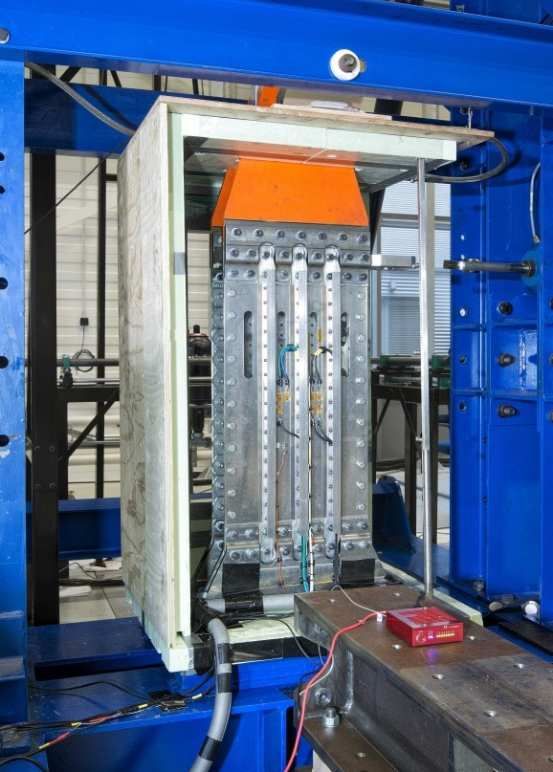
stress (~force)

                                                       stress (~force)

Figure 1   The change in energy during a loading cycle, for two different R values, for a bi-linear
           elastic material. When the crack opens, the stiffness changes. The sum of the area under
           the curve for each case is equal to the applied cyclic energy in that specific cycle.

2.2. Prediction of fatigue in engineering alloys (PROF)
Emiel Amsterdam, Netherlands Aerospace Centre NLR

The objective of the project “Prediction of fatigue in engineering alloys (PROF)” is to improve the
physical understanding and prediction of fatigue in engineering alloys. This four year project was
initiated by NLR in 2016, in collaboration with Fokker, Embraer, Airbus Lloyd’s Register and Wärtsilä.
Delft University of Technology and the Royal Netherlands Air Force are also involved in the project.

In the project it is clearly demonstrated that crack growth in AA7075-T7351 shows a power law
relationship with ΔK at all tested length scales/ΔK values. The power law behaviour at all crack
lengths, the introduction of pivot points and modern computer technology allow fitting of the a-N
curve to obtain crack growth rates without any noise. This replaces the method of incremental
polynomial fitting, which introduces noise and errors in the crack growth rate results. The ability to
obtain very accurate crack growth rates will require less testing in the future and opens up a whole
range of opportunities for understanding crack growth in ductile materials. It can also be used, for
example, to exactly determine the influence of small factors such as temperature, humidity and
frequency. Fatigue crack growth during VA testing also exhibits power law behaviour between pivot
points. The crack growth is exponential at higher stress intensity factors (SIF), where the SIF is
calculated with the maximum stress of the VA spectrum. At lower SIF values the power law
exponents are greater than for the exponential crack growth region (where the exponent equals
two). The measurements show that the crack growth rate has a power law relationship with the SIF
for different maximum stresses.
Some of the results have already been published [3,4].

                                                   8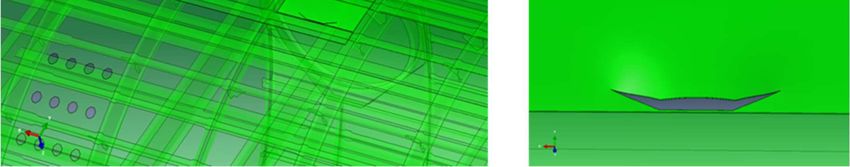
Figure 2   Aluminium 7075-T7351 coupon with a fatigue crack. The crack size is measured both
           optically and with the direct current potential drop (DCPD) technology.

2.3. On the plastic dissipation during fatigue crack growth
Hongwei Quan, René Alderliesten, TU Delft

Although Linear Elastic Fracture Mechanics (LEFM) has been applied successfully to practical
engineering fatigue problems through the use of the Paris relation, it does not take into account
explicitly the plasticity phenomena that strongly influence fatigue crack growth rates (da/dN). In this
study, the fatigue crack phenomena were studied from a physical perspective. An energy approach
was chosen because its universality for various materials, and because plasticity itself represents an
important type of energy dissipation for metallic materials.

Some literature [5] proposes a linear relation between the total plastic dissipation per cycle (dUpl/dN)
and fatigue crack growth rate (da/dN), and also claims that the value of the plastic dissipation per
unit fatigue crack growth (dUpl/da) constitutes a material property that is nearly constant. In order to
verify such relationship, fatigue crack growth experiments were performed.

These fatigue experiments were performed force-controlled on central crack tension (CCT) fatigue
crack growth specimens made of 2024-T3. The test set-up is shown in the left-hand side of Figure 3.
The fatigue crack length was measured by visual observation, while the energy dissipation per cycle
was obtained through load and displacement measurements on the specimens. The load values were
recorded by the fatigue test machine, while the displacement was measured were performed using
DIC. More information is presented in [6].

From the fatigue experiments, it could be concluded that the plastic energy dissipation (dUpl/dN)
shows a nonlinear relation with da/dN, as illustrated in the right-hand side of Figure 3. Thus the value
of dUpl/da is not constant throughout the test. Therefore, the plastic energy dissipation cannot be
used to predict da/dN directly.

The reason is that the dUpl/dN is not an effective similitude parameter. From a physical perspective,
the energy balance equation of fatigue crack growth could be described as:

                                           =      +       +

                                                   9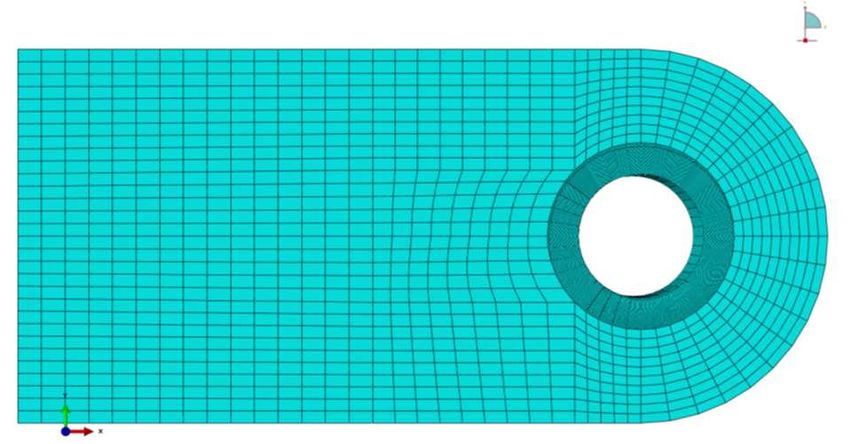
The physical meaning of this equation is that the total dissipated energy (work) during one cycle
dW/dN is the sum of the energy dissipation for the new fatigue crack surface formation dUa/dN the
plastic dissipation during one cycle dUpl/dN and the elastic strain energy change after one cycle
dUe/dN. The fatigue crack propagation is only directly related to dUa/dN, while dUpl/dN and dUe/dN
are consequences of the fatigue crack growth.

Theoretically, the crack surface forming energy is the proper similitude parameter that is directly
linked to fatigue crack growth, instead of the plastic energy dissipation. However, the value of
dUa/dN is too small to be measured accurately in reality. Therefore, the dUpl/dN seems to be the only
option left for that its value can be obtained. However, based on the current study one should be
aware that plastic dissipation and fatigue crack growth are not directly related, and some extra
efforts are needed to link these quantities.

Figure 3   The set-up of the experiments [6] (left), and the total plastic dissipation versus fatigue
           crack growth rate (right)

2.4. Stress-life properties of laser powder bed fusion Inconel 718 fatigue specimens
Emiel Amsterdam and Gerrit Kool, Netherlands Aerospace Centre NLR

The objective of this program was to obtain statistical information on the stress life of additively
manufactured (‘3D-printed’) Inconel 718 at a given maximum stress level. The distribution of the
number of cycles to failure gives information on the material properties and the defect distribution
inside the specimens. The specimens were machined and polished to obtain the bulk material stress
life properties and exclude influences from surface roughness. Tensile static and fatigue specimens
were printed by laser powder bed fusion (L-PBF) with different settings, because the mechanical
properties and defect distribution can vary with build parameters, location & orientation and post
processing. The specimens were printed in several orientations with respect to the build direction;
horizontal, vertical and at 45° inclination with the build plate – see Figure 4. Powder layer thicknesses
of 30 and 50 µm were used. A fraction of the specimens received a hot isostatic pressing (HIP)
treatment prior to the conventional heat treatment, to obtain information on the effect of the HIP
treatment on the defect distribution of the material. The results were compared with results from
fatigue tests on IN718 plate material that received a similar heat treatment. The results showed a
significant higher stress life for the printed material in all three orientations compared to the fatigue
tests on IN718 plate material and results from literature, despite the presence of typical L-PBF defects
such as porosity. Fractography and microstructural analysis indicated that the higher stress life

                                                   10
originates from a particular microstructure, which resulted in a different short crack behaviour – see
Figure 5. Even though the grain structure was changed after the HIP treatment, the L-PBF specific
microstructure was partly retained, which resulted in a stress life between conventional heat treated
L-PBF material and plate material.
Figure 4 The 3D-printed Inconel 718 specimens.
Figure 5 SEM images of the microstructure, showing subgrains.
2.5. Additive Manufacturing and Certification of Flight Critical part
H.N. Kamphuis, M. Bosman, Tim Janssen (GKN Fokker), Calvin Rans (TU Delft), M. van Hintem (MOD),
G.A. Kool (NLR)
Additive Manufacturing (AM) is a manufacturing process where parts are built layer by layer to form
a complex 3D shape. Compared to conventional subtractive manufacturing technologies it offers
11benefits in design freedom and material usage, making it very useful for expensive hard metals like
titanium. Currently AM technology has found its first applications in aircraft at non- flight critical
parts at low rate production. Since the AM process is still emerging towards industrial standards, the
use of AM parts is still very limited and not yet ready for critical applications. There is a need for
more proof to build confidence that the new AM technologies are robust and reliable enough to be
widely used in aerospace. Also the huge potential AM offers to reduce weight and improve
performance by complex, bionic designs for functional parts is starting to be exploited now. This will
be the logical next step after AM technology has been accepted by industry and airworthiness
authorities.
Figure 6 From material to shape with Additive Manufacturing (AM) (left), and Value increase of AM
process (right)
The aim of the project is to contribute to the acceptance of AM technology by producing, certifying
and flying a Flight Critical AM produced part. This raises the bar compared to non-flight critical parts,
because of the more stringent regulations for Flight Critical parts.
In this project an existing conventional machined Flight Critical part will be replaced by a geometrical
identical AM produced and certified part. Part substitution is not where the AM process has the
greatest added value (see Figure 6), however it is the next step in acceptation of the AM technology.
The selected Flight Critical part for substitution is a Titanium Door Hinge, which is installed on a
helicopter. This part will be created by the Laser Powder Bed Fusion (L-PBF) process, followed by
heat treatment and machining operation. All surfaces will be machined, similarly to the substituted
part, with the beneficial effect that the surface effects will be removed (particular the surface
roughness improves). High Isostatic Pressure (HIP) treatment is a commonly applied process to
reduce internal imperfections in AM produced parts. Because this is a costly process, the aim is to
certify the part without using the HIP process.
The challenge of metal AM lies in the fact that the bulk material is created while building the part and
one cannot rely on standard material properties established by the raw material supplier. The
material properties need to be proven consistent because they depend on the feed stock material,
the process parameters and the shape of the part.
Certification supported by test evidence is required to demonstrate that the Flight Critical part is
airworthy. Generally 2 certification approaches can be distinguished:
1. Part certification
2. Process certification
12Part certification is currently the common used approach to certify AM parts, because AM process
standards are in development. Part certification requires the least effort compared to process
certification.
The Flight Critical AM part will be certified against full strength requirements. Besides the static
loads, the part is cyclically loaded, both in the ‘low’ cycle fatigue range (N ≈ 104 -106) and in the ‘high’
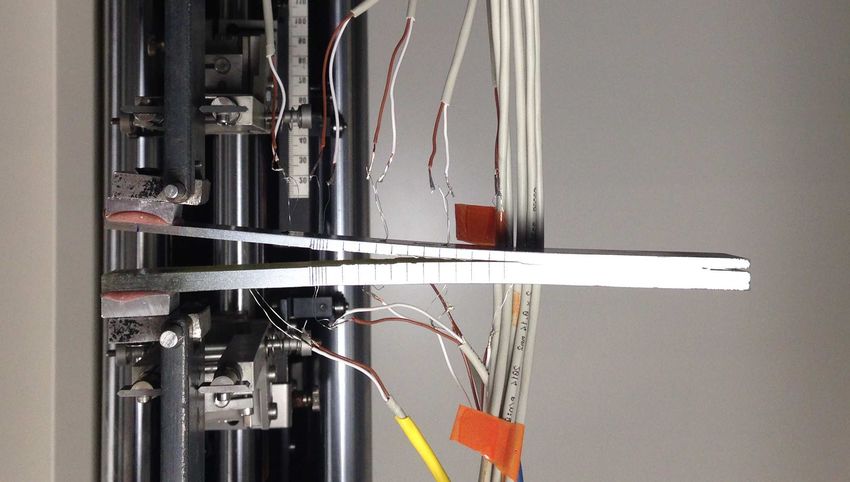
cycle fatigue range (N ≈ 109). To demonstrate the strength requirements, test specimens have been
produced and are tested, see Figure 7. The manufacturing conditions of the specimens are equal to
the to be substituted part (i.e. AM process parameters, heat treatment, machined surface, etc.).
Figure 7 AM produced test specimens (left) and tested specimen (right)
The specimens are tested for both static and fatigue strength values. With the test results a mean S-
N curve is generated to validate the ‘low’ cycle fatigue properties. These tests run up to N = 107
cycles. This curve is conservatively extrapolated to obtain the ‘high’ cycle fatigue properties at N =
109.
Relative large scatter in the fatigue properties is one of the challenges of the AM process, which is
confirmed by the test results. Also the fact that the specimens have had no HIP treatment does not
reduce the scatter. Therefore specific scatter factors have to be derived for the AM produced parts.
At the time of writing, the specimen testing is in progress. After completing specimen testing, the
actual helicopter part will be produced and tested by cut-up testing and microstructure investigation.
When this is successfully completed, the part can be certified.
AM is a promising production process since it offers low lead time, low material consumption and a
high freedom of design. However, this project only targets to substitute a Flight Critical conventional
machined part by a geometrical identical AM produced part. Nevertheless, the layer-by-layer build
approach introduces many risks for errors on a microscale resulting in variation in material
properties, particularly fatigue performance. This should be taken into account while designing a
dynamically loaded part for AM. Therefore larger specific scatter factors for the AM produced part
have to be taken into account. Furthermore the AM process should be improved reducing the errors
like gas pores or lack-of-fusion to a level that it does not cause a larger variation in material
properties compared to wrought or forged conditions.
132.6. Methodology for predicting the fatigue life of lug joints subjected to combined in-
plane and out-of-plane loading
Rutger Kuijpers, René Alderliesten, TU Delft, Tim Janssen (GKN Fokker)
A structural joint type commonly applied in aeronautics is the lug joint, in which load is transferred
via a pin. These joint types are used in aircraft for the attachments of flaps and ailerons (aircraft
movables) to the wing. With the next-generation aircraft comes the use of new aircraft movable
concepts, which compared to traditional lug joints also impose oblique- and out-of-plane loads. With
the introduction of oblique and lateral (out-of-plane) loads on lugs - illustrated in Figure 8 (a) - the
need arises for more detailed fatigue life prediction methods that take these load conditions into
account.
(a) (b)
(c)
Figure 8 Illustration of a lug joint loaded in-plane and out-of-plane (a), FE-model for a straight lug
with fine mesh in hole perimeter (b), and comparison between stress concentration factors
obtained from FEA and two handbook solutions [7]
Hence, this study aimed at developing a methodology for predicting the fatigue life for lug joints
subjected to combined in-plane and out-of-plane loading. The current fatigue prediction methods are
all based on axially loaded lugs. In concept, these methods relate the nominal stress of an arbitrary
lug to a reference lug through certain correction factors. To derive additional correction factors for
oblique and out-of-plane load components, Finite Element Analyses (FEA) were performed on
different loaded lugs using ABAQUS/CAE from SIMULIA by Dassault Systèmes. Both straight (Figure 8
(b)) and tapered lugs were simulated with and without lug hole eccentricity. Through simulating
multiple cases of adding taper angle, load angle and lateral loads (out-of-plane component) and
14comparing these to the axial load conditions, an attempt was made to establish corrections factors to
account for these load orientations previously not accounted for. In addition, it was observed that
the lug hole eccentricity required a separate correction factor
The study resulted in a methodology for predicting the fatigue life for various in- and out-of-plane
loaded lugs. Although the method could be reasonably verified, see Figure 8 (c), experiments need to
be performed to validate the work and the proposed correction factors.
2.7. Stress Intensity Factor solution development
Frank Grooteman, Netherlands Aerospace Centre NLR
Funded by the European Space Agency ESA and in close collaboration with Southwest Research
Institute (NASGRO software), NLR has developed several new Stress Intensity Factor (SIF) solutions for
displacement-controlled crack geometries for NASGRO. These are:
• Through crack at plate center with quadratic displacement field (v8 - TC24)
• Corner Crack with bi-quadratic displacement field (v8 - CC20)
• Surface Crack with bi-quadratic displacement field (v9 – SC33)
• Through crack from an offset with quadratic displacement field (v9)
The geometries of the first two cases, TC24 and CC20, are shown below in Figure 9.
Figure 9 Examples of new displacement-controlled crack geometries in NASGRO.
Use was made of the finite element tool Abaqus, which offers a CAD modeller and an extensive
application program interface with which external code can be written to modify the FE model and
process the results. In a previous project at NLR, a generic framework was developed with which such
stress intensity factor solutions can be generated much more efficiently for complex geometries and
loads that formed the basis of these analyses. Automation is very important since many (tens of
thousands) FE models needs to be generated and solved for the various crack geometries, especially
2D cracks, requiring a highly automated procedure to make this feasible.
Currently, a new solution is being developed for round notched bars with a semi-elliptical crack, see
Figure 10, for which very limited SIF solutions exist in NASGRO.
15Figure 10 Semi-elliptical surface crack in a round bar.
2.8. Analysis of weight reduction of Al-Li high-altitude fuselage
J.E.A. Waleson, GKN Fokker
GKN Fokker manufactures bonded fuselage skin panels. Materials applied are 2024-T3 Clad for skins,
7075-T6 Clad for doublers and triplers, 7075-T73511 extrusions for stringers. The feasibility of a
lighter Al-Li design with integrated doubler and bonded stringers was investigated for the skin panels.
Both 2060-T8E30, which performs well for damage tolerance, and the more balanced 2198-T851
were analysed. Further, a comparison with 2425-T3 Clad was made. Because the thickness of the skin
pockets is likely to have the largest effect on weight, the study focused on the criterion that was
sizing for this thickness.
Analysis showed that the general buckling (Johnson-Euler) level was not critical for the skin pocket
thickness and that the level could be increased by adding relatively little weight to only the bulb of
the stringer in these panels, see Figure 11.
0.050+0.007+0.032 = 0.089 in
Stringer
7075-T7351
.032-in dblr 7075-T6 Clad
.050-in skin
2024-T3 Clad
Figure 11 Fuselage panel with bulbed stringer section (right hand: cross section through stringer
location).
16In large areas of high altitude fuselages (altitudes above 45,000 ft) the sizing criterion was found to
be the maximum acceptable cabin pressure loss or maximum pressure vessel opening for
longitudinal cracks (with broken frame) after the required crack growth period [8].
The comparative analyses of the pressure vessel opening were limited to a mid-bay crack in .045-in
skin pockets made of the new materials, because this type of analysis could be correlated with
available test results for the .050-in 2024-T3 Clad baseline. It was assumed that a skin option which
performance was sufficient for a mid-bay crack would also be feasible for a crack with broken frame.
Complementing analyses of cracks centred about a severed frame were dropped because of budget
limitations.
Da/dN data for the new considered alloys were available only at R=.1. Therefore, an equivalent
number of cycles at equal ∆K, but with R=.1 was computed for the crack length and pressure vessel
opening in .050-in 2024-T3 Clad, with which the number of cycles of the new alloys could be directly
compared. Any different effect of the R-ratio on the alternative skin materials had to be neglected
due to lack of data.
Analysis of pressure vessel opening
The pressure vessel opening of a mid-bay crack after growth during 4 intervals from a clearly
detectable crack was used to compare the skin alloys. Both the crack growth rate and bending
stiffness have an effect on the opening, which both were included in the analysis. To take advantage
of better crack growth behaviour of the new alloys and the higher stiffness of the Al-Li alloys they
were analysed with a smaller skin pocket thickness: .045 in compared to .050 in of the baseline 2024-
T3 Clad.
The smaller thickness increases the normal stress, which has an effect on the rate and, hence, the
length of the crack and the pressure vessel opening. Cracks that initiate along stringers tend to grow
away from the stringer, which causes flapping of the skin, see Figure 12. The smaller thickness
decreases the bending stiffness limiting the flapping, which also has a direct effect on the pressure
vessel opening.
Before using the analysis for the assessment of the new alloys, it was validated with a test on a
curved pressurized panel for the baseline material 2024-T3 Clad of .05-in thickness.
Figure 12 The FEM result that reproduces the crack along a stringer growing away from it and
causing flapping of the skin.
17The adopted analysis approach was developed by Vincent Bouwman from 4RealSim Services. In the
area of the crack the skin is split in three layers of quadratic hex-elements:
• Outer layers of .0039 in (.10 mm) thick;
• Middle layer of .0421 in (1.07 mm) thick.
The crack tip is assumed one straight line through all layers, normal to the surface. A contour integral
J on either side of the skin was computed in a geometrically non-linear ABAQUS Standard analysis,
see Figure 13. The maximum J of both Jinner surface and Jouter surface was selected to compute the rate and
crack angle. Assuming J equal to the strain energy release rate G, an equivalent mode-I stress
intensity factor Keq is calculated as a function of the crack length using:
=
assuming a pure plane stress state for the .045 and .050-in skins. Note that for plane strain the
resulting Keq is a factor 1/(1-ν2) higher.
Further, the crack angle as function of its length was determined as the angle of the crack extension
that yielded the largest difference in J (or strain energy). For the .045-in Al-Li and .050-in 2024-T3
Clad skin pockets different models were created to account for the effect of the stiffness on the
stress distribution, the crack angle, and the bending. Note that the models depend on the stiffness of
the material but were assumed independent of the da/dN curve. With this curve the growth rate was
calculated using Keq, from which the crack length as function of the number of cycles was
determined.
Figure 13 Meshing to compute contour integral J on either side of the skin.
Correlation of .050-in 2024-T3 Clad analysis with test
Input data and analyses with an effect on the final computation of the pressure vessel opening are:
• Far field stress distribution including skin pillowing, which was correlated to test;
• Computation of the J-integral including the effect of skin bending;
• Derivation of the equivalent mode-I ∆K;
• Da/dN data;
• Computation of the crack angle;
• Local bending of local crack edges.
18Figure 14 shows the correlation of the crack length of the analysis with that of the test for .050-in
2024-T3 Clad at 11 psi pressure differential cycles (R=0). The overall correlation was deemed
acceptable. Two details may not have been captured well:
• In the test the rate within in the first interval seems higher which may be explained by the
neglected effect of KIII close to the stringer;
• The rate in the test shows a relatively sharp increase after four intervals.
However, it was assumed that these effects were similar for the different materials, enabling
comparative analyses. The shape of the crack correlated well with the test.
D-box test
Current TH3 / SPRAC data
half crack length a (mm)
∆ p=11 psi, R=0)
number of cycles (∆
Figure 14 Correlation of computed crack growth in 2024-T3 based on “TH3/SPRAC” da/dN data with
test data.
Crack growth results for new alloys
Fig. 5 shows the crack length and pressure vessel opening as a function of the number of ∆p=11-psi
cycles (using the available R=.1 da/dN curves) for .045-in skin pocket thickness of:
• 2198-T851;
• 2060-T8E30;
• 2524-T3 Clad.
The pressure vessel opening of mid-bay cracks after 4 intervals (R=0) were used to compare these
new thinner materials to that of .050-in 2024-T3 Clad. For the actual comparison the crack length in
.050-in 2024-T3 Clad at equal ∆K but R=.1 cycles is added as reference, e.g. 3.1 intervals at equal ∆K
but R=.1 result in similar crack length and pressure vessel opening as after 4 intervals at R=0.
Analysis shows that a clearly detectable crack in a .045-in Al-Li 2060-T8E30 skin pocket reaches a
similar pressure vessel opening as in the thicker, 050-in 2024-T3 Clad in a considerably longer interval
than required. The interval is longer even when the da/dN curve at R=0 is used for 2024 and da/dN
curve at the more critical R=.1 (equal ∆K) for 2060 as a conservative approach. This means that the
assumption that the R effect is similar for both alloys needs not be used. This favourable result
supported the argument for further research and testing of 2060-T8E30.
192024 t=.050 in (1.27 mm) R=0 a (in) 2024 t=.050 in (1.27 mm) R=.1 a (in)
Crack length a (in), pressure vessel opening A (in2)
2198 t=.045 in (1.14 mm) R=.1 a (in) 2060 t=.045 in (1.14 mm) R=.1 a (in)
2524 t=.045 in (1.14 mm) R=.1 a (in) 2024 t=.050 in (1.27 mm) R=0 A*5 (in2)
(2024 t=.050 in (1.27 mm) R=0 A*5 (in2)) 2198 t=.045 in (1.14 mm) R=.1 A*5 (in2)
2060 t=.045 in (1.14 mm) R=.1 A*5 (in2) 2524 t=.045 in (1.14 mm) R=.1 A*5 (in2)
Similar crack length and pressure
vessel opening in 2024 after: Pressure vessel opening
4 intervals ∆p=11psi, R=0 after 4 intervals in .050-in
3.1 intervals ∆p=11 psi, R=.1 2024-T3 Clad skin pocket
Number of cycles
Figure 15 Crack length a and pressure vessel opening A as a function of the number of cycles for
.045-in 2198-T851, 2060-T8E30, and 2524-T3 Clad. .050-in 2024-T3 Clad is added as
baseline.
203. Adhesively Bonded Interfaces
3.1. The use of acoustic emission and composite peel tests to detect weak adhesion in
composite structures
Sofia Teixeira de Freitas, Dimitrios Zarouchas, Hans Poulis, TU Delft
Adhesive bonding is one of the most promising joining technologies for composite aircraft. However,
to comply with current aircraft certification rules, current safety-critical bonded joints, in which at
least one of the interfaces requires additional surface preparation, are always used in combination
with redundant mechanical fasteners, such as rivets and bolts. This lack of trust in bonded structures
is mostly linked to the fear of lack of adhesion or a “weak bond”.
The aim of this study is to tackle this challenge by assessing the ability to use composite peel tests
and acoustic emission (AE) technique to assess adhesion quality and distinguish a good bond quality
from a “weak bond”.
Composite Bell Peel (CBP) tests and Double-Cantilever-Beam (DCB) tests were performed on
contaminated and non-contaminated CFRP bonded specimens. The results show that peel strength
drops significantly at the location of the contaminated interface that has led to weak adhesion, as a
result from adhesive failure, see Figure 16. The AE signals obtained during DCB tests show different
features for cracks growing at the interface (“weak bonds”) and inside the adhesive layer (cohesive
failure), see Figure 17. In addition to this, scattering of the AE signals were observed in the
contaminated specimens with “weak bonds” as illustrated in Figure 18. More information is provided
in [9].
Figure 16 Representative load displacement graphs from the CBP tests.
21Figure 17 The cumulative number of hits during the tests for specimen without and with contamination
respectively (Area II, lower specimens – contaminated)
Non-contaminated specimen (UV) Contaminated specimen (UV + cont.)
50-60 dB (*)
(*) peak amplitude range
Figure 18 The frequency time analysis of AE signals recorded during crack propagation of Area I (see
Figure 2), from non-contaminated and contaminated specimens.
3.2. How pure mode I can be obtained in bi-material bonded DCB joints: a longitudinal
strain-based criterion
Wandong Wang, Romina Lopes Fernandes, Sofia Teixeira De Freitas, Dimitrios Zarouchas, Rinze
Benedictus, TU Delft
An essential question to predict the structural integrity of bi-material bonded joints is how to obtain
their fracture properties under pure mode I. From open literature, it is found that the most
commonly used design criterion to test mode I fracture is matching the flexural stiffness of the two
adherents in a DCB coupon. However, the material asymmetry in such designed joints results in
mode II fracture as well.
22In this work, a new design criterion is proposed to obtain pure mode I fracture in adhesively bonded
bi-material DCB joints by matching the longitudinal strain distributions of the two adherends at the
bondline - longitudinal strain based criterion. A test program and Finite Element modelling have been
carried out to verify the proposed design criterion using composite-metal bonded DCB joints – see
Figure 19. Both the experimental and numerical results show that pure mode I can be achieved in bi-
material joints designed with the proposed criterion – see Figure 20. GII/GI ratio is reduced by a factor
of 5 when using the proposed longitudinal strain based criterion in comparison with the flexural
stiffness based criterion – see Figure 21. More information is provided in [10].
L=200 mm
a0=40 mm
B=25 mm
B/2 B/2
Strain Gauge
Extensometers
30 mm
60 mm
80 mm
100 mm
a
hSteel
hComposite
a0=40 mm
a) Specimen dimensions b) Test set-up
Figure 19 Composite-steel DCB specimens.
× 10 -3 × 10 -3
1 1
0 0
-1 -1
Strain
Strain
-2 -2
GFRP FEM GFRP FEM
-3 GFRP Measurement -3 GFRP Measurement
a Steel FEM a Steel FEM
Steel Measurement Steel Measurement
-4 -4
0 30 60 90 120 150 180 0 30 60 90 120 150 180
x-position [mm] x-position [mm]
a)Curvature based criterion b)Strain based criterion
Figure 20 Longitudinal strains as a function of the x-position on the outer surfaces of both
adherends. The x-position is defined from the load application point.
231.4
Curvature based
1.2 Strain based
1
0.8
GII /GI
0.6
0.4
0.2
0
0 5 10 15 20 25
Specimen width [mm]
Figure 21 Comparison of the GII/GI ratio for both criteria: Strain based and Curvature based.
244. Composites & Fibre Metal Laminates
4.1. Determination of Mode I Fatigue Delamination Propagation in Unidirectional
Fibre-Reinforced Polymer Composites
René Alderliesten (TU Delft), Andreas Brunner (empa)
To characterise mode-I (tensile opening) delamination behaviour of fibre reinforced polymer
composites (CFRP), standard test methods are available for determining the quasi-static fracture
toughness (ISO 15024) and the fatigue delamination onset (ASTM D 6115). These standard test
methods, however, do not cover the fatigue delamination propagation behaviour, which is required
for the purpose of design and reliability assessment. Development of standard test methods
appropriate for determination of design values is hindered, because of the contribution of large-scale
fibre bridging often observed in fatigue delamination testing of unidirectional laminates. The amount
of fibre-bridging occurring in structural applications will depend on the laminate lay-up, but also, to
some extent on the loading mode. For design, a "conservative" value is desirable, and hence,
quantification of the effects of fibre-bridging on delamination propagation in unidirectional laminates
would allow for estimating the intrinsic delamination resistance of this laminate. Together with
consideration of the scatter, an intrinsic design limit can then be established, satisfying the safety
factor requirements defined in design guidelines.
To this aim, a test procedure is in development within ESIS-TC4 describing the use of the Double
Cantilever Beam (DCB) specimen in a tensile test machine capable of applying cyclic displacements of
constant amplitude at a constant frequency in the range between 1 and 10 Hz. The procedure
specifies an experimental procedure to quantify and exclude the contribution of large-scale fibre
bridging in mode I fatigue fracture tests of unidirectionally fibre-reinforced plastic composites.
This test procedure comprises performing multiple sequences per specimen, to enable the derivation
of a zero-bridging delamination resistance curve via regression through and translation of all data.
This test procedure is a modification and extension of a former test procedure, but also incorporates
an analysis based on a modified Hartman-Schijve equation for the determination of scatter in the
fatigue fracture curves (essentially da/dN versus a "√∆G" related quantity instead of the
"conventional" Paris-equation correlating da/dN with ∆K or ∆G). To demonstrate the repeatability
and reproducibility of the test procedure, a round robin exercise is being prepared with participants
of the ESIS-TC4 committee, but also other parties are invited to participate.
4.2. The effect of frequency on the fatigue delamination growth rate in composites
Aravind Premanand, René Alderliesten, TU Delft
In this study, the influence of test frequency on the mode-I fatigue delamination response of
unidirectional CFRP was investigated. Tests on double cantilever beam specimens were carried out at
various test frequencies ranging from 5 to 40 Hz. Fatigue can be seen as a material degradation
process through which the applied work in the form of strain energy is dissipated into damage and
other energy dissipation mechanisms. Hence, the experimental data were evaluated through energy
principles. Both the crack growth and strain energy dissipation were averaged over multiple load
cycles. Similar to taking the derivative of the crack growth curve for da/dN, dU/dN was calculated by
25taking the derivative of the applied strain energy at each crack length, see Figure 22. These averaged
quantities, dU/dN and da/dN were then correlated following
=
in which dU/da effectively represents the physical strain energy release rate Gphys, see Figure 23.
Figure 22 Cyclic strain energy data and power law fit against the number of cycles for 20 Hz test.
Figure 23 Influence of test frequency on the relationship between dU/dN and da/dN.
It was observed that at a frequency of 5Hz the load-displacement response was fairy linear, but that
at higher frequencies the load-displacement response became nonlinear, exhibiting a stronger
hysteresis. In case tests at all frequencies were analysed assuming a linear load-displacement
response, no particular trend could be observed with respect to the test frequency. However,
accounting for the non-linearity and hysteresis revealed a distinct frequency effect. Quantifying the
hysteresis area as a measure for the dissipated energy in a load cycle, revealed that more energy is
dissipated per unit crack increment at higher test frequencies. This means that at higher test
frequencies the crack growth resistance Gphys is higher
26Two possible mechanisms were investigated to explain this observed increase in Gphys with the
increase in test frequency: Heat dissipation, and Internal heat generation
The latter would cause an increase in specimen temperature. Measurements from thermocouples
and infrared camera demonstrated however, that no significant temperature rise occurred in the
specimen during fatigue. Hence, the increase in hysteresis energy dissipation should be explained by
rapid heat dissipation, through for example radiation, convection and conduction, or it should
indicate another dissipative mechanism not yet identified.
Based on measurements and observations it is concluded that with increasing the test frequency,
both the available energy dU/dN and the crack growth resistance Gphys increase. Depending on the
interplay between these two parameters delamination growth may increase or decrease. It is
recommended to study the relationship between strain rate (implicit in the test frequency), crack
growth and strain energy dissipation mechanisms further, as full understanding of the relationships
allow for accelerated fatigue testing. More information is provided in [11].
4.3. Investigating energy dissipation for a methodology with fatigue master curves
Sascha Stikkelorum, Dimitrios Zarouchas, René Alderliesten, TU Delft
Recent studies have identified a relation between damage growth and strain energy dissipation; the
amount of energy dissipated during a load cycle is related to the damage extension. This relationship
was the subject of this study with the objective to develop an analytical method for predicting
fatigue life of composites under fatigue loading.
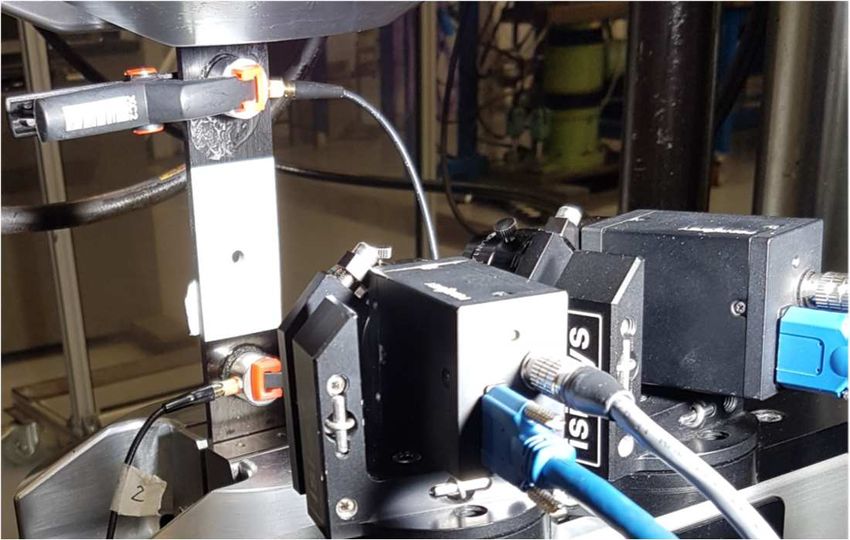
Constant amplitude fatigue experiments were performed in load control on open-hole specimens,
shown in Figure 24, at various maximum load levels, a load ratio of 0.1, and a frequency of 5 Hz. Four
lay-ups were studied: unidirectional (UD) laminates (0°), cross-ply (0°/90°), angle-ply (±45°), and
quasi-isotropic (0°/90°/±45°), all manufactured with hand lay-up using Hexply 8552 prepreg tape.
Energy dissipates in three different forms: mechanical energy, heat and acoustic energy. The
dissipated mechanical energy can be determined using the hysteresis area in the load-displacement
curves. The heat can be minimised by testing at relative low frequencies and the acoustic energy can
be measured using acoustic emission (AE). For the latter purpose all specimens were equipped with
two AE sensors clamped at both ends of the specimen near the clamping area. During the tests, load
and displacement data was measured by the test machine during an entire load cycle each 100th
cycle. After each 100th load cycle pictures were taken by two cameras for digital image correlation
(DIC). DIC was used to monitor the damage progression throughout the tests. Instead of testing until
failure, specimens were tested until a number of cycles defined based on a damage threshold.
Typical damage mechanisms were observed such as splitting along the 0° fibres, transverse matrix
cracks along the 90° and ±45° fibres, and interlaminar delaminations. The crack growth caused by
fibre splitting in the 0°plies showed similar behaviour in the UD and cross-ply coupons, but not in the
quasi-isotropic coupons where matrix cracking in the 90° and ±45° plies occurred first. The growth of
the matrix crack in the 90° plies could not be recorded, as these cracks reached the coupon edge
within the first 100 cycles.
27Figure 24 Picture of the test set-up. The upper acoustic emission sensor clamped to the specimen is
for channel 1, while the bottom sensor is for channel 2
The recorded load and displacement data were used to calculate the cyclic work and the dissipated
energy using the area underneath the load-displacement curves during loading and unloading. In UD,
cross-ply and quasi-isotropic coupons the cyclic work first exhibited a steep increase, after which the
slope decreased. For UD and cross-ply coupons this slope continued to decrease until an apparent
asymptote was reached, while the cyclic work for quasi-isotropic coupons continues to increase over
the number of cycles after the initial slope change. The cyclic work for the angle-ply coupons
continued to increase with increasing number of cycles without a reduction in slope.
The dissipated energy per cycle was compared with the crack growth observed with DIC, however, no
apparent correlation could yet be obtained. There appeared to be a linear relation between total
cumulative amount of dissipated energy and number of cycles until failure, see Figure 25. Because
the four lay-up configurations have different stiffnesses, the cyclic work for given load cycles are
distinctively different. This cyclic work seemed to be related to the damage mechanisms observed.
Figure 25 Cumulative acoustic emission energy versus amount of load cycles for UD coupon with
maximum load of 53 kN and load ratio R = 0.1
The AE data was used to calculate the cumulative acoustic energy and number of acoustic hits. To
see if acoustic features for different damage mechanisms could be identified, the registered rise
time, duration and amplitude were plotted and divided based on the loads at which these hits were
registered. This revealed that most of the damage growth occurred for loads between 75% and 100%
of the maximum load, as illustrated in Figure 26. More information is provided in [12].
28Figure 26 Rise time versus amplitude for UD coupon with maximum load of 53 kN and R = 0.1.
4.4. Towards the certification of bonded primary Fiber Metal Laminate structures by
bolted Disbond Arrest Features
Ivar van Teeseling, Calvin Rans (TU Delft)
Nowadays, the widespread application of adhesively bonded joints in primary structures is
challenged by the current certification regulations. One possible solution lies in the application of
Disbond Arrest Features (DAFs) that prevent bondline damages from growing to a critical size.
The aim of this research is to study the working principles and potential risks of bolted DAFs in
bonded Fiber Metal Laminates (FML)s by focusing on two elements;
1. Effect of reducing the Mode I Strain Energy Release Rate (SERR)
2. Relation between retardation/arrest of disbond growth and fatigue crack initiation in the
FML adherends by the peak stress associated with the edge of the disbond
Fatigue experiments have been performed using Cracked Lap Shear (CLS) specimens with two
different DAF configurations: (1) a bolted DAF and (2) a specially developed and produced clamped
DAF which only affects Mode I. Additionally, a quasi-analytical model has been developed, verified,
validated and used to expand on the experimental results.
It has been shown that reducing the Mode I SERR component is very effective mechanism in
achieving the arrest of disbond growth (see Figure 1). Also, the arrest, or even retardation, of
disbond growth can lead to the initiation of fatigue cracks in the FML adherends. The
retardation/arrest of the disbond fixates this peak stress associated with the edge of the disbond at
the same location leading to the local initiation of fatigue cracks.
An earlier study suggests that the initiation and growth of these fatigue cracks can be detrimental to
the arresting capabilities of bolted DAFs. This means that the arrest of disbond growth could initiate
fatigue cracks that result in the loss of the arrest of that same disbond. Future research is required to
understand this potentially self-destructive mechanism.
The MSc thesis containing the results of this study can be downloaded from [13].
29Figure 27 (db/dN) results of the clamped DAF. Experimental: (2_09) with DAF, (2_10) with DAF.
Model: with and without DAF
4.5. No growth of butt joint damage in thermoplastic orthogrid fuselage panels
J.E.A. Waleson, J.W. van Ingen, S. van den Berg, GKN Fokker
In 2013, Fokker Aerostructures developed a new stiffened skin panel concept. The concept features
frames that are welded to an orthogrid stiffening structure, thus eliminating a large number of
mechanical fasteners. The concept is made possible by butt joining of stiffeners; stiffener plates are
butt jointed to a skin laminate by melting them together [14].
A critical aspect for certification is showing no detrimental growth due to fatigue loads and sufficient
residual strength of butt joint damages. Residual strength and onset of growth due to fatigue loads of
a stringer-to-skin butt joint damage representing impact damage was tested on single stringer
specimens loaded in compression, see Figure 28.
30Onset of growth due to repeated loads appeared
to require cycles well above 2/3 of the static failure
load. Since the structure will be designed so that
design ultimate load will not exceed static failure
load, realistic fatigue cycles are expected not to
cause damage growth.
Measured strains as function of the external load
in the static test were correlated with an ABAQUS
model with cohesive surface interaction to enable
analysis of damage tolerance of fuselage panels.
One of the correlations is illustrated in Figure 29.
Testing on small panels is planned to assess the
effect of adjacent intact stringers. Further, it is
intended to establish a model for delamination
growth due to fatigue loads.
Figure 28 Fatigue testing of stringer-skin butt
joint damage.
Figure 29 Correlation of predicted and measured strains as function of external static load.
315. Prognostics & Risk Analysis
5.1. Extreme Prognostics of Composite Structures
Nick Eleftheroglou, Dimitrios Zarouchas, René Alderliesten, Rinze Benedictus, TU Delft
Driven by advantages in structural efficiency, performance, versatility and cost, composite structures
are increasingly applied in a variety of industries e.g. aerospace, wind energy, automotive. However,
in spite of decades of application and research, the precise process of fatigue damage accumulation
is still unknown and depends on several parameters such as the type of material and the lay-up,
loading frequency and sequence and the form of the fatigue cycle. Additionally, the multi-phase
nature of composites and the variation of defects, which cannot be controlled completely during the
manufacturing process, result to a stochastic activation of the different failure mechanisms and make
the fatigue damage analysis, and consequently the prediction of remaining useful life (RUL), very
complex tasks. Probabilistic methodologies, combined with machine learning algorithms, have gained
momentum the last decade and provide a platform for reliable predictions of RUL utilizing structural
health monitoring (SHM) data. These data are needed in order to estimate the parameters of the
selected RUL model since they are linked to the damage accumulation process.
It is worth mentioning that the fatigue life of a specific composite structure exhibits quite significant
scatter, with specimens that either underperform or outperform. These specimens are often referred
to as outliers and the prediction of their RUL is challenging because the training of the machine
learning algorithm doesn’t take into account data that are associated with their outlier performance.
This study presents a new RUL prediction model, the Extreme Non-Homogenous Hidden Semi
Markov Model (ENHHSMM) which is an extension of the Non-Homogenous Hidden Semi Markov
Model (NHHSMM). The ENHHSMM uses the available diagnostic measures, which are estimated
based on the training data and adapts dynamically the trained parameters of the NHHSMM. As it was
shown in previous studies, NHHSMM provided accurate RUL estimations of a non-outlier composite
structure utilizing different SHM techniques such as acoustic emission (AE) [15] and digital image
correlation [16], and it outperformed Bayesian Neural Networks [17], the state-of-the-art in data-
driven approaches. Figure 30 illustrates the ENHHSMM, which consists of two parts; the training and
testing process. The training process contains the training data and the stochastic model while the
testing process uses the training process’ output, the extracted testing data and dynamic diagnostic
measures.
Fatigue experiments on open-hole composite specimens were performed in order to test the validity
of the proposed RUL prediction model. The specimens, with stacking sequence [0,±45,90]2s, were
subjected to fatigue loading, R=0 and testing frequency of 10 Hz. AE technique was employed and
recorded data which are related to the fatigue damage accumulation of the structure. The AE
degradation histories of the seven open hole specimens are presented in Figure 31. Figure 32
presents the RUL estimations of the two available RUL prediction models regarding the left outlier,
specimen05. Based on Figure 32 the ENHHSMM provides better outlier prognostics since the mean
ENHHSMM RUL estimations are able to approach more satisfactorily the real RUL estimations than
the NHHSMM. Additionally, the confidence intervals of the ENHHSMM contain the real RUL curve
during almost the whole lifetime of specimen05 and their distance is shorter than the classic model.
Furthermore, the initial mean ‘extreme’ RUL estimations almost overlaps to the real RUL and at the
same time the ‘classic’ RUL estimations are not accurate, 150% overestimation. Therefore, the
ENHHSMM can identify early enough an outlier and adapt the RUL estimations in an efficient and
accurate way.
32You can also read