Franz Josef Wastewater Treatment Plant Planning - Feasibility Study - Westland District ...
←
→
Page content transcription
If your browser does not render page correctly, please read the page content below
Feasibility Study

Franz Josef
Wastewater
Treatment Plant
Planning
Feasibility Study

         Franz Josef
         Wastewater
         Treatment Plant
         Planning

         Prepared By                                                       Opus International Consultants Ltd
                            Penny Dyer / Grant Webby                       Greymouth Office
                            Environmental Engineer / Technical Principal   23 High Street
                            (Hydraulic and River Engineering)
                                                                           PO Box 365, Greymouth 7840
                                                                           New Zealand

         Reviewed By                                                       Telephone:         +64 3 769 9330
                            John Crawford                                  Facsimile:         +64 3 768 7498
                            Technical Principal - Wastewater
                                                                           Date:              24 June 2014
                                                                           Reference:         6-WWES3.28
                                                                           Status:            Final

© Opus International Consultants Ltd 2014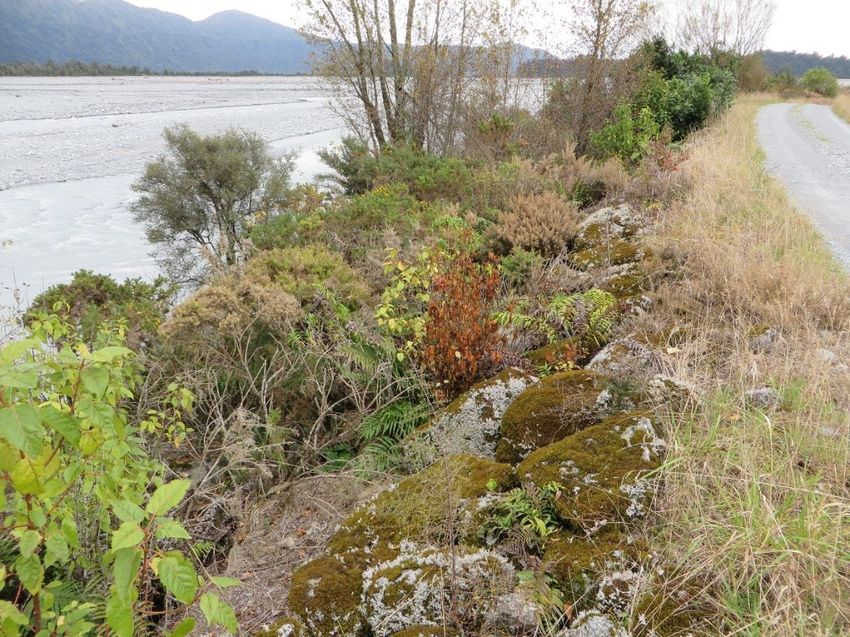
i
Contents
1 Introduction ....................................................................................................... 3
1.1 Purpose ............................................................................................................................. 3
1.2 Background ....................................................................................................................... 3
1.3 Scope ................................................................................................................................. 4
2 Methodology ...................................................................................................... 6
3 River Assessment ............................................................................................... 7
3.1 Assessment of Fluvial Risks to Existing WWTP ............................................................... 7
3.2 Assessment of Fluvial Risks from Tartare River ............................................................. 25
3.3 Franz Josef Wastewater Discharges ............................................................................... 26
4 Option 1: Upgrading Existing WWTP ............................................................... 29
4.1 Description ...................................................................................................................... 29
4.2 G2e and SKM Proposed Upgrades .................................................................................. 29
4.3 Existing WWTP Compliance Limits................................................................................30
4.4 Existing Plant Upgrades..................................................................................................30
5 Option 2: Building a New WWTP ..................................................................... 34
5.1 Description ...................................................................................................................... 34
5.2 Proposed WWTP Development Timeline ....................................................................... 34
5.3 New WWTP Site .............................................................................................................. 35
5.4 Compliance Limits .......................................................................................................... 36
5.5 Infrastructure Requirements .......................................................................................... 36
5.6 New Plant Costs .............................................................................................................. 39
5.7 Capital Cost Analysis for the new WWTP ....................................................................... 43
5.8 Operational Cost Analysis for the new WWTP ............................................................... 43
6 Discussion and Summary ................................................................................. 44
7 References ....................................................................................................... 45
Figure 1: Franz Josef Oxidation Ponds ................................................................................................ 4
Figure 2: Rock armoured stopbank along right bank of Waiho River alluvial fan adjacent to
oxidation ponds at Franz Josef Village WWTP ................................................................................... 8
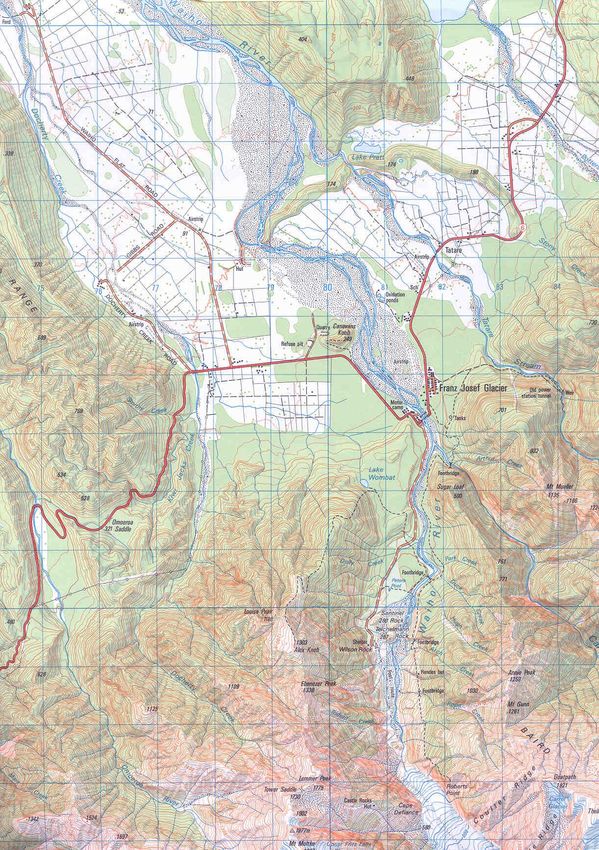
Figure 3: Extract from NZMS 260 series topographic map showing location of Franz Josef Glacier,
Waiho River, Callery River, Franz Josef Village and WWTP .............................................................. 9
Figure 4: Mean bed levels in Waiho River at site of State Highway 6 Bridge Crossing (1997-2012) 12
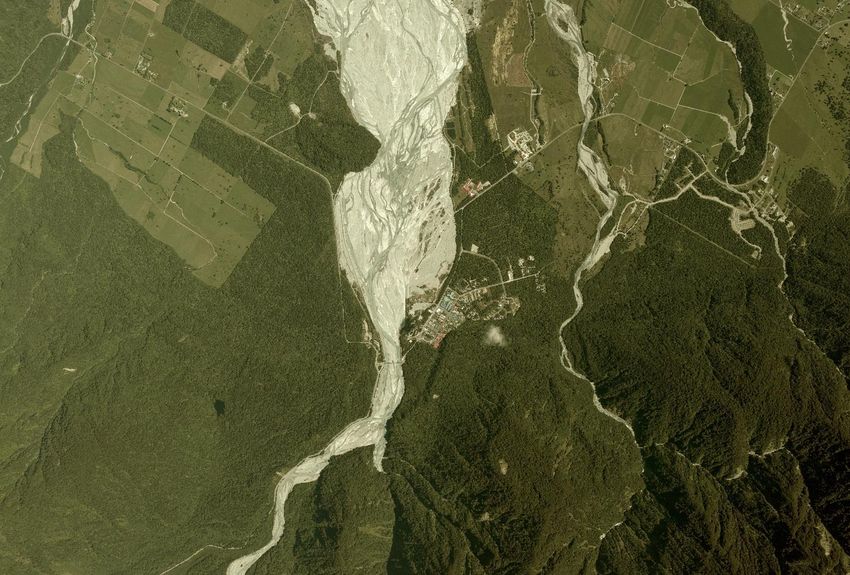
Figure 5: Aerial photograph of upper part of Waiho River fan (January 2011) (sourced from NZ
Aerial Mapping) ................................................................................................................................. 14
Figure 6: Aerial photograph of upper part of Waiho River fan (October 2013) (sourced from Google
Earth) ................................................................................................................................................. 14
6-WWES3.28 | 24 June 2014 Opus International Consultants Ltd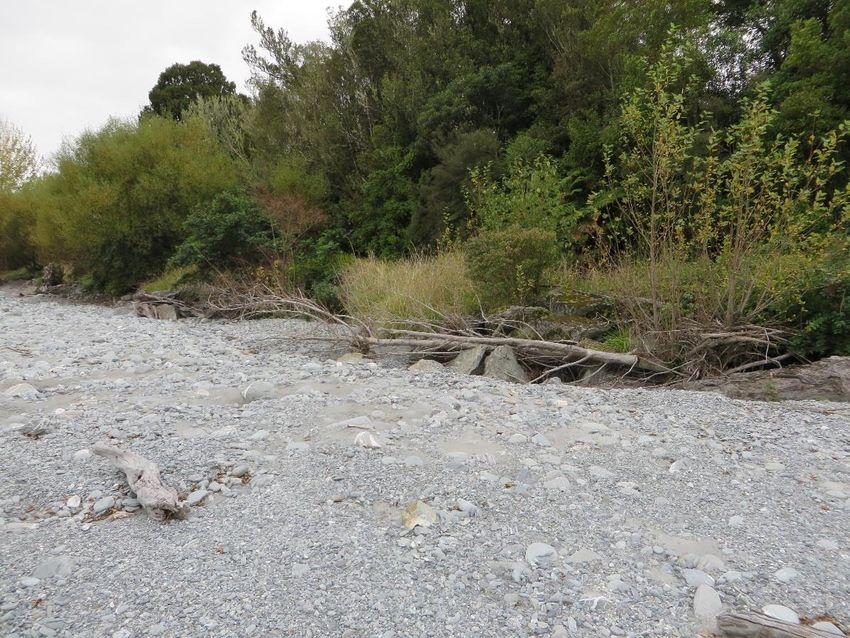
ii

Figure 7: Mean bed levels down Waiho River fan between 2002 and 2011 (cross-section numbers
attached to each data point)............................................................................................................... 15
Figure 8: Top bed levels down Waiho River fan between 2002 and 2011 (cross-section numbers
attached to each data point)............................................................................................................... 15
Figure 9: Average bed level change per year on Waiho River fan between 2002 and 2011 (cross-
section numbers attached to each data point) ................................................................................... 16
Figure 10: Cumulative bed volume change down Waiho River fan between 2002 and 2011 (cross-
section numbers attached to each data point) ................................................................................... 17
Figure 11: Cumulative bed volume change per year down Waiho River fan between 2002 and 2011
(cross-section numbers attached to each data point) ........................................................................ 17
Figure 12: Partial submergence of snub groyne structures along right bank of Waiho River
providing bank erosion protection upstream of Franz Josef Village WWTP .................................... 19
Figure 13: Partial submergence of toe of existing rock armour along embankment protecting
oxidation ponds comprising Franz Josef Village WWTP .................................................................. 19
Figure 14: Estimated stage / discharge rating curves for cross-section 18 from 2014-2019............. 22
Figure 15: Estimated stage / discharge rating curves for cross-section 19 from 2014-2019 ............ 22
Figure 16: View of Tartare River and floodplain looking upstream from SH6 bridge ...................... 25
Figure 17: View of bridge pier foundations on existing SH6 bridge crossing of Tartare River ........ 26
Figure 18: Potential Sites for new WWTP ......................................................................................... 36
Figure 19: New Wastewater Mains and Pump Stations for Sites 1, 2 and 3 ..................................... 37
Figure 20: New Wastewater Mains and Pump Station with Modified Existing Pump Station for
Sites 1, 2 and 3.................................................................................................................................... 37
Figure 21: New Wastewater Mains for Site 4 .................................................................................... 38
Figure 22: Diagram of the LPED system showing nested pipe arrangement ................................... 41
Figure 23: Estimated requirements for Disposal Diffuser System ................................................... 41
Figure 24: Example Rock Diffuser Discharge System under Construction (River at Right) ........... 42

Table 1: Flood frequency estimates for Waiho River at SH6 Bridge (based on a GEV EV1 type
frequency distribution) ......................................................................................................................20
Table 2: Estimated annual exceedance probabilities for right bank flood breakout through Franz
Josef Village WWTP for lower bound sediment aggradation scenario on alluvial fan (2014-2019). 23
Table 3: Estimated annual exceedance probabilities for right bank flood breakout through Franz
Josef Village WWTP for upper bound sediment aggradation scenario on alluvial fan (2014–2019)
............................................................................................................................................................ 23
Table 4: Projected Wastewater and Septage Flows and BOD Loads ................................................ 28
Table 5: Existing and Proposed RC annual median consent conditions ..........................................30
Table 6: New WWTP Potential Development Sites .......................................................................... 35
Table 7: New WWTP Plant 90th Percentile Discharge Limits ........................................................... 36

6-WWES3.28 | 24 June 2014                                                                                           Opus International Consultants Ltd
1

Executive Summary
The Franz Josef Waste Water Treatment Plant (existing plant) consists of two oxidation ponds that
discharge treated effluent into the Waiho River. The existing plant is owned and operated by
Westland District Council (WDC).

There are two issues that are of considerable concern for the existing plant. The first issue is that,
in the next 5 years, the Waiho River is likely to break out (i.e. overtop the river bank) in a
significant flood through the oxidation ponds towards the Tartare Stream and inundate the ponds.
Sediment material transported by the flood flows would be likely to fill the ponds, even if the river
does not destroy the ponds. While this might not necessarily destroy the ponds (it would
necessitate excavation of the ponds and rehabilitation of the inlet and outlet pipes to make them
functional again), the ongoing sediment aggradation on the Waiho River fan could eventually allow
permanent avulsion of the Waiho River through the pond site to the Tartare River. The ponds
would therefore be lost to the river. The second issue is that the ponds are overloaded and are
periodically discharging noncompliant water into the Waiho River.

Prior to WDC requesting this report, previous studies on the flood hazard potential of the Waiho
River had focused only in general terms on the flood capacity of the various flood protection works
on either side of the Waiho River fan, although they had probably also underestimated the flood
capacity of these works. The studies had not specifically addressed the flood risk to the oxidation
ponds. The 2012 West Coast Regional Council Report on future management of the Waiho River
(Hall, 2012) did identify the high risk to the oxidation ponds but did not quantify this.

WDC engaged Opus to conduct a river analysis to determine the likely lifespan of the ponds and to
provide a Net Present Value (NPV) cost analysis on the two options that WDC proposed for the
plant. These two options were:

         1. To leave the plant operating for the medium term, undertaking essential upgrades to
            improve discharge quality and building a new waste water treatment plant in
            approximately 10 years’ time, or

         2. To build a new waste water treatment plant (WWTP) as soon as possible in a different
            location that is not susceptible to river encroachment.

The results from the river engineering analysis predict that there is a very high chance that the
Waiho River could inundate the ponds before 2019, and a reasonable chance that the ponds could
be inundated before 2016. This is of course dependent on the actual storm events that affect the
Waiho River Catchment in the next five years.

With this new information Option 1 appears to no longer be a feasible option. This report therefore
only considers the NPV for Option 2. Possible upgrades and their capital costs for Option 1 have
been included in this report in the event that West Coast Regional Council (WCRC) stipulates that
the existing plants discharge water quality requires improvement whilst the new plant is built.

The most likely recommendation that we have provided for the existing plant to improve discharge
water quality and lessen the capital costs required are:

6-WWES3.28 | 24 June 2014                                                  Opus International Consultants Ltd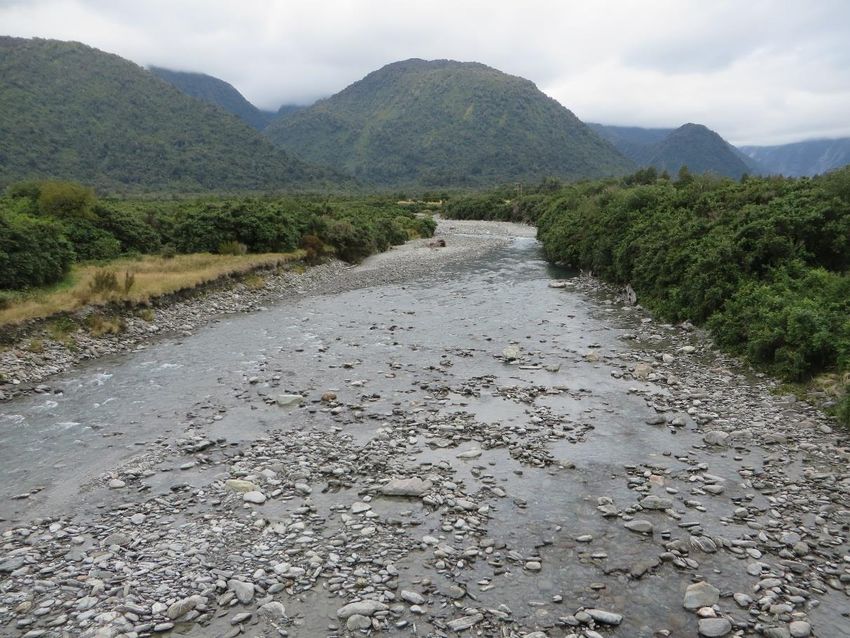
2
Desludging of the Ponds
Modifying the outlet pipe to improve the diffusion of the discharge into the Waiho River
Modifying the inlet pipes
Modifying the existing wetland and baffled curtain system on Pond 2
If each of these upgrades are implemented a capital cost of approximately $600,000 will be
required.
For the construction of the new WWTP the key factors to consider were:
The new site location. Four potential locations have been identified by WDC. Each site will
require slightly different capital and operational costs e.g. land purchase price, consenting
approval, pumping of wastewater to the plant and discharge costs.
The type of WWTP. In this report we have assumed that the plant will be an high rate
treatment plant. Cost estimates have been provided for two types of reactors; an
earthworks reactor and a concrete reactor.
The type of disposal system. We have estimated capital costs for a high cost system (rapid
infiltration disposal field) and a low cost system (disposal diffuser).
The median capital cost required for the new WWTP is $8.9 million (this cost is in current dollars).
The 95th percentile capital costs for the new WWTP is $9.5 million. A NPV analysis for the first 30
years of the new WWTP’s life estimated a median NPV of $23.25 million and a 95th percentile NPV
of $24 million for the new WWTP.
As the river engineering analysis predicts that the existing plant will be inundated by the Waiho
River within 5 years we recommend that WDC move forward with the planning and development
of the new WWTP forthwith.
6-WWES3.28 | 24 June 2014 Opus International Consultants Ltd
3
1 Introduction
1.1 Purpose
Westland District Council (WDC) has requested Opus International Consultants (Opus) to
undertake an options assessment and a benefit/cost analysis for the upgrade/replacement of the
Franz Josef Waste Water Treatment Plant (WWTP).
When WDC requested this report, there was a fundamental assumption that the flood risk to the
oxidation ponds would not become significant for at least another 10 years. . During the course of
this current investigation, the river engineering assessment carried out as part of it determined that
this assumption was invalid. The results from the river engineering analysis predict that there is a
very high chance that the Waiho River could inundate the ponds before 2019, and a reasonable
chance that the ponds could be inundated before 2016. This is of course dependent on the actual
storm events that affect the Waiho River Catchment in the next five years. The initial purpose of
this report was then changed from an options assessment report to a costing analysis for a new
WWTP.
This report also considers possible intermediate upgrades to the existing plant while waiting for the
new plant to become operational. Capital costs for these upgrades have been included.
1.2 Background
Franz Josef WWTP is owned and operated by Westland District Council (WDC). At the
commencement of the report WDC was concerned with two key issues impacting the existing
WWTP. These are:
The Waiho River bed is aggrading and migrating towards the oxidation ponds. There are
therefore significant risks of outflanking and or inundation of the treatment plant by the
river.
The ponds are overloaded and are periodically discharging noncompliant effluent into the
Waiho River. The West Coast Regional Council have issued abatement notices to the
Council.
WDC is currently considering the following two options to address the above issues:
Option 1: Leave the plant operating for the medium term and undertake essential upgrades to
improve the discharge quality. A new WWTP will be constructed in another location
in say 10 years’ time, or
Option 2: a new WWTP as soon as possible in a different location that is not susceptible to
river encroachment.
A component of this current exercise has been to undertake a review of the likely levels of risk that
the river poses to the existing treatment plant. This analysis1 found that the expected life of the
1 Refer section 3 below.
6-WWES3.28 | 24 June 2014 Opus International Consultants Ltd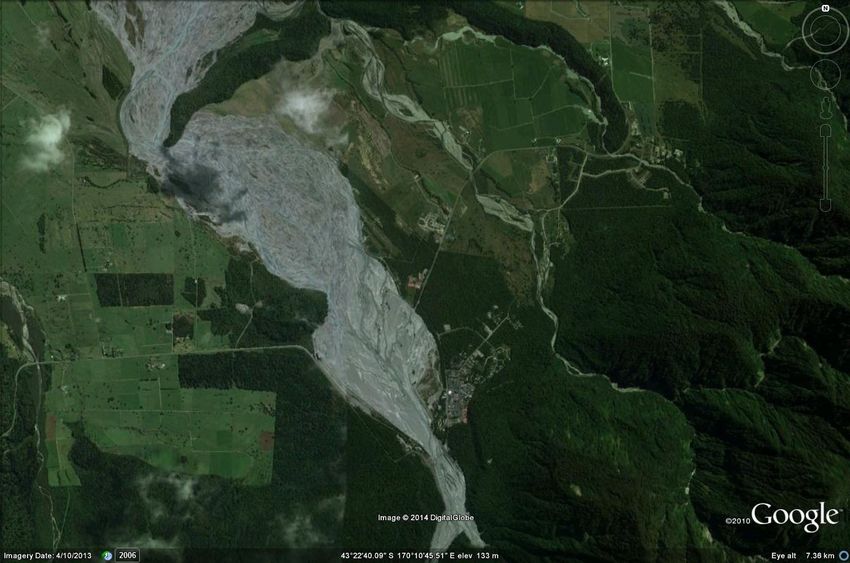
4

existing plant is likely to be less than 5 years. With this information, it is our opinion that Option 1
no longer seems like a viable solution.

WDC has provided Opus with reports that were produced by SKM (2009) and G2e (2013) that have
extensively covered the topics of the capacity and noncompliance of the existing treatment plant
and recommending potential upgrades to the plant to achieve compliance.

                                 Figure 1: Franz Josef Oxidation Ponds

1.3      Scope
In this report we originally planned to undertake an options assessment to determine whether it
would be more cost effective to upgrade the new ponds or construct a new WWTP immediately for
WDC to achieve the required discharge compliance limits. During the course of this investigation
the results from the river engineering assessment predicted that there is a high probability that the
existing plant could be inundated within the next 5 years. With this in mind we determined that
Option 1 was highly unlikely to be considered feasible due to the existing plant’s short life
expectancy. The initial purpose of this report was then changed from an options assessment report
to a costing analysis for a new WWTP.

There is little remaining doubt that construction of a new treatment plant, away from the existing
site, is required. A new WWTP will need to be constructed on a different site that is not susceptible
to river encroachment. Four proposed locations for the new plant sites have been considered. The
new WWTP will probably discharge into the Tartare Stream due to limited land availability for a
land disposal option and the need to move sufficiently out of reach of the expanding Waiho River
active alluvial fan.

We have conceptualised a new WWTP based on the assumption that stricter resource consent (RC)
conditions than the ones currently in place for the existing ponds will be set by the West Coast
Regional Council (WCRC) because of the smaller size of the receiving water. Apart from this and
likely population growth figures, there has been little solid information on which to conceptualise a
replacement plant and so sum assumptions are pure conjecture, based on our experience
elsewhere.

6-WWES3.28 | 24 June 2014                                                    Opus International Consultants Ltd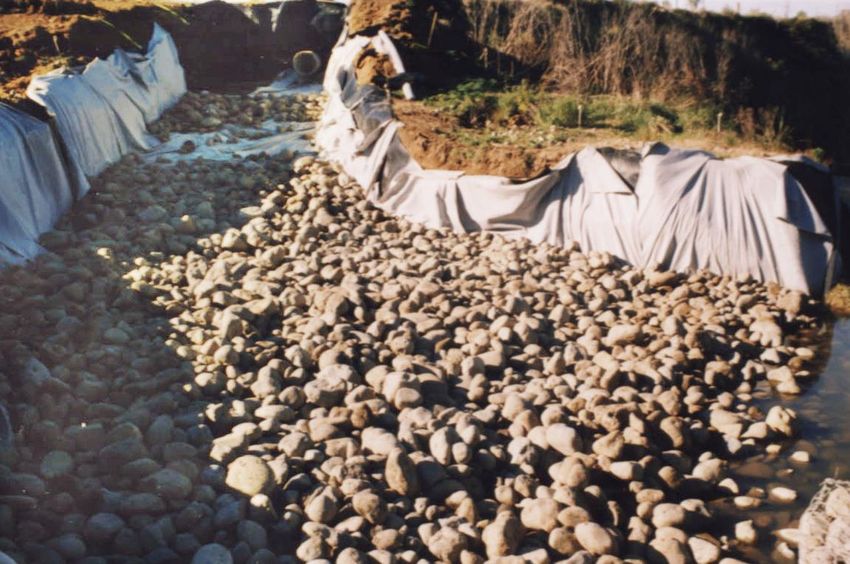
5

A NPV analysis over the first 30 years of the new WWTP has been conducted. The NPV includes
both capital and operational costs. Costs estimates have been compiled using information
provided by suppliers, industry standards and estimates from recent WWTP construction reports.
An inflation rate of 2.5% and a capital growth of 6.5% have been assumed.

During the initial stages of this report, prior to receiving the results from the river engineering
analysis, a large number of potential upgrades were considered for the existing plant. With the
results from the river engineering analysis predicting a high probability that the existing plant
could be inundated within 5 years, we recognise that it may not be prudent to invest such a large
injection of capital into the existing plant. For information, we have, however, included a capital
cost estimate based on recommended upgrades

We have assumed that the plant will only receive wastewater loads from the Franz Josef Township
sewerage main and from septic tank loads. The present and future wastewater flows and loads
from the town have been estimated using the assumptions provided in the SKM and G2e reports.
Septage information has been provided by Hibbs Drainage. We have made an assumption that
stock trucks have their own disposal system and will not be discharging into the existing or new
plants.

We have assumed that the existing wastewater mains are sufficiently sized.

6-WWES3.28 | 24 June 2014                                                 Opus International Consultants Ltd
6
2 Methodology
As part of this report the following steps have been undertaken:
On the 25 March 2014 Opus staff (John Crawford and Grant Webby) attended a work shop
with WDC to discuss potential options for the future of the ponds. A site visit to the ponds
by John Crawford, Grant Webby and Petrina Cannell was conducted during the course of
this visit.
A river engineering analysis has been conducted on both the Waiho River and Tatare
Stream to predict their future movements due to the ongoing sediment aggradation from
their alluvial fan.
An analysis has been conducted on the existing ponds to determine the costs required to
upgrade the ponds to achieve the new RC conditions that have been proposed in Section 30.
A 30 year NPV has been conducted to determine the costs involved in constructing and
operating the new WWTP.
6-WWES3.28 | 24 June 2014 Opus International Consultants Ltd7 3 River Assessment 3.1 Assessment of Fluvial Risks to Existing WWTP 3.1.1 Location of Existing WWTP Relative to Waiho River Fan The Waiho River below the State Highway 6 (SH6) Bridge crosses a classic alluvial fan, the fan being a conical-shaped surface upon which sediment material transported by river flows (particularly during floods) is deposited and subsequently reworked. The aerial photo shown on the drawing of the Waiho River Flood Protection Scheme (sourced from GEMC (2008)) in Appendix A shows the extent of the upper part of the Waiho River alluvial fan. Geomorphological processes on the fan are influenced by the presence of lateral boundary constraints in the form of flood protection stopbanks along the left bank between the SH6 bridge and Canavan’s Knob and below the Waiho Loop, and along the right bank between the SH6 bridge and the existing Franz Josef Village wastewater treatment plant (WWTP). These processes are also affected by the Waiho Loop (a terminal moraine relic left behind by historic glacial retreat) which severely constricts and forces the river to skirt around it at its south-western end, approximately 5.3km downstream of the SH6 bridge. Because of the ongoing geomorphological processes affecting the alluvial fan, the active fan surface is monitored by means of regular cross-section surveys2. The location of the monitoring cross- sections is shown on the drawing in Appendix A. The oxidation ponds forming the Franz Josef Village WWTP are sited along the right bank immediately adjacent to the Waiho River alluvial fan. They are located more precisely close to the right bank end point of cross-section 19. This end point lies opposite the prominent left bank feature known as Canavan’s Knob, a remnant rock knob which sits in the middle of the wider alluvial fan (the left bank end points of both cross-sections 18 and 19 are located around the base of this particular knob). Figure 2 shows a photograph of the right bank stopbank past the oxidation ponds as viewed looking downstream. The stopbank is armoured with heavy rock riprap material to provide erosion protection. 3.1.2 Geomorphic Context of Waiho River Alluvial Fan SH6 crosses the Waiho River at the head of the alluvial fan about 5 km below the present terminus of the Franz Josef Glacier (Figure 3). The Callery River joins the Waiho River a few hundred metres above the SH6 bridge crossing. The Waiho sub-catchment (77 km2 in area) incorporates the Franz Josef Glacier (Figure 3) which covers about 18% of the catchment area (Davies and McSaveney, 2001). From 1985 to 2006, the glacier was generally advancing (McSaveney, 2013) but since then has been rapidly retreating. 2Bed levels at the SH6 bridge are also actively monitored by Opus International Consultants Opus) on behalf of the New Zealand Transport Agency (NZTA) with a much greater frequency than the alluvial fan cross- sections. 6-WWES3.28 | 24 June 2014 Opus International Consultants Ltd
8

Figure 2: Rock armoured stopbank along right bank of Waiho River alluvial fan adjacent to oxidation
ponds at Franz Josef Village WWTP

The Callery sub-catchment (92 km2 in area) is slightly larger than the Waiho sub-catchment
(Davies and McSaveney, 2001). It is also heavily ice-covered with three glaciated tributaries
covering about 18% of the sub-catchment area which is similar to that for the Waiho sub-
catchment. Below these glaciated tributaries the Callery sub-catchment is characterised by a 10 km
long deeply incised gorge with very high steep sides prone to slope failure (Davies, 1997).

Between the Callery / Waiho confluence and the fan head at the SH6 bridge crossing, the river is
confined by high uplift terraces on the right (north) bank and the glacier access road on the left
(south) bank. Both the glacier access road on the left bank and the first 100 m upstream of the SH6
bridge on the right bank are protected by erosion protection works (rock spurs founded deep into
the river bed). The abutments of the SH6 bridge constrict the river channel at the fan head.

Below the SH6 bridge, the active river bed widens out over an alluvial fan. The section of the fan
down to the Waiho Loop (Figure 3), the remains of a terminal moraine feature from an historic
glacial advance, is known as the upper fan (Davies and McSaveney, 2001). The river channel on
the upper fan develops a braided form and frequently switches course rapidly under flood
conditions. Stopbanks along both the left bank past the Holiday Park to Canavans Knob (a residual
bed rock feature in the middle of the upper fan) and the right bank past the church, the heliport
area, the Franz Josef Hotel and the village oxidation ponds significantly confine the angle of the fan
apex. Canavans stopbank protects SH6 to the south of the Waiho River crossing from inundation
under flood conditions across a wider part of the fan surface towards Docherty Creek (Figure 3).

6-WWES3.28 | 24 June 2014                                                  Opus International Consultants Ltd
9

       Figure 3: Extract from NZMS 260 series topographic map showing location of Franz Josef
       Glacier, Waiho River, Callery River, Franz Josef Village and WWTP

6-WWES3.28 | 24 June 2014                                                 Opus International Consultants Ltd
10
The section of fan below the Waiho Loop (Figure 3) is known as the lower fan. As the Waiho River
passes the end of the Waiho Loop, it turns to the right in a north-easterly direction and flows down
a steeper sub-fan before turning left in a north-westerly direction and joining the Tartare River
which cuts through the Loop. From this confluence the Waiho River follows the north side of the
valley for a distance of about 10.5 km to the sea. Where the Waiho River passes the end of the
Waiho Loop, Eatwell’s stopbank has been constructed to prevent breakout of the river across
farmland and the Waiho Flats airstrip into Docherty Creek (McSaveney and Davies, 1998).
The Tartare River (Figure 3) drains a small catchment with an area of about 3 km2 to the north of
the Callery catchment (McSaveney and Davies, 1998). It flows out from the mountains about 2 km
to the north-east from where the Waiho emerges at the SH6 bridge crossing and then follows its
own incised fan to the cut in the Waiho Loop. The bed of the Tatare is lower than that of the Waiho
above the Loop.
3.1.3 Sediment Inputs to Waiho River Fan
Sediment is supplied to the river system from both the Waiho and Callery sub-catchments.
The recent retreating behaviour of the Franz Josef Glacier means that the glacier will be injecting a
significant volume of sediment material into the Waiho River system although occasional rockfalls
also deposit large volumes of material directly onto the valley floor (Mosley, 1983). The bed of the
Waiho River immediately below the glacier is about 0.5 km wide over a distance of 2.5 km which
provides substantial storage for sediment delivered by the sub-glacial drainage system (Davies and
McSaveney, 2001). However, below Sentinel Rock, the river bed narrows significantly and
provides no storage capacity for sediment material. The reach between Sentinel Rock and the
Waiho River / Callery River confluence therefore functions as a sediment transfer reach.
The narrow Callery River Gorge also provides no storage for eroded sediment and similarly
functions as a sediment transfer conduit to supply sediment material to the Waiho River fan.
Hall (2012) describes a range of sediment delivery sources for the Callery Gorge including:
rainfall-induced landslides, landslide dam formation and subsequent failure due to flood
overtopping
glacial derived material
gully erosion material from other non-glaciated tributaries
debris flows
shallow slab avalanches from the steep upper sides of the gorge
major seismic-induced mass movements (due to the proximity of the major Alpine Fault and
other splinter faults)
Hall (2012) comments further on the timescale and rate of sediment input from the Callery Gorge
into the Waiho River system as follows:
The steep, rock lined, confined nature of the Callery Gorge means that whilst sediment
inputs occur into the main channel routinely and in an episodic manner, the residence
6-WWES3.28 | 24 June 2014 Opus International Consultants Ltd11
time in the gorge is short i.e. with the possible exception of major landslides, floods and
freshes subsequent to the sediment entering the gorge, sediment entering the gorge will
pass through and be discharged into the Waiho River below the Waiho–Callery River
confluence in a relatively short time frame.
In considering the nature of the sediment sources identified above, it is opined that a
variety of temporal supply mechanisms will be operating simultaneously at any one time.
This situation means that sediment movement through particularly the Callery River,
which subsequently feeds into the Waiho River, might over time manifest as a reasonably
steady base flow of sediment input to the Waiho River below the confluence but none the
less it will actually comprise a series of episodic sediment injections from upstream. From
time to time significant sediment injections will occur and these will give rise to
fluctuations in sediment loads above the base level of sediment throughput just described.
Like the Callery River Gorge and the reach of the Waiho River between Sentinel Rock and the
Waiho / Callery Confluence, the next very short reach of the Waiho River down to the State
Highway 6 Bridge also acts in a geomorphic sense as a sediment transfer reach. Sediment
delivered to this reach from upstream by the Callery and the Waiho Rivers passes through the
reach to the upper fan downstream. Depending on the balance between the rate of sediment
supply and the sediment transport capacity of the water flow through this reach, the river bed in
this reach may be either aggrading, degrading or remaining at an approximately constant slope.
The bed is very active in this transfer reach. It is constantly changing over time with bed levels
varying and the primary braid channels switching position.
Evidence for the active nature of the bed at the bridge crossing is given by:
the stage (water level) plots shown in Appendix A of Webby and Waugh (2003) (these plots
show stage measured over time by the NIWA recorder at the bridge) with periodic upwards
shifts; and
the plot of mean bed levels measured at the bridge on a regular basis for NZTA.
Figure 4 shows the latter plot of mean bed levels. From this, sudden episodic upward shifts in
mean bed level are seen to have occurred in March 1999, between March 2009 and March 2010
and January 2011. These sudden episodic shifts reflect the injection of significant sediment volume
pulses onto the head of the Waiho River fan by large flood events.
3.1.4 Observations and Interpretations of Behaviour of Waiho River Fan
In recent years, a range of interpretations has been put forward regarding geomorphological trends
in behaviour of the Waiho River fan based on the evidence available. These were debated at a
workshop held as part of an International Gravel-Bed Rivers Symposium at Franz Josef in
September 2000.
6-WWES3.28 | 24 June 2014 Opus International Consultants Ltd12
153
152
151
150
Mean Bed Level
Soffit Level
149
Design Flood Level
Mean Bed Level
Design Bed Level
148
147
146
145
Jan 1997
Jan 1998
Jan 1999
Jan 2000
Jan 2001
Jan 2002
Jan 2003
Jan 2004
Jan 2005
Jan 2006
Jan 2007
Jan 2008
Jan 2009
Jan 2010
Jan 2011
Jan 2012
Date
Figure 4: Mean bed levels in Waiho River at site of State Highway 6 Bridge Crossing (1997-2012)
Davies and McSaveney (2001), reiterating their earlier interpretation in McSaveney and Davies
(1998), hypothesised that the fan is in an equilibrium state (with the sediment transport capability
matching the sediment supply) but that, since human intervention, the effect of continued
confinement of the upper fan by stopbanks on both sides has been to induce fan aggradation.
However, Williams (2001), in a discussion of Davies and McSaveney’s (2001) paper, offered an
alternative view that the fan is not in an equilibrium state and that the stopbanks may simply be
influencing a natural trend of aggradation by restricting the deposition of transported sediment
into adjacent areas across the wider fan surface. Mike Church, one of the overseas experts who
made a presentation at a public meeting on the problems of the Waiho River as part of the
International Gravel-Bed Rivers Symposium Workshop, also questioned the hypothesis of the fan
being in an equilibrium state (Rouse et al, 2001).
It is difficult to ascertain the correct interpretation of actual fan behaviour as the effects of
stopbank confinement of the fan and the natural fan-building process are impossible to separate
out from the available field evidence.
Since the International Gravel-Bed Rivers Symposium Workshop was held in 2000, more intensive
monitoring in the form of cross-section surveys of the Waiho River fan has taken place. The
evidence obtained from these surveys is evaluated and discussed in the next section.
6-WWES3.28 | 24 June 2014 Opus International Consultants Ltd13
3.1.5 Recent Quantitative Trends of Bed Levels on Waiho River Fan
In this section, the monitoring data from the January 2002, June 2008 and March 2011 cross-
section surveys are re-examined in greater detail compared to the analysis by Hall (2012).
However we have not re-analysed the data. In our re-examination we have re-used the mean bed
level and sediment volume data calculated by Hall (2012) and presented in Table 1 of Appendix 5 of
his report.
The purpose of our re-examination of the monitoring data was to discern more precise bed level
trends on the upper part of the fan in order to extrapolate possible future bed levels. We have
focussed particularly on that part of the upper fan between cross-section 15 (where the fan first
starts to expand past the heliport) and cross-section 22 (the pinch point at the Waiho Loop) (refer
to the drawing in Appendix A).
Appendix B presents graphs of the March 2011 cross-sections over-plotted on the June 2008 cross-
sections for cross-sections 15 – 22. There are a number of clear trends evident from these cross-
sections over-plots:
(a) There is a distinct gradient across the fan from left to right on cross-sections 16-22, with
the left side higher than the right side, i.e. the fan surface is tilted from left to right
between these cross-sections.
(b) On cross-sections 16-18, there appear to be distinctive braid channels down the left side of
the fan, even though bed levels are higher.
(c) In contrast, on cross-sections 19-21, the predominant braid channels occur down the right
side of the fan.
(d) The left side of the fan on most cross-sections is higher than the crest level of the right
bank stopbank (or top of bank) level (cross-sections 16, 17, 19, 20, 21).
(e) Bed levels are distinctly higher in March 2011 compared to those in June 2008.
Figure 5 and Figure 6, which show aerial photographs of the upper point of the fan in January 2011
and October 2013, confirm points (b) and (c) above (refer to the drawing in Appendix for the
location of the various cross-sections). In fact the aerial photograph from October 2013 (Figure 6)
indicates that the switch in location of the left side braid channels over to the right side is even
more accentuated than it was in January 2011. This could very well be correlated with the sharp
upward shift in the mean river bed level at the site of SH6 Bridge Crossing seen in Figure 4.
Figure 7 shows mean bed levels down the Waiho River fan as calculated by Hall (2012). Mean bed
levels at cross-sections 16–21 are above the top levels of the bank on the right side of the fan. This
trend is even more accentuated in Figure 8 which shows maximum bed levels on the left side of
each cross-section (excluding bank top levels) down the fan. While the mean bed levels are
typically in order of 1-2 m higher than right bank top levels, the left side maximum bed levels are as
much as 3-4 m higher than the right bank top levels.
6-WWES3.28 | 24 June 2014 Opus International Consultants Ltd14 Figure 5: Aerial photograph of upper part of Waiho River fan (January 2011) (sourced from NZ Aerial Mapping) Figure 6: Aerial photograph of upper part of Waiho River fan (October 2013) (sourced from Google Earth) 6-WWES3.28 | 24 June 2014 Opus International Consultants Ltd
15

               160

                          11
                                                                                                                    mean bed level (Jan-02)
               150
                     10        12                                                                                   mean bed level (Jun-08)
                                    13                                                                              mean bed level (Mar-11)
                                                                                                                    right bank level
                                             14
                                                  15
               140

                                                       16
                                                                  17
               130
Level (RL m)

                                                                          18

                                                                                   19
               120

                                                                                            20
               110
                                                                                                      21

               100
                                                                                                                    22

                                                                                                                                   23
                90
                     0                   1                  2                  3             4                  5              6              7
                                                                Distance from Callery / Waiho confluence (km)

Figure 7: Mean bed levels down Waiho River fan between 2002 and 2011 (cross-section numbers
attached to each data point)
               160

                                                                                                                     top bed level (Jan-02)
               150                                                                                                   top bed level (Jun-08)
                                    13
                                                                                                                     top bed level (Mar-11)
                                                                                                                     right bank level
                                             14
                                                  15
               140

                                                       16

                                                                  17
               130
Level (RL m)

                                                                          18

                                                                                   19
               120

                                                                                            20
               110
                                                                                                      21

               100                                                                                                  22

                90
                     0                   1                  2                  3             4                  5              6              7
                                                                Distance from Callery / Waiho confluence (km)

Figure 8: Top bed levels down Waiho River fan between 2002 and 2011 (cross-section numbers attached
to each data point)

6-WWES3.28 | 24 June 2014                                                                                                      Opus International Consultants Ltd
16
Figure 9 shows the average bed level change per year down the fan computed from the data
presented by Hall (2012). The data shows two distinct trends:
(a) from January 2002 to June 2008, the fan surface between cross-sections 15-21 showed an
approximately uniform increase of 0.050 m/yr; and
(b) from June 2008 to March 2011, the fan surface between cross-sections 15 and 22 showed
an approximately linear decrease in average bed level change from 0.275 m/yr to 0 m/yr.
The latter trend represents a distinctly greater aggradation volume across the fan surface.
In both cases the average bed level change at cross-section 22, the pinch point on the Waiho Loop,
was very close to 0 m/yr.
Figure 10 shows the cumulative bed volume gain from sediment aggradation down the fan between
the three surveys. A positive gradient on the curves in this graph is indicative of aggradation while
a negative gradient is indicative of degradation. The whole of the fan surface was aggrading
between January 2002 and June 2008 with more than half of the aggradation occurring below
cross-section 21. In contrast the fan surface was aggrading at a much faster rate between June
2008 and March 2011, but below cross-section 21, degrading. Figure 11 translates the cumulative
bed volume data in Figure 10 into cumulative bed volume change values per year. The shorter
inter-survey period from June 2008 to March 2011 means that cumulative bed volume change per
year was substantially greater than in the previous January 2002 to June 2008 inter-survey period.
The shape of the 2008-2011 curves in Figure 10 and Figure 11 is suggestive of a large sediment
pulse moving down the upper fan.
1.000
ave bed level change (2002-2008)
ave bed level change (2008-2011)
0.800 11
10
12
0.600
average bed level change (m/yr)
0.400 13 14
15
17
16 18
0.200 19
20
21
22
0.000
0 1 2 3 4 5 6 7
Distance from Callery / Waiho confluence (km)
-0.200
23
-0.400
-0.600
Figure 9: Average bed level change per year on Waiho River fan between 2002 and 2011 (cross-section
numbers attached to each data point)
6-WWES3.28 | 24 June 2014 Opus International Consultants Ltd17
2500000
2002-2008
2008-2011
2000000
Cumulative volume change (m3)
21
1500000
20
19
18
1000000 22
17
16
500000 15
14
13
12 23
11
10
0
0 1 2 3 4 5 6 7
Distance from Callery / Waiho confleunce (km)
Figure 10: Cumulative bed volume change down Waiho River fan between 2002 and 2011 (cross-section
numbers attached to each data point)
600000
21
2002-2008
2008-2011
20
500000
Cumulative volume change per year (m3/yr)
19
18
400000
22
17
300000
16
200000
15
14
13
100000
23
12
11
10
0
0 1 2 3 4 5 6 7
Distance from Callery / Waiho confleunce (km)
Figure 11: Cumulative bed volume change per year down Waiho River fan between 2002 and 2011
(cross-section numbers attached to each data point)
6-WWES3.28 | 24 June 2014 Opus International Consultants Ltd18
3.1.6 Fluvial Related Risks to Existing WWTP
In the light of the observed bed level trends on the upper part of the Waiho River fan, the location
of the existing Franz Josef Village WWTP along the right side of the fan between cross-sections 18
and 19 makes the oxidation ponds extremely vulnerable to damage by large floods.
Damage could occur in either of two ways:
(a) flood-induced lateral erosion of the right bank adjacent to or immediately upstream of the
ponds; or
(b) flood overtopping and channel avulsion.
Scenario (a) is considered less likely to occur than scenario (b). While the right bank adjacent to
the oxidation ponds is heavily armoured with rock rip-rap as seen in Figure 2, there appears to be a
gap in the bank protection between the start of this heavy rock armour and the end of the rock snub
groynes installed further upstream. This gap, just upstream of the first oxidation pond, makes the
right bank vulnerable to lateral erosion of a breach through to this pond.
However, the risk of flood overtopping and channel avulsion is considered to be a far greater threat
to the oxidation ponds. Hall (2012) has already articulated this risk and identified potential
overflow points where the right bank is lower immediately to the south (upstream) of the first
oxidation pond (the access track running along the top of the right bank is markedly lower at this
point and rises up as it goes past the two ponds), and further to the north (downstream) of the
second pond. The risk arises from a number of factors: the low bank levels, the tilted shape of the
fan directing flood flows towards the right side of the fan, and the significant aggradation trend on
the fan surface with increasing bed levels. Figure 12and Figure 13 illustrate the effects of rising bed
levels across the fan surface on existing right bank protection measures.
If the right bank immediately upstream of the first oxidation pond was overtopped, flood flows
would flow northwards through the oxidation ponds and head across country towards the Tartare
River. Suspended sediment and gravel bed material transported by the flood flows would fill the
ponds. While this may only be a temporary and episodic occurrence initially, ultimately with
ongoing deposition of sediment material on the fan surface, it could lead to permanent avulsion of
river flows through the oxidation pond site into the Tatare River.
Hall (2012) rates the potential for avulsion towards the Tatare River either at this location or
further downstream of the oxidation ponds as very high in the near future.
3.1.7 Quantification of Risks to WWTP
As part of his review of future management options for the Waiho River, Hall (2012) carried out a
flood frequency analysis of the Whataroa River at SH6 bridge gauging station flow record and
scaled the flood estimates based on a regional flood frequency approach to determine flood
estimates for the Waiho River. The flood frequency analysis used a Generalised Extreme Value
(GEV) EV1 frequency distribution. The results of the analysis are presented in Table 2 of his report.
Table 1 below extends the data presented by Hall (2012) to much higher frequencies and corrects
the mean annual flood value given in his data table (the corrected mean annual flood value of 1446
m3/s very closely matches the equivalent value obtained by Webby and Waugh (2003) using the
same flood estimation approach but based on a Log Pearson 3 frequency distribution).
6-WWES3.28 | 24 June 2014 Opus International Consultants Ltd19 Figure 12: Partial submergence of snub groyne structures along right bank of Waiho River providing bank erosion protection upstream of Franz Josef Village WWTP Figure 13: Partial submergence of toe of existing rock armour along embankment protecting oxidation ponds comprising Franz Josef Village WWTP 6-WWES3.28 | 24 June 2014 Opus International Consultants Ltd
20

Table 1: Flood frequency estimates for Waiho River at SH6 Bridge (based on a GEV EV1 type frequency
distribution)
    Average Recurrence         Annual Exceedance
                                                             Flow (m3/s)
      Interval (years)             Probability
            1.001                      0.999                      1156
               1.01                     0.990                      1203
               1.1                      0.909                      1279
               1.2                      0.833                      1312
               1.4                      0.714                      1353
               1.6                      0.625                      1382
                2                       0.500                      1422
      2.33 (mean annual)                0.429                      1446
               2.7                      0.370                      1468
                3                       0.333                      1484
                4                       0.250                      1523
                5                       0.200                      1550
               10                       0.100                      1640
               20                       0.050                      1730
               50                       0.020                      1820
               100                      0.010                      1910

GEMC (2008 and 2011) have used the cross-section data for the Waiho River fan to construct a
one-dimensional computational hydraulic model in order to establish design flood levels down the
fan for various left and right bank stopbanks. There are a number of criticisms of this approach:

      (a)      A one-dimensional model treats each cross-section as representing a single thread
               channel and does not account for flood flows across the alluvial fan surface being
               distributed amongst several different braid channels. For example, cross-sections 15
               and 16 (refer to the cross-section over-plots in Appendix B) almost certainly have
               several braid channels across their entire width which convey flood flows as indicated
               by Figure 5 and Figure 6, and the aerial photo underlying the drawing in Appendix B.

      (b)      GEMC (2008 and 2011) assessed design flood levels for Waiho River fan based on
               Manning’s n channel roughness values in the range of 0.030-0.040 (predominantly
               0.037). As noted by Hall (2012), these hydraulic roughness values for a steep gravel
               bed river channel in flood are unrealistically low. They are more likely to be in the
               range 0.050 and 0.060 due to the effects of entrainment and transport of coarse bed
               material and “the formation, translation, destruction and reformation of gravel bars
               etc.” by flood flows.

      (c)      Even though GEMC (2008 and 2011) undertook sensitivity testing of their predicted
               design flood levels with increased channel roughness values (predominantly 0.044),
               their design flood levels are likely to be underestimates of actual flood levels.

Notwithstanding these criticisms, we have constructed a simple one-dimensional hydraulic model
of the Waiho River fan between cross-sections 15 and 22 to estimate flood levels down the fan for
different sized floods and for future bed level projections. The future bed level projections were

6-WWES3.28 | 24 June 2014                                                   Opus International Consultants Ltd
21
based on the two average mean bed level change per year trends inferred previously in Section 3.1.5
from Figure 9:
(a) lower bound estimate – mean annual bed level change of 0.050 m/yr between cross-
sections 15 and 21
(b) upper bound estimate – linear decrease in mean bed level change from 0.275 m/yr at
cross-section 15 to 0.0 m/yr at cross-section 22.
In the case of both lower and upper bound bed level projections, the mean bed level at cross-
section 22 (the pinch point on the Waiho Loop – refer to the drawing in Appendix A) was assumed
to remain constant over time even though the braid channels shift around (refer to the cross-
section over-plot in Appendix B).
For the purpose of the flood levels calculations, we first had to estimate March 2014 bed levels by
projecting out from the last surveyed cross-sections in March 2011. Because the amount of
sediment aggradation on the fan has been so dramatic in recent years, we only considered the effect
of bed levels out to March 2019.
Figure 14and Figure 15 show stage/discharge rating curves at cross-sections 18 and 19 respectively
for the following bed level scenarios for the Waiho River fan:
Existing bed levels (March 2011)
March 2014 bed levels – lower bound estimate based on scenario (a) above
March 2019 bed levels – lower bound estimate based on scenario (a) above
March 2014 bed levels – upper bound estimate based on scenario (b) above
March 2019 bed levels – upper bound estimate based on scenario (b) above
The stage/discharge rating curves for cross-section 18 in Figure 14 are almost certainly
overestimated as they do not reflect the presence of braid channels along the left side of the fan
conveying a substantial portion of the total flow for each flood flow value.
The stage/discharge rating curves in Figure 15 for cross-section 19 are considered more realistic as
cross-section 19 is predominantly triangular-shaped with the bulk of flood flows forced to flow
along the right bank of the fan past this cross-section.
Hall (2012 has reviewed the design flood level estimates for the right bank by GEMC (2011) and
determined that the freeboard is marginal along the right bank at cross-sections 18 for a 5% ( 1 in
20) annual exceedance probability (AEP) flood of about 1820m3/s. The freeboard was also
marginal downstream of the armoured bank around the perimeter of the oxidation ponds for cross-
section 19 (refer to long-section G in Appendix B of GEMC (2011)).
With a more realistic Manning’s n value of 0.06 for the “channel” down the alluvial fan, the
freeboard for a 5% AEP flood would be even more marginal. We have assumed therefore that this
flow value was the threshold for flood breakout in March 2011.
6-WWES3.28 | 24 June 2014 Opus International Consultants Ltd22 Figure 14: Estimated stage / discharge rating curves for cross-section 18 from 2014-2019 Figure 15: Estimated stage / discharge rating curves for cross-section 19 from 2014-2019 6-WWES3.28 | 24 June 2014 Opus International Consultants Ltd
23

We have used the rating curves plotted in Figure 15 for cross-section 19 to determine at what flow
the equivalent threshold flood level is reached for each of the lower and upper bound bed level
projections to March 2014 initially, and then to March 2019. We have then linearly interpolated
additional flow threshold values for each year between 2014 and 2019 and translated these flow
values into annual exceedance probability values using the data from Table 1. Table 2 and Table 3
summarise the results of this process for the lower and upper bound sediment aggradation
estimates for the alluvial fan.

Table 2: Estimated annual exceedance probabilities for right bank flood breakout through Franz Josef
Village WWTP for lower bound sediment aggradation scenario on alluvial fan (2014-2019).
          Year             Flow Threshold (m3/s)      Average Recurrence        Annual Exceedance
                                                         Interval (years)           Probability

             2011                   1820                      20                        0.050

             2014                   1550                       5                        0.200

             2015                   1480                       3                        0.333

             2016                   1410                      1.9                       0.526

             2017                   1340                     1.25                        0.741

             2018                   1270                     1.09                        0.917

             2019                   1200                      1.01                      0.999

Table 3: Estimated annual exceedance probabilities for right bank flood breakout through Franz Josef
Village WWTP for upper bound sediment aggradation scenario on alluvial fan (2014–2019)
          Year             Flow Threshold (m3/s)      Average Recurrence        Annual Exceedance
                                                         Interval (years)           Probability

             2011                   1820                      20                        0.050

             2014                   1150                     1.001                      0.999

             2015                                                                       1.000

             2016                                                                       1.000

             2017                                                                       1.000

             2018                                                                       1.000

             2019                                                                       1.000

It is noted that the upper bound sediment aggradation scenario based on average bed level changes
per year between June 2008 and January 2011 implies that the annual probability of occurrence of
a right bank flood breakout is almost 1 for this current year (March 2014). As this did not occur in
the recent November to March flood season, it suggests that this sediment aggradation scenario is
probably not realistic for a long-term trend.

This is supported by evidence presented previously. We have previously noted that the appearance
of the cumulative sediment volume curves for the June 2008 to March 2011 period in Figure 10and

6-WWES3.28 | 24 June 2014                                                 Opus International Consultants Ltd
24 Figure 11 is suggestive of a large sediment pulse moving down the upper part of the fan. The very significant aggradation that occurred in this period appears to be well correlated with the significant shifts in mean bed level seen at the site of the SH6 Waiho River bridge between January 2009 and January 2012 and in January 2011 seen in Figure 4. Over the period January 2002 to June 2008 the mean bed level at the SH6 Bridge remained relatively constant so that the lower bound sediment aggradation trend on the alluvial fan is probably more indicative of the longer term trend. However the potential for an episodic sediment volume injection cannot be discounted which means that there is a risk that the lower bound estimates of annual exceedance probability for flood breakout could understate the true values likely to be experienced over the next five years. Table 2 indicates that the annual exceedance probability for right bank flood breakout through the Franz Josef Village WWTP increases from 0.20 in March 2014 to 0.99 in March 2019. In other words the potential for flood breakout through the WWTP is an almost certainty by 2018-2019. The implication for Westland District Council is that Council needs to proceed with planning for, designing and constructing a new WWTP on a different site as a matter of urgency. 3.1.8 Conclusions The Waiho River alluvial fan has experienced accelerated aggradation of gravel bed material since January 2002, and particularly between June 2008 and March 2011. The ongoing sediment aggradation trend is manifested by continually increasing bed levels across the width of the fan. These continually increasing bed levels are superimposed on bed profiles with a distinct left to right tilt between cross-sections 16 and 21. The left to right downward bed tilt trend is characterised by left side bed levels that are several metres higher than right side bed levels and also higher than right bank top levels. The shape of the alluvial fan surface effectively directs braid channels on the fan surface below the head of the fan at the SH6 bridge towards the right bank immediately upstream of the oxidation ponds at the Franz Josef Village WWTP, and thereafter to hug the right bank till the Waiho Loop is approached. The combination of a tilted alluvial fan surface, ongoing sediment aggradation and left side bed levels higher than right side bed levels and bank levels makes the right bank in the vicinity of the oxidation ponds highly vulnerable to flood breakout through the ponds to the Tartare River, with permanent avulsion of the river ultimately possible. Hall (2012) has assessed the right bank freeboard along the right bank upstream and downstream of the oxidation ponds to be marginal for a 5% AEP flood of about 1820m3/s for the March 2011 alluvial fan profile. Using this flow threshold as a starting point and the January 2002 to June 2008 aggradation trend as indicative of the long-term trend, we have estimated that the annual probability of occurrence of flood breakout would increase from 0.20 in March 2014 to 0.99 in March 2019. 6-WWES3.28 | 24 June 2014 Opus International Consultants Ltd
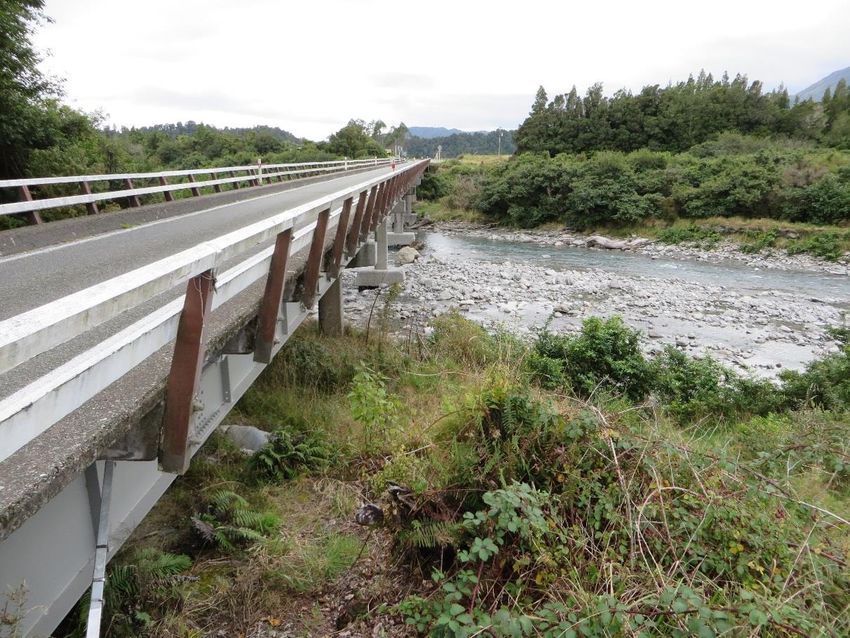
25 This implies that Westland District Council should be planning for designing and constructing a new WWTP facility on a different site as a matter of urgency. 3.2 Assessment of Fluvial Risks from Tartare River 3.2.1 Fluvial Risks from Tartare River The most suitable location for an alternative WWTP facility has been identified to the northeast of Franz Josef Village on open ground on the left bank flood plain of the Tartare River (Figure 16). The treated effluent from the WWTP could be either discharged to ground via an infiltration trench system or discharged directed to the river through a diffuser. Figure 16: View of Tartare River and floodplain looking upstream from SH6 bridge The Tartare River has a much smaller catchment than the Waiho River and has no major sediment aggradation problems like the Waiho. Figure 17 shows a photo of the SH6 Tartare River Bridge in which the pile cap on each bridge pier is slightly exposed above river bed level. This suggests there has been a slight degradational trend of the river bed since the bridge was first constructed. The only fluvial risks associated with the alternative WWTP site are: the potential for flood inundation if the plant is sited to close to the river localised bank erosion around any effluent discharge point The first risk can be mitigated by siting the new WWTP well away from the river. The second risk can be mitigated by appropriate siting of any outlet structure and armouring the bank in the vicinity with rock riprap material to prevent the occurrence of lateral bank erosion. 6-WWES3.28 | 24 June 2014 Opus International Consultants Ltd
You can also read