Advances of Metabolomics in Fungal Pathogen-Plant Interactions - MDPI
←
→
Page content transcription
If your browser does not render page correctly, please read the page content below
H

         OH
               OH
                    metabolites
Review
Advances of Metabolomics in Fungal
Pathogen–Plant Interactions
Fangfang Chen 1 , Ruijing Ma 1 and Xiao-Lin Chen 2, *
 1            State Key Laboratory of Biocatalysis and Enzyme Engineering, Hubei Collaborative Innovation Center for
              Green Transformation of Bio-Resources, School of Life Sciences, Hubei University, Wuhan 430062, China
 2            The Provincial Key Laboratory of Plant Pathology of Hubei Province, College of Plant Science and
              Technology, Huazhong Agricultural University, Wuhan 430070, China
 *            Correspondence: chenxiaolin@mail.hzau.edu.cn; Tel.: +86-27-62732130

 Received: 5 July 2019; Accepted: 12 August 2019; Published: 15 August 2019

 Abstract: Plant disease caused by fungus is one of the major threats to global food security, and
 understanding fungus–plant interactions is important for plant disease control. Research devoted to
 revealing the mechanisms of fungal pathogen–plant interactions has been conducted using genomics,
 transcriptomics, proteomics, and metabolomics. Metabolomics research based on mass spectrometric
 techniques is an important part of systems biology. In the past decade, the emerging field of
 metabolomics in plant pathogenic fungi has received wide attention. It not only provides a qualitative
 and quantitative approach for determining the pathogenesis of pathogenic fungi but also helps to
 elucidate the defense mechanisms of their host plants. This review focuses on the methods and
 progress of metabolomics research in fungal pathogen–plant interactions. In addition, the prospects
 and challenges of metabolomics research in plant pathogenic fungi and their hosts are addressed.

 Keywords: metabolomics; metabolites; plant pathogenic fungi; fungus–plant interactions;
 metabolic pathway

1. Introduction
     Metabolomics originated from metabolic profiling. Researchers at the Baylor College of Pharmacy
proposed and published the theory of metabolic profiling in the 1970s. With the advent and rapid
development of genomics, Oliver et al. proposed the concept of the “metabolome” in 1998 [1], and
many plant chemists conducted research in this area thereafter. Nicholson et al. proposed the concept of
metabonomics, which was defined as “the quantitative measurement of the dynamic multiparametric
metabolic response of living systems to pathophysiological stimuli or genetic modification” [2]. Since
their study, a lot of research on disease diagnosis and drug screening has been conducted using
metabonomics. Fiehn proposed “metabolomics” in 2001 and defined it as “a comprehensive and
quantitative analysis of all metabolites in a biological system” [3]. Metabolomics focuses on all small
molecule components and the fluctuations in individual cells or cell types, and is often used to study
plant and microbial systems.
     Interactions between fungi and their hosts represent an intriguing field which includes the
interactions of fungal pathogens with plant, insect, animal, or human hosts. Among these, fungal
pathogen–plant interactions are very important for agricultural production. At present, metabolomics
research in both fungi and plants has been finely reviewed [4–7], but has seldom focused on the fungal
pathogen–plant interactions. In the past decade, due to the importance of plant pathogenic fungi
in microbial systems, metabolomics techniques have been widely used in different research fields of
fungal pathogen–plant interactions, such as identifying fungi, determining infection mechanisms, and
detecting interactions with the host. Metabolomics is more widely used in fungus-infected plants to

Metabolites 2019, 9, 169; doi:10.3390/metabo9080169                                  www.mdpi.com/journal/metabolites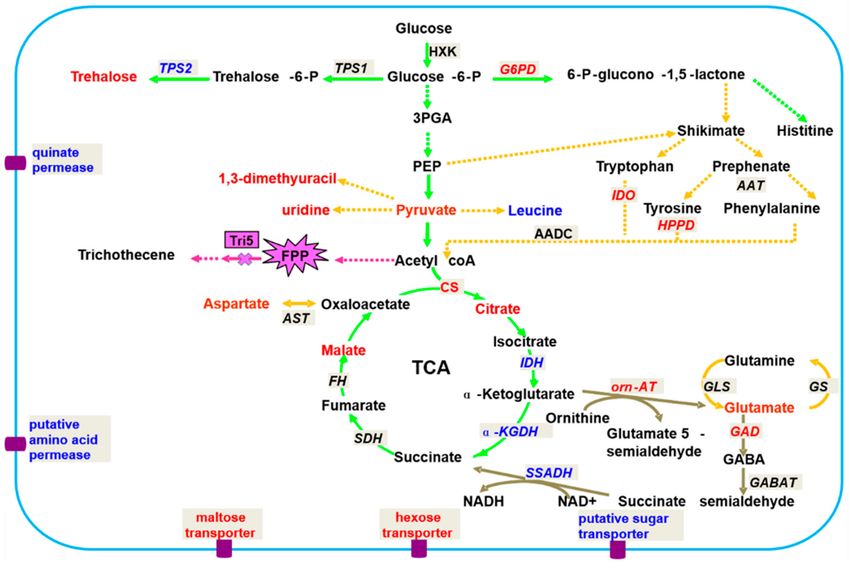
Metabolites 2019, 9, 169                                                                                 2 of 19

understand plant defense mechanisms. Up to now, metabolomics analyses of fungal pathogen–plant
interactions have mainly been performed between several fungi and their host plants, especially
between Fusarium graminearum, Magnaporthe oryzae, Ustilago maydis, Rhizoctonia solani, Botrytis cinerea,
Sclerotinia sclerotiorum, and their hosts. In this review, we summarize the major improvements in
analytical platforms and the recent advancements in metabolomics research of fungal pathogen–plant
interactions, aiming to further promote the application of metabolomics in plant pathogenic fungi
research, which can help us to understand the pathogenesis of pathogenic fungi and plant defense
mechanisms and eventually help us to develop new control strategies for fungal diseases.

2. Metabolomics Methods for Fungal Pathogen–Plant Interactions
     Techniques in metabolomics research are still under rapid development. Hence, methodologies
are constantly evolving with the expansion of the application scope [8]. Methods for experimental
design, sample preparation, data acquisition, data processing, and biological interpretation relevant
to metabolomics of fungal pathogen–plant interactions are described in the following sections, and
Figure 1 shows the metabolomics analysis flow for fungal pathogen–plant interaction research.

      Figure 1. Metabolomics analysis flow for fungal pathogen–plant interaction research. PCA, principal
      component analysis; HCA, hierarchical cluster analysis; PLS-DA, partial least squares discriminant
      analysis; OPLS-DA, orthogonal partial least squares discriminant analysis; MUDA, multiple univariate
      data analysis; LDA, linear discriminant analysis; NN, neural networks; HMDB: human metabolome
      database; KEGG, Kyoto encyclopedia of genes and genomes.

2.1. Experimental Design
      In order to obtain meaningful data, metabolomics research requires careful experimental design,
in which the time, type, and groups for sample collection should be carefully considered. In order to
obtain high-quality information, the problems to be solved must first be determined and appropriate
research parameters and reliable experimental techniques should be selected. Based on statistics, there
are many experimental design methods, including orthogonal design, single- and multiple-factor
design, regression design, and central combination design. To statistically reflect the validity of the
experimental data, it is necessary to consider how many samples should be selected and how many
metabolites should be detected [9]. According to statistical principles, 30 cases need to be counted,
and 20 cases need to be statistically significant. Apart from special situations, such as valuable classic
cases, in which samples are difficult to obtain, a sample number of less than five will lead to inaccurate
statistical results [10]. The smaller the sample number is, the larger the sampling error will be. If the
sample number is too small, the difference can be repeated, the test efficiency will be low, and the
influence of accidental factors cannot be ruled out, resulting in poor scientificity and authenticity.
Metabolites 2019, 9, 169 3 of 19
In contrast, if the sample number is too large, it will be difficult to strictly control the test conditions,
wasting manpower, material resources, and time.
2.2. Sample Preparation
Metabolomics is designed to analyze all of the information in a metabolome after stimulation
or disturbance in a biological system. Although it is currently possible to analyze the levels of all
metabolites, from a systematic point of view, multiple factors must be considered when collecting
samples, including the source of the samples, their growth conditions, genetic information, the sampling
time, the sampling interval, and the control settings. In short, to ensure the repeatability of microbial
growth under constant culture conditions, the selected samples should be representative of the study
subject without interfering with the research purpose.
When the external environment changes, small molecular metabolites in the organism will
also undergo rapid changes. Appropriate sample collection and preparation steps, including rapid
sampling, quenching, and extraction of metabolites, are thus highly necessary. It is generally necessary
to quickly freeze the samples after collection and store them in an environment below −60 ◦ C until
extraction to ensure the stability of the metabolites in the organism.
Metabolic quenching is a key step for obtaining biological samples. Due to the activities of
enzymes in the body, metabolites are degraded easily and more rapidly than mRNAs and proteins.
In order to reduce metabolite degradation, certain measures must be taken to inhibit the activity of
degrading enzymes, such as immediate filtration with liquid nitrogen, ultrafiltration or treatment with
acids, grinding with liquid nitrogen, and dilution with pre-cooled methanol solution followed by fast
centrifugation [11,12].
The extraction of metabolites is an important step in sample preparation. At present, the commonly
used methods for extracting metabolites include the use of cold methanol, hot methanol, and a
chloroform–methanol mixture, combined with auxiliary treatments such as ultrasonic crushing, glass
ball milling, circulating freeze–thaw, and microwaving. However, the diversity of metabolites will
lead to different solubilities, and it is often difficult to extract all metabolites with one single extraction
method. It is thus necessary for researchers to choose different extraction methods according to the
purpose of the experiment to ensure sufficient extraction of all metabolites and avoid changes in the
properties of metabolites.
2.3. Data Collection
The separation, detection, and identification of metabolites are the core parts of metabolomics
research. Gas or liquid chromatography-mass spectrometry (GC-MS or LC-MS), Fourier transform
infrared spectroscopy (FTIR), and nuclear magnetic resonance (NMR) are the three main platforms for
metabolomics research. In addition, there are other separation methods such as capillary electrophoresis
and electrochemical detection.
The core idea of MS analysis is to ionize an isolated compound to determine the content of specific
ions, which is the basis for the qualitative analysis of the compound’s properties. GC-MS analysis
can simultaneously measure hundreds of chemically different compounds, including organic acids,
most amino acids, sugars, sugar alcohols, aromatic amines and fatty acids, for the analysis of volatile
and intermediate compounds with the advantage of high separation efficiency and a reproducible
retention time [9]. The advantages of GC-MS analysis include high separation efficiency and good
reproducibility, but many compounds containing polar groups require pre-column derivatization to
achieve good separation [13]. The greatest advantage of GC-MS is that this method can use standard
libraries for structural identification, and a large number of libraries can be retrieved [14]. LC-MS
and multistage LC-MS (LC-MSn ) can detect compounds that do not volatilize easily, thermally labile
compounds, polar compounds, and macromolecular metabolites. The development of modern ion trap
multistage mass spectrometry has absolute advantages in the qualitative analysis of compounds and
the acquisition of structural information [15]. Capillary electrophoresis-mass spectrometry (CE-MS) hasMetabolites 2019, 9, 169 4 of 19
the advantages of rapid analysis, fewer required samples, low reagent consumption, and a relatively
low cost. It can detect polar or charged metabolites, such as inorganic ions, organic acids, amino acids,
vitamins, nucleotides and nucleosides, thiols, carbohydrates, and peptides [16].
With the development of metabolomics analysis technology, high-sensitivity and high-resolution
MS detectors with high-efficiency separation chromatogram matching have been developed to isolate
and identify biomolecules. Such detectors include two-dimensional gas chromatography with the
time of flight mass spectrometer (GC×GC-TOF-MS), triple quadrupole mass spectrometry (QQQ-MS),
matrix-assisted laser desorption ionization mass spectrometry (MALDI-MS), quadrupole rod tandem
time-of-flight mass spectrometry (Q-TOF-MS), hydrophilic interaction liquid chromatography
mass spectrometry (HILIC-MS), ion-pair-LC coupled to electrospray-ionization mass spectrometry
(IP-LC-ESI-MS), MALDI-TOF-MS, and other MS detectors, and the corresponding metabolite databases
appeared one after another.
FTIR is used to determine the infrared absorption frequency and intensity of the experimental
sample to identify each component, and it is mainly applied to determine the functional groups of the
components in the sample and the vibration of the high polarity bonds. Besides, FTIR also has some
disadvantages such as the inability to distinguish isomers, the effects of component fragments and
complex ions on the analysis, and the inability to quantitatively analyze ion suppression [17].
NMR is a non-destructive and high-throughput detection technique, which is based on the
magnetic properties of a nucleus with spin properties that absorbs radio frequency radiation and
generates energy level transitions under the action of a nuclear external magnetic field. NMR utilizes
the rich information from all small molecule metabolites in the organism provided by the NMR
spectrum of biological fluids and determines the complete metabolic map of related organisms through
multivariate statistical analysis and pattern recognition processing. Currently used NMR techniques
include the hydrogen spectrum (1 H-NMR), carbon spectrum (13 C-NMR), and phosphorus spectrum
(31 P-NMR), among which 1 H-NMR is the most widely used. The advantage of NMR over MS is that
the preparation is simple, and the structure of the substance can be easily identified. In addition,
the signal intensity on the spectrum is directly related to the concentration of the metabolite being
detected so that the metabolite can be accurately quantified. However, the sensitivity of NMR is low,
and it is difficult to simultaneously detect metabolites with large concentration differences in biological
systems, which hinders its application in fungal metabolomics. In order to improve the sensitivity of
NMR, the magic angle rotation NMR technique [18] and high resolution NMR were developed.
2.4. Data Processing and Analysis
After the chromatographic separation of biological metabolites, a large amount of spectral and
multivariate data are generated [19]. Each signal peak of the spectrum contains qualitative and
quantitative information about the various substances in the metabolite. Hence, it is necessary to use
statistics and chemometrics for analysis. Initially, the raw data require preprocessing, including baseline
correction, feature detection, noise filtering, peak extraction, peak alignment, deconvolution, and
normalization to eliminate interference factors. These processes can be implemented using software,
such as MetAlign [20], MZmine [21], XCMS [22–24], METIDEA [25], AMDIS (https://chemdata.nist.
gov/dokuwiki/doku.php?id=chemdata:amdis), and MSFACTS [26]. Many instrument manufacturers
have also developed their own proprietary software such as MarkerLynx (Waters, Milford, MA, USA),
AnalyzerPro (SpectralWorks, Runcorn, Cheshire, UK), Progenesis QI (Waters, Milford, MA, USA),
MetAlign (20), MassProfiler (Agilent Technologies, Santa Clara, CA, USA), ChromsTof (Leco, St. Joseph,
MI, USA), MarkerView (Thermo Fisher Scientific, Waltham, MA, USA), and SIEVE (Thermo Fisher
Scientific, Waltham, MA, USA).
Pre-processed data require multivariate statistical analysis and bioinformatics analysis [27,28],
including unsupervised and supervised analyses. Unsupervised analyses include the principal
component analysis (PCA) and hierarchical cluster analysis (HCA). If the differences between the
sample groups are too small or the differences within the groups are too large, it is difficult toMetabolites 2019, 9, 169 5 of 19
determine the differences between groups [29,30]. Supervised analyses include the partial least-squares
discriminant analysis (PLS-DA), the orthogonal partial least-squares discriminant analysis (OPLS-DA),
the multiple univariate data analysis (MUDA), the linear discriminant analysis (LDA), and neural
networks (NN) [29–32]. These multivariate statistical analyses can help researchers to obtain potentially
effective information and find biomarkers and metabolic pathways.
Metabolomics analysis requires the use of various metabolic pathways and biochemical
databases [27,28]. At present, there is no well-established metabolomics database similar to those
available for genomics and proteomics. Establishment of a microbial metabolomics database will
accelerate the identification of compounds and species [33]. Some biochemical databases can be used
for metabolic pathway analysis and structural identification of unknown metabolites. Table 1 lists
the databases related to metabolomics and microbial metabolomics research for reference. An ideal
metabolomics database, such as the human metabolomics database (http://www.hmdb.ca), should
include the metabolome information of the organism and its quantitative data. Some public data, such
as the Pubmed compound library and the ChemSpider database (Table 1), which are available for
online retrieval, are also useful for identifying metabolites in various biological samples. In addition,
some research institutes have also established databases of metabolites in their research foci.
Table 1. Databases for metabolomics.
NO Name Website Address
1 ECMDB: The Escherichia coli Metabolome Database http://www.ecmdb.ca/
2 YMDB: The Yeast Metabolome Database http://www.ymdb.ca/
3 HMP: The Human Microbiome Project http://www.hmpdacc.org/
EcoCyc: Encyclopedia of Escherichia coli K-12 Genes and
4 http://www.ecocyc.org/
Metabolism
http://www.foodsafety.govt.nz/industry/
5 NMD: National Microbiological Database
general/nmd/
6 MNPD: Microbial Natural Products Database http://naturalprod.ucsd.edu/
UMBBD: University of Minnesota
7 http://umbbd.ethz.ch/
Biocatalysis/Biodegradation Database
8 BioCyc Pathway http://biocyc.org/
9 HMDB: Human Metabolome Database http://www.hmdb.ca/
10 KEGG: Kyoto Encyclopedia of Genes and Genomes http://www.genome.jp/kegg/
11 HumanCyc http://bicyc.org
12 ARM http://www.metabolome.jp
13 Lipidomics: Lipid Maps http://www.lipidmaps.org/data/index.html
14 Lipidomics: SphinGOMAP http://sphingomap.org/
15 Lipidomics: Lipid Bank http://lipidbank.jp/
16 New drug and its metabolite database http://www.ualberta.ca/_gjones/mslib.htm
17 ChemSpider Beta http://www.chemspider.com
18 METLIN http://metlin.scripps.edu/
19 MetaCyc Encyclopedia of Metabolic Pathways http://metacyc.org/
20 PubChem Compound http://www.pubmed.gov
21 SYSTOMONAS genome Database http://systomonas.tu-bs.de/
22 PathDB: Pathogen Database http://www.ncgr.org/pathdb/
23 NIST: National Institute of Standards and Technology http://www.NIST.gov/srd/
3. Research Progress and Application of Metabolomics in Fungal Pathogen–Plant Interactions
Plant pathogenic fungi can cause a serious reduction in the crop yield and affect the quality of
agricultural products [34–37]. Revealing the infection mechanisms of the plant pathogenic fungi canMetabolites 2019, 9, 169 6 of 19
help us to develop novel strategies to control fungal diseases. In particular, metabolomics could provide
targets for the development of new fungicides. At present, metabolomics technology is widely used in
the field of plant pathogenic fungi research. Metabolomics research of plant pathogenic fungi focuses
on the functions of metabolites and metabolic pathways during fungal development, pathogenesis,
and interactions with plants. Metabolomics can be used to detect normal genetic development and the
changes in metabolome characteristics caused by host stimulation [38], which reflects the phenotypic
changes of fungi from a global point of view. Metabolomics can also be used to obtain small molecular
metabolites produced by plants upon infection of pathogenic fungi [39,40]. In order to study the plant
immunity, elicitors derived from the plant pathogenic fungi are also used to treat the host plant for
metabolics research. Many plant pathogenic fungi such as Fusarium and Aspergillus can produce toxins
in host cells. Therefore, toxin-induced changes in the plant metabolic pathways can be also finely
detected by metabolomics. Combined with a variety of omics methods and techniques, metabolomics
can also help to screen for resistant varieties and assisted crop breeding [39,41–45].
3.1. Progress in Metabolomics Research for Fungal Pathogen–Plant Interactions
At present, extensive progress has been made in several fungal pathogen–plant interaction
systems, including the Fusarium graminearum–wheat interaction, Rhizoctonia solani, Magnaporthe
oryzae–rice interaction, Ustilago maydis–maize interaction, Botrytis cinerea–plant interaction, Sclerotinia
sclerotiorum–plant interaction, Colletotrichum–plant interaction, and Verticillium–plant interaction, which
will be described in the following sections (Table 2).
3.1.1. Fusarium graminearum–Wheat Interaction
Fusarium head blight (FHB) is a fungal disease caused by Fusarium graminearum (FG), which can
cause rot in various cereal crops such as wheat, corn, and barley. FHB not only affects the crop yield but
also decreases the quality of agricultural products [46]. Fusarium is a necrotrophic pathogen. It secretes
toxins to kill plant tissues and then uses dead tissue for nutrients during infection. At present, more
than 300 Fusarium toxins, such as the deoxynivalenol (DON) toxin, have been found, and more than
100 of them are toxic to almost all eukaryotes [46].
Lowe et al. used 1 H NMR and GC-MS to study the differences in metabolites among four
different Fusarium strains. The results showed that the effects of the nutrient environment on fungal
metabolism are greater than those of genotypes [47]. Chen et al. also employed 1 H NMR and GC-MS
to study the differences in metabolites between F. graminearum 5035 and Tri5 gene deletion. The results
showed that Tri5− deletion would lead to a normal phenotype but the toxigenic ability would be
lost. The primary metabolites of F. oxysporum vary widely. Metabolite changes include changes in
carbon, sulfur, and nitrogen fluxes; the tricarboxylic acid (TCA) cycle; gamma-amino butyric acid
(GABA) bypass; the shikimate pathway, and amino acids, lipids, choline, purines, pyrimidines, and
other metabolites (Figure 2). These results suggest that toxins have an effect on the physiological
functions of fungi and that lipids and shikimic acid-related metabolites provide some information
for studying the toxigenic mechanism of F. graminearum. The results provide a theoretical basis and
data for the further development of new biologic agents against FHB [12]. The above research results
fully demonstrate that phytopathogenic fungal metabolomics can not only identify strains through the
secretion of metabolites but are also an effective tool for studying metabolic pathways and the gene
functions of pathogens.Metabolites 2019, 9, 169 7 of 19
Figure 2. Hypothetical network of metabolism in F. graminearum related to 5035/Tri5. Red font
indicates significantly up-regulated metabolites (r > 0.75); blue font indicates significantly up-regulated
metabolites (r > 0.75); black font indicates metabolites detected but with low cutoff values (r < 0.75) or
not detected in this study; the green pathway indicates C metabolism; the orange pathway indicates
N-metabolism; maroon indicates the GABA shunt; the textbox with a French grey background indicates
the code genes in the metabolism, the red and blue fonts indicate the significantly up/down-regulated
trends, and the black font indicates no changes in the trends; significant metabolites are shown by
an explosive shape. Abbreviations: 3-PGA, 3-phosphoglycerate; PEP, phosphcenolpyruvate; TCA,
tricarbocylic acid cycle; FPP, farnesyl pyrophosphate.
More than 100 quantitative trait loci related to FHB resistance have been found in wheat
and barley using QTL mapping, indicating multiple mechanisms of FHB resistance [48,49].
The Qfhs.ndsu-3BS site is known to be involved in the process of detoxification of DON to the less
toxic DON-3-O-glucoside (D3G) [48,49], and it also confers FHB resistance [50,51]. In barley samples
infected with Fusarium, an increase in the DON/D3G concentration was positively correlated with the
increase in several plant-related metabolites including jasmonic acid (JA), dihydro-7-hydroxyglycine,
kaempferol-3-O-glucoside-7-O-rhamnoside, and 4-methoxycinnamic acid [52]. Hamzehzarghani et al.
used GC-MS to study the quantitative resistance of the F. graminearum interaction system and tentatively
identified 55 metabolites, and analyzed the metabolites that play roles in plant disease resistance.
The biosynthetic pathways provide a theoretical basis for the selection of new varieties with resistance
to FHB [53]. Paranidharan et al. also used GC-MS to study the resistance of wheat to F. graminearum.
After inoculation with the F. graminearum and Fusarium toxin DON, 117 metabolites were identified by
Paranidharan et al. using GC-MS [54]. Tomas and Bollina used liquid chromatography with electrospray
ionization coupled with LTQ-Orbitrap mass spectrometry (LC-ESI-LTQ Orbitrap MS) to study some
metabolites associated with quantitative resistance in response to F. graminearum infection [52,55].
In barley, compared with the susceptible lines, higher levels of flavonoids, phenylpropanoids, and
metabolites of fatty acids and terpenoid pathways were found in the resistant barley lines upon
infection with Fusarium [56]. Kumaraswamy et al. also screened barley lines against FHB and found
that 161 metabolites, including linoleic acid, p-coumaric acid, and naringenin, may be associated with
the lower susceptibility of barley lines [57].Metabolites 2019, 9, 169 8 of 19
The complex system consisting of disease-resistant and disease-susceptible barley as well as
toxin-producing and non-toxin-producing F. graminearum is an ideal model for studying the metabolic
response of wheat to FHB [48]. In wheat-resistant varieties, JA-Ile (jasmonic acid isoleucine) and HCAAs
(hydroxycinnamic acid amide, phenol polyamine conjugate), such as acyl putrescine/mercaptoamine
and wheat glutamate/mercaptoamine, showed excessive accumulation. This resistance is mainly
attributed to the activation of phenylpropanoid, steroid, and fatty acid metabolic pathways; and DON
detoxification of D3G [48].
3.1.2. Magnaporthe oryzae–Rice Interaction
Rice blast caused by the filamentous ascomycete fungus M. oryzae (also called M. grisea) is the most
serious fungal disease in rice worldwide, causing severe yield reductions each year and significant
economic losses [58]. Jones et al. used a meta-analytical method based on GC-MS/MS, LC-MS/MS, and
1 NMR to evaluate rice at different time points after infection by compatible (KJ201) and incompatible
(KJ401) strains of M. grisea. There was no significant difference in the metabolic response caused by
each pathogen strain at 24 h after inoculation. The greatest change was found in alanine, which was
about 30 ± 9% higher in the compatible strain than in the resistant strain. Together with several other
metabolites, alanine shows good correlations between the time of infiltration of the leaves by the
fungus and the divergence of the metabolite profile in each interaction. The authors proposed that the
production of a large amount of alanine triggered by fungi may lead to cell death, thereby promoting
M. grisea infection [59]. M. oryzae also produces a variety of phytotoxic secondary metabolites, such as
pyrichalasin, tenuazonic acid, and magtoxin [60]. The HPLC/MS method has been used to identify
pyriculol and pyriculariol as the metabolites present after M. oryzae infection, but pyriculol is not
necessary for causing rice damage [61].
Recent studies have shown that phosphorylatic and phosphatidyl glycerol (PG) are associated
with the resistance of rice to M. oryzae [62]. When rice blast fungus infected the susceptible (ABR1) and
resistant (ABR5) rice, fatty acids were found to be the most important metabolites of the antagonistic
species, and electrospray ionization mass spectrometer (ESI-MS) analysis identified this substance
as phospholipids (PLs). PG is the main source of jasmonic acid (JA) in the host and is reduced after
the attacking of rice by M. oryzae. Researchers predicted that JA levels would increase, and this
prediction has been validated. In the early stage of inoculation with M. oryzae, PG-PLs were inhibited,
regardless of the presence of resistant or susceptible varieties. In the disease development stage,
different phosphatidic acid PLs showed rising or decreasing trends in the resistant varieties [45].
The metabolic pathways in Magnaporthe-infected hosts were not fully understood until ten years
ago. It was found that M. grisea can use a common metabolic reprogramming strategy to inhibit plant
defense and colonize plant tissues during colonization in barley, rice, and Brachypodium distachyon [62].
Non-target metabolic profiling and GC-TOF-MS targets were detected by flow injection electrospray
ionization mass spectrometry (FIE-MS) to confirm this result. In the host tissues, after pathogen
infection but before the appearance of symptoms, malate and polyamine accumulated and were used
to produce defensive active oxygen, and the presence of metabolites was related to the improvement of
redox stress. When the infected leaf tissue showed lesions, decreased photosynthesis, the accumulation
of amino acids and sugars, early transfer of the shikimate pathway to initiate the production of quinone
quate as well as the accumulation of unpolymerized lignin precursors were found. In the late stage of
fungal infection, when the infection hyphae rapidly expanded, the photoassimilates were conversed to
mannitol and glycerol for mycelial growth [62]. The rapid proliferation of M. grisea hyphae in plant
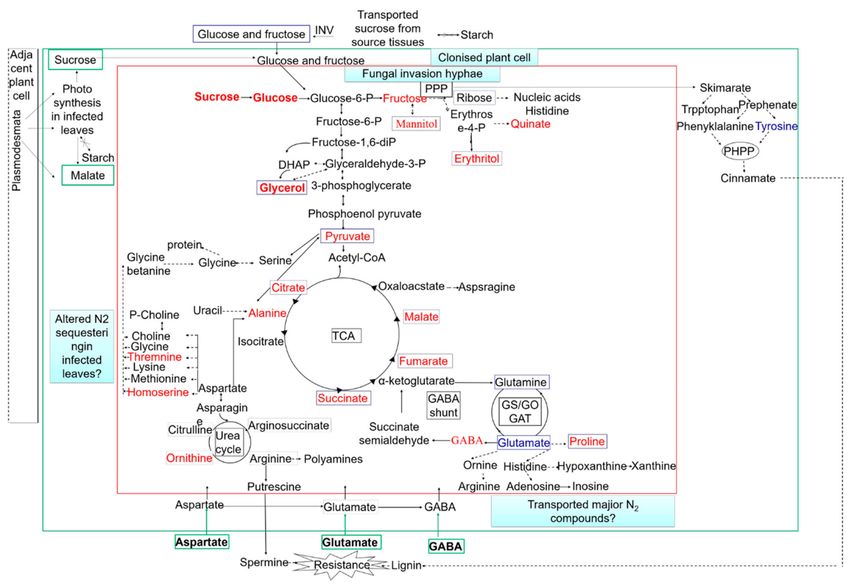
tissues after three days is associated with accelerated nutrient acquisition and utilization (Figure 3).Metabolites 2019, 9, 169 9 of 19
Figure 3. Model summarizing fungal metabolic interactions with the colonized host. INV, invertase;
PPP, pentose phosphate pathway; PHPP, phenylpropanoid pathway; TCA, tricarboxylic acid cycle.
The metabolites in blue boxes are fungal metabolites that are predicted to increase after 3 days.
The metabolites in green boxes are the major central carbon and nitrogen compounds that are likely to
be derived from the host. Red font represent the upregulation metabolites; blue font represents the
downregulation metabolites. The green arrows indicate transport across cell walls. The dotted arrows
indicate multiple enzymic steps.
3.1.3. Ustilago maydis–Maize Interaction
Doehleman et al. examined changes in the transcriptome and metabolites that induce tumor
formation on susceptible maize hosts [63]. U. maydis does not obtain more carbon nutrients through
lyase and can soften cell walls during plant colonization. During tumor formation, the flavonoid
pathway and the shikimate pathway were shown to be activated; the levels of related metabolites,
especially phenylpropionic acid, tyrosine, shikimic acid, significantly increased; and the levels of
hydroxycinnamic acid (HCA) derivatives and anthocyanins were elevated. The genes encoding sucrose
degradation, the tricarboxylic acid cycle, and glycolysis were significantly up-regulated, and the
hexose content also increased by more than 20 times. The amount of glutamine sharply decreased,
and the conversion of N to C source provided a large amount of carbon for tumor development,
indicating that the fungus induces the shikimate pathway and the flavonoid pathway, and the HCA
derivatives are involved in lignin biosynthesis. Anthocyanins are involved in a variety of biotic and
abiotic stresses. Although U. maydis does not directly contact the anthocyanins located in vacuoles,
anthocyanin accumulation may be an indirect stress response caused by this fungus [63].
3.1.4. Rhizoctonia solani–Plant Interaction
R. solani is a causative agent of sheath blight, which leads to huge economic losses every year.
By using UPLC-QTOF-MS metabolomics analysis, the metabolic variation of R. solani in vegetative,
differentiated, and undifferentiated mycelia was detected. The results identified that some metabolites
may act as biomarkers for the developmental stages of R. solani AG-1-IA. In addition, this researchMetabolites 2019, 9, 169 10 of 19
also revealed the mechanisms of sclerotium formation and mycelium differentiation at the metabolic
level [64]. Similar work has also used this method to reveal the infection mechanisms of R. solani [65].
On the other hand, metabolic profiling strategies were also used to determine the mechanisms
of plant defense against R. solani, including those in rice, wheat, barley, soybean, lettuce, and
potato [66–72]. In R. solani-infected soybean, global metabolism regulation was monitored over a
time period. A comprehensive metabolite library for soybean infected by R. solani was subsequently
constructed and will be used for metabolite identification and biological interpretation [67]. The study
of metabolic networks of soybean revealed that R. solani infection resulted in the mobilization of
carbohydrates, disturbance of the amino acid pool, and activation of the isoflavonoid, α-linolenate,
and phenylpropanoid biosynthetic pathways. These pathways exhibit antioxidant properties and
bioactivity that can help the soybean to counterattack R. solani infection. Unraveling the biochemical
mechanism by metabolomics during the R. solani–soybean interaction provides valuable insights for
crop breeding.
3.1.5. Botrytis cinerea–Plant Interaction
B. cinerea is a necrotrophic fungus, which can cause gray mold, one of the most serious diseases
for some fruits. B. cinerea often results in a large amount of fruit rotting during harvest, storage, or
transportation, causing serious economic losses. Global metabolomic analyses of B. cinerea-infected
strawberry, grape, tomato, and Arabidopsis have been performed [73–78]. In B. cinerea-infected
strawberry, metabolic profiling identified candidate biomarkers in the early stage of disease
development when symptoms were not visible, which is potentially important for early diagnosis of
B. cinerea [74]. The global metabolite changes induced by B. cinerea infection in grape were also detected
by 1 NMR to detect significant changes in chemicals or metabolites. This study revealed that B. cinerea
infection causes significant metabolic changes in grape berry, and at the same time, metabolites derived
from the plant and B. cinerea were both identified [76].
3.1.6. Other Fungal Pathogen–Plant Interactions
S. sclerotiorum is a predominately necrotrophic fungal pathogen with a broad host range.
A multiomic approach combining RNA sequencing, GC-MS-based metabolomics, and chemical
genomics was performed on the S. sclerotiorum-infected resistant and susceptible soybean cultivars.
The results identified an increase in bioactive jasmonate JA-Ile ((+)-7-iso-jasmonoyl-L-isoleucine),
which scavenges reactive oxygen species and reprograms the phenylpropanoid pathway to increase
antifungal activities in the resistant soybean [79].
Colletotrichum, a class of hemibiotrophic fungal pathogens, is one of the most widespread and
economically detrimental genera of plant pathogenic fungi. An untargeted LC-MS metabolomic strategy
was performed to elucidate metabolome changes in the anthracnose-causing C. sublineolum [80,81].
The results demonstrated through chemometric modelling revealed a metabolic variation trajectory,
comprising three distinct stages that metabolically describe the adaptation of the fungus to diminishing
nutrients. Using an UHPLC-HDMS analytical platform, Tugizimana et al. investigated the metabolic
alterations of three sorghum cultivars responding to C. sublineolum, which revealed key characteristics
of the biochemical mechanism underlying C. sublineolum–sorghum interactions and provided valuable
insights with potential applications in crop breeding.
In the wheat pathogen Stagonospora nodorum, by using GC-ESI-MS/MS, Tan et al. found that the
concentrations of secondary metabolites of the Sch1 mutants were more than 200 times higher than
those of the wild strain, which lays a solid foundation for elucidating the function of the Sch1 gene [82].
Lowe et al. used GC-MS to perform non-targeted analysis of related metabolites in the formation of
S. nodorum spores and found that chitosan plays an important role in sporulation [83].
Similar studies have also been carried out on the following interactions: Fusarium
oxysporum–chickpea [84,85], Verticillium dahliae–Arabidopsis [86,87], Verticillium longisporum–Arabidopsis [88],
Venturia inaequalis–apple [89], Alternaria solani–wild tomato [88], Alternaria brassicicola–Arabidopsis [90],Metabolites 2019, 9, 169 11 of 19
Gymnosporangium asiaticum–Rosaceae plants [91], Cercospora beticola–sugar beet [92], Plectosphaerella
cucumerina–Arabidopsis [93], Aspergillus oryzae–soybean [94], Penicillium digitatum–citrus [95], Zymoseptoria
tritici–wheat [96], and Alternaria alternata–jujube fruit [97]. These studies have shown that metabolomics
can be used to characterize plant-infecting fungal pathogens to identify some metabolites related to the
resistance and to clarify plant resistance. These methods can also be used to determine the fungi-related
metabolic mechanism, which is then used in fungicide development.
3.1.7. Integrating Multi-Omics Assisted Metabolomics Research of Fungal Pathogen–Plant Interactions
There is growing interest in linking metabolomics with other omics tools, including genomics,
transcriptomics, proteomics, and microbiomics. The integrated multi-omics strategies, in turn, could
contribute to the comprehensive biological understanding that metabolomics studies alone would
otherwise not achieve. A number of studies have reported on the use of integrated multi-omics based
metabolomics research in fungal pathogen–plant interactions [68].
An integrated transcriptomics and metabolomics approach was used to uncover the primary
metabolism regulation of soybean in response to Rhizoctonia infection [68]. Transcriptomics and
metabolomics data were analyzed individually and integrated through the bidirectional orthogonal
projections to latent structures (O2PLS), in order to reveal possible links between the metabolome
and transcriptome during the early and late infection stages of the Rhizoctonia–soybean interaction.
This study showed that alcohol and its associated gene product ADH (alcohol dehydrogenase) may
have important roles in soybean resistance to R. solani. This study provided novel insights into the
biological correlations and identification of metabolites that can be used in soybean breeding. A similar
strategy was also used to reveal genes resistant to Fusarium head blight (FHB) in wheat QTL-Fhb2 [98]
and the changes in the primary metabolism in bread wheat in response to F. graminearum [99].
Through a strategy combining proteomics and metabolomics, Kumar et al. revealed the metabolic
reprogramming of chickpea infected by F. oxysporum f.sp. ciceri (Foc) [84]. They used quantitative
label-free proteomics and 1 NMR-based metabolomics to detect the dynamics in root metabolism during
compatible and incompatible interactions between chickpea and Foc. The results showed a differential
expression of proteins and metabolites in the resistant chickpea compared with the susceptible ones
infected by Foc. Overall, the observed modulations in the metabolic flux, as an outcome of several
orchestrated molecular events, were shown to be determinant of the plant’s role in chickpea–Foc
interactions. A similar strategy was also used to decipher the mechanisms by which wheat QTL (Fhb1)
resists F. graminearum [100] and to uncover novel proteins potentially involved in defense mechanisms
against Sclerotinia in tomato overexpressing oxalate decarboxylase [101].
Pandey et al. integrated genomics, proteomics, and metabolomics approaches in order to
determine whether oxalic acid functions as a pathogenic factor in Tilletia indica [102]. The results
demonstrated that integrated omics approaches can be used to identify pathogenicity/virulence factor(s)
that would provide insights into pathogenic mechanisms of fungi, which is therefore effective for
developing new disease management strategies.
Table 2. Recent metabolomics studies in fungal pathogen–plant interactions.
Fungal Pathogen Plant Host Platform Year [Ref]
Fusarium graminearum wheat AP-SMALDI-MS 2018 [103]
wheat LC-ESI-LTQ-Orbitrap 2014 [104]
barley UHPLC-MS/MS 2014 [52]; 2011 [12]
Arabidopsis 1 H NMR 2018 [44]
barley LC-ESI-LTQ-Orbitrap 2012 [105]; 2010 [55]
Fusarium oxysporum chickpea 1HNMR 2016 [84]
chickpea UHPLC-ESI-MS/MS 2015 [85]
Fusarium tucumaniae soybean GC-MS 2015 [106]Metabolites 2019, 9, 169 12 of 19
Table 2. Cont.
Fungal Pathogen Plant Host Platform Year [Ref]
Magnaporthe oryzae barley and rice GC-MS 2009 [62]
1H NMR, LC-MS and
rice 2011 [58]
GC-MS
rice LC-MS and 1 H NMR 2016 [61]
Ustilago maydis maize LC-MS 2008 [63]
Rhizoctonia solani rice UPLC-QTOF-MS 2017 [64]; 2018 [65]
wheat and barley 1H NMR and LC-MS 2019 [72]
rice GC-MS and CE/TOF-MS 2017 [69]; 2016 [71]
soybean GC-MS 2014 [67]
soybean 1 H NMR 2017 [68]
lettuce GC-MS 2019 [66]
FT-ICR/MS and
potato 2012 [70]
GC-EI/MS
Botrytis cinerea tomato LC-MS and GC-MS 2015 [73]
strawberry GC-MS 2019 [74]
Arabidopsis DI-MS 2011 [75]
grape GC-MS 2017 [77]; 2015 [78]
grape 1 H NMR 2012 [76];
Sclerotinia sclerotiorum common bean UPLC-MS and GC-MS 2018 [79]
tomato UPLC-QTOF-MS/MS 2016 [101]
soybean GC-MS 2019 [107]
Colletotrichum lupini lupin LC-MS and GC-MS 2013 [108]
Colletotrichum
sorghum LC-ESI-QTOF-MS 2019 [80]
sublineolum
sorghum UHPLC-QTOF-MS 2019 [81]
GC-MS and
Verticillium dahliae Arabidopsis 2015 [86]
LC-ESI-MS/MS
Arabidopsis 1 H NMR 2018 [87]
Verticillium longisporum Arabidopsis UHPLC-QTOF-MS 2014 [89]
Venturia inaequalis apple GC-MS 2018 [88]
Alternaria solani wild tomato UPLC-QTOF-MS/LC-MS 2017 [90]
Alternaria brassicicola Arabidopsis GC-MS 2012 [109]
Gymnosporangium
Rosaceae plants GC-MS 2016 [91]
asiaticum
Cercospora beticola sugar beet (U)HPLC-UV-ESI-MS 2016 [92]
Plectosphaerella
Arabidopsis UPLC-QTOF-MS/MS 2016 [93]
cucumerina
LC-ESI-MS and
Aspergillus oryzae soybean 2014 [94]
GC-TOF-MS
Penicillium digitatum citrus GC–MS 2018 [95]
UHLC-MS/MS and
Zymoseptoria tritici wheat 2015 [96]
GC-MS
Stagonospora nodorum wheat GC-MS and ESI-MS/MS 2009 [82]
Alternaria alternata jujube fruit UPLC-QTOF-MS/MS 2019 [97]
4. Prospects and Challenges
Metabolomics is still under rapid development. In the past decade, with the rapid development of
analytical techniques, significant progress in metabolomics research has been made in determining theMetabolites 2019, 9, 169 13 of 19
interactions between phytopathogenic fungal pathogens and their hosts. Information obtained from
the metabolomics data is important for uncovering fungal infection mechanisms and plant defense
mechanisms, which could be helpful for finding new targets for fungicide development and finding
useful resistant genes for crop breeding.
There are still great challenges for metabolomics research in plant pathogenic fungi. Firstly,
metabolomics needs to be coordinated with research on plant pathogenic fungi. For example, there are
a lack of standard methods for quenching and extracting metabolites. Regarding the methodological
study of technology platform integration, the complexity of biological samples poses higher demands
for the sensitivity, resolution, dynamic range, and throughput of analytical techniques. In addition,
the structural analysis of metabolites is a key step and difficult issue in metabolomics research.
At present, there are also a lack of databases like GC-MS to aid in qualitative analyses. In theory,
LC-MS-NMR can provide better structural information, but it cannot be widely used due to its
complicated instruments, cumbersome operation, lack of sensitivity, low throughput, and high
cost. Issues such as the construction of well-established metabolomics databases and standardized
metabolomics research steps for plant pathogenic fungi have received increasing attention.
Secondly, fungus–plant interactions are very complex cascade processes, both in fungus infection
processes and in plant defense responses as well as in fungus–plant communications. The final
plant manifestation of disease resistance or disease susceptibility depends on the characteristics of
both the plants and fungi involved. Metabolomics can be used to identify the antifungal substances
produced by fungi in plants, to understand the physiological and biochemical processes of plants,
and to detect the changes in certain key metabolites over time. More research is required to fully
and accurately evaluate interaction-related metabolites and determine their functions. At present,
fungal metabolomics research only focuses on the metabolites themselves and ignores their sources.
For example, glucose from host and microbial metabolism is chemically and structurally identical,
but the biological significance and related metabolic pathways of these types of metabolism lead to
different regulatory pathways of glucose from these sources. In addition, confirmatory studies of the
identified key metabolites are urgently needed. The potential biomarkers and metabolic pathways
revealed in the metabolomics studies also require validation by independent biological studies.
Thirdly, multi-level omics data using integrated high-throughput technology, such as
transcriptomics, proteomics, microbiomics, and metabolomics can help to identify new metabolites
and major metabolic pathways in fungal pathogen–plant interactions. Combinations at different
levels, such as gene expression and regulation as well as protein synthesis and expression, can help to
elucidate biological processes that control metabolite levels and further identify relevant biomarkers.
This will facilitate the analysis of the molecular mechanisms of plant responses to pathogenic fungal
stress at a holistic level and accelerate the pace of biological research and agricultural applications.
However, scientific research on the multiple platforms that comprehensively utilize systems biology
is still scarce. Extensive research is required to make full use of metabolomics in the study of plant
pathogenic fungi and to promote the prevention and control of crop fungal diseases.
Author Contributions: F.C. and X.-L.C. conceived and designed the ideas presented in the article; R.M. assisted
in the literature and participated in the writing; F.C. and X.-L.C. wrote the manuscript. All authors supervised
the study.
Funding: All the authors gratefully acknowledge the support for this research by the National Natural Science
Foundation of China (31600240).
Conflicts of Interest: The authors declare no conflict of interest.
References
1. Oliver, S.G.; Winson, M.K.; Kell, D.B.; Baganz, F. Systematic functional analysis of the yeast genome.
Trends Biotechnol. 1998, 16, 373–378. [CrossRef]Metabolites 2019, 9, 169 14 of 19
2. Nicholson, J.K.; Lindon, J.C.; Holmes, E. ‘Metabonomics’: Understanding the metabolic responses of living
systems to pathophysiological stimuli via multivariate statistical analysis of biological NMR spectroscopic
data. Xenobiotica 1999, 29, 1181–1189. [CrossRef] [PubMed]
3. Fiehn, O. Combining genomics, metabolome analysis, and biochemical modelling to understand metabolic
networks. Comp. Funct. Genom. 2001, 2, 14. [CrossRef] [PubMed]
4. Heuberger, A.L.; Robison, F.M.; Lyons, S.M.; Broeckling, C.D.; Prenni, J.E. Evaluating plant immunity using
mass spectrometry-based metabolomics workflows. Front. Plant Sci. 2014, 5, 291. [CrossRef] [PubMed]
5. Baidoo, E.E.K. Microbial Metabolomics: A General Overview. Methods Mol. Biol. 2019, 1859, 1–8. [CrossRef]
[PubMed]
6. Merlo, M.E.; Jankevics, A.; Takano, E.; Breitling, R. Exploring the metabolic state of microorganisms using
metabolomics. Bioanalysis 2011, 3, 2443–2458. [CrossRef] [PubMed]
7. Nielsen, K.F.; Larsen, T.O. The importance of mass spectrometric dereplication in fungal secondary metabolite
analysis. Front. Microbiol. 2015, 6, 71. [CrossRef] [PubMed]
8. Ning, L.; Yi, P.S.; Tang, H.; Wang, Y. Recent developments in sample preparation and data pre-treatment in
metabonomics research. Arch. Biochem. Biophys. 2016, 589, 4–9. [CrossRef]
9. Roessner, U.; Wagner, C.; Kopka, J.; Trethewey, R.N.; Willmitzer, L. Technical advance: Simultaneous
analysis of metabolites in potato tuber by gas chromatography-mass spectrometry. Plant J. 2010, 23, 131–142.
[CrossRef]
10. Werf, M.J.V.D.; Jellema, R.H.; Hankemeier, T. Microbial metabolomics: Replacing trial-and-error by the
unbiased selection and ranking of targets. J. Ind. Microbiol. Biotechnol. 2005, 32, 234–252. [CrossRef]
11. Vuckovic, D. Current trends and challenges in sample preparation for global metabolomics using liquid
chromatography–mass spectrometry. Anal. Bioanal. Chem. 2012, 403, 1523–1548. [CrossRef] [PubMed]
12. Chen, F.F.; Zhang, J.T.; Song, X.S.; Yang, J.; Li, H.P.; Tang, H.R.; Liao, Y.C. Combined metabonomic and
quantitative real-time PCR analyses reveal systems metabolic changes of Fusarium graminearum induced by
tri5 gene deletion. J. Proteome Res. 2011, 10, 2273–2285. [CrossRef] [PubMed]
13. Kuhara, T.; Ohse, M.; Inoue, Y.; Cooper, A.J. A GC/MS-based metabolomic approach for diagnosing citrin
deficiency. Anal. Bioanal. Chem. 2011, 400, 1881–1894. [CrossRef] [PubMed]
14. Halket, J.M.; Waterman, D.; Przyborowska, A.M.; Patel, R.K.; Fraser, P.D.; Bramley, P.M. Chemical
derivatization and mass spectral libraries in metabolic profiling by GC/MS and LC/MS/MS. J. Exp. Bot. 2005,
56, 219. [CrossRef] [PubMed]
15. Simo, C.; Ibanez, C.; Gomez-Martinez, A.; Ferragut, J.A.; Cifuentes, A. Is metabolomics reachable? Different
purification strategies of human colon cancer cells provide different ce-ms metabolite profiles. Electrophoresis
2011, 32, 1765–1777. [CrossRef] [PubMed]
16. Perrett, D.; Ross, G. Capillary electrophoresis: A powerful tool for biomedical analysis and research?
TrAC Trends Anal. Chem. 1992, 11, 156–163. [CrossRef]
17. Johnson, H.E.; Broadhurst, D.; Goodacre, R.; Smith, A.R. Metabolic fingerprinting of salt-stressed tomatoes.
Phytochemistry 2003, 62, 919–928. [CrossRef]
18. Water, N.J.; Holmes, E.; Williams, A.; Waterfield, N.J.; Farrant, R.D.; Nicholson, J.K. NMR and pattern
recognition studies on the time-related metabolic effects of α-Naphthylisothiocyanate on liver, urine, and
plasma in the rat: An integrative metabonomic approach. Chem. Res. Toxicol. 2001, 14, 1401–1412. [CrossRef]
19. Goodacre, R. Metabolomics of a Superorganism. J. Nutr. 2007, 137, 259S. [CrossRef]
20. Arjen, L. Metalign: Interface-driven, versatile metabolomics tool for hyphenated full-scan mass spectrometry
data preprocessing. Anal. Chem. 2009, 81, 3079–3086. [CrossRef]
21. Pluskal, T.; Castillo, S.; Villar-Briones, A.; Orešič, M. Mzmine 2: Modular framework for processing,
visualizing, and analyzing mass spectrometry-based molecular profile data. BMC Bioinform. 2010, 11, 395.
[CrossRef] [PubMed]
22. Hall, R. Plant metabolomics: The missing link in functional genomics strategies. Plant Cell 2002, 14, 1437–1440.
[CrossRef]
23. Ralf, T.; Patti, G.J.; Duane, R.; Gary, S. XCMS online: A web-based platform to process untargeted metabolomic
data. Anal. Chem. 2012, 84, 5035–5039. [CrossRef]
24. Wei, X.L.; Shi, X.; Kim, S.; Zhang, L.; Patrick, J.S.; Binkley, J.; McClain, C.; Zhang, X. Data preprocessing
method for liquid chromatography-mass spectrometry based metabolomics. Anal. Chem. 2012, 84, 7963–7971.
[CrossRef] [PubMed]Metabolites 2019, 9, 169 15 of 19
25. Broeckling, C.D.; Reddy, I.R.; Duran, A.L.; Xuechun, Z.; Sumner, L.W. Met-idea: Data extraction tool for
mass spectrometry-based metabolomics. Anal. Chem. 2006, 78, 4334–4341. [CrossRef] [PubMed]
26. Duran, A.L.; Jian, Y.; Wang, L.; Sumner, L.W. Metabolomics spectral formatting, alignment and conversion
tools (MSFACTs). Bioinformatics 2003, 19, 2283–2293. [CrossRef] [PubMed]
27. Saito, K.; Dixon, R.A.; Willmitzer, L. Plant metabolomics volume 57 || gas chromatography mass spectrometry.
Biotechnol. Agric. For. 2006, 57, 3–20. [CrossRef]
28. Want, E.J.; Nordström, A.; Morita, H.; Siuzdak, G. From exogenous to endogenous: The inevitable imprint of
mass spectrometry in metabolomics. J. Proteome Res. 2007, 6, 459–468. [CrossRef]
29. Mastrangelo, A.; Ferrarini, A.; Rey-Stolle, F.; García, A.; Barbas, C. From sample treatment to biomarker
discovery: A tutorial for untargeted metabolomics based on GC-(EI)-Q-MS. Anal. Chim. Acta 2015, 900,
21–35. [CrossRef] [PubMed]
30. Taylor, J.; King, R.D.; Altmann, T.; Fiehn, O. Application of metabolomics to plant genotype discrimination
using statistics and machine learning. Bioinformatics 2002, 18 (Suppl. S2), S241–S248. [CrossRef]
31. Fukusaki, E.; Kobayashi, A. Plant metabolomics: Potential for practical operation. J. Biosci. Bioeng. 2005, 100,
347–354. [CrossRef] [PubMed]
32. Duan, Y.X.; An, Y.P.; Li, N.; Liu, B.F.; Wang, Y.L.; Tang, H.R. Multiple univariate data analysis reveals the
inulin effects on the high-fat-diet induced metabolic alterations in rat myocardium and testicles in the
preobesity state. J. Proteome R. 2013, 12, 3480–3495. [CrossRef] [PubMed]
33. Guo, A.M.; Ram, K.; Wishart, D.S. ECMDB: The E. coli metabolome database. Nucleic Acids Res. 2013, 41,
D625–D630. [CrossRef] [PubMed]
34. Shifrin, V.I.; Anderson, P. Trichothecene mycotoxins trigger a ribotoxic stress response that activates c-Jun
N-terminal kinase and p38 mitogen-activated protein kinase and induces apoptosis. J. Biol. Chem. 1999, 274,
13985–13992. [CrossRef] [PubMed]
35. Li, F.Q.; Li, Y.W.; Luo, X.Y.; Yoshizawa, T. Fusarium toxins in wheat from an area in henan province, pr china,
with a previous human red mould intoxication episode. Food Addit. Contam. 2002, 19, 163–167. [CrossRef]
[PubMed]
36. Song, X.S.; Xing, S.; Li, H.P.; Zhang, J.B.; Qu, B.; Jiang, J.H.; Fan, C.; Yang, P.; Liu, J.L.; Hu, Z.Q. An antibody
that confers plant disease resistance targets a membrane-bound glyoxal oxidase in fusarium. New Phytol.
2016, 210, 997–1010. [CrossRef] [PubMed]
37. Chen, X.L.; Wang, Z.; Liu, C. Roles of peroxisomes in the rice blast fungus. BioMed Res. Int. 2016, 2016,
9343417. [CrossRef] [PubMed]
38. Nakabayashi, R.; Saito, K. Integrated metabolomics for abiotic stress responses in plants. Curr. Opin. Plant Biol.
2015, 24, 10–16. [CrossRef] [PubMed]
39. Feussner, I.; Polle, A. What the transcriptome does not tell - proteomics and metabolomics are closer to the
plants’ patho-phenotype. Curr. Opin. Plant Biol. 2015, 26, 26–31. [CrossRef]
40. Tan, K.C.; Ipcho, S.V.; Trengove, R.D.; Oliver, R.P.; Solomon, P.S. Assessing the impact of transcriptomics,
proteomics and metabolomics on fungal phytopathology. Mol. Plant Pathol. 2010, 10, 703–715. [CrossRef]
41. Smith, L.L. Key challenges for toxicologists in the 21st century. Trends Pharmacol. Sci. 2001, 22, 281–285.
[CrossRef]
42. Tang, H.R.; Wang, Y.L. Metabonomics: A Revolution in Progress. Prog. Biochem. Biophys. 2006, 33, 401–417.
[CrossRef]
43. David, P.; Manfred, B.; Enot, D.P.; Overy, D.P.; Zaira Caracuel, R.; Martin, G.; Nicholas, T.; John, D. Rice
blast infection of Brachypodium distachyon as a model system to study dynamic host/pathogen interactions.
Nat. Protoc. 2008, 3, 435–445. [CrossRef]
44. Chen, F.F.; Liu, X.; Zhang, J.T.; FLei, H.H.; Li, H.P.; Tang, H.R.; Liao, Y.C. Combined metabonomic and
quantitative rt-pcr analyses revealed metabolic reprogramming associated with Fusarium graminearum
resistance in transgenic Arabidopsis thaliana. Front. Plant Sci. 2018, 8, 2177. [CrossRef] [PubMed]
45. Allwood, J.W.; Ellis, D.I.; Goodacre, R. Metabolomic technologies and their application to the study of plants
and plant-host interactions. Physiol. Plantarum. 2010, 132, 117–135. [CrossRef] [PubMed]
46. Bai, G.; Shaner, G. Management and resistance in wheat and barley to fusarium head blight. Annu. Rev.
Phytopathol. 2004, 42, 135–161. [CrossRef]You can also read