Differential Gene Expression with an Emphasis on Floral Organ Size Differences in Natural and Synthetic Polyploids of Nicotiana tabacum ...
←
→
Page content transcription
If your browser does not render page correctly, please read the page content below
G C A T
T A C G
G C A T
           genes
Article
Differential Gene Expression with an Emphasis on
Floral Organ Size Differences in Natural and Synthetic
Polyploids of Nicotiana tabacum (Solanaceae)
Jacob B. Landis 1,2, * , Amelda Kurti 1 , Amber J. Lawhorn 1 , Amy Litt 1 and
Elizabeth W. McCarthy 1,3, *
 1   Department of Botany and Plant Sciences, University of California Riverside, Riverside, CA 92521, USA;
     ameldakurti@gmail.com (A.K.); alawh002@ucr.edu (A.J.L.); amy.litt@ucr.edu (A.L.)
 2   School of Integrative Plant Science, Section of Plant Biology and the L.H. Bailey Hortorium,
     Cornell University, Ithaca, NY 14853, USA
 3   Department of Biology, SUNY Cortland, Cortland, NY 13045, USA
 *   Correspondence: jbl256@cornell.edu (J.B.L.); elizabeth.mccarthy@cortland.edu (E.W.M.)

 Received: 25 August 2020; Accepted: 16 September 2020; Published: 19 September 2020

 Abstract: Floral organ size, especially the size of the corolla, plays an important role in plant
 reproduction by facilitating pollination efficiency. Previous studies have outlined a hypothesized
 organ size pathway. However, the expression and function of many of the genes in the pathway
 have only been investigated in model diploid species; therefore, it is unknown how these genes
 interact in polyploid species. Although correlations between ploidy and cell size have been shown
 in many systems, it is unclear whether there is a difference in cell size between naturally occurring
 and synthetic polyploids. To address these questions comparing floral organ size and cell size across
 ploidy, we use natural and synthetic polyploids of Nicotiana tabacum (Solanaceae) as well as their
 known diploid progenitors. We employ a comparative transcriptomics approach to perform analyses
 of differential gene expression, focusing on candidate genes that may be involved in floral organ
 size, both across developmental stages and across accessions. We see differential expression of
 several known floral organ candidate genes including ARF2, BIG BROTHER, and GASA/GAST1.
 Results from linear models show that ploidy, cell width, and cell number positively influence corolla
 tube circumference; however, the effect of cell width varies by ploidy, and diploids have a significantly
 steeper slope than both natural and synthetic polyploids. These results demonstrate that polyploids
 have wider cells and that polyploidy significantly increases corolla tube circumference.

 Keywords: Nanopore; GASA; BIG BROTHER; flower size; cell size; RNA-Seq

1. Introduction
     Organ growth is highly regulated, controlled by both intrinsic and extrinsic factors [1]. Organ size
is controlled by either cell growth or cell proliferation, with the combination of the two often being the
highest contributor [2]. Cell proliferation occurs early in development followed by cell expansion [3,4],
with an indication that cell division and organ growth are to a certain degree independent processes [5].
However, a few studies have shown a co-regulation of cell division and expansion, albeit with different
genetic pathways [6–8]. The relative contribution of each phase is variable among species [9,10],
likely contributing to different mating systems and pollinator syndromes [11–14]. Flower size has
important ecological implications such as pollinator visitation and pollination success [15–17] in wild
and domesticated plants (as reviewed in [18]). Across angiosperms, closely related species have similar
floral architecture in general, yet the size and shape can be highly labile and highly heritable [19].

Genes 2020, 11, 1097; doi:10.3390/genes11091097                                   www.mdpi.com/journal/genes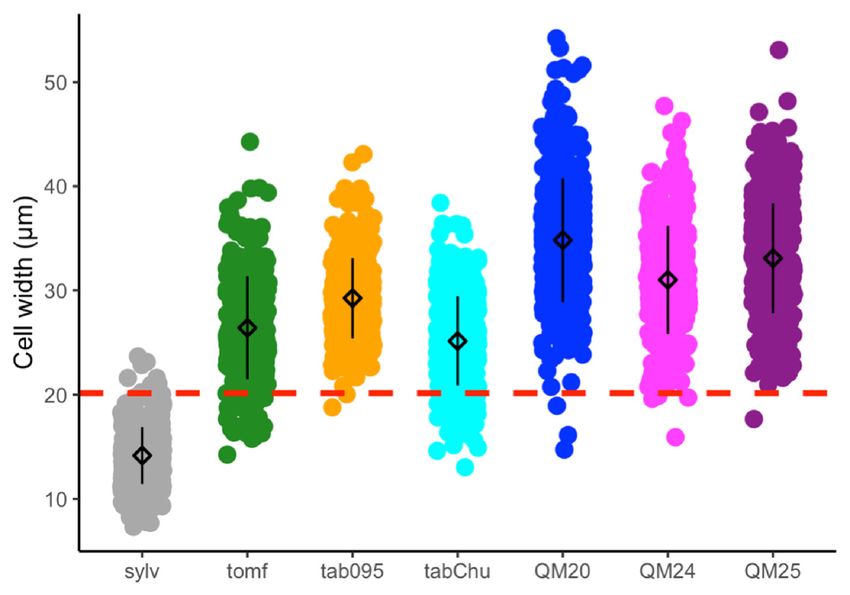
Genes 2020, 11, 1097                                                                                    2 of 24

      The genetic components governing cell number, size, and shape in floral organs are not well
understood [20,21] though a hypothesized pathway has been described previously [2,18,22]. Candidate
genes have been identified in model organisms (i.e., Arabidopsis thaliana, Antirrhinum majus, and Petunia
hybrida) associated with organ size including GA-stimulated transcript GASA/GAST1/GEG [23–25],
BIG BROTHER (BB; [26]), BIG PETAL (BPE; [27]), LONGIFOLIA (LNG; [28]), ANGUSTIFOLIA
(AN; [29]), ARGOS [30,31], AINTEGUMENTA (ANT; [32,33]), AUXIN RESPONSE FACTOR2 (ARF2; [34]),
KLUH [35], EBP1 [36], DA1/DAR1 [37,38], RAMOSA1 (Ra1; [39]), BIGGER ORGANS (BIO; [40]),
and ELEPHANT-EAR-LIKE LEAF1 (ELE1; [40]). The majority of candidate genes have been shown to
be promoters or activators of elongation (GASA/GAST1/GEG, LNG, AN, ARGOS, ANT, KLUH, and Ra1)
or promoters of cell proliferation (ARF2). Others have been shown to be repressors or inhibitors of
growth (BB, BPE, BIO, and ELE1) or cell division (DA1/DAR1). Even though the prevalence of floral
based transcriptomic studies has increased in recent years [41–45], only a limited number of studies
have focused on genes associated with flower size differences in non-model taxa including studies in
Annona [46], Chrysanthemum [47], Lithospermum [48], Populus [49], and Saltugilia [50].
      Polyploidy, or whole genome duplication, is prevalent across the history of land plants [51] and is
associated with increased diversification in the angiosperms [52] and in smaller clades of ferns [53].
Following polyploidy events, functionally important genes, such as those allowing for rapid adaptation
to environmental change, are often preferentially retained [54], promoting species diversification
through ecological niche shifts [55,56]. There is a strong positive correlation between genome size and
cell size [57–61], yet the relationship is not consistent in all cell types [62]. Increases in the cell size of
polyploids compared to diploids has been observed [63–65], and endoreduplication within a single
individual often yields larger cells [66–70]. Genome size has been shown to be a crucial component in
determining the minimum size of the cell and represents the upper limit for cell packing densities,
which is crucial for carbon assimilation and important in resource allocation for growth, reproduction,
and defense [61,71].
      While natural polyploids have been used to investigate evolutionary and ecological questions
including ecological niche differentiation, defense against herbivores, and stress tolerance [72–77],
the production of synthetic allopolyploids allows for the study of traits instantaneously after genome
merger. Many recent papers have used synthetic polyploids to study functional traits and inflorescence
morphology in a variety of species [78–83]. By comparing natural and synthetic polyploids,
the immediate consequences of polyploidy can be disentangled from the changes that occur via
subsequent evolution following whole genome duplication.
      Nicotiana is an excellent system to study polyploidy because approximately half of the species are
allotetraploids which arose via six polyploidy events [84–90]. Polyploids of different ages, along with
available synthetic lines created from the same progenitor species as natural polyploids, allow for
investigation into the consequences of immediate, short-term, and long-term polyploid evolution.
In addition, Nicotiana displays wide variation in corolla tube length and width [91]. Young Nicotiana
polyploids ( 1 myo) do not show any trends in corolla tube size evolution [90].
      Within the broader Solanaceae, the breeding system appears to have the largest impact on
diversification patterns [92]. However, increased speciation is associated with older polyploid events
compared to younger polyploid clades in Nicotiana [87], and diversification in Petunia (Solanaceae)
is largely driven by flower size, with flower size directly influencing pollinator system [93–95].
The disconnect between diversification patterns at the family level and at the genus level provides
additional support for studying comparative biology in model clades to gain a deeper understanding
of underlying mechanisms [96,97].
      Most studies investigating the genetics of flower size have focused on model organisms. There is
a large gap in our understanding across the angiosperm tree of life in terms of which genes are
responsible for observed differences in floral size and if any clade specific patterns exist. Here, we use
Genes 2020, 11, x FOR PEER REVIEW 3 of 24
Most studies investigating the genetics of flower size have focused on model organisms. There
is a large gap in our understanding across the angiosperm tree of life in terms of which genes
Genes 2020, 11, 1097
are
3 of 24
responsible for observed differences in floral size and if any clade specific patterns exist. Here, we
use Nicotiana polyploids and their progenitors to address the following questions related to changes
Nicotiana
in polyploids
floral organ andincreases
size. Are their progenitors to address
in tube width the following
of polyploids due to questions
increased related to changes
cell width compared in
floral organ size. Are increases in tube width of polyploids due to increased
to their diploid progenitors? Do the natural and synthetic polyploids of N. tabacum show similar cell width compared
to their diploid
patterns progenitors?
of differential Do the natural
gene expression, and synthetic
both within and amongpolyploids of N. tabacum
taxa at specific show similar
developmental time
patternsDo
points? of differential
any of the geneknown expression,
floral sizeboth within genes
candidate and among
show taxa at specific
differential developmental
expression? Do wetimesee
points? Do any of the known floral size candidate genes show differential expression?
clear associations between organ size genes, overall flower size, and changes in cell size? The analyses Do we see
clear associations
presented here will between
advanceorgan
oursize genes, overall
understanding of flower size, and changes
floral evolution in cell
after whole size? The
genome analyses
duplication
presented
and here will advance
the association of genome oursize
understanding
and cell size ofinfloral
floralevolution
tissue whileafter whole
also genome
providing anduplication
additional
and the association
comparison of genome
to determine if knownsizecandidate
and cell size
genesinimpacting
floral tissue while
floral alsosize
organ providing an additional
show similar patterns
comparison
of differential toexpression
determine to if known candidate
previously genes impacting
investigated taxa. floral organ size show similar patterns
of differential expression to previously investigated taxa.
2. Material and Methods
2. Material and Methods
2.1. Plant Material
2.1. Plant Material
Plant material was grown in greenhouses with natural sunlight and temperatures between 10
Plant material was grown in greenhouses with natural sunlight and temperatures between 10 and
and◦ 30 °C at the University of California, Riverside. The following accessions were used: Nicotiana
30 C at the University of California, Riverside. The following accessions were used: Nicotiana sylvestris
sylvestris A04750326 (Radboud University, Nijmegen, The Netherlands); N. tomentosiformis BRNO
A04750326 (Radboud University, Nijmegen, The Netherlands); N. tomentosiformis BRNO 4103 (acquired
4103 (acquired from A. Kovařík, Brno, Czech Republic); N. tabacum 095‐55 (IPK Gatersleben,
from A. Kovařík, Brno, Czech Republic); N. tabacum 095-55 (IPK Gatersleben, Germany); N. tabacum
Germany); N. tabacum ‘Chulumani’ (collected in the field in Bolivia by S. Knapp); and three first‐
‘Chulumani’ (collected in the field in Bolivia by S. Knapp); and three first-generation synthetic lines,
generation synthetic lines, QM20, QM24, and QM25 (created by K.Y. Lim at Queen Mary, University
QM20, QM24, and QM25 (created by K.Y. Lim at Queen Mary, University of London by crossing
of London by crossing 4x autotetraploid N. sylvestris and 4x autotetraploid N. tomentosiformis; Figure
4x autotetraploid N. sylvestris and 4x autotetraploid N. tomentosiformis; Figure 1). Because multiple
1). Because multiple accessions of N. tabacum were used throughout the study, we will refer to plant
accessions
lines of N. tabacum were used throughout the study, we will refer to plant lines as accessions.
as accessions.
sylv x diploid
tomf progenitors
tab095 natural
tabChu polyploids
QM20
QM24 synthetic
polyploids
QM25
5 cm
Figure
Figure 1.
1. Floral
Floralmorphology
morphologyofofdiploid
diploidprogenitors
progenitorsN.N. sylvestris
sylvestrisand
and N.N.
tomentosiformis,
tomentosiformis, two natural
two N.
natural
tabacum accessions
N. tabacum (095‐55
accessions andand
(095-55 ‘Chulumani’), andand
‘Chulumani’), three synthetic
three N. tabacum
synthetic lineslines
N. tabacum (QM20, QM24,
(QM20, and
QM24,
QM25): all accessions pictured here are included in the cell size data set, whereas all accessions
and QM25): all accessions pictured here are included in the cell size data set, whereas all accessions except
QM20
except were
QM20usedwereinused
the transcriptome analyses.
in the transcriptome Sylv = N.
analyses. Sylvsylvestris, tomf = N.
= N. sylvestris, tomf tomentosiformis, tab095
= N. tomentosiformis,
=tab095
N. tabacum 095‐55, tabChu = N. tabacum ‘Chulumani’, QM20 = synthetic N. tabacum
= N. tabacum 095-55, tabChu = N. tabacum ‘Chulumani’, QM20 = synthetic N. tabacum QM20, QM20, QM24 =
synthetic N. tabacum
QM24 = synthetic N.QM24,
tabacumand QM25
QM24, and= synthetic N. tabacum
QM25 = synthetic N.QM25.
tabacum QM25.
2.2. Flower Size and Cell Size
To measure differences in cell size and cell number, we stained fresh corolla tissue at anthesis in
0.1% aniline blue in 1N K3 PO4 for 2 h. We collected the tissue from one half of the mouth of the corolla
tube, just below the floral limb (Figure S1). Stained tissues were mounted on microscope slides and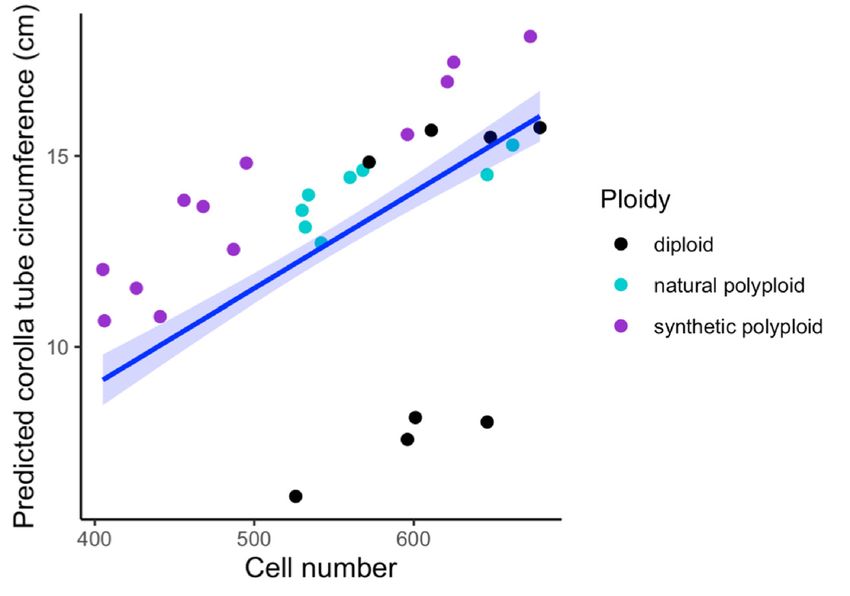
Genes 2020, 11, 1097                                                                                  4 of 24

imaged on a Leica DM5500 B fluorescent microscope with the DAPI filter using tiling to create a mosaic
image of the entire tissue. We measured corolla tube circumference using Fiji [98] with the length of the
mounted tissue just below the floral limb (Figure S1) serving as a proxy for corolla tube width. Number
of cells was also counted, and the width of 100 consecutive cells were measured, starting at the dorsal
side of the flower. We used four flowers each from N. sylvestris; N. tomentosiformis; N. tabacum 095-55;
N. tabacum ‘Chulumani’; and the synthetic N. tabacum lines QM20, QM24, and QM25.
     To determine if differences in cell size, cell number, and ploidy influence the corolla tube
circumference at the corolla mouth, we ran a Linear Model in R [99] using cell number, average
cell width, and ploidy as predictor variables. To investigate which factors were significant in the
model, we started by including two-way interactions and compared the fit of this model to that
of models with a single factor removed using the drop1 function in the lmerTest package (version
3.0.1; [100]). We chose a reduced model (corolla tube circumference~width + ploidy + width:ploidy
+ cell number) in which all factors included had a significant effect on corolla tube circumference
and only removed factors that did not alter the fit of the model. We checked the assumptions of
normality and constant variance, and the data were appropriate. We used our chosen model to predict
corolla tube circumference using the full range of cell width and cell number values in the dataset
and calculated 95% confidence intervals (mean ± 2SE). We used the car::anova function to determine
whether model variables significantly affected corolla tube circumference and also performed post
hoc pairwise comparisons using the lsmeans function [101] to investigate the significant interaction
between ploidy and cell width. In these pairwise analyses, we compared the corolla tube circumference
of diploids, natural polyploids, and synthetic polyploids as predicted by our best model at minimum,
1st quartile, median, 3rd quartile, and maximum cell width values. We ran linear models to determine
whether ploidy affects both cell width and cell number (width~ploidy and cell number~ploidy) and
performed ANOVAs using the aov function with post hoc Tukey tests (α = 0.05) to determine whether
diploids, natural polyploids, or synthetic polyploids had significantly different cell widths and cell
numbers. We plotted the predicted data based on the continuous effects in R using the geom_smooth
function in ggplot2 (version 3.0.0; [102]). We plotted the discrete effects as strip plots and plotted strip
plots for cell width, cell number, and corolla tube circumference for all accessions. R scripts were
uploaded to GitHub (https://github.com/elizabethwmccarthy/).

2.3. Transcriptome Sequencing and Analyses
      Flower material from three developmental time points (60%, 85%, and 95% mean corolla length at
anthesis including the floral limb, the part of the flower that opens, mean calculated from a minimum
of five flowers per accession) from three biological replicates was flash frozen in liquid nitrogen for six
taxa: N. sylvestris, N. tomentosiformis, N. tabacum 095-55, N. tabacum ‘Chulumani’, synthetic N. tabacum
QM24, and synthetic N. tabacum QM25. Due to lack of material, only two biological replicates for
N. tomentosiformis at 85% and QM25 at 95% were collected. The RNeasy Mini Plant Kit (Qiagen, Hilden,
Germany) was used for RNA extraction, followed by DNase treatment using the Turbo-DNase Kit
(Ambion, Vilnius, Lithuania). Strand-specific libraries were constructed from mRNA as previously
described by [103] and sequenced on an Illumina HiSeq2500 (Illumina, San Diego, CA, USA) with
1 × 85 bp reads. Raw reads were processed using TrimGalore (version 0.4.2; [104]) to remove adapters
and filter with a minimum quality score of 30 and a minimum length of 60 bp.
      Oxford Nanopore minION long reads were sequenced for stages 60% and 95% for both progenitor
species. A total of 100 ng of total RNA was used as input for the cDNA-PCR Barcoding library kit
(SQK-PCS109 with SQK-PBK004 barcodes). Four barcoded libraries were pooled with equal volumes.
The loaded flowcell was run for 48 h, generating 5.86 million reads and 6.56 GB of raw data, followed by
flushing (kit EXP-WSH003) and loading the remaining library for another 24 h, generating an additional
588 thousand reads and 656 MB of data. Fastq files were called from the produced fast5 files using guppy
(version 3.4.1; Oxford Nanopore) with a minimum quality score of 7. Fastq reads were demultiplexed
using porechop (version 0.2.4; https://github.com/rrwick/Porechop) and error corrected using FMLRC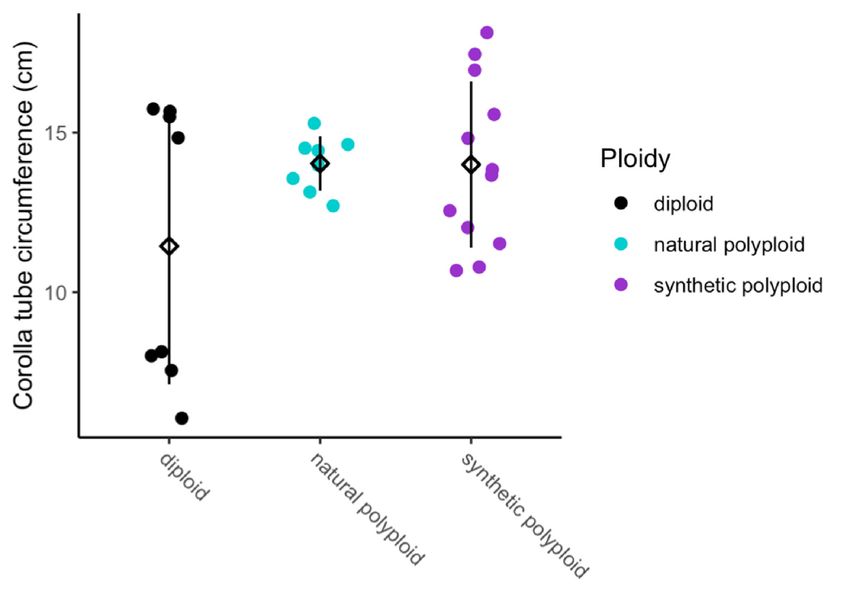
Genes 2020, 11, 1097                                                                                5 of 24

(version 1.0.0; [105]) by first building an index using the cffq function in MSBWT (version 0.3.0; [106])
from the Illumina sequencing reads. FMLRC has been shown to outperform other error correction
approaches [107,108]. The resulting corrected reads were filtered with seqkit (version 0.12.0; [109]) to
keep reads larger than 800 bp. Accession numbers to the Sequencing Read Archive for each accession
are provided in Table S1.
      A de novo transcriptome representing N. tabacum was necessary to map individual reads to
characterize expression patterns because previous attempts to investigate differential gene expression
using the reference genomes [110,111] resulted in a large number of unmapped reads. To minimize
homeolog bias during assembly, a species level assembly for both N. sylvestris and N. tomentosiformis
were merged in silico to represent N. tabacum. Multiple approaches were undertaken to find the most
suitable combination of programs and reads to generate the most complete assemblies in terms of
number of contigs, N50, and percent of Solanales Benchmarking Universal Single-Copy Orthologs
(BUSCO; version 3.0.2; [112]). Assemblies were carried out with SPAdes (version 3.13.1; [113]),
Trinity (version 2.8.4; [114,115]), and TransAbyss (version 2.2.1; [116]). Default parameters for SPAdes
were employed. For TransAbyss, a kmer of 64 was used. Default parameters were used for Trinity with
the exception of requiring a minimum contig length of 250 bp. Trinity and TransAbyss assemblies were
done on the high-performance computing cluster at the University of California, Riverside, while the
SPAdes assemblies were done on the CUPAC (Cornell University Plant Anatomy Collection) server.
Additional Illumina data from previous studies were downloaded from the European Nucleotide
Archive (ENA; Table S1) and processed with TrimGalore with a minimum quality of 30 and minimum
length of 75 bp. Cleaned reads from each accession were normalized to 100× coverage using the
BBNorm function in BBTools (version 38.16; http://jgi.doe.gov/data-and-tools/bbtools). The different
combinations of data and programs were as follows: (1) SPAdes Illumina data, (2) SPAdes Illumina +
ENA + Nanopore, (3) SPAdes ENA + Nanopore, (4) Trinity Illumina, (5) Trinity ENA + Nanopore,
and (6) TransAbyss ENA + Nanopore. Assembly quality was estimated by calculating N50 and N90
values using the R package CNEr (version 1.18.1; [117]) after removing contigs smaller than 250 bp
using seqkit (version 0.12.0). The percent of BUSCO genes in each assembly was determined using
the Solanales library (solanaceae_odb10) with the transcriptome function. Plots were made in R
(version 3.6.0; [99]) using the generate_plot.py script.
      Filtered assemblies for N. sylvestris and N. tomentosiformis using ENA and Nanopore data were
annotated using Trinotate [118] and TransDecoder (version 5.0.2; [115]). The assembly fasta file
was prepped for alignment using RSEM (version 1.3.0; [119]) and bowtie2 (version 2.3.4.1; [120]).
Contigs were compared to the SwissProt database with ncbi-blast (version 2.7.1+; [121] using BLASTX
and BLASTP. The translated peptide assemblies were analyzed with OrthoVenn2 [122] to compare the
number of overlapping proteins and the unique proteins in each species.
      Differential gene expression was determined using limma (version 3.40.6; [123]) and Trimmed
Mean of M values (TMM) normalization. Two sets of analyses were performed: one comparing 60%,
85%, and 95% of anthesis length developmental stages within a taxon and one comparing taxa at
each developmental stage. The resulting BAM files were sorted and indexed using samtools (version
1.9; [124]) and visualized in IGV (version 2.5.3; [125–127]) to check for quality of mapping to candidate
genes. Candidate genes were identified via the Trinotate annotation file. For known genes that were
not annotated, we used a local BLAST (version 2.2.31) analysis using the TransDecoder CDS file with a
minimum cutoff of length 50 bp and minimum e-value 1.0 × 10⁻²⁰ . Plots were generated to visualize
differentially expressed genes using ggplot2. We plotted the log2 fold change of differentially expressed
genes for each pairwise comparison using violin plots to represent all differentially expressed genes and
overlaid strip plots representing the TMM differentially expressed values of organ size genes of interest.
Clustering of differentially expressed transcripts was done in the Trinity pipeline with supplied perl
scripts using hierarchical clustering of FPKM (Fragments Per Kilobase Million) expression values.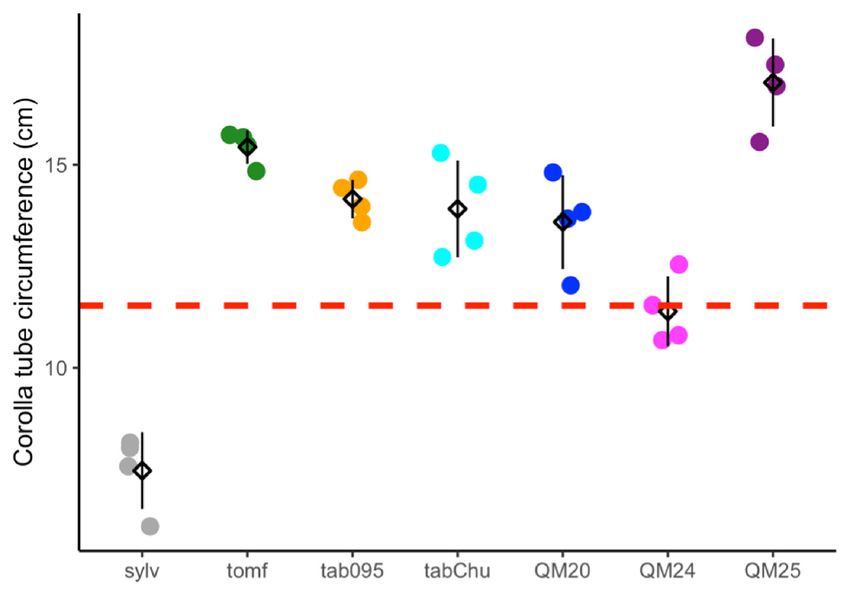
Genes 2020, 11, 1097 6 of 24
3. Results
3.1. Cell width, Cell Number, and Ploidy Positively Influence Corolla Tube Circumference
Based on previous studies showing wider corolla tubes in allopolyploids than expected [90,91],
we tested the hypothesis that increases in tube width are due to increased cell width in polyploids.
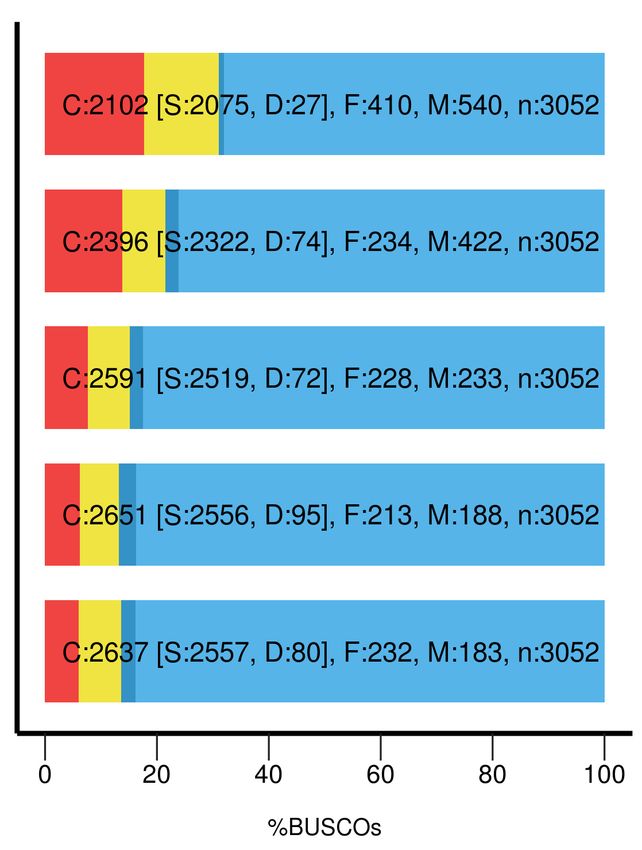
Cell size, cell number, and corolla tube circumference vary across accessions (Figure 2A–C).
Ploidy positively influences cell width (F2,25 = 23.67, p = 1.71 × 10⁻⁶ ), natural polyploids have
significantly wider cells than diploids (TukeyHSD, p = 0.006), and synthetic polyploids have significantly
wider cells than both diploids (TukeyHSD, p = 1 × 10⁻⁶ ) and natural polyploids (TukeyHSD, p = 0.012;
Figure 2A and Table 1). Ploidy also affects cell number (F2,25 = 4.892, p = 0.016), and synthetic polyploids
have significantly fewer cells than diploids and natural polyploids (TukeyHSD, p = 0.015; Figure 2B
and Table 2). We found that cell width (F1,21 = 181.47, p = 4.39 × 10⁻¹⁴ ), cell number (F1,21 = 240.12,
p = 5.74 × 10⁻¹³ ), and ploidy (F2,21 = 6.56, p = 0.0061) all have a significant positive effect on corolla tube
circumference by using a linear model (Figure 2D–F and Table 3; Table 4). Additionally, the interaction
between cell width and ploidy is significant (F2,21 = 7.84, p = 0.0029; Table 4). This suggests that
cell number affects corolla tube circumference independent of ploidy, but that the effect of cell width
varies by ploidy. Both natural polyploids and synthetic polyploids have significantly less steep
positive slopes for the effects of cell width on corolla tube circumference than diploids (p = 0.01
and p = 0.005, respectively; Figure 2D and Table 3), which implies that an increase in cell width in
polyploids will not influence corolla tube circumference as much as an increase in cell width in diploids.
However, natural polyploids show a marginal difference and synthetic polyploids have significantly
larger corolla tube circumferences than diploids at 3rd quantile cell width values, and both natural
and synthetic polyploids have a significantly larger corolla tube circumference than diploids at the
maximum cell width value (Table S2). There is no difference in corolla tube circumference between
diploids, natural polyploids, and synthetic polyploids at 1st quartile or median cell width values,
whereas natural polyploids seem to have smaller corolla tube circumferences than diploids at the
minimum cell width value (Table S2). In summary, cell width, ploidy, the interaction of width by
ploidy, and cell number are all crucial for determining corolla tube circumference (Table 4).
Table 1. Linear model results for width~ploidy.
Coefficients Estimate SE t Value p Value Tukey HSD p Value
Intercept 20.29 1.43 14.20 1.8 × 10⁻¹³ diploid-natural polyploid 0.0059
Ploidy-natural polyploid 6.91 2.02 3.42 0.00217 diploid-synthetic polyploid 1.0 × 10⁻⁶
Ploidy-synthetic polyploid 12.67 1.85 6.87 3.37 × 10⁻⁷ natural polyploid-synthetic polyploid 0.012
Table 2. Linear model results for cell number~ploidy.
Coefficients Estimate SE t Value p Value Tukey HSD p Value
Intercept 609.88 25.91 23.53 2 × 10⁻¹⁶ diploid-natural polyploid 0.0059
Ploidy-natural polyploid −38.13 36.65 −1.04 0.30812 diploid-synthetic polyploid 1.0 × 10⁻⁶
Ploidy-synthetic polyploid −101.63 33.45 −3.04 0.00551 natural polyploid-synthetic polyploid 0.012
Table 3. Linear model results for corolla tube circumference~width + ploidy + width: ploidy + cell number.
Coefficients Estimate SE t Value p Value
Intercept −15.47 1.15 −13.47 8.39 × 10⁻¹²
Width 0.57 0.03 17.67 4.39 × 10⁻¹⁴
Ploidy-natural polyploid 6.86 2.48 2.76 0.01164
Ploidy-synthetic polyploid 7.01 2.81 2.50 0.02097
Cell number 0.03 0.002 15.50 5.74 × 10⁻¹³
Width:ploidy-natural polyploid −0.27 0.09 −2.83 0.00995
Width:ploidy-synthetic
−0.28 0.09 −3.12 0.00516
polyploid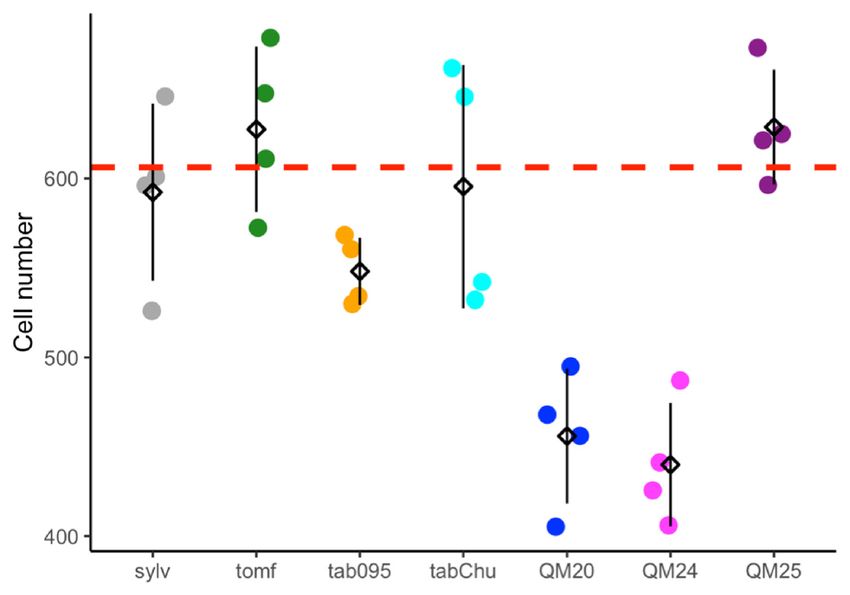
Genes 2020, 11, 1097                                                                                                                7 of 24

      Table 4. ANOVA results for corolla tube circumference~width + ploidy + width: ploidy + cell number.

                         Coefficients             Sum Sq              DF         F Value            p Value
                          Intercept                58.68              1             181.47       8.39 × 10⁻¹²
                           Width                   100.98             1             312.27       4.39 × 10⁻¹⁴
                           Ploidy                   4.24              2              6.56           0.0061
                        Cell
    Genes 2020, 11, x FOR    number
                          PEER  REVIEW             77.65              1             240.12       5.74 × 10⁻¹³                  7 of 24
                       Width:ploidy                 5.07              2              7.84           0.0029
                         Residuals                  6.79              21

                           (A)                                         (D)

                               (B)                                      (E)

                            (C)                                         (F)

      Figure 2. Strip plots for (A) cell width from 100 cells, (B) cell number, and (C) corolla tube circumference
      for all accessions, including mean and standard deviation for each accession: red dotted lines
      represent
          Figurethe2. progenitor
                       Strip plotsaverage,
                                     for (A) which     is the from
                                                cell width     expected
                                                                      100 intermediate
                                                                           cells, (B) cellphenotype.
                                                                                             number, and  Predicted   corollatube
                                                                                                              (C) corolla      tube
      circumference
          circumferencebasedforon
                                allthe  linear model
                                     accessions,        for (D)mean
                                                   including      cell width  and (E) cell
                                                                        and standard         number:forpoints
                                                                                          deviation        each represent
                                                                                                                 accession:actual
                                                                                                                               red
      flower  data.lines
          dotted      Corolla  tube circumference
                          represent    the progenitorbased       on (F)
                                                           average,      ploidy
                                                                       which    is including   mean
                                                                                    the expected       and standard
                                                                                                     intermediate       deviation
                                                                                                                     phenotype.
      for Predicted
          each ploidy:     points
                      corolla tuberepresent
                                    circumferenceactual  flower
                                                      based  on thedata.  Sylv
                                                                      linear     = N.for
                                                                             model      sylvestris,        = N.(E)
                                                                                                    tomf and
                                                                                          (D) cell width         tomentosiformis,
                                                                                                                   cell number:
      tab095  = N.
          points     tabacumactual
                  represent    095-55,    tabChu
                                      flower       = Corolla
                                               data. N. tabacum tube‘Chulumani’,
                                                                      circumferenceQM20 based =    (F) ploidyN.including
                                                                                               onsynthetic       tabacum mean
                                                                                                                            QM20,
      QM24 = synthetic N. tabacum QM24, QM25 = synthetic N. tabacum QM25.
          and  standard    deviation  for   each ploidy:  points   represent   actual  flower  data.  Sylv  = N. sylvestris, tomf
          = N. tomentosiformis, tab095 = N. tabacum 095‐55, tabChu = N. tabacum ‘Chulumani’, QM20 = synthetic
3.2. Transcriptome      Assemblies
          N. tabacum QM20,      QM24 = synthetic N. tabacum QM24, QM25 = synthetic N. tabacum QM25.
     Nanopore sequencing generated 5,380,172 high-quality reads. Specifically, 1,728,564 reads were
                                 Table 1. Linear model results for width~ploidy.
generated for N. sylvestris 60% and 995,999 reads were generated at 95%. For N. tomentosiformis,
there were 992,903   reads generated
             Coefficients             at 60%
                                Estimate   SE and  1,662,706
                                                t value       reads generated
                                                          p value                at 95%.
                                                                              Tukey  HSD After removing
                                                                                                   p valuereads

                   Intercept              20.29     1.43    14.20     1.8 × 10⁻¹³        diploid‐natural polyploid         0.0059

          Ploidy‐natural polyploid         6.91     2.02     3.42      0.00217           diploid‐synthetic polyploid      1.0 × 10⁻⁶

         Ploidy‐synthetic polyploid       12.67     1.85     6.87     3.37 × 10⁻⁷ natural polyploid‐synthetic polyploid 0.012
Genes 2020, 11, 1097 8 of 24
shorter than 800 bp, a total of 1,058,332 reads for N. sylvestris with a mean read length of 1171 bp and
952,350 reads for N. tomentosiformis with a mean read length of 1150 bp remained.
The number of assembled contigs, associated N50 values, and represented BUSCO genes varies
greatly Genes
among2020,the
11, x different
FOR PEER REVIEW
assemblies. The only combination that failed to assemble was9Trinity of 24 using
ENA + Nanopore with the –long_reads option. For N. sylvestris, in terms of the size and number
using ENA + Nanopore with the ‐‐long_reads option. For N. sylvestris, in terms of the size and number
of contigs, the best
of contigs, the assembly
best assembly was with
was withSPAdes
SPAdes using
using ENAENA+ + Nanopore.
Nanopore. This This assembly
assembly had 37,710
had 37,710
contigscontigs
with awithN50a N50of 2356 bp bp
of 2356 andandN90N90ofof788
788 bp (Table5).5).Using
bp (Table Usingjustjust Illumina
Illumina data generated
data generated an an
assembly with 44,350 contigs and an N50 of 1716 bp. Combining all data
assembly with 44,350 contigs and an N50 of 1716 bp. Combining all data generated 39,620 contigs generated 39,620 contigs
and aof
and a N50 N50 of 2254
2254 bp.bp.TheTheassembly
assembly with
withallall
data waswas
data slightly worse than
slightly worse ENA ENA +with
+ Nanopore
than close
Nanopore with
to 2500 additional contigs and a 100 bp smaller N50 value; even though there were more total reads,
close to 2500 additional contigs and a 100 bp smaller N50 value; even though there were more total
the Illumina data from developmental stages were short (85 bp) and only single‐end. The worst
reads, the Illumina data from developmental stages were short (85 bp) and only single-end. The worst
assemblies were the Trinity assembly (119,790 contigs, N50 of 815) and the TransAbyss assembly with
assemblies
ENAwere the Trinity
+ Nanopore (100,463assembly (119,790
contigs, N50 contigs, N50 of 815) and the TransAbyss assembly with
of 1172).
ENA + Nanopore (100,463 contigs, N50 of 1172).
A similar pattern of quality of assembly was seen for N. tomentosiformis with the SPAdes ENA +
A Nanopore assemblyof
similar pattern producing
quality39,950 contigs, a was
of assembly N50 ofseen
2258 for
bp, and a N90 of 643 bp. The
N. tomentosiformis second‐
with the SPAdes
best assembly was the SPAdes Illumina only, with the SPAdes
ENA + Nanopore assembly producing 39,950 contigs, a N50 of 2258 bp, and a N90 of 643 bp. Illumina + ENA + Nanopore
generating a much worse assembly in terms of number of contigs (51,360 contigs vs. 47,568 contigs)
The second-best assembly was the SPAdes Illumina only, with the SPAdes Illumina + ENA + Nanopore
but a better N50 value (2258 bp vs. 1704 bp). Again, the worst assemblies were the Trinity Illumina
generating a much
and the worseassemblies.
TransAbyss assembly in terms of number of contigs (51,360 contigs vs. 47,568 contigs)
but a betterForN50 value (2258
completeness in terms bp vs.of 1704
percent bp). Again,
BUSCO thepresent
genes worstfor assemblies
N. sylvestris,were theassemblies
the best Trinity Illumina
and thewere
TransAbyss assemblies.
SPAdes Illumina + ENA + Nanopore, SPAdes ENA + Nanopore, and TransAbyss. For complete
Forsingle‐copy
completeness genes,in allterms
three of
ranged fromBUSCO
percent 84.9 to genes
86.8%, present
with 6–7.6%for N.genes missing.the
sylvestris, Thebest
Trinity
assemblies
assembly and SPAdes Illumina assemblies had the lowest percentage of complete single copy genes,
were SPAdes Illumina + ENA + Nanopore, SPAdes ENA + Nanopore, and TransAbyss. For complete
the largest percentage of fragmented genes, and the largest percentage of missing genes (Figure 3 and
single-copy genes, all three ranged from 84.9 to 86.8%, with 6–7.6% genes missing. The Trinity assembly
Table 5). For N. tomentosiformis, the best assemblies for complete single‐copy genes are the same, but
and SPAdes
with theIllumina
TransAbyssassemblies
assemblyhad theslightly
having lowesthigher
percentage of complete
percentage of complete single copy genes,
single‐copy the largest
genes and
percentage
loweroffragmented
fragmented genes,
genes. The and theand
Trinity largest
SPAdespercentage of missingwere
Illumina assemblies genesthe (Figure 3 and
worst, with theTable 5).
Trinity assembly coming
For N. tomentosiformis, the best in assemblies
far below thefor others in terms
complete of complete genes
single-copy single‐copy genes
are the and but
same, overwith the
doubleassembly
TransAbyss the amounthavingof fragmented andhigher
slightly missingpercentage
genes. of complete single-copy genes and lower
We used the SPAdes ENA + Nanopore assemblies for further analyses, and these assemblies
fragmented genes. The Trinity and SPAdes Illumina assemblies were the worst, with the Trinity
have a total of 6115 shared protein clusters for both progenitor species, with an additional 460 protein
assembly coming
clusters uniquein far below
to N. the others
tomentosiformis andin480
terms of complete
protein single-copy
clusters unique genes(Figure
to N. sylvestris and over double the
S2 and
amountTable
of fragmented
S3). and missing genes.
N. sylvestris N. tomentosiformis
Trinity Illumina
SPAdes Illumina
TransAbyss ENA + Nanopore
SPAdes Illumina + ENA + Nanopore
SPAdes ENA + Nanopore
Figure Figure 3. Percent
3. Percent complete
complete single
single copy,copy, fragmented,and
fragmented, andmissing
missing BUSCO
BUSCOgenes forfor
genes both N. sylvestris
both N. sylvestris and
and N. tomentosiformis
N. tomentosiformis across theacross
fivethe five different
different assemblies
assemblies performed:
performed: including the
including the Nanopore
Nanopore long‐
long-reads
reads gave an increase of complete single copy genes and decrease in missing genes compared to
gave an increase of complete single copy genes and decrease in missing genes compared to short-read
short‐read only, regardless of assembler.
only, regardless of assembler.
We used the SPAdes ENA + Nanopore assemblies for further analyses, and these assemblies have a
total of 6115 shared protein clusters for both progenitor species, with an additional 460 protein clusters
unique to N. tomentosiformis and 480 protein clusters unique to N. sylvestris (Figure S2 and Table S3).Genes 2020, 11, 1097 9 of 24
Table 5. Assembly statistics for each transcriptome assembly performed for N. sylvestris and N. tomentosiformis including the assembler used, data that went into the
assembly, number of contigs, N50, N90, percent complete single-copy BUSCO genes, percent fragmented BUSCO genes, and percent missing BUSCO genes.
Nicotiana sylvestris
Assembler Data Number of Contigs N50 N90 % Complete Single Copy % Fragmented % Missing
SPAdes Illumina 44,350 1716 463 78.5 7.7 13.8
SPAdes Illumina + ENA + nanopore 39,620 2254 760 86.8 7 6.2
SPAdes ENA + nanopore 37,097 2356 788 86.4 7.6 6
Trinity Illumina 119,790 815 336 68.9 13.4 17.7
Trinity ENA + nanopore * NA NA NA NA NA NA
TransAbyss ENA + nanopore 100,463 1172 357 84.9 7.5 7.6
Nicotiana tomentosiformis
Assembler Data Number of Contigs N50 N90 % Complete Single Copy % Fragmented % Missing
SPAdes Illumina 47,658 1704 416 79.5 7.3 13.2
SPAdes Illumina + ENA + nanopore 51,360 2258 643 83.6 7.7 8.7
SPAdes ENA + nanopore 39,950 2365 777 82.7 8.1 9.2
Trinity Illumina 132,048 788 337 60.5 17.5 22
Trinity ENA + nanopore * NA NA NA NA NA NA
TransAbyss ENA + nanopore 129,220 1068 354 85.6 5.6 8.8
* Trinity assembly with the ENA + nanopore data failed to produce an output.Genes 2020, 11, 1097 10 of 24
3.3. Differential Expression
Through development, there is a pattern in which the 85% and 95% stages are most similar based
on gene expression (Figure S3) while the most differentially expressed (DE) genes occur in comparisons
between 60% and 95% (Table 6). Within N. sylvestris, of the total 37,097 transcripts, there are 35 DE
transcripts between 60% and 85%, 537 DE transcripts between 60% and 95%, and zero DE transcripts
between 85% and 95% using a cutoff of False Discover Rate (FDR) = 0.05 and a 4-fold change in
expression (Table 6). Within N. tomentosiformis, of the 39,950 transcripts, there are 227 DE transcripts
between 60% and 85%, 801 DE transcripts between 60% and 95%, and no DE transcripts between 85%
and 95%. For the natural polyploids N. tabacum ‘Chulumani’ and 095-55, the comparisons with the most
DE transcripts are between 60% and 95% with 4289 and 3796, respectively. In comparison, the synthetic
N. tabacum accessions QM24 and QM25 show 2914 and 2720 transcripts differentially expressed.
Table 6. Number of differentially expressed contigs within a taxon through the three developmental
stages: 60% of anthesis, 85% of anthesis, and 95% of anthesis. The number of differentially expressed
contigs with a 4-fold change in expression and FDR less than 0.05 are reported, along with the total
number of transcripts present in the given comparison.
Taxon 60% vs. 85% 60% vs. 95% 85% vs. 95%
N. sylvestris 35/23,952 537/23,952 0/24,063
N. tomentosiformis 227/24,585 801/24,871 0/24,445
N. tabacum 095-55 860/43,263 3796/44,207 691/43,615
N. tabacum ‘Chulumani’ 2241/43,638 4289/43,798 1/42,877
synthetic N. tabacum QM24 363/42,735 2914/42,879 262/42,937
synthetic N. tabacum QM25 679/43,416 2720/43,977 335/43,373
When looking at clustering of expression patterns across all taxa, there is a cluster of natural
polyploids and a cluster of synthetic polyploids, with the two progenitor species being quite distinct
from all polyploids (Figure S4). In fact, based on patterns of DE transcripts, N. tomentosiformis appears
to be more similar to all N. tabacum accessions at 60% and 95% while N. sylvestris is more similar
to the N. tabacum accessions at 85%. At 60%, we see 43,147 DE transcripts between the progenitor
species. Between the two natural polyploids, there are 781 DE transcripts, and between the two
synthetic polyploids, there are 177 DE transcripts. The same pattern exists at 85% with 42,275 DE
transcripts between progenitor lines, 605 DE transcripts between the natural polyploids, and 228 DE
transcripts between the synthetic polyploids. Within the 95% comparisons, there are 479 DE transcripts
between natural polyploids but no differentially expressed transcripts between the synthetic polyploids.
Between the diploid progenitors at 95%, there are 43,023 DE transcripts.
Hierarchical clustering based on differential expression for the 60% comparisons yielded 8
subclusters (Figure 4). In the first four subclusters, representing 44,852 transcripts, both natural and
synthetic polyploids show expression patterns similar to one or the other progenitor. Subcluster 5
with 573 transcripts shows that the synthetic polyploids and N. sylvestris have similar expression
patterns whereas the natural polyploids and N. tomentosiformis have similar expression patterns.
Subcluster 6 with 375 transcripts shows the opposite pattern, with the synthetic lines similar to
N. tomentosiformis and the natural polyploids similar to N. sylvestris. The remaining two clusters
show transgressive expression patterns with the synthetic polyploids and natural polyploids showing
the highest expression in subcluster 7 (474 transcripts) and subcluster 8 (30 transcripts), respectively.
The breakdown of annotated transcripts in each subcluster is presented in Table S4.
For comparisons within the 85% developmental stage, 12 subclusters were identified.
Five subclusters comprising 42,080 transcripts show a pattern with the polyploids being similar
to one of the progenitors (Figure S5). Subcluster 4 (353 transcripts) and subcluster 7 (646 transcripts)
show similar expressions between the synthetic lines and N. sylvestris, whereas the natural polyploids
resemble N. tomentosiformis. Subcluster 12 (18 transcripts) shows the opposite pattern, with the naturalGenes 2020, 11, 1097 11 of 24
polyploids similar to N. sylvestris and the synthetic lines similar to N. tomentosiformis. Subcluster 8
(520 transcripts) shows the synthetic polyploids displaying transgressive upregulated expression.
Three subclusters show unique patterns not found in the 60% developmental stage. In subcluster 5
(1986 transcripts), both the synthetic and natural polyploids appear to have an intermediate expression
between the two progenitor species. Subcluster 9 (215 transcripts) shows that the natural polyploid
N. tabacum 095-55 is similar to N. tomentosiformis, whereas N. tabacum ‘Chulumani’ is similar to
N. sylvestris. Subcluster 10 (122 transcripts) shows that N. tabacum 095-55 is similar to N. sylvestris,
whereas N. tabacum ‘Chulumani’ is intermediate between the two progenitors. The breakdown of
annotated contigs in each subcluster is presented in Table S5.
Genes 2020, 11, x FOR PEER REVIEW 12 of 24
Figure 4. Subclustering of transcripts across all taxa within the 60% of anthesis developmental stage
based on hierarchical clustering of differentially expressed genes: the number of transcripts found in
Figure
each 4. Subclustering
cluster is given. Eachof gray
transcripts across
line is one all while
gene, taxa within theline
the blue 60%isof
theanthesis developmental
mean expression profilestage
for
based on hierarchical clustering of differentially expressed genes: the number of transcripts
that subcluster. The order along the x-axis for each subcluster plot is synthetic polyploids (QM24 and found in
each cluster
QM25), is given.
N. sylvestris Each natural
(Sylv), gray line is one gene,
polyploids while the
(TAB095 andblue line and
TABC), is the
N.mean expression(Tom).
tomentosiformis profile for
that subcluster. The order along the x‐axis for each subcluster plot is synthetic polyploids (QM24 and
QM25),
The N. sylvestris (Sylv),
comparisons withinnatural
the 95%polyploids (TAB095 and
development TABC),
stage and N.11
showed tomentosiformis
subclusters(Tom).
(Figure S6).
Three subclusters representing 32,189 transcripts show both polyploids similar to one of the
For comparisons
progenitor lines. Three within the 85%
subclusters showdevelopmental stage, 12 in
transgressive expression subclusters were identified.
the polyploids. In subclusterFive5
subclusters comprising 42,080 transcripts show a pattern with the polyploids
(2405 transcripts), both synthetic and natural polyploids have higher expression than the progenitors. being similar to one of
thesubcluster
In progenitors
8 (185(Figure S5). Subcluster
transcripts), the natural4 (353 transcripts)
polyploids haveand subcluster
higher 7 (646
expression, andtranscripts) show
in subcluster 9
similar
(93 expressions
transcripts), between the
the synthetic linessynthetic
have higher linesexpression.
and N. sylvestris, whereas
Subclusters thetranscripts)
7 (254 natural polyploids
and 10
resemble
(122 N. tomentosiformis.
transcripts) show that the Subcluster
synthetic lines12 (18andtranscripts) showshave
N. tomentosiformis the opposite pattern, with
similar expression the
profiles,
natural polyploids similar to N. sylvestris and the synthetic lines similar
as do the natural polyploids and N. sylvestris. Subcluster 11 (40 transcripts) has similar expression to N. tomentosiformis.
Subcluster
between 8 (520 lines
synthetic transcripts) shows the
and N. sylvestris, synthetic
whereas polyploids
the natural displaying
polyploids transgressive
are similar upregulated
to N. tomentosiformis.
expression. Three subclusters show unique patterns not found in the 60%
The final two clusters, subcluster 3 (10,385 transcripts) and subcluster 6 (885 transcripts), show developmental stage.
bothIn
subcluster 5 (1986 transcripts), both the synthetic and natural polyploids
natural and synthetic polyploids with intermediate expression levels between the two progenitors. appear to have an
intermediate
The breakdown expression
of annotatedbetween
contigsthein
two progenitor
each subcluster species. Subcluster
are presented in 9Table
(215 S6.
transcripts) shows that
the Wenatural
were able to identify many of the known candidate genes involved whereas
polyploid N. tabacum 095‐55 is similar to N. tomentosiformis, N. tabacum
in floral organ size.
‘Chulumani’
In general, we is similar
see more to N. sylvestris.genes
candidate Subcluster 10 (122 transcripts)
differentially expressed withinshows that N. tabacum
the different 095‐55 is
polyploid
similar to N.
accessions sylvestris, whereas
in comparisons between N. tabacum
60% and‘Chulumani’
95% (Figure 5); is intermediate
however, we between the two progenitors.
do see differential expression
The breakdown of annotated contigs in each subcluster is presented in Table
within polyploid accessions in at least a few genes across all stages. A few candidate genes show S5.
The comparisons
differential expression withinwithinN.thesylvestris
95% development stage showed
or N. tomentosiformis 11 subclusters
through development (Figure
exceptS6).
forThree
BPE
subclusters representing 32,189 transcripts show both polyploids similar
which is upregulated in 95% in N. sylvestris compared to 60% (Figure S7). As expected, comparisons to one of the progenitor
lines. Three
between subclusters
polyploids and oneshow transgressive
of their expression
diploid progenitors show in that
the polyploids
polyploids.display
In subcluster 5 (2405
upregulation of
transcripts), both synthetic and natural polyploids have higher expression
the other progenitor homeolog (Figure S8). The N. sylvestris copy of GASA/GAST1 appears to have than the progenitors. In
subcluster 8 (185 transcripts), the natural polyploids have higher expression, and in subcluster 9 (93
transcripts), the synthetic lines have higher expression. Subclusters 7 (254 transcripts) and 10 (122
transcripts) show that the synthetic lines and N. tomentosiformis have similar expression profiles, as
do the natural polyploids and N. sylvestris. Subcluster 11 (40 transcripts) has similar expression
between synthetic lines and N. sylvestris, whereas the natural polyploids are similar to N.Genes 2020, 11, x FOR PEER REVIEW 13 of 24
expression within polyploid accessions in at least a few genes across all stages. A few candidate genes
show differential expression within N. sylvestris or N. tomentosiformis through development except
GenesBPE
for 2020,which
11, 1097 is upregulated in 95% in N. sylvestris compared to 60% (Figure S7). As expected, 12 of 24
comparisons between polyploids and one of their diploid progenitors show that polyploids display
upregulation of the other progenitor homeolog (Figure S8). The N. sylvestris copy of GASA/GAST1
higher levels
appears to have of higher
expression
levelsinofall polyploids
expression compared
in all to the
polyploids expression
compared found
to the N. sylvestris
withinfound
expression within
across all developmental stages (Figure S8). We also see downregulation of some of the
N. sylvestris across all developmental stages (Figure S8). We also see downregulation of some of the N. sylvestris
genes
N. that act
sylvestris as inhibitors,
genes that act assuch as BIG such
inhibitors, BROTHER
as BIG (BB) and BIGGER
BROTHER (BB) andORGANS,
BIGGERin the polyploids
ORGANS, in the
compared to expression in N. sylvestris as well as downregulation of the N. tomentosiformis
polyploids compared to expression in N. sylvestris as well as downregulation of the N. tomentosiformis copy of BB
in polyploids compared to expression in N. tomentosiformis (Figure S8).
copy of BB in polyploids compared to expression in N. tomentosiformis (Figure S8).
(A) N. tabacum 095‐55
(B) N. tabacum ‘Chulumani’
(C) synthetic N. tabacum QM24
(D) synthetic N. tabacum QM25
Figure 5. Log2 fold change of differentially expressed genes across comparisons within accessions
Figure 5. Log2 fold change of differentially expressed genes across comparisons within accessions
between 60%, 85%, and 95% developmental time points for (A) N. tabacum 095-55, (B) N. tabacum
between 60%, 85%, and 95% developmental time points for (A) N. tabacum 095‐55, (B) N. tabacum
‘Chulumani’, (C) synthetic N. tabacum QM24, and (D) synthetic N. tabacum QM25: violin plots represent
‘Chulumani’, (C) synthetic N. tabacum QM24, and (D) synthetic N. tabacum QM25: violin plots
all differentially expressed genes between each comparison, whereas colorful strip plots represent
represent all differentially expressed genes between each comparison, whereas colorful strip plots
differentially expressed candidate floral organ size genes. Positive logFC values represent genes
upregulated in the first stage listed in the comparison, whereas negative logFC values represent genes
upregulated in the second stage listed. The dashed gray lines across the plot denote the log2 = |2| cutoff
for differentially expressed genes. Sylv = N. sylvestris, tomf = N. tomentosiformis.Genes 2020, 11, x FOR PEER REVIEW 14 of 24
represent differentially expressed candidate floral organ size genes. Positive logFC values represent
genes upregulated in the first stage listed in the comparison, whereas negative logFC values represent
genes upregulated in the second stage listed. The dashed gray lines across the plot denote the log2 =
Genes 2020, 11, 1097
|2| cutoff for differentially expressed genes. Sylv = N. sylvestris, tomf = N. tomentosiformis. 13 of 24
Comparing the natural and synthetic polyploids at 60%, we see downregulation of the N.
Comparing the natural and synthetic polyploids at 60%, we see downregulation of the
tomentosiformis copy of BB in N. tabacum 095‐55 compared to all other polyploids (Figure 6). For QM24,
N. tomentosiformis copy of BB in N. tabacum 095-55 compared to all other polyploids (Figure 6).
the N. tomentosiformis copy of ARF2 appears to be downregulated compared to the two natural
For QM24, the N. tomentosiformis copy of ARF2 appears to be downregulated compared to the two
polyploids, whereas the transcripts in QM25 do not show differences. The N. sylvestris copy of
natural polyploids, whereas the transcripts in QM25 do not show differences. The N. sylvestris copy of
GASA/GAST1 appears to be upregulated in QM25 compared to the natural polyploids, whereas the
GASA/GAST1 appears to be upregulated in QM25 compared to the natural polyploids, whereas the
transcript in QM24 does not show any difference.
transcript in QM24 does not show any difference.
(A) 60% of anthesis length
(B) 85% of anthesis length
(C) 95% of anthesis length
Figure 6. Log2 fold change of differentially expressed genes across comparisons between natural
Figure
and 6. Log2 N.
synthetic fold changeaccessions
tabacum of differentially expressed
at (A) 60%, genes
(B) 85%, andacross comparisons
(C) 95%of anthesisbetween
length: natural and
violin plots
synthetic N. tabacum accessions at (A) 60%, (B) 85%, and (C) 95%of anthesis
represent all differentially expressed genes between each comparison, whereas colorful strip length: violin plots
all differentially
represent differentially expressed
expressed genes between
candidate each
floral organ comparison,
size whereas
genes. Positive logFC colorful
valuesstrip plots
represent
represent
genes differentially
upregulated expressed
in the candidate
first accession floral
listed in organ
the comparison, Positive logFC
size genes. whereas negativevalues
logFCrepresent
values
genes upregulated
represent in the first
genes upregulated accession
in the listed in listed.
second accession the comparison,
The dashedwhereas
gray linesnegative
across thelogFC values
plot denote
the log2 = genes
represent |2| cutoff
upregulated in the second
for differentially expressedaccession = The
listed.
genes. Sylv dashed gray
N. sylvestris, = N. tomentosiformis,
tomf lines across the plot
denote =the
tab095 log2 = |2|
N. tabacum cutoff
095-55, tabChu = N. tabacum expressed
for differentially ‘Chulumani’,genes.
QM24 = synthetic
Sylv = N. sylvestris, tomfQM24,
N. tabacum = N.
and QM25 = synthetic N. tabacum QM25.
In the comparisons at 85%, we see upregulation of both progenitor copies of ARGOS in the
natural polyploid N. tabacum ‘Chulumani’. The N. tomentosiformis copies of GASA/GAST1 appear
downregulated in QM24 compared to the natural polyploids and QM25, whereas copies fromGenes 2020, 11, 1097 14 of 24
both progenitors appear upregulated in QM25 compared to both natural polyploids. We also see
upregulation of the N. tomentosiformis copy of BB in both QM24 and QM25 compared to N. tabacum
095-55, whereas BB from N. sylvestris is upregulated in both QM24 and QM25 compared to N. tabacum
‘Chulumani’. Additionally, the LONGIFOLIA genes from N. sylvestris appear to be upregulated in
both synthetic lines compared to N. tabacum ‘Chulumani’ but show no expression differences with
N. tabacum 095-55.
At 95%, we see consistent upregulation of the N. tomentosiformis copy of GASA/GAST1 in QM24
compared to natural polyploids (we also see upregulation in QM25 versus N. tabacum ‘Chulumani’),
while in QM25, the N. sylvestris copies of GASA/GAST1 show upregulation compared to the natural
polyploids. We generally see upregulation of BB in synthetic lines compared to the natural polyploids
(except in QM24 compared to N. tabacum ‘Chulumani’).
4. Discussion
Nicotiana polyploids have significantly wider cells than diploids, with synthetic polyploids
having even wider cells than natural polyploids, and the ploidy factor in our model, which includes
three levels—diploids, natural polyploids, and synthetic polyploids—significantly increases corolla
tube circumference. Synthetic polyploids show a decrease in the number of differentially expressed
transcripts within a taxon through development compared to natural polyploids. Clustering by
expression patterns shows a relatively small number of transcripts displaying transgressive expression
in either the natural or synthetic polyploids compared to the progenitors, while even fewer transcripts
show an intermediate expression profile. Many of the known candidate genes for floral organ size
show differential expression, specifically ARF2, BB, and GASA/GAST1.
Liqin et al. [49] showed upregulation of BB in diploids compared to synthetic triploids and
synthetic tetraploids of Populus and suggested that BB acts as a species-specific organ size checkpoint.
More importantly, Liqin et al. [49] put forward the hypothesis that polyploids may need higher
expression levels of BB to obtain normal organ size. BIG BROTHER was originally described as limiting
organ size by restricting the period of proliferative growth [26]. Here, we see higher expression levels
of the N. tomentosiformis copy across all three developmental time points in the synthetic polyploids
than the natural polyploids. In addition to upregulation of BB compared to otherN. tabacum accessions,
the synthetic polyploid QM25, which has the largest flowers of all the polyploids investigated,
shows higher expression of GASA/GAST1 than the natural polyploids, especially the copy from
N. sylvestris. Members of the GASA family, in particular GASA4, are expressed in developing roots
and flowers [24]. Indeed, in Saltugilia (Polemoniaceae), GASA was expressed at the highest levels at
mature stages, which corresponded to cell elongation in the petal tube [50,128]. The accession QM25
has the longest corolla tube examined excluding N. sylvestris (Figure 1). The interaction between a gene
that represses proliferation (such as BB [26]) and a gene that promotes cellular elongation (such as
GASA [24]) in polyploids is intriguing, especially since the upregulated homeolog of the repressor
is from the shorter flowered progenitor and the upregulated homeolog that promotes elongation
comes from the longer flowered progenitor. In addition, the N. tomentosiformis copy of ARF2, which is
involved in promoting cell proliferation [34], is downregulated in QM24 compared to the natural
polyploids; this downregulation may play a role in restricting cell division in this accession because
QM24 has the fewest cells of the accessions examined (Figure 2B).
4.1. Differences in Expression
We see that natural and synthetic polyploids have expression patterns similar to one progenitor
for the vast majority of transcripts across all developmental stages (Figure 4 and Figures S5 and S6).
In total, there are 1612 transcripts in which the synthetic lines and N. sylvestris share similar expression
patterns, whereas the natural polyploids are similar to N. tomentosiformis. Conversely, there are only 769
transcripts where the synthetic lines have similar expression to N. tomentosiformis, whereas the natural
polyploids were similar to N. sylvestris. This demonstrates that the expression patterns in the syntheticYou can also read