Results of a spring 2017 aerial survey of the Torngat Mountains Caribou Herd.
←
→
Page content transcription
If your browser does not render page correctly, please read the page content below
Results of a spring 2017 aerial survey of the Torngat Mountains
Caribou Herd.

Couturier, S.1, Dale, A.2, Wood, B. 3, and J. Snook4.
1
  tuttu@videotron.ca 2 aaron.dale@torngatsecretariat.ca 3 bryn.wood@torngatsecretariat.ca
4
  jamie.snook@torngatsecretariat.ca

Torngat Wildlife, Plants and Fisheries Secretariat
217 Hamilton River Rd., P.O. Box 2050 Stn. B
Happy Valley-Goose Bay. NL. A0P 1E0

In collaboration with the Torngat Caribou Technical Committee:
Government of Quebec, Newfoundland & Labrador Government, Nunatsiavut
Government, Parks Canada, Makivik Corporation and Kativik Regional Government
(Nunavik Parks).

Torngat Wildlife and Plants Co-Management Board
Torngat Wildlife, Plants and Fisheries Secretariat

The primary responsibilities of the Torngat Wildlife and Plants Co-management Board
and the Torngat Joint Fisheries Board are to establish total allowable harvests for non-
migratory species of wildlife and for plants, recommend conservation and management
measures for wildlife, plants, and habitat in the Labrador Inuit Settlement Area (LISA)
and to make recommendations in relation to the conservation of species, stocks of fish,
aquatic plants, fish habitat, and the management of fisheries in the Labrador Inuit
Settlement Area. The Secretariat is the implementation agent of the Torngat Joint
Fisheries Board and the Torngat Wildlife and Plants Co-Management Board.

Torngat Omajunik, Piguttunik Oganniaganillu Suliangit

Suliagigumajangit     Torngat     Omajunik,      Piguttunillu     AulatsiKatigengita
AngajukKauKatigengit      ammalu       Torngat    Ikajuttiget   Oganniatuligijingita
AngajukKauKatigengit sakKititsigiamut pijaugunnatunik katillugit aullaigatsatagiamut
nokataKattangitunik omajunik ammalu piguttunik, uKautjigiajut asikKitailigiamut
ammalu aulatsigiamut omajunik, piguttunik, ammalu inigiKattajanginnik Labradorimi
Inuit Satusasimajanginni Nunani (LISA) ammalu uKautjigiagutinik ilingajunik
asikKitailigiamut omajunik, oganniaganik, piguttunik, oganik, ammalu aulatsigiamut
oganniaganik Labradorimi Inuit Satusasimajanginni Nunani.

SuliaKattet     atuliaKititsigumajut     kiggatuttinganik   Torngat    Ikajuttiget
Oganniatuligijingita AngajukKauKatigenginnik ammalu Torngat Omajuligijinginnik
Piguttunillu AulatsiKattajut AngajukKauKatigenginnik, sunatuinnanik, suliatsanik
aulatsigiamut ammalu ikajutsitaullutik tamâginnut angajukKauKatigenut.
iii

                   Torngat Wildlife, Plants & Fisheries Secretariat Series

                                             2018

       Results of a spring 2017 aerial survey of the Torngat Mountains Caribou Herd.

                     Couturier, S.1, Dale, A.2, Wood, B. 2, and J. Snook. 2

                      Torngat Wildlife Plants and Fisheries Secretariat
                      2

                      217 Hamilton River Rd., P.O. Box 2050 Station B,
                              Happy Valley-Goose Bay, NL
                                         A0P 1E0

1
    1+ 418 261-6862, tuttu@videotron.ca
iv

                                      Published by:
                    Torngat Wildlife, Plants and Fisheries Secretariat
                      217 Hamilton River Rd., P.O. Box 2050 Stn. B
                            Happy Valley-Goose Bay, NL
                                        A0P 1E0

                             Correct citation for this publication:
Couturier, S., Dale, A., Wood, B., and J. Snook. (2018). Results of a spring 2017 aerial
survey of the Torngat Mountains Caribou Herd. Torngat Wildlife, Plants and Fisheries
Secretariat. Ser. 2018/40 + 10 p
v
TABLE OF CONTENTS
TABLE OF CONTENTS ............................................................................................. v
LIST OF FIGURES..................................................................................................... vi
LIST OF TABLES ...................................................................................................... vii
Acknowledgements ................................................................................................... ix
Executive Summary .................................................................................................... x
AngajukKauniujuit Kaujititsiutinga Nailittisimajuk .......................................... xi
ᓀᓪᓕᑎᕐᓯᒪᔪᖅ ᑐᓴᕐᑎᓯᒍᑎᒃ .............................................................................................. xiii
Sommaire .................................................................................................................. xiv
1. Introduction ............................................................................................................. 1
2. Methods.................................................................................................................... 4
2.1 Study area and survey design ............................................................................ 4
2.2 Distance sampling .............................................................................................. 7
2.3 Survey implementation .................................................................................... 10
2.4 Recruitment and sex ratio ................................................................................ 11
3. Results .....................................................................................................................12
3.1 Exploratory data analysis ............................................................................... 16
3.2 Possible overlap with George River Herd ...................................................... 20
3.3 Density and herd size estimation in Distance Sampling .............................. 21
3.4 Recruitment and sex ratio ................................................................................ 29
4. Discussion ...............................................................................................................30
4.1 Survey area, transect and sampling design .................................................... 31
4.2 Density estimation in Distance Sampling...................................................... 32
4.2.1 Sample size................................................................................................. 32
4.2.2 Distance truncation ................................................................................... 34
4.3 Recruitment and sex ratio ................................................................................ 34
5. Conclusion and recommendations ......................................................................36
References ...................................................................................................................38
Appendix A.................................................................................................................41
Appendix B .................................................................................................................42
Appendix C .................................................................................................................45
Appendix D ................................................................................................................48
Appendix E .................................................................................................................50vi
LIST OF FIGURES
Figure 1. Project field team of the Torngat Mountains Caribou Herd survey, spring 2017.
From left to right: Serge Couturier, wildlife biologist consultant; Steve Lodge,
helicopter pilot; Aaron Dale, project manager for the Torngat Wildlife and
Plants Co-Management Board; Tommie Unatweenuk, Inuit expert from
Kangiqsualujjuaq, QC; and Ryan Merkuratsuk, Inuit expert from Nain, NL. ... 4
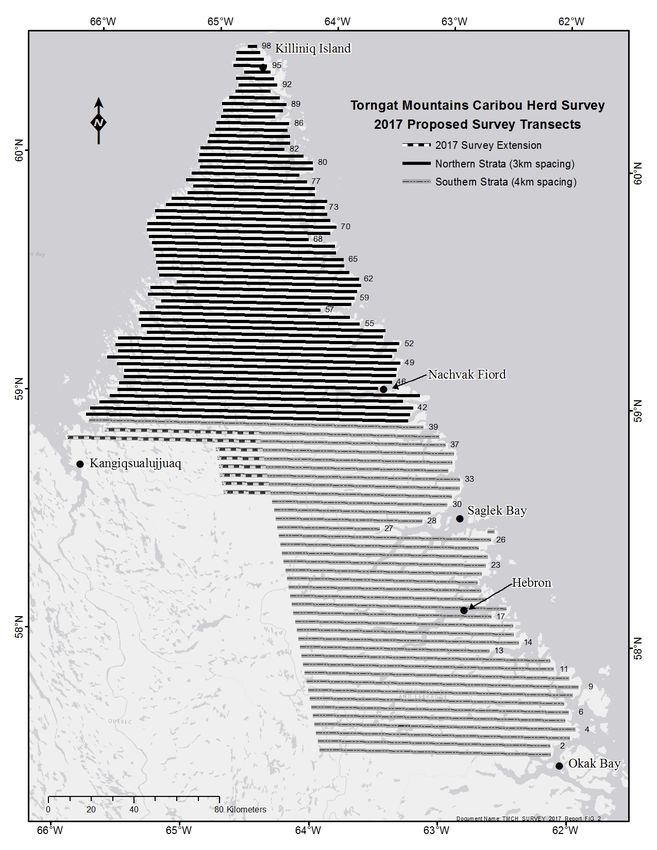
Figure 2. Map of the study area and transects planned during the spring 2017 survey of
the Torngat Mountains Caribou Herd. The dashed lines show new areas
added in 2017 (1,235 km2)........................................................................................ 6
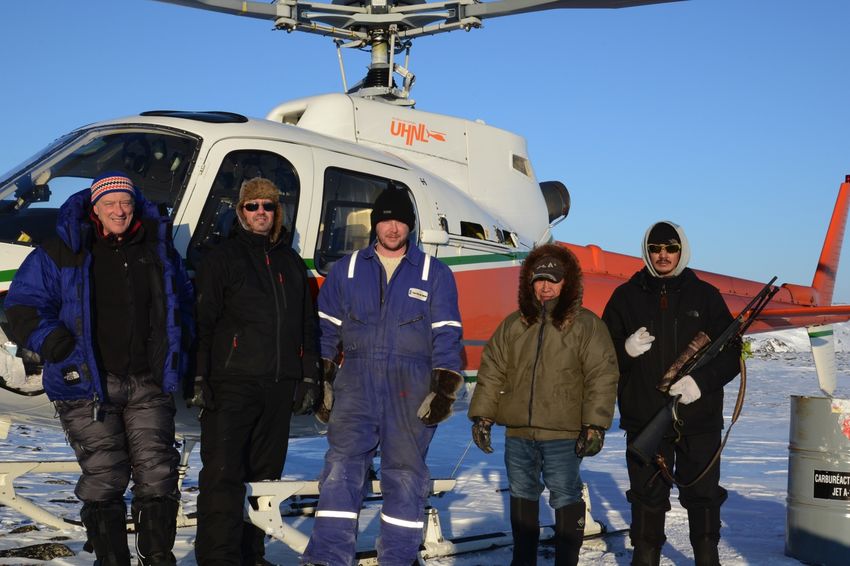
Figure 3. Map of the study area and its geographic strata used during the 2017 spring
survey of the Torngat Mountains Caribou Herd. This map also shows
transects that were not surveyed due to weather problems, fuel limitations or
other causes (see text for explanations)................................................................ 13
Figure 4. Frequency distribution of perpendicular distances of caribou groups (n= 58;
before data censoring) detected during the Torngat Mountains Caribou Herd
survey in spring 2017 using three bin sizes: A. 100 m, B. 150 m, and C. 200 m.
................................................................................................................................. 18
Figure 5. Relationship investigation between group size (y) and the perpendicular
distance in metres (x) for 58 groups of caribou seen on transects during the
Torngat Mountains Caribou Herd survey in spring 2017 (before data
censoring). The relationship is weak and non-significant (p>0.05). .................. 19
Figure 6. Detection probability function (continuous red line) and histogram of
perpendicular distances (m) from the transect line of caribou groups recorded
during the Torngat Mountains Caribou Herd survey, spring 2017. This
detection function was created by the program Distance 7.1 using the best
model in Conventional Distance Sampling (CDS): Half-Normal Cosine with no
adjustment term. Bin size is 348 m. Two shaded areas of equal size were added
to illustrate the equal detection probability below and above the Effective strip
width (ESW=W*p) of 622 m in this model (see text). .......................................... 25vii
LIST OF TABLES
Table 1. Distance sampling detection function recommended by Thomas et al. (2010)
and Marques et al. (2007) that have been used in data analysis of the 2017
Torngat Mountains Caribou Herd aerial survey. Models are described by their
key functions and adjustments terms. ...................................................................... 9
Table 2. Technical information related to the helicopter survey of the Torngat
Mountains Caribou Herd in spring 2017 and comparison with previous survey
done in 2014 (Couturier et al. 2015). ....................................................................... 15
Table 3. Biological information obtained from the helicopter surveys of the Torngat
Mountains Caribou Herd in spring 2014 and 2017 (see also Couturier et al.
2015). ......................................................................................................................... 16
Table 4. Preliminary analysis of the Torngat Mountains Caribou Herd survey data to
investigate effects of right-truncation. Analysis were done in Distance 7.1 with
Conventional Distance Sampling (CDS) and Multiple Covariate Distance
Sampling (MCDS) methods to compute sampling parameters: number of
caribou groups (n), number of parameters (m), effective strip width in meters
(ESW), detection probability (p), estimated caribou group size (E(S)), density
and its associated coefficient of variation (D and D CV). ..................................... 22
Table 5. Torngat Mountains Caribou Herd 2017 survey results (n= 56 caribou groups) of
the fitted detection models provided by Conventional Distance Sampling (CDS)
and by Multiple Covariate Distance Sampling (MCDS) methods in Distance 7.1.
Covariates snow cover and slope were tested, while truncation distance was set
at 1,390 m in a two strata sampling design. Columns report number of
parameters (m), Delta AIC (Akaike’s Information Criteria), effective strip width
in meters (ESW), probability of detection (p), coefficient of variation of p (p CV),
estimated group size (E(S)), density of caribou per km2 (D), coefficient of
variation of D, (D CV), and two goodness of fit test probability values (Chi2 and
Kolmogorov-Smirnov (K-S)). .................................................................................. 24
Table 6. Estimates of density, herd size (N), coefficient of variation (CV) and confidence
interval at p= 0.10 (CI) for the Torngat Mountains Caribou Herd survey, spring
2017. ........................................................................................................................... 27
Table 7. Variance components of density estimate computed by the best model
(Conventional Distance Sampling Half-Normal Cosine(0)) fitted to data
recorded during the survey of the Torngat Mountains Caribou Herd, spring
2017. ........................................................................................................................... 27viii
Table 8. Investigation of the effect of the study area size using the Spring 2017 survey
data for the Torngat Mountains Caribou Herd. In Distance 7.1 software, the best
model CDS HN Cos(0) was run for all three study area using two geographic
strata (north and south). .......................................................................................... 28
Table 9. Herd size estimation using fixed-width transect method computed from
Distance sampling results obtained during the aerial survey of the Torngat
Mountains Caribou Herd in spring 2017. .............................................................. 29ix Acknowledgements The planning and realization of this project was done through discussion with partner organizations of the Torngat Caribou Technical Committee (hereafter the Torngat Committee): Government of Quebec (Vincent Brodeur), Newfoundland and Labrador Government (John Pisapio), Nunatsiavut Government (Jim Goudie), Kativik Regional Government and Nunavik Parks (Élise Rioux-Paquette), Makivik Corporation (Stas Olpinski and Mark O’Connor), Parks Canada (Gary Baïkie, Darroch Whitaker, and Martin Lougheed), and the Torngat Wildlife, Plants & Fisheries Secretariat (Aaron Dale and Serge Couturier). The Torngat Committee members not only collaborated in the planning and realization of the project but also supported it through direct funding and in-kind contribution (lodging, fuel, Internet access, etc.). Ryan Merkuratsuk from Nain, Nunatsiavut (NL) and Tommie Unatweenuk from Kangiqsualujjuaq, Nunavik (QC) provided invaluable assistance in the field. Their knowledge of the land contributed to the success of the survey. Also, pilot Steve Lodge provided safe operation of the helicopter during a long field study in this remote and often harsh region. The survey protocol was presented in March 2017 during two public meetings held in Kangiqsualujjuaq and Nain. We would like to thank people who took this opportunity to exchange information with us about the status of their local caribou. Special thanks to Charlie Munick, Kuururjuaq Park Director who let us use the Qurlutuarjuq facilities as a base camp for several days. The Kuururjuaq Park Director also provided housing facilities for the team in Kangiqsualujjuaq during the first leg of the survey. Also, thanks to the Parc national Kuururjuaq’s staff Darrel Emak, Jessie Baron, Cecilia Emudluk, Jari Leduc and Olivier Paradis who were gracious in sharing the Qurlutuarjuq camp with us. The survey lasted about a month and many people assisted with the operation in the field: Tummasi Itua Annanack, Henry Lyall, Charlie Munick and others both in Kangiqsualujjuaq and Nain. Thanks to Étienne Caron from Héli-Boréal (Sept- Îles, QC), Peter Duncan from Nunavik Rotors (Kuujjuaq, QC) and Matthew Emudluk (Kangiqsualujjuaq, QC) for their help with fuel deployment. This project represents the best of co-management with partners representing seven institutions coming together at a technical and operational scale to accomplish a monumental task prioritised by the people of Nunavik and Nunatsiavut. The commitment of all partners to see this project through to completion was a defining factor in the success of this endeavour.
x

Executive Summary

Inuit of Nunavik and Nunatsiavut have long known that a small caribou population was living
year-round in the Torngat Mountains. Recognizing its unique status, the Committee on the Status
of Endangered Wildlife in Canada (COSEWIC) has recently identified the Torngat caribou as one
of eleven units for caribou conservation across Canada. In 2016, COSEWIC assessed the status of
the Torngat caribou as Endangered based largely on the inherent risk associated with its small
population size.

An informal Torngat Caribou Technical Committee was established in 2013 to address research
needs. The Torngat Committee is a coalition of interested parties and it includes representatives
from the Government of Quebec, the Government of Newfoundland & Labrador, the
Nunatsiavut Government, Makivik Corporation, Kativik Regional Government (Nunavik Parks),
Parks Canada, and the Torngat Wildlife, Plants and Fisheries Secretariat (on behalf of the Torngat
Wildlife and Plants Co-management Board). Following discussion among the Torngat
Committee, the first aerial population survey of the Torngat Mountains Caribou Herd was carried
out in March 2014 (Couturier et al. 2015), and estimated the herd size at 930 caribou. To continue
the scientific monitoring of the herd, all members of the Torngat Committee dedicated funds
and/or in-kind contributions to support a second systematic population survey of the Torngat
caribou herd. This was carried out in March and April 2017 following a similar distance sampling
technique as was employed in 2014.

The study area was divided into two geographic strata, north and south, along a line located on
latitude 58° 55’ N. It was expected that caribou density would be higher in the northern stratum,
therefore more sampling effort was devoted there. Parallel transects ran east-west and were
separated by 3 km in the north and 4 km in the south. Observers recorded caribou groups and
other mammal species seen on a total of 91 transects flown at slow speed and low altitude.
Weather conditions and visibility were excellent during flying days. Total transect length was
7,722 km and the survey area covered 30,625 km2 between Okak Bay and Killiniq Island. Three
packs of wolves (8 wolves), fourteen polar bears, and one arctic fox were observed. Fifty-eight
caribou groups were observed on-transect for a total of 610 caribou. Observed group size varied
from 1 to 38 caribou with a mean of 10.5 caribou per group. Group size in 2017 was almost twice
that reported in 2014 (5.4). As in 2014, recruitment was high, with calves accounting for 23.1% of
the animals observed, which would theoretically allow for a growing population under typical
demographic conditions. No caribou were observed south of Hebron Fjord, while most of the
groups were seen north of Nachvak Fjord. The distance sampling method estimated Torngat
Herd size in 2017 at 1,326 caribou (including calves) with a confidence interval ranging from 912
to 1,986. The strata sampling design yielded estimates of 1,045 and 281 caribou in the north and
south strata, respectively. However, while these results may seem encouraging for the Torngat
Herd, this survey confirmed that it is still small and needs careful attention from managers and
users.
xi

AngajukKauniujuit Kaujititsiutinga Nailittisimajuk

Inuit Nunavimmi, Nunatsiavummilu akuninit KaujimasimalikKut unuttolungituit
tuttuit jâri nâdlugu iniKaKattaninginnik Tungait KakKasuanginni. Ilitagidlugu tamanna
adjiusialugani      ilusiujuk,     katimajiujuit     kamajiudlutik     Canadami      Omajunik
Nungutautuinnagiangit           Ilimanattumejunik         (COSEWIc)       mânnaKamiulauttuk
ulinnaisilaukKut tamakkuninga Tungait tuttuKutinginnik ilangiunninginnik ailfaujuit
immigolingallutik           tuttuKutiujunik           Canadami          kamagijautsiagialinnik
nungutauttailikKulugit. 2016-nami, tamakkua COSEWIC-kut KaujiutiKalaukKut
tamakkua Tungait tuttungit Nungutautuinnagiangit Ilimanattumenninginnik
pitjutiKallutik ununningit ikiluadlalimmata ulugianattumenninginnik.
Pimmagiulungikkaluallutik Tungait TuttuKutinginnik kamajitsaulutik katimajet
pigiasittitaulaukKut          2013-nami         kamakKulugit           KaujisautiKagajannimik
atuttaugiaKagajattunik. Tungait katimajingit katimajiuvut kamaKataugumatsiajuit,
ilauKatautillugit kiggatuttiujuit Quebec-iup kavamanganit, Niufulâlu, Labradoriullu
kavamanganit, Nunatsiavut kavamanganit, Makivikkut kuapanganit, kativikkut
kavamanganit (Nunavimmi SilakKijapviligijingit), Canadami SilakKijapviligijingit,
Tungait Omajuligijingita, Pigutsiagijet, Ugannaituligijellu Aulatsivingalu (kiggatullutik
Tungait       Omajuligijingita        Pigutsialigijingita    ikajuttigellutik    kamajiullutik
katimajinginnik). Tungait katimajingit uKâlautikKâtillugit, sivullipâmik tingijokkut
Kaujisapviusimajuit allasimavut ovani (Couturier et al. 2015), nalautsâgutigillugillu
tuttuit ununningit 930-tiulaukKut. Suli Kaujisautigigumallugit kamagumallutik tuttunik,
ilonnaita     ilaliutijuit   Tungait     katimajinginnut       aittotiKalaukKut     kenaujanik
ammala/ubvalu tunijidlutik aippânik Kimiggugumallutik Tungait tuttuKutingita
ununninginnik. Tamanna kajusittitaulaukKuk Mertz-imi Âprelimilu 2017-nami
atudlutik adjigalanganik Kaninginingata atulauttangata 2014-nami.
Tamanna KaujisautiKannimi inigilauttanga aviukKasimalaukKuk magguilingatillugu
nunanguami, taggâni, siKinganilu, nunanguami titigasimajumi 58 55’ N.
NigiunnalaukKuk tuttuit ununningit taggânenitsaugajanninginnik, taimaimmalu
tappâni kamalualaukKut. Adjigettumik ikâttanimmi kitânit kangimut aiKattalauttuit
avisimautinniKadlutik 3 kilometers-itut taggânit, 4 kilometers-itullu siKinganit.
kamaKataulauttuit takulaukKut tuttunik katingajunik asinginnilu omajunik katidlugit
91-naittudlutik ikâttanimmi sukkaisâdlutik, pukkitodlutillu. Silak piujolauttuk
takunnânatsiadlunilu        tingilanannita      ullunginni.     Ikâttadluta    tingigalannivut
KaninginiKalaukKuk 7,772 kilometers-itut, Kimigguvigijavullu ininga anginiKattilugu
30,625 kilometers-itut akungani OkKaup kangidluata killiniullu Kikkitanganit.
TakulaukKugut pingasunik amagunik katingajunik (âttat amaguit), 14-nanik nanunnik,
atautsimillu tiggiganniamik. TakulaukKugut 58-tinik tuttunik katingajunik
ikâgalannitini katillugillu 610-ninik tuttunik. takuKattajavullu katingaKattatallugit
xii

ununniKaKattalauttuit atautsimit, 38-tinut tuttunik, taggalu ununniKaKattadlutik tuttuit
katingautijuit 10.5-itut.
katinggautiKattajuillu 2017-nami ununniKaKattalauttuit magguitulluangukasâdlutik
uKautaulauttunit 2014-nami (5.4). Sollu 2014-nami, unutsivallisimalaukKut, nuggangit
unutsivallisimattilugit       23.1%-itut,     takulauttattini,    taggalu     takutitsidluni
unutsiumisimanninginnik unutsiumisongunningit malillugu. Tuttunik takululaungituit
Nachvâp kangidluata siKingani, ununningillu katingajuit takujautillugit Nachvâp
kangidluata taggâni. Kaningininga takunnâlugu kamasiulauttulu Tungait tuttuKutingita
ununningit      2017-nami      1,326-iulaukKut     (ilauKasiutillugit   nuggait)    taggalu
katsungaittogasualluni akunganegajakKut 912-et 1,986-imut. Kaujisanniulauttumi
atuttaulauttuk takunnâlugu nalautsâgajakKut 1,045-init 281-nanut tuttunik taggâni,
siKinganilu,      katillugit.      Taimaigaluattilugu,        tamakkua      Kaujijaulauttuit
piggonakKogaluattilugit Tungait tuttungit pillugit, tamanna Kaujisanniulauttuk
takutitsigunnatuk         suli        ikittoninginnik         kamagijautsiagiaKanninginillu
angajukKauniujunut, tuttuniaKattatunullu.
xiii

ᓀᓪᓕᑎᕐᓯᒪᔪᖅ ᑐᓴᕐᑎᓯᒍᑎᒃ

ᓄᓇᕕᒻᒥᐅᑦ ᓄᓇᑦᓯᐊᕘᒻᒥᐅᓗ ᐃᓄᐃᑦ ᖃᐅᔨᒪᓲᑐᙯᑦ ᑐᑦᑐᐃᑦ ᐃᑭᑦᑐᐃᑦ ᐊᕐᕌᒍᓕᒫᒥ ᑑᕐᙰᑦ ᖃᕐᖃᖏᓐᓃᓲᖑᒋᐊᖏᑦ.
ᐃᓕᑕᕐᓯᓱᑎᒃ ᐊᑦᔨᐅᖏᑦᑐᒥᒃ ᑌᒣᓕᖓᐅᓯᖃᕐᑎᓗᒋᑦ, ᑲᑎᒪᕕᐊᐲᑦ ᑲᓇᑕᐅᑉ ᓂᕐᔪᑎᓂᒃ ᐊᑦᑕᓇᕐᑐᒦᓕᕐᓂᕋᕐᑕᐅᔪᑦ
ᑲᑎᒪᔨᖏᓐᓄᑦ    (COSEWIC)  ᓇᓗᓀᕐᓯᖃᒻᒥᖅ   ᑑᕐᙰᑦ    ᑐᑦᑐᖕᓐᓂᒃ    ᐃᓚᒋᔭᐅᓂᕃᑦᓱᑎᒃ   11-ᓄᑦ
ᐊᓯᕈᑦᑕᐅᑌᓂᑎᑕᐅᒍᓯᕐᓄᑦ ᑲᓇᑕᒥ. 2016-ᖑᑎᓪᓗᒍ, COSEWIC-ᑯᑦ ᖃᐅᔨᒋᐊᕐᑐᕕᓃᑦ ᑑᕐᙰᑦ ᑐᑦᑐᖏᓐᓂᒃ
ᐊᑦᑕᓇᕐᑐᒦᓐᓂᕋᕐᑕᐅᒍᑎᖏᓐᓂᒃ     ᑐᖕᖓᕕᖃᓗᐊᖕᖑᐊᓱᑎᒃ       ᓇᖏᐊᕐᓇᑐᒦᓐᓂᑯᖏᓐᓄᑦ       ᐱᑦᔪᑎᓕᒻᒥᒃ
ᐃᑭᑦᑑᓂᑯᖏᓐᓄᑦ.

ᑑᕐᙰᑦ ᑐᑦᑐᖏᑦᑕ ᐱᓪᓗᑯᒋᐊᓕᓕᕆᓂᕐᒧᑦ ᑲᑎᖕᖓᔨᐊᐱᖏᑦ ᐃᓂᓪᓚᑕᐅᓯᒪᔪᑦ 2013-ᖑᑎᓪᓗᒍ ᑲᒪᖁᔭᐅᑦᓱᑎᒃ
ᖃᐅᔨᓴᕐᑕᐅᒍᑎᒋᒋᐊᓕᖏᓐᓂᒃ. ᑑᕐᙰᑦ ᑲᑎᖕᖓᔨᐊᐱᖏᑦ ᑲᑐᑦᔨᖃᑎᒌᒍᑕᐅᔪᑦ ᐃᓚᐅᒍᒪᔪᓄᑦ ᐊᒻᒪᓗ ᑭᒡᒐᑐᕐᑎᖃᕐᓱᑎᒃ
ᑯᐯᒃ ᑲᕙᒪᖓᓂᒃ, ᓂᐅᕙᐅᓐᓛ ᐊᒻᒪᓗ ᓛᐸᑐᐊ ᑲᕙᒪᖓᓂᒃ, ᓄᓇᑦᓯᐊᕘᑦ ᑲᕙᒪᖓᓂᒃ, ᒪᑭᕝᕕᑯᓂᒃ, ᑲᑎᕕᒃ ᓄᓇᓕᓕᒫᑦ
ᑲᕙᒪᖓᓂᒃ (ᒥᕐᖑᐃᓯᕐᓂᓕᕆᕕᖏᑦ), ᑲᓇᑕᐅᑉ ᒥᕐᖑᐃᓯᕐᓂᓕᕆᕕᖓᓂᒃ, ᐊᒻᒪᓗ ᑑᕐᙰᑦ ᓂᕐᔪᑎᓕᕆᕐᒧᑦ,
ᐱᕈᕐᑐᓕᕆᓂᕐᒧᑦ ᐊᒻᒪᓗ ᐃᖃᓪᓕᐊᓂᓕᕆᕐᒧᑦ ᐊᓪᓚᕕᖓᓂᒃ (ᑭᒡᒐᑑᑦᔨᓱᑎᒃ ᑑᕐᙰᑦ ᓂᕐᔪᑎᓕᕆᓂᕐᒧᑦ ᐊᒻᒪᓗ
ᐱᕈᕐᑐᓕᕆᓂᕐᒧᑦ ᐊᐅᓚᑦᓯᖃᑎᒌᓐᓂᒧᑦ ᑲᑎᖕᖓᔨᖏᓐᓂᒃ). ᑑᕐᙰᑦ ᑲᑎᖕᖓᔨᐊᐱᖏᑦ ᐅᖃᖃᑎᒌᓚᐅᑎᓗᒋᑦ, ᓯᕗᓪᓕᐹᖅ
ᖃᖓᑦᑕᔫᒃᑯᑦ ᖃᑦᓯᐅᓂᖏᓐᓂᒃ ᕿᒥᕐᕈᓂᖅ ᐊᑑᑎᓯᒪᔪᖅ ᑑᕐᙰᑦ ᖃᕐᖃᖏᑦᑕ ᑐᑦᑐᖏᓐᓂᒃ ᒫᑦᔨ 2014-ᖑᑎᓪᓗᒍ (
Couturier ᐊᒻᒪᓗ ᐊᓯᖏᑦ 2015), ᐊᒻᒪᓗ ᖃᑦᓯᐅᓂᖏᑦ ᐃᒻᒪᖃᐅᓵᕐᑕᐅᓯᒪᔪᑦ 930 ᑐᑦᑐᐃᑦ. ᑲᔪᓯᑎᓗᒍᑦ ᓱᑯᐃᔦᓂᑎᒍᑦ
ᖃᐅᔨᒪᒐᓱᐊᕐᓂᖅ ᖃᑦᓯᐅᓂᖏᓐᓂᒃ, ᑭᒡᒐᑐᕐᑎᓕᒫᑦ ᑑᕐᙰᑦ ᑲᑎᖕᖓᔨᐊᐱᖏᑦ ᑮᓇᐅᔭᕐᑕᓰᓯᒪᔪᑦ ᐊᒻᒪᓘᓐᓃᑦ
ᐃᑲᔪᕐᓯᓯᒪᓂᒃᑯᑦ ᐱᓇᓱᐊᕐᕕᒥᑎᒍᑦ ᐃᑲᔪᕐᓂᐊᓱᑎᒃ ᑐᖓᓕᐊᓂᒃ ᑭᓯᑕᐅᒍᑎᖏᓐᓂᒃ ᑑᕐᙰᑦ ᑐᑦᑐᖏᓐᓂᒃ. ᑕᒪᓐᓇ
ᐊᑑᑎᓂᖃᓚᐅᔪᖅ ᒫᑦᔨ ᐊᒻᒪᓗ ᐁᕆᓕ 2017-ᒥ ᑌᒪ ᑭᖑᓂᐊᒍᑦ ᑌᒫᑦᓭᓇᒐᓚᒃ ᖃᓂᖕᖏᑐᒦᑦᓱᑎᒃ ᖃᐅᔨᓴᕐᓂᕆᓯᒪᔭᓯᑎᑐᑦ
2014-ᒥ ᐊᑑᑎᓂᖃᕐᓯᓱᑎᒃ.

ᓄᓇ ᖃᐅᔨᓴᕐᕕᐅᔪᖅ ᐊᕕᑦᑐᑕᐅᓯᒪᓂᖃᓚᐅᕐᑐᖅ ᒪᕐᕉᓕᖓᑎᑕᐅᑦᓱᓂ, ᐊᑐᐊᕐᓂᒥ ᐊᒻᒪᓗ ᖃᕙᖕᖓᓂᕐᒥ,
ᑎᑎᕐᑕᐅᓯᒪᔪᖅ 58° 55’ N ᖁᓛᓂ. ᓂᕆᐅᒋᔭᐅᓚᐅᔪᖅ ᑐᑦᑐᐃᑦ ᐊᒥᓲᓂᕐᓴᐅᒐᔭᕆᐊᖏᑦ ᐊᑐᐊᕐᓂᖓᓂ, ᑌᒣᒻᒪᑦ
ᖃᐅᔨᓴᕐᑕᐅᓂᕐᓴᐅᑎᑕᐅᓚᐅᔪᖅ ᑌᑲᓂ. ᐊᑐᐊᕐᓂᒥᒃ ᖃᐅᔨᓴᕐᓂᖅ ᓴᓂᕋᑦᓯᒌᑦᑐᓂᒃ ᕿᒥᕐᕈᔭᐅᑎᑕᐅᓚᔪᖅ ᓂᒋᕐᒧᑦ ᐊᒻᒪᓗ
ᐅᐊᓐᓂᒧᑦ     3 ᑭᓛᒥᑕᓂᒃ ᖃᓂᖕᖏᑎᒌᓐᓂᖃᕐᑎᑕᐅᔪᓂᒃ ᐊᒻᒪᓗ ᖃᔭᖕᖓᓂᕐᒥᒃ ᖃᐅᔨᓴᕐᓂᖅ 4 ᑭᓛᒥᑕᓂᒃ
ᖃᓂᖕᖏᑎᒌᓐᓂᖃᕐᑎᑕᐅᑎᓪᓗᒍ. ᕿᒥᕐᕈᔪᐃᑦ ᑭᓯᑦᑐᕕᓃᑦ ᑐᑦᑐᓂᒃ ᑲᑎᖕᖓᔪᓂᒃ ᐊᒻᒪᓗ ᐆᒪᔪᕐᓂᒃ ᐊᓯᖏᓐᓂᒃ
ᑕᑯᔭᕐᒥᓂᒃ. 91 ᕕᑦᓱᑎᒃ ᓴᓂᕋᑦᓯᒌᑦᑐᓂᒃ ᐅᑎᕐᑕᑐᕕᓃᑦ ᓱᒃᑫᑑᑦᓱᑎᒃ ᐊᒻᒪᓗ ᓇᕿᑦᑐᒥ ᖃᖓᑕᑦᓱᑎᒃ. ᓯᓚᐅᑉ ᐱᐅᓯᖓ
ᐊᒻᒪᓗ ᓂᑦᑕᓂᖓ ᐱᐅᔪᒻᒪᕆᐅᓚᐅᔪᖅ ᐅᓪᓗᓂ ᖃᖓᑕᓂᖏᓐᓂ. ᑲᑎᓕᒫᕐᓱᑎᒃ ᓴᓂᕋᑦᓯᒌᑦᑐᓂ ᐅᑎᕐᑕᕕᕕᓂᖏᑦ 7,722
ᑭᓛᒥᑕᐅᓚᐅᔪᑦ ᐊᒻᒪᓗ ᖃᐅᔨᓴᕐᕕᓕᒫᖓ 30,625 ᑭᓛᒥᑌᑦ ᓯᒃᑭᑕᓪᓗᐊᖑᑦᓱᑎᒃ Okak Bay ᐊᒻᒪᓗ Killiniq Island
ᐊᑯᓐᓂᖏᓐᓂ. ᐱᖓᓱᐃᑦ ᐊᒪᕈᐃᑦ ᐃᓚᒌᑦ (8 ᐊᒪᕈᐃᑦ), 14 ᓇᓄᐃᑦ, ᐊᒻᒪᓗ ᐊᑕᐅᓯᖅ ᑎᕆᒐᓐᓂᐊᒃ ᖃᑯᕐᑕᖅ
ᑕᑯᔭᐅᓚᐅᔪᑦ. 58-ᕕᑦᓱᑎᒃ ᑐᑦᑐᐃᑦ ᐃᓚᒌᑦᑐᑦ ᑕᑯᔭᐅᓚᐅᔪᑦ ᓴᓂᕋᑦᓯᒌᑦᑐᓂᒃ ᐅᑎᕐᑕᓂᕐᒥ ᑲᑎᓕᒫᕐᓱᑎ 610 ᑐᑦᑐᐃᑦ.
ᑐᑦᑐᐃᑦ ᐃᓚᒌᑦᑐᑦ ᑕᑯᔭᐅᔪᑦ ᖃᑦᓯᐅᓂᖏᑦ ᐊᑦᔨᒌᓚᐅᔪᖕᖏᑐᑦ 1-ᒥᑦ 38-ᓄᑦ ᑎᑭᖃᑦᑕᓱᑎᒃ ᒥᑦᓯᖃᕐᓱᑎᒃ 10.5-ᓂᑦ
ᑐᑦᑐᓂᒃ ᐃᓚᒌᑦᑎᑐᓂᒃ. ᑐᑦᑐᐃᑦ ᐃᓚᒌᑦᑎᑐᑦ 2017-ᒥ ᒪᕐᕈᕕᓪᓗᐊᑐᒥᒃ ᐊᒥᓲᓂᕐᓴᐅᒪᓴᓚᐅᕐᑐᑦ 2014-ᒥᓂᑦ (5.4).
2014-ᒥ, ᑭᓯᑕᐅᒪᓂᖏᑦ ᐅᓄᕐᓂᓴᐅᓚᐅᔪᑦ, ᓄᕐᕋᖏᑦ ᐃᓚᐅᑎᓪᓗᒋᑦ 23.1 ᐳᓴᓐᑎᐅᓱᑎᒃ ᐆᒪᔪᕐᓂ ᑕᑯᔭᐅᔪᓂ,
ᑌᒣᑐᐊᕐᐸᑦ ᐃᓱᒪᓇᖕᖑᐊᑐᖅ ᐊᒥᓱᖕᖑᐸᓪᓕᐊᒐᔭᕐᓂᖏᓐᓂᒃ ᖃᐅᔨᓴᕐᑕᐅᒍᑎᕕᓂᖏᑦ ᐃᑉᐱᒋᑦᓱᒋᑦ. ᑐᑦᑐᐃᑦ
ᑕᑯᔭᐅᓚᐅᔪᖕᖏᑐᑦ ᖃᕙᖕᖓᓂᖓᓂ, ᑐᑦᑐᐃᑦ ᐃᓚᒌᓈᕐᑎᑐᑦ ᑕᑯᔭᐅᕙᓪᓗᓱᑎᒃ Nachvak Fjord ᐊᑐᐊᕐᓂᖓᓂ.
ᖃᓂᖕᖏᑐᒥ ᑭᓯᑕᐅᒍᑎᕕᓂᖏᑦ ᑑᕐᙰᑦ ᑐᑦᑐᖏᑦ 2017-ᖑᑎᓪᓗᒍ 1,326 ᖑᓚᐅᔪᑦ (ᓄᕐᕋᖏᑦ ᐃᓚᐅᑎᓪᓗᒋᑦ)
ᓱᕐᖁᐃᓯᐊᕐᑎᓗᒋᑦ ᑭᓯᑕᐅᒪᓂᖏᑦ 912-ᒥᑦ 1,986. ᐃᒻᒥᒎᓈᕐᑎᑐᓂᒃ ᖃᐅᔨᓴᕐᓂᖅ ᐃᒻᒪᖃᐅᓵᕐᓂᖃᕐᑎᓗᒍ 1,045ᓂᒃ
ᐊᒻᒪᓗ 281ᓂᒃ ᑐᑦᑐᓂᒃ ᐊᑐᐊᕐᓂᒥ ᐊᒻᒪᓗ ᖃᕙᖕᖓᓂᐅᑉ ᐃᒻᒥᒎᓈᕐᑎᑎᑕᐅᓂᖏᑦ, ᐃᒻᒥᒍᑦ. ᑌᒣᒐᓗᐊᕐᑎᓗᒍ,
ᑭᓯᑕᐅᔪᐃᑦ ᓴᑑᒪᓇᕐᑑᓱᑎᒃ ᑑᕐᙰᑦ ᑐᑦᑐᖏᑦ, ᑕᒪᓐᓇ ᖃᐅᔨᓴᕐᑕᐅᓂᖓ ᓱᕐᖁᐃᓯᓚᐅᕐᑐᖅ ᐃᑭᑦᑑᒋᐊᖏᓐᓂᒃ ᐊᒻᒪᓗ
ᐃᑉᐱᒋᔭᐅᑦᓯᐊᒋᐊᖃᕐᓱᑎᒃ ᐊᐅᓚᑦᓯᔪᓄᑦ ᐊᒻᒪᓗ ᑐᑦᑐᓲᓄᑦ.
xiv

Sommaire

Les Inuit du Nunavik et du Nunatsiavut savaient qu’une petite population de caribous séjournait
à l’année longue dans les Monts Torngat. Reconnaissant le statut unique de cette population, le
Comité sur la situation des espèces en péril au Canada (COSEPAC) a récemment identifié le
caribou des Monts Torngat comme l’une des 11 unités de conservation au Canada. En 2016, en se
basant principalement sur les risques inhérents associés à la faible taille de cette population, le
COSEPAC jugeait que le caribou des Monts Torngat était en voie de disparition.

En 2013, un comité informel a été créé pour discuter des besoins de recherches sur le caribou des
Torngat. Le comité Torngat caribou est constitué d’une coalition de groupes intéressés et inclut
des représentants du gouvernement du Québec, du gouvernement de Terre-Neuve et Labrador,
du gouvernement du Nunatsiavut, de la corporation Makivik, du gouvernement régional Kativik
(Parcs Nunavik), de Parcs Canada, ainsi que du Torngat Wildlife, Plants and Fisheries Secretariat
(représentant le Torngat, Wildlife and Plants Co-Management Board). À la suite de discussions
au sein du comité, le premier inventaire aérien a été effectué en mars 2014 et a permis d’estimer
la taille de cette population à 930 caribous (Couturier et al. 2015). Afin de poursuivre le suivi
scientifique de cette population, les membres du comité ont dédié des fonds et/ou des
contributions en espèces à la réalisation d’un second inventaire systématique du troupeau de
caribous des Monts Torngat. Cet inventaire a été effectué en mars/avril 2017 suivant une méthode
similaire à celle employée en 2014, soit l’échantillonnage par distance.

L’aire d’étude a été scindée en deux strates géographiques (nord et sud) à la latitude 58° 55’ N.
Comme il était prédit que la densité de caribous serait plus élevée dans la strate nord, un effort
d’échantillonnage supérieur a été alloué à cette strate. Des transects parallèles est-ouest étaient
espacés de 3 km dans la strate nord et de 4 km dans la strate sud. Les observateurs ont noté les
groupes de caribous ainsi que les autres mammifères vus sur 91 transects survolés à basse altitude
et vitesse réduite. Lors des jours de survols, les conditions météorologiques et la visibilité ont été
excellentes. La longueur totale des transects était de 7 722 km alors que l’aire d’étude totalisait
30 625 km2 entre Okak Bay et l’île Killiniq. Trois meutes de loups (8 loups), 14 ours blancs ainsi
qu’un renard arctique ont été observés durant l’inventaire. Ce furent 58 groupes de caribous qui
ont été notés sur les transects pour un total de 610 caribous. La taille des groupes a varié de 1 à
38 caribous avec une moyenne 10,5 caribous par groupe. La taille des groupes a presque doublé
en 2017 par rapport à celle de 2014 (5,4). À l’instar de 2014, le recrutement était élevé avec une
estimation de 23,1% de faons dans la population ce qui théoriquement permet une croissance
démographique. Aucun caribou n’a été observé au sud du fjord Hebron, tandis que la majorité a
été enregistrée au nord du fjord Nachvak. La taille du troupeau des Torngat a été estimée à 1 326
caribous (incluant les faons) pour un intervalle de confiance compris entre 912 et 1 986 caribous.
L’échantillonnage stratifié par distance a estimé les caribous présents dans les strates nord et sud
respectivement à 1 045 et 281 bêtes. Toutefois, bien que ces résultats puissent sembler
encourageants pour le troupeau des Monts Torngat, cet inventaire a confirmé que ce troupeau est
toujours petit et que cela demande une grande attention de la part des gestionnaires et des
usagers.
1. Introduction

In North America, at least three caribou (Rangifer tarandus) ecotypes are used by biologists to
describe differences in the ecology and behaviour of caribou living in various boreal, sub-arctic
and arctic landscapes and habitats. We employ this classification system for convenience, and as
convention, recognizing that it is not necessarily shared by Indigenous Peoples. Sedentary
caribou, also called forest-dwelling, woodland or boreal caribou, are found in low density south
of tree-line, primarily in boreal forest landscapes. Migratory caribou, also referred to as barren-
ground or tundra caribou, can occur at high density and typically undertake large-scale annual
migrations between boreal forests and Arctic tundra. In the 1980s and 1990s, migratory caribou
of the George River Herd (GRH) were plentiful and roamed across 800,000 km2 of boreal and
arctic habitats in Labrador and Northern Quebec. The GRH decreased from 823,000 caribou in
1993 (Couturier et al. 1996), to 385,000 in 2001 (Couturier et al. 2004), and to 76,000 in 2010, 27,600
in 2012, 14,200 in 2014 and to 8,900 caribou in 2016 (QC Government and NL Government,
unpubl. data). A third ecotype that was described by biologists refers to small caribou
populations living in mountainous landscapes and which make small-scale migrations between
various elevations to fulfill their ecological needs during different seasons. The Torngat
Mountains Caribou Herd (hereafter Torngat caribou or Torngat Herd) located in northern
Labrador and northern Quebec near the Ungava Bay belongs to this ecotype. The range of the
GRH overlapped with that of the Torngat Herd during the 1980s and 1990s but is presently
believed to range south of the Torngat Herd (Bélanger 2017a,b). The sedentary ecotype in
Labrador and Quebec is located in the boreal forests to the south and do not overlap with the
Torngat herd.

Noted differences in space use (Schaefer and Luttich 1998; QC Government and NL Government,
unpubl. data), movement rate, body size and shape (Couturier et al. 2010) and genetics (Boulet et
al. 2009) have been postulated as evidences to support the identification of the Torngat caribou
as distinct from migratory and sedentary caribou living in the region. An Inuit Knowledge study
heard that Inuit could identify Torngat caribou by their location, habitat, appearance, taste and
behaviour (Wilson et al. 2014). In 2011 the Committee on the Status of Endangered Wildlife in
Canada (COSEWIC) recognised the Torngat Mountains Caribou Herd as one of eleven living
Designatable Units for caribou conservation across Canada (COSEWIC 2011). In December 2016,
based on population and demographic assessment criteria, COSEWIC declared the status of the
Torngat Mountains Caribou Herd as Endangered.

Due to an annual range that spans over Nunavik, Nunatsiavut, and Nunavut, the Torngat
Mountains Caribou Herd is of interest for two provinces, six governments, two parks and two
Co-Management Boards. Out of necessity and this shared interest, an informal Torngat Caribou
Technical Committee (hereafter the Torngat Committee) has been in place since 2013. The shared
goal of the Torngat Committee is to deliver a coordinated effort to generate information about
the herd, with the hopes that this information and the ties built through working together will
lead to coordinated management of the herd in the future. The informal Torngat Committee
includes representatives from the Government of Quebec, the Government of Newfoundland &
2

Labrador, Nunatsiavut Government, Makivik Corporation, Kativik Regional Government
(Nunavik Parks), Parks Canada, and Torngat Wildlife and Plants Co-Management Board.

The Torngat Wildlife and Plants Co-Management Board hosted a Torngat Mountains caribou
workshop in 2008. Many of the specific research priorities that eventually materialized were first
identified here. In the several years that followed, the Board conducted exploratory work
including reconnaissance flights and interviews with Indigenous Knowledge-holders. Research
questions, priorities, and approaches were refined through these processes, through continuing
dialogue with the communities of Kangiqsualujjuaq and Nain, and through the partnerships that
emerged.

In 2013, Wilson et al. (2014) completed a comprehensive Inuit Knowledge study that provided
important information to support research and management. Most participants interviewed by
Wilson et al. (2014) expressed some level of concern about the future of Torngat caribou. The
majority of participants considered over-hunting to be a cause for concern, while several
participants also believed that other threats such as predators, disturbance, development activity
and a changing environment could also be detrimental to Torngat caribou sustainability.

From 2011 to 2013, the Quebec and Newfoundland and Labrador governments in partnership
with the Torngat Wildlife and Plants Co-Management Board deployed 35 satellite radio-collars
on adult caribou of the Torngat Herd. This radio-telemetry study has significantly added to our
understanding of space-use and survival of Torngat caribou (Bélanger 2017a,b). In addition,
telemetry has described a decline in range overlap between 1990 and 2015 with the GRH, from
almost 50% of the range in the early 1990s to less than 10% between 2010 and 2015. Little range
overlap exists now between these two herds.

Based on specific requests made by both communities and following discussion at the Torngat
Committee, the first aerial population survey ever for Torngat caribou was carried out in March
2014 (Couturier et al. 2015). That survey estimated herd size at 930 caribou (confidence interval:
616 to 1,453).

The Torngat Committee held consultations with the communities of Kangiqsualujjuaq and Nain
and those discussions were used to develop a research approach that was responsive to the
received community input. The need for a second survey was expressed as early as 2016. The
survey was discussed within the Torngat Committee and the design was refined based on
previous consultations, Inuit Knowledge, radio-telemetry data, and lessons learned in the first
aerial survey in 2014. Latest public consultation meetings were held in early March 2017 in
Kangiqsualujjuaq and Nain to consider additional studies of Torngat caribou based on
demographic indicators and satellite telemetry. To investigate the current status of the Torngat
caribou, two studies and their respective goals were presented and led to an open discussion with
local people interested in caribou. First, the aerial survey project was strongly supported by Inuit
from both communities. The study area for this survey was refined based on comments provided
during these consultations, with significant additional coverage added to the southeast of
3

Kangiqsualujjuaq. Second, the Torngat Committee also presented a proposal to place tracking
collars on 25 caribou in order to document space use and survival and to support future surveys.
This proposal received mixed support, with most individuals from one community supporting
the study, while most participants from the other were opposed to the work. Based on this
feedback it was decided not to proceed with the collaring project.

A second aerial survey was performed in March and April 2017 with close collaboration of all
partners of the Torngat Committee interested in the conservation of Torngat caribou. This report
summarizes technical and biological information gathered during the Torngat Herd aerial
survey. As it was in September of 2014 following the first population survey, it is planned to share
the final survey results during public consultations in the Inuit communities of Nain and
Kangiqsualujjuaq.
4

2. Methods

An aerial survey was completed in March and April 2017 using an A-Star AS350 B2 helicopter
(Figure 1) chartered from Universal Helicopters Newfoundland and Labrador Ltd. A detailed
timeline of the survey project including daily flying time is reported in Appendix A.

Figure 1. Project field team of the Torngat Mountains Caribou Herd survey, spring 2017. From
left to right: Serge Couturier, wildlife biologist consultant; Steve Lodge, helicopter pilot; Aaron
Dale, project manager for the Torngat Wildlife and Plants Co-Management Board; Tommie
Unatweenuk, Inuit expert from Kangiqsualujjuaq, QC; and Ryan Merkuratsuk, Inuit expert
from Nain, NL.

2.1 Study area and survey design
The 2017 survey area was similar to that of 2014 (see Couturier et al. 2015 for details) as it was
designed to cover the population’s historic range, based on the findings of Schaefer and Luttich
(1998) and Inuit knowledge. The Torngat caribou range appears to have retracted northward in
the last few decades (Wilson et al., 2014; Bélanger 2017a). The survey area was discussed with
Inuit hunters, including during the pre-survey consultations of March 2017. Early during the
planning, the Torngat Committee discussed restricting the survey to the northernmost part of the
5

range (e.g. north of Hebron Fjord), where it was expected to find most of the Torngat caribou,
based on radio-collaring data and on Inuit Knowledge. Although the available information from
the 2014 survey and other observations suggested that few Torngat caribou are found south of
Hebron Fjord, it was decided to include again this area in 2017 to further investigate whether
Torngat caribou are currently present in the southern part of their historical range.

Bounded by the Labrador Sea in the east and Ungava Bay in the west, the landscape of the Torngat
Mountains is characterized by a highly fragmented coast with numerous fiords and river valleys.
To standardize the survey area size determination, we used all external transects and calculated
a hull polygon using a Geographical Information System (GIS) (ArcMap 10.0, www.esri.com). A
1-km buffer was added to this polygon to take the approximate distance of line of sight during
the survey into consideration.

Two minor additions were made to the 2014 study area following comments received from
Torngat Wildlife and Plants Co-Management Board members and Inuit experts during pre-
survey consultations in March 2017 (Figure 2). First, the study area was slightly increased with
the westward extension of six transects (transect 31 to 36) by about 22 kilometers each. Also, two
transects (37 and 38) were extended westward to add survey effort northeast of Kangiqsualujjuaq
and to provide better coverage of the Kuururjuaq Park (Figure 2). These two westward extensions
represent an increase of 1,234.6 km2 compared to 2014, yielding a total study area of 30,624.8 km2
in 2017.

To increase sampling effort in the northern part of the study area, where higher densities of
caribou were expected, the sampling design was modified from the method used in 2014. Instead
of 4-km spacing throughout, as in 2014, transects in the north were spaced 3-km apart in 2017,
which increased the sampling intensity in the higher density stratum. The study area was then
divided in two geographic strata along a line midway between transects 39 and 40 on latitude 58°
55’ N (Figure 2) for data analysis in distance sampling modelling.
6

Figure 2. Map of the study area and transects planned during the spring 2017 survey of the
Torngat Mountains Caribou Herd. The dashed lines show new areas added in 2017 (1,235 km2).
7

2.2 Distance sampling
The Torngat caribou herd range is located in the Arctic Cordillera ecozone and comprised of open
tundra and alpine habitats offering excellent visibility during aerial survey. As in 2014, the 2017
survey method is based on distance sampling, which presents some benefits over fixed-width
strip survey, notably an embedded visibility correction factor (see Couturier et al. 2015 for
details). Distance sampling is similar to conventional fixed-width strip survey except that the
perpendicular distance from the survey line to the animals is recorded and the strip survey width
is not fixed, but theoretically infinite (Buckland et al. 2001, 2004). Le Moullec et al. (2017) reported
that Distance sampling is currently one of the most widely used monitoring methods to estimate
animal population size in the world. In their study of Svalbard reindeer, they showed that
Distance sampling population estimates were not statistically different from known population
sizes, confirming the efficiency of the Distance sampling method. They also reported that in the
open tundra landscape, the detection of reindeer should in principle only vary with distance from
the transect line because visibility is good. Distance sampling was also used to estimate
populations of caribou in Nunavut (Jenkins et al. 2013; Campbell et al. 2015) and in
Newfoundland (Fifield et al. 2013), muskox (Ovibos moschatus) in Nunavut (Jenkins et al. 2011),
moose (Alces alces) in British Columbia (Thiessen 2010; McNay 2013), and polar bear (Ursus
maritimus) in the Barents Sea (Aars et al. 2009).

Distance sampling generates a density estimate from the number of groups detected on transect,
the perpendicular distance from the transect line, and the mean size of the groups that were
detected. Each caribou observation contributes to estimating the density in a study area. The
detection of animals by the observers is expected to decrease with their distance from the aircraft,
so it is presumed that distant groups are more likely to be overlooked than nearby groups.
Distance sampling compensates for this effect by modeling how detectability decreases with
distance. Then, this detection function is used to estimate the proportion of the caribou that were
likely present but which were not detected by the observers. The estimated caribou density is
later converted to a herd size estimate based on the area surveyed.

Buckland et al. (2001, 2004, 2015) recommend that Distance sampling fulfill these basic statistical
assumptions:
     1. A large number of transects are randomly allocated in the study area independently of
     the animal distribution of interest.
     2. All animals directly on transect are detected.
     3. Animals do not move in response to the observer before they can be detected or animal
        movement is slow relative to the observer movement.
     4. Distances are measured accurately.

In order to extrapolate observations from transects to the entire study area, including areas that
were not surveyed, transect lines must be established in an unbiased design via random or
systematic sampling. Distance sampling requires that a large number of transects are sampled
(>40 according to Fifield et al. 2013), and that their location is independent of the animals’
locations. In the 2014 Torngat caribou survey, transects were systematically allocated from a
8 random starting latitude in the south of the study area (Couturier et al. 2015). In 2017, it was decided to use the same transect grid for the southern stratum and to switch to a 3-km spacing in the northern stratum. Systematic placement with a random start point is more efficient than a completely random design. Parallel transect lines were spaced every 3 or 4 kilometers running east/west. Increased sampling effort was allocated in the northern stratum because the available information suggested that caribou density was higher in that area. The sampling effort of the southern stratum with 4-km spacing between transects was similar to the design used in 2014. As suggested by Marques et al. (2006), perpendicular distances were estimated during post- survey analysis with a GIS. It is difficult for the helicopter pilot to fly exactly over the transect line during the survey. Therefore, the perpendicular distance of each group of caribou from the actual flight track was measured, and not the distance from the theoretical transect line. This was based on actual flight tracks monitored every second and overhead GPS positions of caribou clusters. This distance measurement method is more accurate than the other method based on sighting angle and aircraft altitude (Marques et al. 2006). Descriptive statistics analysis were performed in software JASP version 0.8.2 for Macintosh (JASP Team 2017) while all statistical analysis related to Distance Sampling were done using the software Distance Version 7.1 Release 1, free and available on-line (http://distancesampling.org). This software was used to model detection functions and estimate density with Conventional Distance Sampling (CDS) and Multiple Covariate Distance Sampling (MCDS). Using CDS, the probability of detecting a caribou group (i.e. the detection function) was modeled based solely on perpendicular distance from the flight track. In order to see if variables other than distance alone affected the detection probability, MCDS was also used. Snow and slope covariates (see next section for more details) evaluated at local scale (i.e. about 100 m) were tested individually and in concert during MCDS model fitting. In Distance 7.1, CDS and MCDS engines were run to test detection function models recommended by Marques et al. (2007) and Thomas et al. (2010). These models and their abbreviations are described by their key functions and adjustment terms in Table 1. Both MCDS models were run with two covariates alone and together. A total of six models were fit with the CDS engine while six models were fit using the MCDS engine. Distance 7.1 can automatically select the number of adjustment terms using a model selection method based on Akaike Information Criteria (AIC). In CDS, the maximum number of adjustment terms was set to five. As recommended by Marques et al. (2007), we limited the number of adjustment terms to two in MCDS. The chance of fitting an implausible detection function is decreased with fewer adjustment terms in MCDS. Adjustment terms and covariates are performing similar tasks; explaining patterns in detectability not explained by the key function (Rexstad, E., pers. comm.). Density estimates were derived from line-transect data and detection function models as recommended by Buckland et al. (2001) and Thomas et al. (2010). Best models were selected on
9

their AIC values. Readers can consult these keynote references for more information on model
selection and density estimation. In line transect sampling, the variance of the encounter rate
estimator usually dominates the overall variance of the object density, and it is also the more
difficult component to estimate (Thomas et al. 2010). Fewster et al. (2009) presented a simulation
study comparing some density variance estimation methods. In general, considering both
estimator performance and simplicity, it is recommended to use density variance estimation
method O2 for systematic parallel line placement design like in our study (Thomas, L., pers.
comm.). Instead of using the default setting method R2, the variance estimation method O2 was
selected during all analyses in Distance 7.1. For all distance sampling parameters the notation
presented in Distance 7.1 was applied in this report where:
                n: Number of caribou groups detected during the survey
                k: Number of transects
                W: Width in meters of line transect (highest distance recorded during survey)
                L: Total length in km of survey transects
                ESW: Effective strip width in meters (ESW= W*p)
                p: Probability of detecting a caribou group during the survey
                E(S): Caribou group size estimated by Distance using regression
                ER: Encounter rate (ER= n/L)
                D: Estimate of density of caribou per km2
                CV: Coefficient of variation

Table 1. Distance sampling detection function recommended by Thomas et al. (2010) and Marques
et al. (2007) that have been used in data analysis of the 2017 Torngat Mountains Caribou Herd
aerial survey. Models are described by their key functions and adjustments terms.

 Model description in CDS and MCDS                     Covariates    Abbreviations
 (key + adjustment terms)
 CDS Uniform key with cosine                                         CDS Unif Cos
 CDS Half-normal key with cosine                                     CDS HN Cos
 CDS Half-normal key with simple polynomial                          CDS HN Poly
 CDS Half-normal key with Hermite polynomial                         CDS HN Herm
 CDS Hazard-rate key with simple polynomial                          CDS HR Poly
 CDS Hazard-rate with Hermite polynomial                             CDS HR Herm
 MCDS Hazard-rate key with simple polynomial           snow          MCDS HR Poly snow
 MCDS Hazard-rate key with simple polynomial           slope         MCDS HN Poly slope
 MCDS Hazard-rate key with simple polynomial           snow slope    MCDS HN Poly snow slope
 MCDS Half-normal key with cosine                      snow          MCDS HN Cos snow
 MCDS Half-normal key with cosine                      slope         MCDS HN Cos slope
 MCDS Half-normal key with cosine                      snow slope    MCDS HN Cos snow slope
10
2.3 Survey implementation
In the field, the survey method was based on the following criteria (as in 2014):
- helicopter flew at 150 km/h (about 80 knots) and 150 metres of altitude;
- four main observers including pilot;
- photos and GPS location taken of each group of caribou observed.
The helicopter acted as a single sampling platform (see Buckland et al. 2001), with four observers,
including the pilot, searching for caribou. The four observers remained the same during the entire
fieldwork to maintain the uniformity over the survey period. During the period when the survey
team was based out of Kangiqsualujjuaq, it was possible to add a fifth person (TU) that was sitting
in the middle of the back seat. The fifth person was present over transects 98 to 49, located in
stratum North (Figure 2). When the helicopter was based elsewhere, the load capacity of the
helicopter made it impossible to carry a fifth person. Four caribou groups were recorded at the
same time by the fifth person and by another observer while two groups were reported only by
the fifth person. It must be noted that visibility is excellent in this type of aircraft and that it is not
unusual for more than one observer to detect a caribou group at the same time. Considering the
need for uniformity during the entire survey and to avoid possible bias in observer probability
detection between strata, it was decided to remove these two caribou groups that were observed
only by the fifth person from the herd size estimation. However, these two groups were
considered in the sex and age classification.
Upon detection, all caribou clusters (groups of one or more caribou) were approached to record
their location. Specifically, the helicopter flew off-transect to the caribou and recorded their
location with handheld GPS. If the caribou moved during the approach, the location where the
animals were first seen based on tracks in the snow was recorded. Caribou that were more than
100 meters apart were considered separate groups.
Low snow cover and steep slopes could reduce the probability of detecting caribou groups, so as
in 2014, snow and slope were included as covariates in our MCDS models. Slope and snow cover
were recorded at two spatial scales for each group of caribou observed: the coarse scale represents
the area extending 1,000 m around the caribou observation while the local scale represents the
area within 100 m of the observation. The habitat slope score was coded as 1 for flat terrain, 2 for
moderately sloped or rolling habitat, and 3 for mountainous or steep terrain. The snow cover was
visually estimated as percentage in 11 category classes (i.e. 0%, 10%, 20%, 30%, etc.) at both scales.
Visibility, temperature and percent cloud cover were estimated on each transect. Visibility was
recorded as 3 for excellent (≥40 km), 2 for good (10-40 km) and 1 for poor (≤10 km).
Compared with methods used in 2014, one small improvement was made during the GPS
tracking of the flight. Instead of two second intervals, the tracking interval of the two handheld
Garmin GPSmap 62S was set to one second. This improvement represents a better smoothing of
the tracking and higher precision during post-survey perpendicular distance measurements.11 Observations of other mammal species such as polar bear, wolf (Canis lupus), arctic fox (Vulpes lagopus), and moose were also recorded during the survey. 2.4 Recruitment and sex ratio To estimate recruitment and the adult sex ratio, the classification method was similar to the method developed in 2014 during the population survey (Couturier et al. 2015). Each caribou group recorded on and off transect was photographed with a hi-resolution digital camera (Nikon D600; 24.3 megapixel FX-format full-frame 24X36 mm) coupled with a GPS and a 70-300 mm telephoto zoom lens (Nikkor). It was generally possible to take 8 to 10 photos of a group in less than 30 seconds, which allowed quick, accurate measurement of the number of caribou regardless of group size. The use of a telephoto zoom lens made it possible to stay farther from the caribou, further reducing disturbance. Analysis of georeferenced photographs also permitted additional accuracy of classification by sex and age than would have been possible with live classification in the field from the helicopter. Digital photographs were enhanced for exposure and color using Lightroom 6 (Adobe Systems Canada, Ottawa, Canada). Caribou were classified in six categories based on presence of vulvae or penis, head and body size, and antler condition (i.e. present or casted, one or two antlers, velvet on calf spike antlers, etc.): 1- adult antlered female, 2- adult unantlered female, 3- adult antlered male (younger, some may have casted one antler), 4- adult unantlered males (older), 5- calves, and 6- unknown sex and age. The later unknown class occurred when caribou were mostly found in unsafe areas (i.e. risk of falling in rocky area), when a group split during the short chase, or when fuel limitations restricted the time devoted to the classification. Photographs were also inspected for evidence of radio-collars on caribou. From a compilation of all caribou observations (on and off transect), it was possible to compute the ratio of calf/100 cows, the percentage of calves in the population, and the adult sex ratio as male/100 cows. These demographic parameters are fundamental in the monitoring of a caribou herd as they provide information to determine the population trend, a comparison of the sex specific survival rates and a precise indication of productivity.
12

3. Results

An aerial survey was completed in spring 2017 over the historical range of the Torngat Mountains
Caribou Herd. The fieldwork lasted 26 days from March 20 to April 14 2017 (the complete timeline
is presented in Appendix A). It was decided to start the survey in the north and to proceed
southwards to better follow the expected decreasing density gradient from north to south. Nine
full or partial days were lost due to weather conditions. Once the aerial survey began, snowfalls
and blowing snow occurred on April 1st, April 6th, April 8th, April 10th, and April 12th. The new
snow covered old tracks and provided a good visibility contrast with caribou and their fresh
tracks.

Visibility was excellent during most transects (Appendix B). Of 91 transects, 82 had excellent
visibility during the survey, while eight transects had good visibility and only one was poor (94).
In the northern part of the study area where transects were spaced 3-km apart, and with excellent
visibility, it was sometimes possible to have complete coverage of the area with maximum
visibility between 1,500 and 2,000 metres on each side of the aircraft. This means that a group
could be detected close to the next transect. This also means that the 3-km spacing is the minimum
value that could be fitted in this study area to a Distance sampling design or even to a fixed-width
transect design. Less than 3 km could represent a confusing situation where it could become
difficult to determine if groups had been already recorded on a previous transect.

The fieldwork lasted longer than expected because of uncontrolled factors including helicopter-
related problems and weather. Nevertheless, the survey team successfully covered the whole
study area as planned from transect 98 situated to the north near Killiniq, to transect 1 in the south
near Okak Bay (Figure 2). A total of 8,701.3 km of transects were planned during the aerial survey.
The survey team flew 7,721,9 km or 89% of the total transect length that was planned (Appendix
C and Figure 3). It was decided in the field to skip every second transect south of transect 13
because the maintenance schedule of the helicopter would have forced the aircraft to go back to
Happy Valley - Goose Bay for two days or more. The high cost of fuel in the Hebron area also
contributed to the decision to skip some transects south of transect 13; both the helicopter
maintenance delay and the high cost of fuel would have had a strong budgetary impact. Further,
it was expected that few Torngat caribou would be present south of Hebron: no caribou were
observed south of transect 19 in March 2014 (Couturier et al. 2015). Consequently, it was decided
to skip even numbered transects from 12 to 2, (Total 717.8 km, Appendix C and Figure 3) while
maintaining the full extent of the study area.

A total of 128.1 km were not flown on transect because of localized weather problems. Some
transects were truncated by a few kilometers during flight due to weather, mostly caused by
localized low clouds and fog patches near the seacoast (Appendix C and Figure 3). Also, transect
92 was skipped (18.1 km) because of low clouds and fog patches created by nearby open water
(Figure 3).
You can also read