FAIRFAX BOULEVARD COMMERCIAL DEVELOPMENT MARKET ANALYSIS - FAIRFAX, VA PREPARED BY
←
→
Page content transcription
If your browser does not render page correctly, please read the page content below
FAIRFAX BOULEVARD
                COMMERCIAL DEVELOPMENT
                   MARKET ANALYSIS

                        FAIRFAX, VA

PREPARED BY

DECEMBER 2013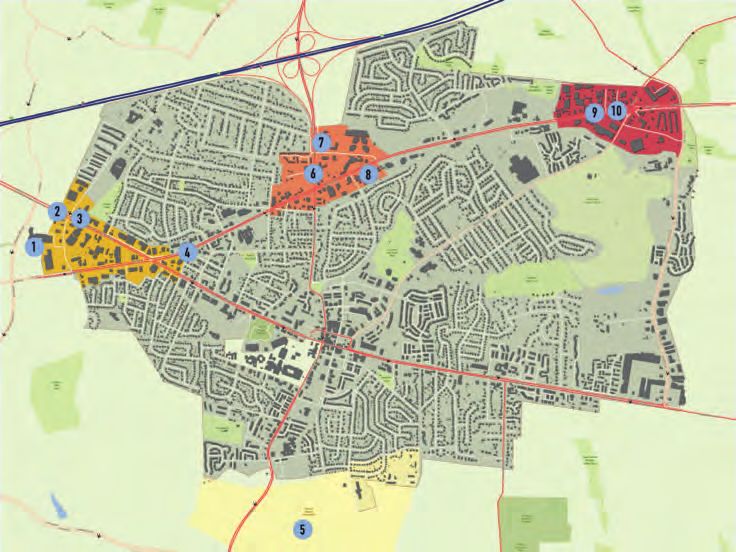
TABLE OF CONTENTS
Executive Summary . . . . . . . . . . . . . . . . . . . . . . . . . . . . . . . . . . . . . . . . . . . . 4

Study Overview . . . . . . . . . . . . . . . . . . . . . . . . . . . . . . . . . . . . . . . . . . . . . . . . 6

ASSESSMENTS OF RETAIL, OFFICE, AND LODGING MARKETS:

           Kamp Washington node . . . . . . . . . . . . . . . . . . . . . . . . . . . . . . . . . 23

           Northfax node. . . . . . . . . . . . . . . . . . . . . . . . . . . . . . . . . . . . . . . . . . 32

           Fairfax Circle node . . . . . . . . . . . . . . . . . . . . . . . . . . . . . . . . . . . . . . 41

NEXT STEPS:

           Creation of Place Strategy . . . . . . . . . . . . . . . . . . . . . . . . . . . . . . . 51

           Recommendations by Node . . . . . . . . . . . . . . . . . . . . . . . . . . . . . 54

Technical Appendix . . . . . . . . . . . . . . . . . . . . . . . . . . . . . . . . . . . . . . . . . . . 57

                                                                                                                   2
Information conveyed, data gathered and analyzed,
       and recommendations made within this report are
intended to provide information in regard to the subject
matter covered. The content presented and conclusions
   reached are, on the date presented, believed to be an
accurate representation of facts and conditions. No part
    of this document may be copied or duplicated within
      the context of any other report without the express
         prior written consent of Streetsense , LLC or PES.

                                                      3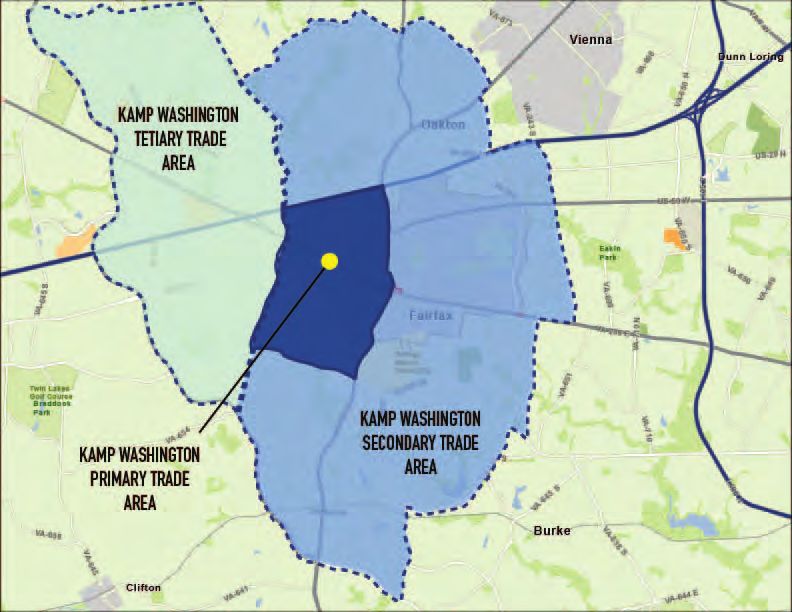
EXECUTIVE SUMMARY
As one of the City of Fairfax’s main thoroughfares, Fairfax Boulevard     KAMP WASHINGTON
serves many purposes: as an east-west vehicular connector, as an
alternative to high-volume highways, and as a commercial corridor.        Within the Kamp Washington node, commercial uses are supported by
Along this route, as it travels through Fairfax, three major points of    high traffic volumes along Fairfax Boulevard (38,000 Average Annual
intersection occur at Main Street, at Chain Bridge Road, and at Old       Daily Trips or AADT) and Lee Highway (41,000 AADT). The area is
Lee Highway. Around these intersections, three commercial nodes           characterized by a mix of national and local retailers, a national-brand
have developed:                                                           hotel, and over 350,000 square feet of office space. Additional uses
       • Kamp Washington (Fairfax Boulevard and Main Street)              in this area include industrial/storage facilities and a cemetery.
       • Northfax (Fairfax Boulevard and Chain Bridge Road)
       • Fairfax Circle (Fairfax Boulevard, Old Lee Highway, and Lee      Market Analysis Conclusions:
          Highway)
                                                                             RETAIL: The evaluation of existing retail spaces and tenants
With a view to the future of the corridor and its nodes, the City of         and the calculation of current retail demand concludes that the
Fairfax commissioned this study to undertake the following:                  Kamp Washington node has unmet demand for Neighborhood
                                                                             Goods & Services retail. The existing supply of restaurants, fast
       • Measure
               and analyze the amount and types of retail, office,         food establishments, and cafes essentially meets the node’s
         and lodging demand extant for the three nodes along Fairfax         current demand for Food & Beverage retailers. Due in part to
         Boulevard;                                                          the presence of several large-format retailers, Kamp Washington
                                                                             is regarded as highly oversaturated with General Merchandise,
       •  Assess the ability of several key locations to support            Apparel, Furnishings, & Other retail.
           retail uses and to recommend alterations to improve their
           adaptability for retail tenants; and                              OFFICE: As residential development grows near this node, the
                                                                             need for additional neighborhood serving office space will expand,
       •  Evaluate each node’s retail, office, and lodging market           allowing for the development of small-scale office space on the
           potentials.                                                       ground floor of mixed-use buildings. This demand would account
                                                                             for between 5,000 to 10,000 square feet over the next 10 years.
This analysis of the Fairfax Boulevard nodes and their commercial
development potential occurs as the Northern Virginia market has             LODGING: Currently, the Comfort Inn and Suites on Fairfax
grown increasingly competitive during a period of recovery from the          Boulevard offers a restaurant, ample surface parking, and regularly
recession that began in 2008. For a commercial offering to stand             upgraded furnishings. Occupancy rates that exceed 85 percent in
out in this environment, the City of Fairfax recognized the need for an      this node suggest the potential for between 25 to 50 additional
updated, market-appropriate strategy that would establish a point of         rooms. This level of unmet demand may be captured by the
market distinction along Fairfax Boulevard. To address this issue, this      expansion of current operations as opposed to the development of
study considers the possibility for and impact of a “creation of place”      a new hotel operation in the Kamp Washington node.
opportunity along Fairfax Boulevard.

  PRACTICAL IMPLICATIONS OF “NO UNMET DEMAND”
  For market and real estate categories that receive a designation of “no unmet” or “no additional” demand, this analysis contends that
  rehabilitation and/or renovation of existing structures is preferable to new construction. However, property owners along this corridor are
  in possession of by-right development options for new commercial space. Be aware that it is not uncommon for development to occur in
  an oversaturated market. Although this circumstance may be a reason for caution and negotiation, it should not be a cause for alarm.

                                                                                                                                                4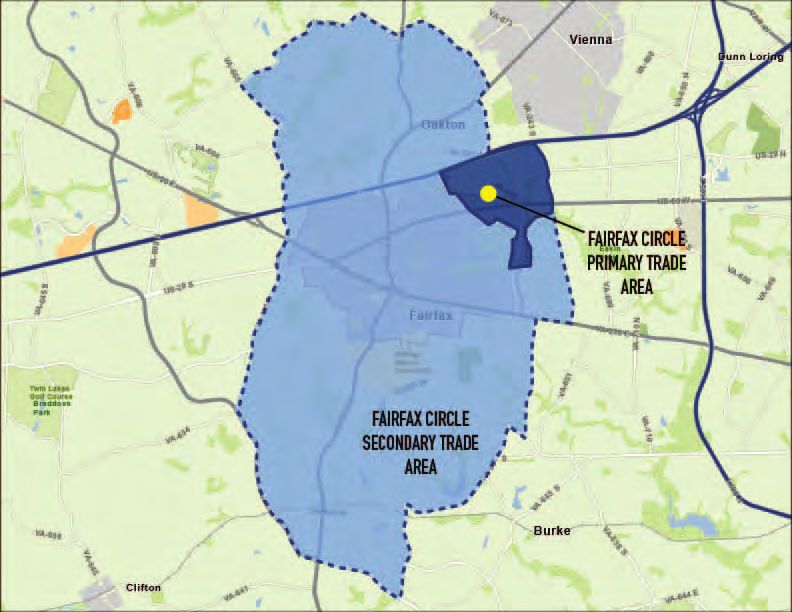
EXECUTIVE SUMMARY
NORTHFAX                                                                    FAIRFAX CIRCLE

As one of the key gateways into the City of Fairfax from Interstate 66,     Among the three study areas along Fairfax Boulevard, Fairfax Circle
the Northfax node’s current commercial uses benefit from high traffic       has the most diverse commercial real estate character. A large-format
counts along Fairfax Boulevard (39,000 AADT) and Chain Bridge               Home Depot store at one of the circle’s wedges is across the street
Road (42,000 AADT). Characterized by a concentration of suburban-           from a suburban shopping center. Industrial/warehouse uses neighbor
oriented retail, Northfax is largely a cluster of single establishment,     economy hotels. Within this context, Fairfax Boulevard carries a
pad-site retailers. This node includes nearly one million square feet       traffic count of 41,000 AADT and intersects at the circle with Old Lee
of office space, most notably along Eaton Place, within WillowWood          Highway carrying 28,000 AADT.
Plaza and in the Carolyn Building. Two national-brand hotels are
located along Chain Bridge Road.                                            Market Analysis Conclusions:

Market Analysis Conclusions:                                                   RETAIL: The evaluation of existing retail spaces and tenants
                                                                               and the calculation of current retail demand concludes that the
   RETAIL: Current retail demand indicates that the Northfax node              Fairfax Circle node has no unmet demand. The area is considered
   has unmet demand for Neighborhood Goods & Services and Food                 oversaturated in all retail categories.
   & Beverage retail, but it is oversaturated with GAFO retail.
                                                                               OFFICE: No additional demand under current conditions or 10-
   OFFICE: The few older office buildings in this node may have                year projections.
   reached the end of their useful lives or be ready for extensive
   renovations that would allow these buildings to compete more                LODGING: The hotels within this node have well-located sites
   successfully in the regional market.                                        fronting Fairfax Boulevard and cater to the price-conscious
                                                                               consumer. No additional demand under current conditions or 10-
   LODGING: This node meets many of the hotel industry’s target                year projections.
   site selection criteria, including access and visibility, high traffic
   counts, strong median household income for nearby residents,
   and a cluster of offices. In 2010, Residence Inn located within this
   node, confirming the node’s market appeal. Occupancy levels
   demonstrate a consistent market for existing hotels.

  CREATION OF PLACE STRATEGY
  Among the three nodes, Northfax, at the intersection of Chain Bridge Road and Fairfax Boulevard, is best suited for a mixed-use, place-
  oriented development. Examples of this type of real estate strategy are found within Northern Virginia at Reston Town Center, Pentagon
  Row, and Market Commons at Clarendon.

  Because of the limited unmet market demand available in each of the studied commercial real estate sectors, a successful creation of place
  strategy at Northfax will consolidate Fairfax Boulevard’s development potential in this node. If creation of place approaches are undertaken
  in Kamp Washington and/or Fairfax Circle, available demand will be diluted to the point of rendering district creation anywhere along the
  corridor infeasible. Additionally, the close proximity of these projects, if initiated, would cannibalize market share and negatively impact
  the City of Fairfax’s ability to represent a high-quality, identifiable product to the commercial markets.

                                                                                                                                              5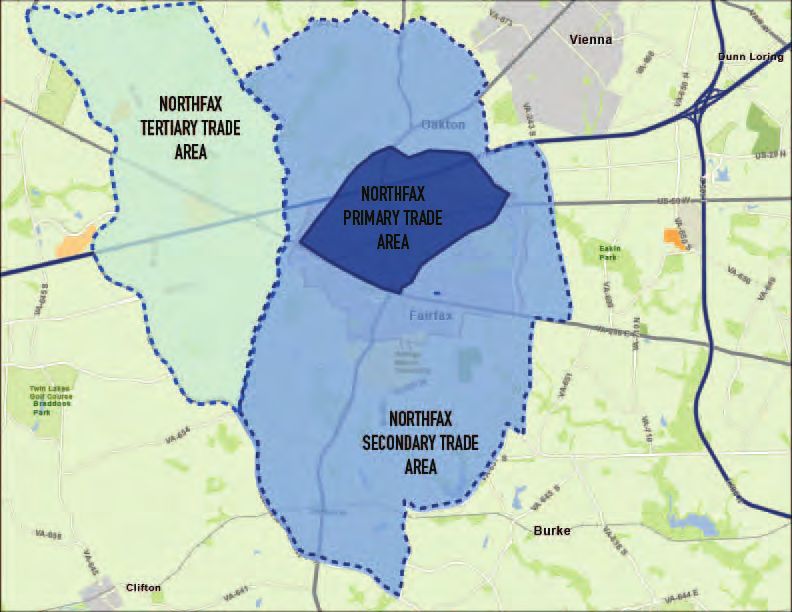
OVERVIEW: STUDY AREAS
EXIT 62
General information and definitions for commonly referenced
66
terminology are provided on the following pages, along with the
EXIT 60 context for these terms and the methodologies employed to study
each assigned real estate segment - retail, office, and lodging.
66
EXIT 57 29
50 DEFINITION OF THE NODES
Three development nodes (or study areas) were identified for this
50
analysis. The roadways that provide general description of the areas
are listed below. Please refer to the study area map for a more
123 detailed delineation of the nodes’ boundaries.
29
• The KAMP WASHINGTON node is roughly defined by Jermantown
Road, Lee Highway, and Fairfax Boulevard.
• The NORTHFAX node is roughly defined by Fairfax Boulevard
between Eaton Place and McLean Avenue, and Chain Bridge Road.
• The FAIRFAX CIRCLE node is roughly defined by Fairfax
Boulevard from Blake Lane to Draper Drive, by Lee Highway north
of Fairfax Circle, Old Lee Highway north of Accotink Creek, and
Old Pickett Road.
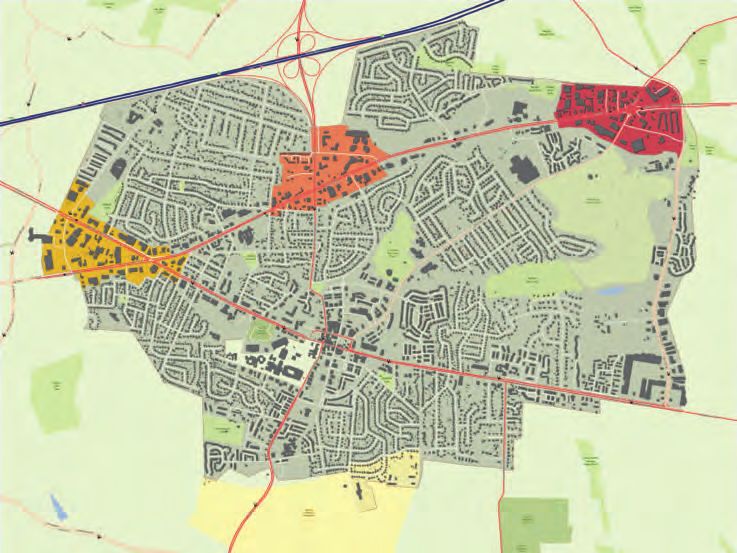
The Fairfax Boulevard nodes are diagrammed from left to right: Kamp Washington (yellow),
Northfax (orange), Fairfax Circle (red).
6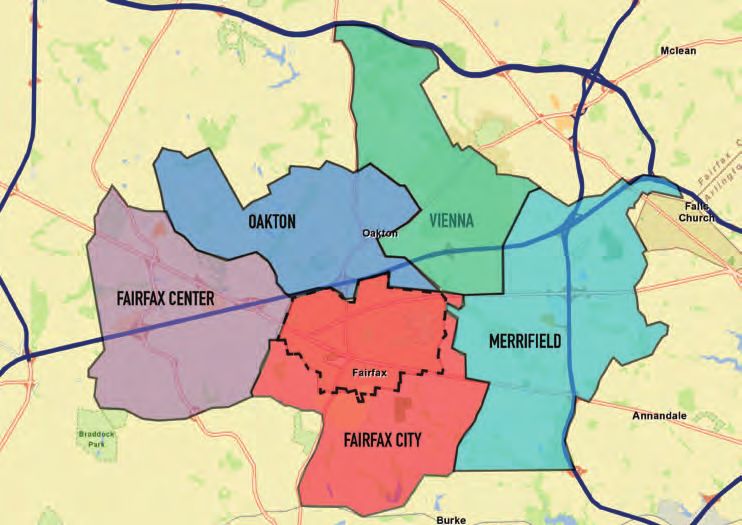
OVERVIEW OF MARKETS: RETAIL
RETAIL MARKET ANALYSIS METHODOLOGY
For the purposes of this analysis, the following tasks were undertaken                                              by residents, employees, university students, and visitors that might
to evaluate the retail potential within each Fairfax Boulevard node.                                                reasonably and regularly patronize establishments there under ideal or
                                                                                                                    improved conditions.
First, a summary and assessment is undertaken of the existing
competition for customers in the Fairfax market. In addition to                                                     Expenditures are determined from information gathered from the
the impact of existing neighborhoods, the effect of potential new                                                   U.S. Census Bureau, ESRI, and Claritas, Inc. as appropriate. These total
developments on retail at each of the nodes is forecasted.                                                          estimated expenditures are multiplied by a capture rate to estimate
                                                                                                                    total captured expenditures. Capture rates are set by evaluating
Boundaries for trade areas are then determined for primary,                                                         the amount, accessibility, and quality of existing and proposed retail
secondary, and tertiary levels of customer draws. Trade areas are                                                   development on the study area’s (or node’s) ability to draw customer
impacted by competition, drive times, sociological and geographic                                                   expenditures within the context of the larger market.
boundaries, shopping patterns by customer type, pedestrian volumes,
and other similar factors. This information provides a starting point for                                           Total estimated, captured expenditures in each retail category are
understanding the existing and potential customer base for the retail                                               divided by expectations for sales per square foot by retail tenant type.
market.                                                                                                             The result of this calculation yields the total amount of demand for
                                                                                                                    each node for each retail category.
A primary trade area (PTA), secondary trade area (STA), and
tertiary trade area (TTA) are determined for each retail node. The                                                  The existing retail supply within each node is analyzed. An inventory
PTA identifies the segments from which the node’s establishments                                                    is undertaken to record the address, store name and type, occupancy
draw a majority of their regular sales. The percentage of household                                                 status, and estimated square footage of each retail-occupied and
expenditures captured by retailers is expected to be highest in its PTA.                                            retail-appropriate space in each node.
Convenience is a major factor for sales generated locally.
                                                                                                                    A Class of Space (A, B or C) designation is determined for each
Demand from the workplace population is taken into account in each                                                  retail-occupied or retail-appropriate space. Each class is assigned a
node’s PTA. The International Council of Shopping Centers (ICSC)                                                    percentage of probability for long-term (20-year) usefulness within the
estimates that office workers with easy access to retail convenience                                                marketplace. The end result of this calculation is to provide a more
goods and places to eat spend an average of $1,650 annually near                                                    reasonable estimate of the amount of retail that is currently meeting
their workplaces.1 This spending is distributed into the following                                                  the needs of the node’s customer base. This result of this calculation is
categories: Food & Beverage (57 percent), Neighborhood Goods &                                                      referred to as a “modified inventory.”
Services (39 percent) and General Merchandise, Apparel, Furnishings
and Other retail (4 percent).                                                                                       At the conclusion of the retail market analysis, the total amount of
                                                                                                                    retail demand in each node and for each retail category is measured
Where appropriate, spending by university students and visitors is also                                             against the total amount of existing “modified inventory” of the same
calculated.                                                                                                         characteristics. The difference between these two figures is referred
                                                                                                                    to as the total unmet retail demand, or the total amount of retail
Retail demand for each node is measured by calculating Fairfax                                                      development potential within each node for each retail category.
Boulevard’s ability to attract existing and projected expenditures

1. International Council of Shopping Centers, Office Worker Retail Spending Patterns: A Downtown and Suburban Area Study (New York: International Council of Shopping Centers, 2004. All dollar figures updated to 2013 present value.

                                                                                                                                                                                                                               7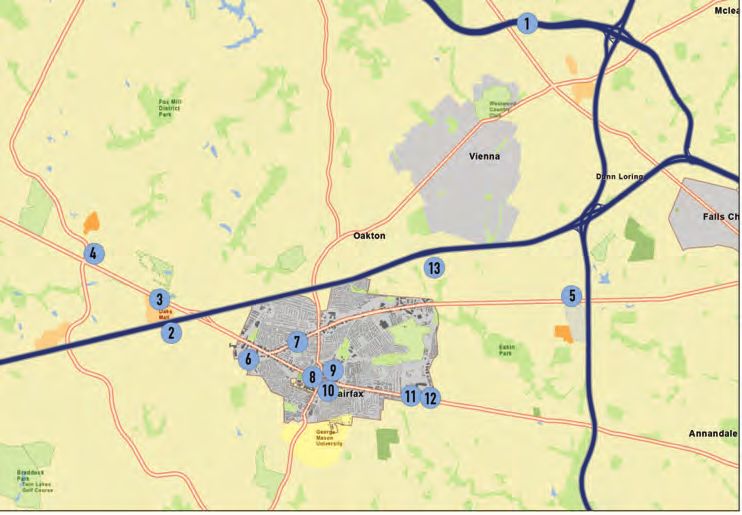
OVERVIEW OF MARKETS: RETAIL
TERMINOLOGY: RETAIL CATEGORIES
From the grocery store to the jewelry shop, retailers have different       Food & Beverage (F&B): This category includes establishments that
requirements in terms of customers, space, parking, competition,           serve food and/or alcohol consumed on premises. Tenant types in the
exposure, and potential sales. In general, however, the following          F&B category include sit-down restaurants, cafes, bars, coffee shops,
categories represent groups of retailers with similar needs.               sandwich shops, ice cream shops, “quick-bite” establishments, fast-
                                                                           food restaurants, and similar.
Neighborhood Goods & Services (NG&S): This category includes
establishments that depend upon the patronage of local residents           Food & Beverage establishments can attract customers from a larger
and workers, such as grocery stores, drugstores, florists, bakeries,       trade area than NG&S retailers, especially when they are clustered.
specialty food stores, delicatessens, butchers, dry cleaners,              A greater number of patrons will be interested in a collection of F&B
laundromats, hair & nail salons, day spas, printers, pet salons, machine   establishments that offer a variety of options.
repair shops, shoe repair shops, gyms, and similar.
                                                                           F&B examples from Fairfax Boulevard nodes: El Paso Mexican Grill,
Neighborhood Goods & Services retailers rely on spending from a            Baskin Robbins, Zoe’s Kitchen
nearby residential and workforce customer base, generally within a
one-mile radius. NG&S is “convenience-based” retail - it must be close,    General Merchandise, Apparel, Furnishings & Other (GAFO): This
with easy access and parking.                                              category includes establishments such as clothing stores, furniture
                                                                           stores, bookstores, jewelry stores, gift boutiques, pet stores, sporting
NG&S examples from Fairfax Boulevard nodes: Hilltop Cleaners,              goods stores, home goods stores, craft stores, antique shops,
Crystal Barber Shop, 7-Eleven, Giant, Walgreens                            electronics stores, auto parts stores, and similar.

                                                                           GAFO retailers face a tremendous amount of competition, both in
                                                                           stores and online, for a relatively small percentage of household
                                                                           expenditures. Successful GAFO stores attract customers from long
                                                                           distances. However, these stores also rely on the exposure and foot
                                                                           traffic generated by an anchor that draws people with the same
                                                                           customer profile.

                                                                           GAFO examples from Fairfax Boulevard nodes: Golfsmith, Direct
                                                                           Mattress, Willi’s Ski Shop

                                                                                                                                                 8
OVERVIEW OF MARKETS: RETAIL
TERMINOLOGY: CLASS OF SPACE
The quality of the ground-level retail space that currently exists in      Class A: Space that meets the requirements for a Class A rating
the market is a critical measurement in determining the ability of         typically has the following attributes:
an area to attract tenants and support customer sales. For each                       •  located at an end-cap or prominently situated among in-
node, an inventory was undertaken to determine the amount and                             line establishments;
“retail-readiness” of ground-level spaces. This evaluation provides an                •  floor-to-ceiling clear height of 14 feet or more;
assessment of the retail supply within each node.                                     •  storefront width of 20 feet or more;
                                                                                      •  well-maintained;
The total amount of existing retail space currently in supply does                    •  clearly visible from primary streets;
not provide the most accurate market depiction. In most markets,                      •  constructed with quality materials;
it is typical to find retail establishments that maintain operations in               •  properly lit exterior and display spaces;
substandard spaces and locations. As new, better quality space is                     •  clear pedestrian and vehicular access; and
constructed, the substandard space is often replaced or converted to                  •  associated or adjacent parking.
a non-retail use.
                                                                           Class B: Space that meets the requirements for a Class B rating
The following classifications are applied to retail spaces that meet the   typically has the following attributes:
corresponding criteria:                                                               •  well-situated among in-line establishments;
                                                                                      •  floor-to-ceiling clear height of approximately 12 feet or
                                                                                          more;
                                                                                      •  storefront width of 15 feet or more;
                                                                                      •  well-maintained; and
                                                                                      •  diminished representation of factors listed for Class A
                                                                                          space.

                                                                           Class C: Space that meets the requirements for a Class C rating
                                                                           typically has the following attributes:
                                                                                      •  located among in-line establishments;
                                                                                      •  floor-to-ceiling clear heights of less than 12 feet;
                                                                                      •  storefront width of less than 15 feet; and
                                                                                      •  diminished representation of factors listed for Class B
                                                                                          space.

                                                                           Build-to-Suit (BTS): Space that is listed as BTS has been constructed
                                                                           for a specific tenant in such a manner that conversion to another use
                                                                           or tenant will be difficult or impractical.

                                                                                                                                                      9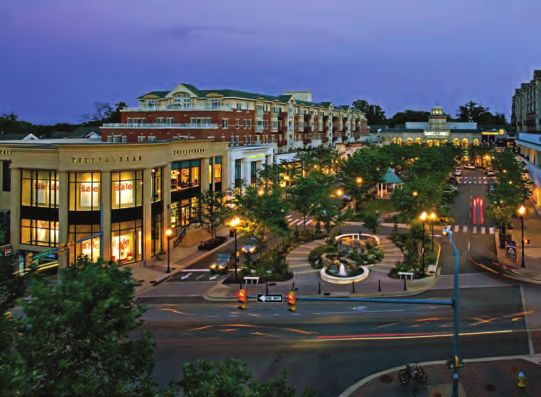
OVERVIEW OF MARKETS: RETAIL
TERMINOLOGY: MODIFIED INVENTORY
To account for possible changes in the retail supply caused by                The following table demonstrates the application of the modified
changing demand, new construction, and/or stronger competition,               inventory calculation on the Kamp Washington node’s existing retail
a percentage of probability is assigned to each class of retail space         space.
(see definitions on page 9). This percentage assumes the likelihood
that retail space currently in the existing supply will remain. As retail
markets improve, the overall quality of space also improves. The
resulting calculation is known as the study area’s “modified inventory.”
                                                                              TABLE 1. MODIFIED INVENTORY CALCULATION EXAMPLE
                                                                                      KAMP WASHINGTON NODE
To calculate modified inventory, each retail space receives a class             CLASS OF            TOTAL AMOUNT,               EFFICIENCY               MODIFIED
of space designation (A, B, C, or BTS--build-to-suit). For each study            SPACE             RETAIL-OCCUPIED                                      INVENTORY
area, the total amount of retail for each class is multiplied by an                                 (SQUARE FEET)                                     (SQUARE FEET)
efficiency rating (see example to the right). This efficiency allows that             A                   134,491                    90%                   121,042
a percentage of the existing retail inventory is not well suited for retail
under improved conditions and has the potential to (a) convert to a                   B                   103,959                    82%                   85,246
non-retail use, such as a professional office or similar use, or (b) be               C                   250,287                    75%                   187,715
redeveloped.                                                                        BTS                   28,470                     50%                    14,235
                                                                                  TOTAL                   517,207                                         408,239
                                                                              This table is repeated under the discussion of the Kamp Washington node’s supply.

                                                                              The modified inventory adjustment is a critical piece in evaluating
                                                                              the ability of the area’s buildings (supply) to accommodate the
                                                                              needs of its customer base (demand). The difference between the
                                                                              existing retail occupied space (517,207 square feet) and the modified
                                                                              inventory (408,239) allows that 108,968 square feet within the Kamp
                                                                              Washington node will not be included as part of the area’s functioning
                                                                              retail supply in unmet demand calculations.

                                                                                                                                                                     10
OVERVIEW OF MARKETS: RETAIL
TERMINOLOGY: HIGH AND LOW SALES PRODUCTIVITY
Under the condition of “high productivity,” retail sales are high, thus
consumer expenditures are concentrated on a smaller amount of total
retail space. “Low productivity” conditions assign lower potential sales
per square foot to each type of retail; therefore, a greater amount of
retail space is supported but with significantly less profitability divided
by expected sales per square foot for that retail category, according
to Urban Land Institute (ULI) standards and ICSC reports. For the
purposes of this table, demand figures for “high productivity retail
sales” as represented in the appendix are assigned.
11OVERVIEW OF MARKETS: RETAIL
RETAIL COMPETITION WITHIN THE LOCAL MARKET
5. The Mosaic District is an urban neighborhood development, which
is 1.9 million square feet. The development consists of retail, office,
residential, parking, a movie theater, and hotel space, and is located
4.8 miles from the Northfax node. There is about 500,000 square feet
of retail space including anchors Target and MOM’s Organic Market.
6. Fairfax Centers I & II include 250,655 square feet and is located to
the southwest of Kamp Washington. Major tenants include Walmart
and Big Lots.
50 66
7. Shops at Fairfax Boulevard Center. Halfway between Kamp
Washington and Northfax, this center totals 76,313 square feet and
123 features a Party City, Petco, and HMart.
66
495 8. Old Town Plaza is a mixed-use development of both office and
53,000 square feet of retail space in the city center. Major retailers
include Potbelly and The Greene Turtle. There is also retail on the
surrounding streets.
9. Courthouse Plaza includes a Safeway and CVS in 83,170 square
feet.
1. Tysons Corner Center is a 2.2 million square foot shopping 10. Main Street Marketplace contributes an additional 101,998 square
complex that includes Lord & Taylor, Macy’s, Bloomingdales, L.L. feet to the area that surrounds historic downtown Fairfax.
Bean, Nordstrom, and the AMC Theater. Tysons Corner Center is the
country’s 12th largest shopping mall based on leasable square footage. 11. Fair City Mall is located along Main Street with tenants such as
Best Buy, Shopper’s Food Warehouse, DSW, and A.C. Moore within its
2. Fairfax Corner is a 300,000 square foot mixed-use development 468,843 square feet.
located 3.3 miles from the Northfax node. Its anchors include retailers
such as REI, Coastal Flats Restaurant, and Rave Motion Pictures. 12.Turnpike & Pickett Shopping Centers include 193,564 square feet
center located near the intersection of Pickett Road and Main Street.
3. Fair Oaks Mall. This 1,566,000 square foot regional mall is part Tenants include Ross, PetSmart, Dollar Tree, Caribou Coffee, Chipotle,
of the Taubman portfolio. Major tenants include Macy’s, JCPenney, Trader Joe’s, Total Wine, and CVS.
Apple, Coach, Williams-Sonoma, and The Cheesecake Factory.
13. MetroWest is a proposed mixed-use development at Saintsbury
4. Fair Lakes Shopping Complex consists of The East Market at Fair Drive between Nutley Street and Vaden Drive. Projected to include
Lakes, The Fair Lakes Center, and The Shops at Fair Lakes. Major 55,000 to 100,000 square feet of retail space, the composition of
tenants include Dick’s Sporting Goods, Kohl’s, Whole Foods, Target, tenants is yet to be determined.
Walmart, and Best Buy. The three centers total 1,299,901 square feet.
12OVERVIEW OF MARKETS: OFFICE
OFFICE MARKET ANALYSIS METHODOLOGY
The potential for office development in the Fairfax Boulevard nodes From the historic absorption data, the employment analysis
must be considered within the context of the regional office market. and an assessment of vacant space, the office properties along
Office markets rarely consist of one type of office space; rather, Fairfax Boulevard can be compared with other submarkets. These
distinct users create space needs which vary greatly in character and factors help determine if speculative office development might be
construction type, impacting rents and location. Industries that use supportable and what share of the market it might represent.
office space most heavily include: Information; Finance and Insurance;
Professional, Scientific and Technical Services; Health Care and Social The competitive marketing strength of each node is related to
Assistance; other Services; and Government. Typically the first three typical office location criteria: accessibility, by car and transit; image
are most important for the general office market occupancy. Within and quality of the surrounding environment; proximity to retail
the City of Fairfax, Health Care and Social Assistance, as well as and restaurants; walkability; visibility; proximity to major activity
Government employment impact office potential. generators and other offices. Each node along Fairfax Boulevard
varies, in offering these site location factors, which accounts for the
For the Fairfax Boulevard existing conditions review, the office market nodes potential to support office development.
assessment includes general office market insights and a review of
neighborhood-serving offices. Neighborhood-serving office space The demand for office space in each node is identified by five-year
represents demand from businesses that need to be located in close period. As a final task, these projections consider the competitive
proximity to their customer base, usually local residents. This analysis benefits of placemaking and aggregation of activity into mixed-use
focuses on the City of Fairfax and the surrounding submarkets. In developments.
these areas, the analysis reviews anticipated employment growth
in relevant industries. For office markets the ability to attract
anchor institutions, or create a cluster within industries can create a
competitive advantage.
Historical trends for office occupancy and employment projections
along with direct information from area brokers and office developers
helps provide insight into the amount of demand anticipated in the
short- and long-term. The translation into square feet of demand
considers the changing ratios of square feet of space per employee.
13OVERVIEW OF MARKETS: OFFICE
TERMINOLOGY: CLASS OF SPACE
Within the Fairfax Boulevard nodes, office space accounts for Class A office space consists of investment-grade properties that
approximately 1.5 million square feet with a reasonably healthy 90 receive the highest rents and/or sales prices when compared to other
percent occupancy rate or 10 percent vacancy rate. buildings. These buildings have an exemplary location, tenant layout
or floor plan,offer quality finishes, modern mechanical systems, and
The average year built for the corridor is 1988, with an average rent of are architecturally or historically significant.
$24 per square foot. The majority of the office buildings (58 percent)
are classified as Class B, 26 percent are Class C, and 16 percent are Class B office space consists of more speculative properties that
Class A. Classing of commercial space helps to properly evaluate receive lower rents and/or sales prices when compared to Class A
existing supply by differentiating buildings by physical condition and buildings. These buildings have a good location, standard design,
operating performance. average to good maintenance and average finishes. They are not able
to attract the most prestigious tenants due to more modest finishes,
mechanical systems, and sometimes the condition of the building.
Class C office space consists of older building stock that receives
lower rents and/or sales prices when compared to Class B buildings.
These buildings offer no additional amenities (with inferior elevators or
mechanical systems) and typically have below average maintenance
and upkeep. They compete for tenants based on rent levels.
14OVERVIEW OF MARKETS: OFFICE
REGIONAL EMPLOYMENT TRENDS TABLE 2. CLOSE-IN NORTHERN VIRGINIA EMPLOYMENT TRENDS, 2007 - 2012
2007-2012 Change
Employment trends for the Close-In Northern Virginia jurisdictions Industry Title 2007 2012 Number Percent
(City of Alexandria, Arlington County, City of Falls Church, City of Accommodation/Food Services
Fairfax and Fairfax County) show regional industry dynamics and 62,662 66,195 3,533 5.6%
the potential growth by industry. Close-In Northern Virginia had an Administrative and Support and
employment base of more than 882,300 jobs in 2012 (Table 2). Waste Management 57,423 55,839 -1,584 -2.8%
Agriculture, Forestry, Fishing,
The five close-in jurisdictions experienced an 8.9-percent growth Hunting *** *** *** ***
from 2002 to 2007, adding 71,200 jobs. This growth dropped off
Arts, Entertainment, and
dramatically during the great recession and then rebounded with
Recreation 14,562 15,627 1,065 7.3%
growth of 1.1 percent from 2007 to 2012. The Close-In Northern
Virginia employment base is dominated by professional, scientific and Construction 40,155 31,579 -8,576 -21.4%
technical service sector jobs accounting for slightly more than one- Education Services 61,336 65,873 4,537 7.4%
quarter of total jobs in 2012. Public administration jobs represented
another 8.8 percent of jobs. The education and health care sectors Finance and Insurance
32,960 30,258 -2,702 -8.2%
combined contributed approximately 16 percent of the total – more
Health Care and Social Assistance
than 140,000 jobs. Information industry jobs fell, losing an estimated 66,993 74,086 7,093 10.6%
8,450 jobs. Information 37,833 29,383 -8,450 -22.3%
As a share of total jobs, the greatest growth from 2007 to 2012 Management of Companies and
was in four sectors: professional, scientific and technical services; Enterprises 23,758 25,859 2,101 8.8%
management of companies and enterprises; public administration; and Manufacturing 13,234 10,712 -2,522 -19.1%
health care and social assistance services. This indicates a continued
shift toward office-based employment in Close-In Northern Virginia. Mining, Quarrying, and Oil and
Gas Extraction *** *** *** ***
In the City of Fairfax, the employment trends highlight similar patterns Other Services (except Public
with the city gaining more than 200 jobs over the last five years. As Administration) 42,528 44,202 1,674 3.9%
a share of total jobs, the greatest growth from 2007 to 2012 was in
Professional, Scientific, and
professional, scientific and technical services; accommodation and
Technical Services 204,468 222,110 17,642 8.6%
food services; public administration; transportation and warehousing;
and arts, entertainment and recreation. More than two-thirds of the Public Administration 71,262 77,730 6,468 9.1%
information industry jobs were lost from 2007 to 2012.
Real Estate and Rental and
Leasing 17,111 15,104 -2,007 -11.7%
A review of employment trends for those industries most closely
related to office employment for both the City of Fairfax and Fairfax Retail Trade 78,427 74,954 -3,473 -4.4%
County, highlighted slow growth over the last five years in the city Transportation and Warehousing 24,269 22,243 -2,026 -8.3%
compared to the county. Both jurisdictions gained professional,
Utilities *** *** *** ***
scientific and technical service jobs. Other industries such as health
care, and management declined in the City of Fairfax, while growing in Wholesale Trade 20,002 17,023 -2,979 -14.9%
the county. Total: All Industries 872,731 882,377 9,646 1.1%
15OVERVIEW OF MARKETS
OFFICE: COMPETITIVE ENVIRONMENT
To understand office potential, a review of regional, county, and
specifically the City of Fairfax’s and the boulevard’s ability to compete
for office development is essential. This involves consideration
of their competitive advantages and disadvantages, including
access, proximity to major employment centers, workforce, office
environment, cost, support services, and other factors.
Office market dynamics within the broader market tend to segment
based on visibility and accessibility from Interstate 66 and quality of
place factors. For this reason, specific review of data in each of these
areas helps to distinguish office market trends that would otherwise
be obscured by reviewing the areas together. Nonetheless, the office
market relies on the regional office dynamics as well as the Study Area
conditions.
Shown on the map below, the geographic submarkets used to
approximate the corridor market include: Oakton, Merrifield, Fairfax
City, Vienna, and Fairfax Center. These submarkets extend beyond the
nodes’ (and even the City’s) boundaries, but they offer appropriate
comparables and solid indications of market conditions along Fairfax
Boulevard.
The Fairfax City, Fairfax Center, Merrifield, Vienna, and Oakton The other non-retail commercial uses along the corridor consist of
submarkets as a whole saw negative net absorption of over 945,000 business services in light manufacturing or warehouse areas that
square feet and an increase in the vacancy rate from 5.2 percent to provide mostly auto-repair services and lodging operations. While
12.5 percent over the seven year period from 2006 to 2012, which the light industrial uses may not always operate as the best neighbor
reflects of trends in the overall Northern Virginia market. Part of the for residential, these businesses provide useful convenience services
decline that affected the Northern Virginia market was the result of for the City of Fairfax.
the Federal Government vacating private office buildings in response
to the 2005 recommendations of the Base Realignment and Closure
Commission. Multiple buildings were found not to meet forced
protection standards, leading the Defense Department to relocate
commands to government-owned buildings at Fort Belvoir, Fort
Meade in Maryland and many other locations.
16OVERVIEW OF MARKETS
OFFICE: COMPETITIVE ENVIRONMENT
FAIRFAX CITY TABLE 3. FAIRFAX CITY OFFICE SPACE TRENDS, 2006 - 2012
The Fairfax City submarket added 143,000 square feet of space by
Year Total Vacant Occupied Occupancy Average
2012 on top of the existing five million square feet at the end of 2006. Square Square Square Feet Rate Rent
It is important to note that the City of Fairfax boundaries are smaller Feet Feet
than the submarket. Between 2007 and 2010, absorption was poor
losing 78,000 square feet of occupied space, consistent with an 2006 5,018,380 305,696 4,712,685 93.9% $23.37
increased vacancy rate from 9.5 percent in 2007 to 10.8 percent in 2007 5,161,465 488,023 4,673,443 90.5% $23.50
2010. During the last two years, aggregate positive net absorption of 2008 5,132,027 459,993 4,672,033 91.0% $23.56
33,000 square feet marked a rebound with the vacancy rate, declining
by 0.5 percent to 10.3 percent in 2012. 2009 5,140,404 437,414 4,702,990 91.5% $22.99
2010 5,152,965 557,041 4,595,925 89.2% $22.88
Office space in Fairfax City has increased in aggregate square feet 2011 5,152,965 526,396 4,626,570 89.8% $22.95
from five million to 5.2 million over the last six years as Table 3
show. In contrast, the average rents decreased by more than a dollar 2012 5,161,465 532,920 4,628,545 89.7% $22.34
from $23.37 in 2006 to $22.34 in 2012. During the same period, 2006-2012 Change
the vacancy rate climbed from 6.1 percent to 10.3 percent in 2012, Amount 143,085 227,225 (84,140) -4.2% -$1.03
reflecting a reasonable healthy occupancy level.
Percent 2.9% 74.3% -1.8% -4.5% -4.4%
FAIRFAX CENTER
Office space in Fairfax Center has increased in aggregate square feet
from 7.1 to 7.3 million between 2006 and 2012, as shown in Table 4. TABLE 4. FAIRFAX CENTER OFFICE SPACE TRENDS, 2006 - 2012
Comparatively, the average rents increased from $26.62 in 2006 to Year Total Vacant Occupied Occupancy Average
$27.97 in 2007, before falling 1.1 percent to $26.33 in 2012. At that rent Square Square Square Feet Rate Rent
level, the rent revenues do not cover development costs. The vacancy Feet Feet
rate climbed from 5.3 percent in 2006 to 10 percent in 2007 and 15.7 2006 7,109,281 380,112 6,729,169 94.7% $26.62
percent in 2012. Fairfax Center submarket includes 1.8 million square
feet in the Random Hills office node. 2007 7,208,312 717,954 6,490,358 90.0% $27.97
2008 7,309,264 848,920 6,460,344 88.4% $27.88
This submarket has added more than 180,000 square feet to the 2009 7,309,264 1,016,582 6,292,682 86.1% $27.05
approximately 7.1 million square feet that existed in 2006. Absorption
was poor from 2006 to 2010, losing over 747,000 square feet of 2010 7,294,342 1,312,344 5,981,998 82.0% $26.58
space, allowing the vacancy rate to rise from 5.3 percent at the end of 2011 7,289,368 1,166,390 6,122,979 84.0% $26.36
2006 to 18 percent at the end of 2010. Office construction rose from 2012 7,289,368 1,143,182 6,146,186 84.3% $26.33
the beginning of 2007 to the end of 2009, adding almost 200,000
square feet of aggregate space. During the aftershocks of the 2006-2012 Change
recession, 2009 and 2010 experienced negative net absorption. Over Amount 180,087 763,070 (582,983) -10.3% -$0.30
the last two years, the market rebounded with almost 160,000 square Percent 2.5% 200.7% -8.7% -10.9% -1.1%
feet of additional occupancy and a decline in the vacancy rate to 15.7
percent at the end of 2012. Sources: CoStar; Partners for Economic Solutions, 2013
17OVERVIEW OF MARKETS
OFFICE: COMPETITIVE ENVIRONMENT
MERRIFIELD TABLE 5. MERRIFIELD OFFICE SPACE TRENDS, 2006 - 2012
The Merrifield office submarket increased at a faster rate than Fairfax
City, gaining approximately 491,000 square feet from 2006 to 2012, Year Total Square Vacant Occupied Occupancy Average
Feet Square Square Feet Rate Rent
while absorption was negative, losing 120,000 square feet (see Table
Feet
37 in the Technical Appendix). Through 2010, new construction
outstripped absorption, and vacancies rose from 4.5 percent in 2006 2006 9,416,400 420,235 8,996,165 95.5% $28.73
to 17 percent in 2010. From the start of 2011 through the end of 2012, 2007 9,416,400 469,541 8,946,859 95.0% $31.59
Merrifield improved its office occupancy with the base of occupied
2008 9,508,077 1,157,871 8,350,205 87.8% $32.55
square feet rising by almost 344,000 square feet, or four percent. The
average rent also increased by more than $1, reaching more than $30 2009 9,743,848 1,487,162 8,256,686 84.7% $31.48
per square foot during the same period. 2010 9,884,157 1,678,001 8,206,157 83.0% $32.60
2011 9,867,879 1,335,074 8,532,805 86.5% $32.05
The newly constructed Mosaic mixed-use district includes 73,000
square feet of office space. Also located within the Merrifield 2012 9,907,129 1,030,647 8,876,482 89.6% $30.14
submarket, just across from the Mosaic District on Route 50, is the 2006-2012 Change
Willow Oaks Corporate Center. The office park consists of three
Amount 490,729 610,412 (119,683) -5.9% $1.41
Class A office buildings completed in 1986, 1989, and 2003 that total
570,038 square feet. Percent 5.2% 145.3% -1.3% -6.2% 4.9%
OAKTON
Oakton, the smallest of the five submarkets, saw new office space TABLE 6. OAKTON OFFICE SPACE TRENDS, 2006 - 2012
construction total only 31,000 square feet between 2006 and 2012. Year Total Vacant Occupied Occupancy Average
Concurrently, absorption was negative, losing 159,000 square feet, as Square Square Square Feet Rate Rent
shown in Table 38 (see Technical Appendix). Both the occupancy rate Feet Feet
and average rent decreased over the same time period, from 93.9 to
2006 1,600,295 98,095 1,502,201 93.9% $28.59
82.4 percent and from $28.59 to $26.99 per square foot, respectively.
Through 2010, new construction outstripped absorption, and 2007 1,630,887 106,485 1,524,402 93.5% $28.36
vacancies rose from 6.1 percent in 2006 to 21.6 percent. In 2011 and 2008 1,630,887 120,755 1,510,132 92.6% $28.52
2012, Oakton attracted new office tenancy with the base of occupied
2009 1,630,887 343,532 1,287,355 78.9% $25.94
square feet rising by 64,000 square feet or five percent.
2010 1,630,887 351,628 1,279,259 78.4% $26.52
2011 1,630,887 307,030 1,323,857 81.2% $27.31
2012 1,630,887 287,561 1,343,327 82.4% $26.99
2006-2012 Change
Amount 30,592 189,466 (158,874) -11.5% -$1.60
Percent 1.9% 193.1% -10.6% -12.3% -5.6%
Sources: CoStar; Partners for Economic Solutions, 2013
18OVERVIEW OF MARKETS
OFFICE: COMPETITIVE ENVIRONMENT
VIENNA TABLE 7. VIENNA OFFICE SPACE TRENDS, 2006 - 2012
Between 2006 and 2012, the Vienna submarket office inventory
lost 7,000 square feet of space. Over the same time period, rents Year Total Square Vacant Occupied Occupancy Average
Feet Square Square Feet Rate Rent
decreased by almost $5, declining from $27.38 to $22.63 per gross
Feet
square foot. Vienna’s vacancy rates over the six year period, peaking
at a low rate of 4.2 percent in 2009, before declining to 13.8 percent in 2006 1,917,500 288,092 1,629,408 85.0% $27.38
2012, slightly higher than in 2006. 2007 1,912,242 254,559 1,657,683 86.7% $28.16
2008 1,912,242 122,523 1,789,720 93.6% $26.87
Vienna MetroWest, the planned transit-oriented mixed-use
development, located at the Vienna Metro Station, will include 2009 1,912,242 80,802 1,831,440 95.8% $24.93
300,000 square feet of office space. Although the completion date 2010 1,912,242 84,646 1,827,596 95.6% $23.82
for the office portion of the development is unknown due to the
2011 1,912,242 217,666 1,694,576 88.6% $22.99
current state of the economy, Fairfax County and the developers are
still committed to the planned full build-out of the town center. This 2012 1,910,418 263,437 1,646,981 86.2% $22.63
project will increase the supply of office space creating additional 2006-2012 Change
competition for the Fairfax Circle node and the entire corridor.
Amount (7,083) (24,656) 17,573 1.2% -$4.75
Percent -0.4% -8.6% 1.1% 1.5% -17.3%
Sources: CoStar; Partners for Economic Solutions, 2013
19OVERVIEW OF MARKETS: LODGING
LODGING MARKET ANALYSIS METHODOLOGY
This analysis included the following tasks to evaluate the lodging The type of lodging establishment reflects classifications based on the
potential within each Fairfax Boulevard node. quality of the space, finishes and service level, which are reflected
in the room rates. Operators of lodging operations include chain
First, a review of the existing competitive environment for Fairfax management and independently operated hotels. For this analysis,
Boulevard included a review of those lodging operations within five hotels can be grouped into four broad categories: Economy, Midscale,
miles of the corridor. This review included those within the City of Upper Midscale, and Upscale.
Fairfax as most relevant and a selection of those lodging clusters
along I-66 that relate more specifically to interstate travel. An • Economy: Lowest priced lodging with limited service options.
inventory of competitive lodging facilities within this broader trade Along the Fairfax Boulevard corridor several examples exist,
area by number of rooms, year built, room rates and occupancy including the Rodeway Inn.
established the baseline for the supply calculation.
• Midscale: More moderately priced with limited service options.
The demand analysis focused on a broad customer base including These hotels may be older with frequent upgrades to the
business travelers, area visitors and tourists. This involved an furnishings and finishes keeping them competitive. The Best
inventory of existing lodging operations and categorization of these Western Inn is the best example within the Fairfax Boulevard
operations by type of hotel, price point and location relative to the nodes.
Fairfax Boulevard nodes.
• Upper Midscale: Able to attract clientele based on added
Hotel development patterns reflect not only accessibility and visibility features compared to midscale operations. These tend to be
but also proximity to retail and restaurants and the quality and / or newer facilities. Within the Fairfax area, these operations tend
image of the surrounding environment. Direct interviews with hotel to include extended stay alternatives or guest suites with one or
operators helped to supplement other data sources with remarks from more bedrooms, separate living areas and kitchenettes or mini-
customers about these qualitative criteria. These interviews helped in refrigerators. Fairfax Boulevard’s upper midscale example is the
considering the competitive benefits of placemaking and aggregation Hampton Inn.
of activity into mixed-use development which impact projected
occupancy and seasonality. • Upscale: The highest priced product in the marketplace with
amenities and desirable location. In general this operation includes
major chains as well as specialty or boutique hotel offerings. One
example within the Fairfax area is the Mason Inn Conference
Center and Hotel.
20OVERVIEW OF MARKETS
LODGING
EXIT 62 Hotel travel typically relates to business but also includes visitors to a
66
region for a variety of reasons (e.g., passing through, visiting family,
tourism, visiting colleges). The hospitality industry links closely with
EXIT 60 the economy and follows its highs and lows, especially as it relates to
66 business travel.
EXIT 57 50
29
Hotel development needs close proximity to its customer base and
50
tends to locate on well-traveled routes or near employment centers
and tourist attractions, depending on the market segment of the
particular hotel. Visibility from the highway, aesthetics of the area, and
123 perceived safety rank as top factors considered by hotel operators
29 when selecting a location. For these reasons, interstate hotels, unlike
resort hotel operations, cluster around highway exits with easy access.
Co-location with retail, restaurants, and entertainment enhances a
hotel’s appeal to potential customers.
Hotel operations segment based primarily on size and price. These
distinctions by price include: economy, (for lower priced lodging
options), graduating to midscale, upper midscale and upscale as
price and associate hotel features increase. Hotel performance varies
based on the segment and operating style of each hotel. Often these
categories reflect both the age and investment in specific properties.
In addition, specialty niche hotels, including an extended stay facility
HOTELS WITHIN THE FAIRFAX BLVD COMPETITIVE MARKET that services business travelers or new residents still searching
1. SpringHill Suites by Marriott Fairfax Fair Oaks for a permanent home, may be relevant for the Fairfax Boulevard
2. Courtyard Fairfax Fair Oaks nodes. Other specialty hotel operations, such as a lifestyle hotel or a
boutique hotel, are subcategories less likely to be viable along Fairfax
3. Comfort Inn University Center Boulevard. Typically, a boutique hotel falls into the upscale category,
4. Hampton Inn Fairfax City with less than 100 rooms and offers high-quality concierge service.
The Stafford House Bed and Breakfast along Chain Bridge Road
5. The Mason Inn Conference Center and Hotel
provides one such alternative but at a much smaller scale.
6. Residence Inn Fairfax City
7. Best Western Fairfax
8. Holiday Inn Express Fairfax Boulevard
9. Rodeway Inn
10. Hy Way Motel
21OVERVIEW OF MARKETS
LODGING
Hotel development patterns in and around the City of Fairfax TABLE 8. FAIRFAX AREA LODGING CONSTRUCTION BY TOTAL ROOMS
center on interstate travel and employment clusters. George Mason
University impacts hotel demand, with peak demand occurring during
1970 - PRESENT
university events and high-attendance performances at the Patriot
Center and similar. Within the City of Fairfax, hotel development
includes outlier operations unlikely to be competitive with the
successful franchised establishments in the local marketplace. In fact,
the separation among the area’s competitive hotel offerings reflects
both the year built and specific cluster locations. For these reasons,
the analysis considers operational information for those hotels within
the competitive landscape.
The nine lodging properties examined within the Fairfax Boulevard
nodes represent 1,138 rooms. The chart to the right shows the number
of rooms available based on year built and highlights the lull in
development activity in the 1990s and early part of the 21st century.
These hotels range from economy single-story operations to full-
service extended-stay facilities with room rates varying from $90 to
$130.
General occupancy statistics by day of the week demonstrate that
Please see the lodging inventory tables beginning on Page 97 in the Technical Appendix for
business travelers during the middle of the week and weekend leisure detailed information.
visitors constitute the greater Fairfax area’s prime customer types.
Over the course of the last several years, occupancy rates climbed
even with the entrance of a new hotel.
Additionally, hotel operators report demand from a diverse mix of
patrons with a need to build a more pedestrian-friendly atmosphere
for guests.
22MARKET ANALYSIS: KAMP WASHINGTON
23KAMP WASHINGTON NODE (RETAIL)
For the purposes of this analysis, the market potential of the
Kamp Washington node was evaluated in the corridor bounded by
Jermantown Road, Lee Highway, and Fairfax Boulevard.
Please see the Appendix for additional information and data on the
retail demand contributions for each trade area and each customer
type for the Kamp Washington node.
PRIMARY TRADE AREA (PTA)
The following customer groups contribute demand for the Kamp
Washington node.
Resident-Generated Demand
Based on 2012 estimates, 14,096 people currently reside in 4,458
households in the PTA. The median household income is $84,819. 2
Workforce-Generated Demand
According to 2013 U.S. Census estimates, there are 16,845 daytime
employees in the PTA. Of the overall total, approximately 37 percent
serve in Executive and Professional roles and 32 percent serve in
Administration and Support roles. 3
University Student-Generated Demand
The Kamp Washington node’s PTA is shaded in dark blue. Its STA is denoted by the medium blue
University students are also major contributors to the Kamp area. Its TTA is denoted by the light blue area.
Washington node’s customer base. For 2013, the number of
students actively enrolled in classes at George Mason University was
18,562(FTE). Annual personal spending of George Mason University
students is estimated at $3,623.4
Visitor-Generated Demand
Visitors are part of the Kamp Washington node’s retail customer base.
In 2012, approximately 212,300 visitor nights were recorded in the
Kamp Washington PTA’s hotels.
2 All demographic and income statistics were derived from a U.S. Census/Nielsen Solution Center, April 2013 Report.
3 Workforce Demographics and Business Facts reports created for Streetsense, April 2013.
4 Annual average personal spending by university students is estimated based on calculations from data collected from the offices of financial aid and student registration, College Board estimates, and requirements of university dining and
parking programs.
24KAMP WASHINGTON NODE (RETAIL)
SECONDARY TRADE AREA (STA) TABLE 9. KAMP WASHINGTON STATISTICS BY TRADE AREA
Resident-Generated Demand KAMP KAMP KAMP
For 2012, an estimated 87,865 people reside in 30,581 households WASHINGTON WASHINGTON WASHINGTON
within the STA. The median household income is $106,474. 5 PTA STA TTA
NUMBER OF 14,096 87,865 45,147
RESIDENTS
TERTIARY TRADE AREA (TTA) NUMBER OF 4,458 30,581 18,814
HOUSEHOLDS
Resident-Generated Demand
MEDIAN $84,819 $106,474 $103,162
For 2012, an estimated 45,147 people reside in 18,814 households
HOUSEHOLD
within the TTA. The median household income is $103,162.6
INCOME
WORKFORCE 16,845 N/A N/A
POPULATION
5 U.S. Census Bureau data generated through the Nielsen Company/Claritas Demographics report created for Streetsense, April 2013.
6 U.S. Census Bureau data generated through the Nielsen Company/Claritas Demographics report created for Streetsense, April 2013.
25KAMP WASHINGTON NODE (RETAIL)
RETAIL DEMAND
Each of the three major retail categories has distinctive characteristics TABLE 10. LOW-PRODUCTIVITY AND HIGH-PRODUCTIVITY RETAIL DEMAND
that influence tenant location decisions and shopping patterns.
These factors significantly affect each retail node’s capture rates for
KAMP WASHINGTON NODE
customer expenditures within the trade areas.
CATEGORY TOTAL DEMAND- TOTAL DEMAND-
The adjacent table totals the cumulative demand of residents, LOW PRODUCTIVITY HIGH PRODUCTIVITY
workforce, university students, and visitors within the Kamp (SQUARE FEET) (SQUARE FEET)
Washington node’s PTA, STA, and TTA. NEIGHBORHOOD 220,683 179,505
GOODS & SERVICES
FOOD & BEVERAGES 69,742 48,749
GAFO 12,886 11,718
TOTAL RETAIL 303,311 239,972
DEMAND
INCREMENTAL RETAIL DEMAND FORECASTS
As development or redevelopment occurs throughout the western TABLE 11. INCREMENTAL RETAIL DEMAND INCREASES BY DEVELOPMENT TYPE
end of Fairfax City, the demand for retail will expand. Different
types of real estate development will generate different amounts of KAMP WASHINGTON NODE
additional demand for Kamp Washington. Additionally, the amount
of incremental demand will vary based on its relative position in either Additional Square Feet of Retail
the primary or secondary trade areas. Demand Generated by Customer
Trade Area (SQUARE FEET)
For commercial office real estate, additional demand is limited to Development Type and Unit Within the PTA Within the STA
development within the primary trade area. Tertiary trade area EACH ADD’L MULTIFAMILY 7 4
development is not factored into the incremental demand calculation, HOUSING UNIT
as the cumulative impact of projects at this distance is too small to
register a difference. EACH ADD’L TOWNHOUSE 7.5 5
EACH ADD’L SINGLE-FAMILY 9 5
HOME
EACH ADD’L 1,000 SF OF 2 N/A
CONSTRUCTED OR NEWLY
OCCUPIED COMMERCIAL
OFFICE
EACH ADD’L HOTEL ROOM 8 3
26KAMP WASHINGTON NODE (RETAIL)
RETAIL SUPPLY
The Kamp Washington Retail Inventory includes a total of 108 TABLE 12. DISTRIBUTION OF RETAIL-APPROPRIATE SPACE, KAMP WASHINGTON NODE
locations that were surveyed and recorded in April 2013. This total
included 89 retail establishments and 19 retail-appropriate spaces that CLASSIFICATION TOTAL AMOUNT PERCENTAGE
are vacant or currently occupied by a non-retail use. For the purposes (SQUARE FEET)
of the supply analysis, total square footages are the prevailing source TOTAL RETAIL- 517,207 81.9%
of data. TENANTED SPACE
The total amount of retail-appropriate space in the Kamp Washington TOTAL NON-RETAIL 89,765 14.2%
node is estimated at 631,293 square feet. TENANTED SPACE
TOTAL VACANT 24,321 3.9%
Of the total amount of retail-appropriate space, approximately 89,765 SPACE
square feet (14.2 percent) are currently occupied by non-retail users.7 TOTAL 631,293 100%
An additional estimated 24,321 square feet (3.9 percent) are vacant.
Combined, these two figures constitute an “underutilized space rate”
of 18.2 percent. More precisely, approximately 114,086 square feet of
retail-appropriate space located in the Kamp Washington node are not
occupied by retail operations.
The total amount of space currently occupied by retail establishments
is approximately 517,207 square feet.
Of the 89 retail-occupied spaces in the Kamp Washington node,
25 existing tenants are included in the F&B category. Contributing
approximately 56,429 square feet, F&B retailers constitute 11 percent
of the existing inventoried retail space in the node.
In the GAFO category, 42 existing tenants were identified. Accounting
for approximately 340,349 square feet, GAFO retailers occupy 66
percent of existing inventoried retail space.
The 22 NG&S retailers in the Kamp Washington node total
approximately 120,429 square feet, or 23 percent, of existing
inventoried retail space.
7 Non-retail uses typically found in ground-level spaces include professional offices (including offices for doctors, dentists, attorneys, accountants, tax preparation professionals, and travel agents), post offices, churches, and studios.
27KAMP WASHINGTON NODE (RETAIL)
MODIFIED INVENTORY
The estimated “modified inventory” for the retail supply in the Kamp TABLE 13. MODIFIED INVENTORY SUPPLY CALCULATION FOR KAMP WASHINGTON NODE
Washington node is approximately 408,239 square feet. This figure
was determined by assigning a probability percentage of 90 percent CLASS OF TOTAL AMOUNT EFFICIENCY MODIFIED
for Class A space, 82 percent for Class B space, 75 percent for Class C SPACE OF RETAIL- INVENTORY
space, and 50 percent for Build-to-Suit space. 8 OCCUPIED SPACE (SQUARE FEET)
(SQUARE FEET)
A 134,491 90% 121,042
B 103,959 82% 85,246
C 250,287 75% 187,715
BTS 28,470 50% 14,235
TOTAL 517,207 408,239
8 Probability percentages for classes of space are derived from a database of information compiled and maintained by Streetsense. This information is proprietary and determines retention rates and real estate performance
benchmarks in retail markets similar the Kamp Washington node’s total supply and demographics.
28You can also read