Neighborhood Gentrification across Harris County: 1990 to 2016 - The ...
←
→
Page content transcription
If your browser does not render page correctly, please read the page content below
Neighborhood Gentrification
across Harris County:
1990 to 2016

                                      Patrick Feller/flickr

                              Building Better Cities
                              Building Better Lives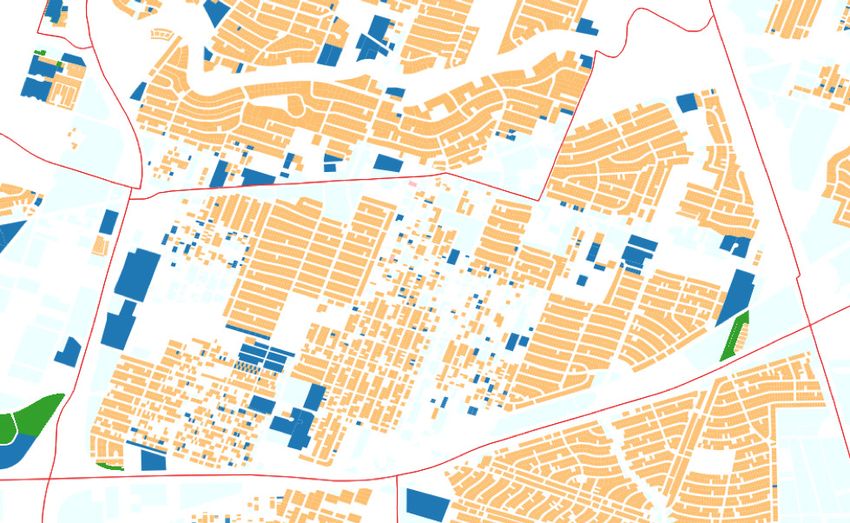
December 2018

Report contributors: Wendie Choudary, Jie Wu, Mingming Zhang

Rice University
Kinder Institute for Urban Research
6100 Main Street, MS-208, Houston, TX 77005

For more information, contact kinder@rice.edu or 713-348-4132.

Copyright © 2018 by Rice Kinder Institute for Urban Research
All rights reserved.
EXECUTIVE SUMMARY

                              Executive Summary

                              D     uring the past three decades or so, many neighborhoods across
                                    Houston have experienced disinvestment and reinvestment.
                              With an influx of high-income households, certain low- and
                              moderate-income neighborhoods are experiencing rising housing
                              costs. At the same time, those neighborhoods have seen greater
                              socioeconomic change, particularly in racial composition, educational
                              attainment, in addition to increases in rent and property taxes. This
                              phenomenon, referred to as gentrification, changes both the social
                              character and the built environment of a neighborhood. It often
                              eliminates affordable housing options, deep-rooted social networks
                              and longstanding amenities.

                              Although gentrification is a national issue, Houston’s specific combination of socioeconomic and
                              cultural diversity as well as sprawling residential patterns has led to a unique set of challenges.
                              The inventory of affordable housing has been diminishing. Environmental shocks like Hurricane
                              Harvey exacerbate housing challenges, propelling neighborhood change in unintended directions.
                              A broad analysis of gentrification in Houston is needed to understand its processes and scales.

                              The purpose of this framing report is to document recent neighborhood changes indicative of gen-
                              trification and to inform the development of strategies to support equitable revitalization instead.
                              This report uses data from the various sources including the U.S. Decennial Censuses, American
                              Community Surveys, Neighborhood Change Database and other data to understand neighborhood
                              change in Houston by defining gentrified neighborhoods and identifying its mechanisms across
                              Harris County. Specifically, this report identifies which neighborhoods experienced gentrification
                              between different time periods, showcasing a typology of gentrification across Harris County. The
                              susceptibility index and case studies further illustrate neighborhoods at higher risk of gentrifica-
                              tion pressures. We created a web-based data tool at www.datahouston.org/story/gentrification.

Neighborhood Gentrification across Harris County: 1990 to 2016                                                                    1
EXECUTIVE SUMMARY

                                                                                                                                             Paul Cone/flickr
Key Findings
 !! Gentrification across Houston has accelerated since         !! Communities have utilized local land-use policies,
     2000. Very little gentrification occurred from 1990 to       deed restrictions, homestead exemptions, community
     2000, while the period between 2000 and 2010 saw             land trusts and community engagement strategies,
     the greatest change. Growing gentrification patterns         attempting to take control of gentrification.
     emerge during the time period between 2010 and 2016.         Neighborhoods identified as currently gentrifying
                                                                  may benefit the most from these strategies and from
 !! Many gentrified neighborhoods are inside the 610
                                                                  additional housing policy initiatives.
     loop (73 out of 783 census tracts1 in Harris County),
     but a greater number of gentrified neighborhoods are
     outside the 610 loop (144 census tracts).

 !! Regression results indicate that virtually all
     neighborhoods on the east side of Houston inside
     the 610 loop are susceptible to gentrification in the
     near future.

 !! Case studies selected by relatively high susceptibilities
     reveal unique housing and demographic differences
     among the Fifth Ward, OST/South Union and
     Greenspoint neighborhoods.

 2                                                                                     Rice University Kinder Institute for Urban Research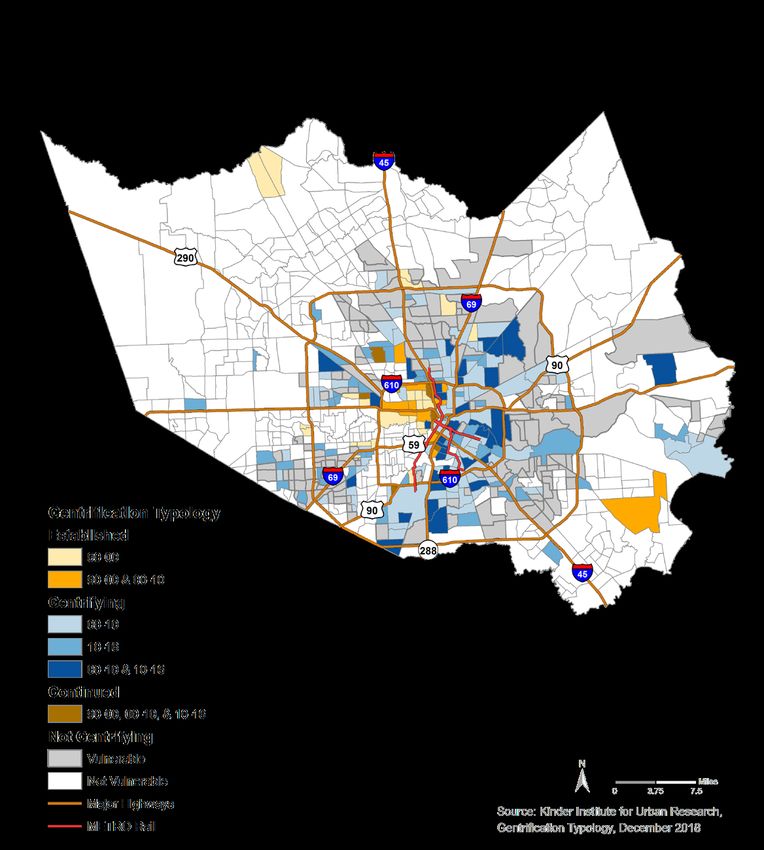
TABLE OF CONTENTS

                                                            Table of Contents

                                                     4      Introduction

                                                     6      What is Gentrification

                                                     9      Gentrification Typologies

                                                   13       Gentrification Susceptibility

                                                   23       Conclusion and Discussion

                                                   25	Appendix A:
                                                       Principal Component Analysis

                                                   27	Appendix B:
                                                       Multivariate Logistic Regression
                                                       and Susceptibility Index

                                                   29	Appendix C:
                                                       Data and Methodological Limitations

                                                   31       Endnotes

Neighborhood Gentrification across Harris County: 1990 to 2016                                             3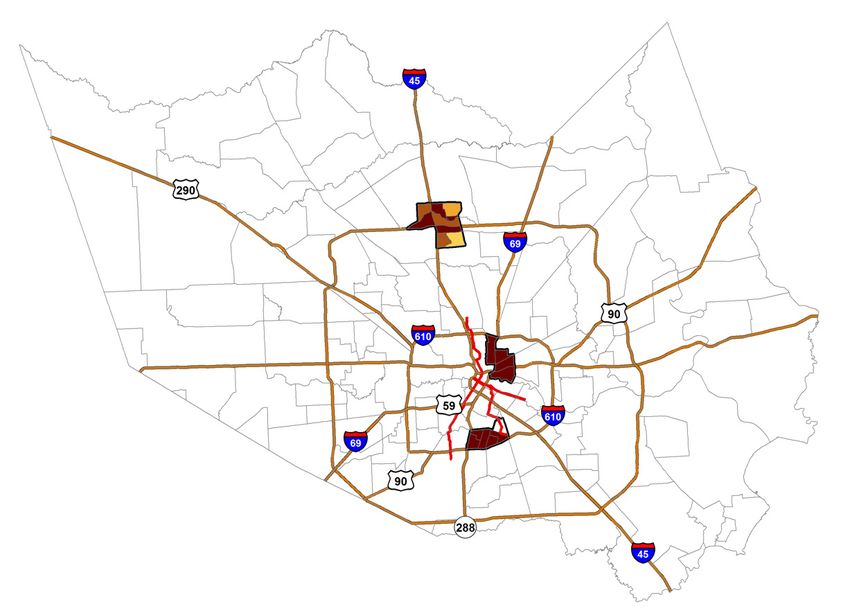
INTRODUCTION

Introduction

N     eighborhoods across Houston are experiencing increases in housing costs
      due to shifts in housing and neighborhood demographics. Higher-income
households are moving into predominately lower-income neighborhoods. Since
1990, low- and moderate-income urban neighborhoods have been experiencing
more socioeconomic changes, particularly in racial composition and educational
attainment, in addition to the change in housing stock and costs.2 Although
neighborhoods continuously evolve, some households benefit from considerable
transformations in the social and built environment while disadvantaged
households are economically challenged by rising housing costs caused by the
in-migration of more affluent households and facing pressures of unwanted
neighborhood changes.

Two schools of thought surround the gentrification              equitably revitalized neighborhoods, but not in gentrified
issue.3 One argues that gentrification patterns revitalize      neighborhoods. An equitably revitalized neighborhood
deteriorating buildings and landscaping, increase county        would provide housing preservation, new mixed-income
revenues and promote neighborhood racial and income             housing and even employment opportunities that benefit
diversity. The other contends that in the face of gentrifica-   existing residents.
tion pressures, increased
                                                                                                                In this report, gentrifica-
rent and property values
                                                                                                                tion is framed around the
push out existing residents
                                                                                                                broader context of hous-
and weaken any potential
                                                                                                                ing market conditions.
positive changes gener-
                                                                                                                Houston’s combination
ated from neighborhood
                                                                                                                of growing socioeconom-
growth and development.
                                                                                                                ic, cultural diversity and
The effects of gentrifica-
                                                                                                                its historical residential
tion arguably dismantle
                                                                                                                sprawling pattern has led
deep-rooted cultural
                                                                                                                to unique housing market
traditions and deprive
                                                                                                                challenges. Housing prices
existing residents of local
                                                                                                                across the country have
services, like health, social
                                                                                             Paul Cone/flickr

                                                                                                                steadily increased in the
and education benefits that
                                                                                                                1990s and skyrocketed in
would be received from
                                                                                                                the early 2000s. Prices be-

 4                                                                                       Rice University Kinder Institute for Urban Research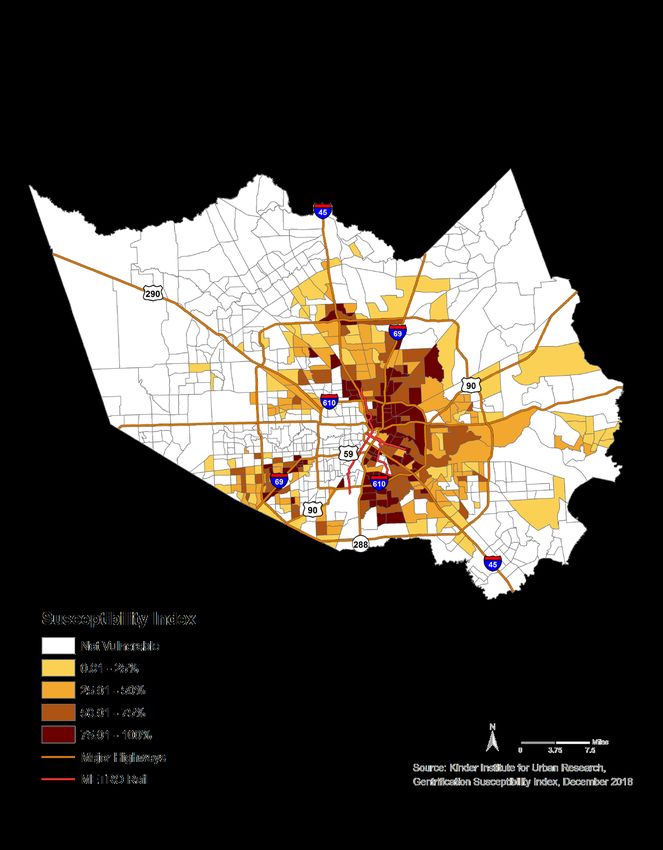
INTRODUCTION

FIGURE         1       House Price Index for U.S. and Houston MSA: 1990–2018

               440.0

               400.0

               360.0

               320.0

               280.0

               240.0

               200.0

               160.0

               120.0

                80.0

                40.0
                     1990         1992          1994           1996          1998          2000          2002           2004     2006    2008   2010     2012   2014   2016     2018
                                                                                   Recessionary Period                         Houston (MSA)      U.S.

                       Source: Houston Metro area housing price index (HPI), U.S. Federal Housing Finance Agency, 1990–2018.

gan to fall in 2007 due to the latest recession, but bounced                                                   nearly a quarter of Houston renters allocate more than 50
back beginning in 2012. In contrast, Houston’s housing                                                         percent of their income to housing, which is considered
prices show a much smoother pattern. It remained steady                                                        “severely cost-burdened.”
in the 1990s and began steadily rising during the 2000s,
                                                                                                               New housing development in the urban core often targets
only dipping slightly in 2011, most likely due to a lagged
                                                                                                               higher-income households rather than low- and moderate-
effect of the recessionary period, but bounced back
                                                                                                               income households. Furthermore, high housing costs
since 2012. The increases tend to concentrate in specific
                                                                                                               put homeownership out of reach for many low-income
neighborhoods rather than spreading across the city as a
                                                                                                               households. Due to limited affordable housing options,
whole.4 On one hand, the inventory of affordable housing
                                                                                                               residents have unsatisfactory choices: move to distant
has been slowly diminishing.5 On the other hand, antic-
                                                                                                               areas with long commutes, pay more than they can afford,
ipated growth in demand for housing in higher-demand
                                                                                                               bear potential overcrowding or leave the neighborhood or
locations drives the potential for additional gentrifying
                                                                                                               city altogether.
neighborhoods. Disasters like Hurricane Harvey might
exacerbate housing supply problems, propelling neigh-                                                          This report aims to advance the understanding of gentri-
borhood change in potentially unintended directions such                                                       fication in the region. In the following sections, we first
as further gentrification.                                                                                     provide a definition of gentrification in Houston’s context
                                                                                                               and identify the level of neighborhood change across
At the same time, the median household income in Harris
                                                                                                               Harris County. Next, we identify factors highly associated
County has dropped since 2000.6 Low- and moderate-in-
                                                                                                               with gentrified neighborhoods, and locate neighborhoods
come residents struggle to afford rising housing costs.
                                                                                                               susceptible to gentrification in the near future. Finally,
The median monthly housing costs are $1,183 for home-
                                                                                                               we discuss some possible land use policies, bringing
owners7 and $937 for renter households. Compared to
                                                                                                               attention to equitable development policies that practi-
the median household income, the cost burden is ap-
                                                                                                               tioners and policymakers can use to accommodate the
proximately 18 percent for homeowners and 30 percent
                                                                                                               change while respecting local communities’ cultures.
for renters respectively. The U.S. Housing and Urban
                                                                                                               Additionally, we created an online interactive map at
Department (HUD) defines cost-burdened families as
                                                                                                               www.datahouston.org/story/gentrification to facili-
those “who pay more than 30 percent of their income for
                                                                                                               tate the use of data from this report.
housing.” Indeed, the average family is cost-burdened in
50 percent of Harris County census tracts. Meanwhile,

Neighborhood Gentrification across Harris County: 1990 to 2016                                                                                                                  5
WHAT IS GENTRIFICATION

What is Gentrification

G     entrification is a process of neighborhood change characterized by migration
      of middle- and upper-income groups into disinvested urban neighborhoods,
resulting in a loss of affordable housing and a transformation of the social character
of a neighborhood.8 Unlike neighborhood revitalization, the process of gentrification
has adverse effects on neighborhoods and residents, not only altering the historical
culture and character of urban neighborhoods, but also economically overburdening
existing residents and potentially displacing them.9

As a social issue, gentrification is heavily shaped by        The goal of this report is not to seek to resolve the negative
housing market pressures and rooted in economic and           effects of gentrification, rather to anticipate gentrification
racial inequality. It is well documented that higher income   pressures at a time in which the process can still be altered
households have put pressure on and overburdened              and to build the social and political power needed to im-
historically non-white communities.10 Although neighbor-      plement and/or expand the strategies to prevent negative
hood conditions and services appear to be improving, re-      impacts of gentrification. We do not argue that gentrifica-
search has shown that disadvantaged residents, including      tion displaces residents, rather it may disproportionately
minorities and low- and moderate-income households,           overburden some more than others, and thus gentrifica-
gained less from these improved conditions and services       tion could be framed in terms of “equitable development.”
than other residents.11 Market pressures and loss of pre-
ferred services and amenities may force existing residents    Gentrification Process
to move out, thus displacing them and challenging their
                                                              The gentrification process can take on different forms as
neighborhood’s ability to retain racial and economic di-
                                                              not all neighborhoods evolve or respond to change the
versity.12 For example, much of the Fourth Ward was once
                                                              same way. One study found four dominant gentrification
known as Freedmen’s Town with predominantly African-
                                                              processes in Houston: locally driven urban renewal, private
American residents filled with single-family homes. After
                                                              sector block-busting, refurbishment of existing structures
HUD’s decision to demolish 677 of the 963 units in the
                                                              and teardowns.15 Although there is variation in the process
Allen Parkway Village public housing project in the late
                                                              of gentrification, key elements include the following:
1990s,13 much of the original low-income housing was
replaced by townhomes, mid-rise apartments and other           !! Disinvestment and reinvestment
commercial developments and the community is now
                                                               !! Loss of affordable housing
commonly referred to as Midtown instead. The historical
community once thrived with successful local businesses        !! Physical upgrading of residential neighborhood
and vibrant arts and culture, but an influx of more afflu-
                                                               !! Upward movement of residents’ socioeconomic status
ent residents changed that landscape.14

 6                                                                                      Rice University Kinder Institute for Urban Research
WHAT IS GENTRIFICATION

FIGURE         2       Market-Driven Process of Gentrification

  1. Investors, or individuals,                2. Renovation of proper-       3. Confident in neigh-           4. Incomes and property
      identify the potential rent                   ties and reinvestment in        borhood, newcomers                values increase, stock
      gap and purchase plot                         neighborhood, initiates         of higher income and              of affordable housing
      of disinvested, decaying                      social and physical             different characteristics         units decreases, undue
      houses, vacant land, or                       neighborhood changes.           move in and reshape               burden on existing resi-
      old housing not being                                                         neighborhood.                     dents, original character
      used to full potential.                                                                                         of neighborhood lost.

                                    Rent Gap

Figure 2 demonstrates one example of a typical mar-                            hoods) in Harris County have gentrified, are gentrifying
ket-driven process of gentrification. A neighborhood,                          or may be susceptible in the future incorporates several
often older, vacant or decaying in some way experiences                        methods from previous studies. We made modifications
disinvestment, in which a rent gap emerges, that is the dif-                   to reflect the unique character of Houston.
ference between the value of the property before renova-
                                                                               We utilized three overall criteria to ascertain if a tract gen-
tion and after renovation. Speculators have been known
                                                                               trified within a given time period: vulnerability, sociode-
to deliberately disinvest in areas that could be of high de-
                                                                               mographic change and investment change. These criteria
mand until the value of the property is so low that renova-
                                                                               are shown in Figure 3 and described in detail below.
tion and selling would yield a higher profit. The larger the
rent gap, the more investment in the neighborhood and
surrounding neighborhoods would be. Investors could re-                           FIGURE       3      Gentrification Criteria
invest in the area by purchasing the house or large plots of
land and renovating. Once the neighborhood shows signs                            Vulnerability in Base Year (3 out of 4)
of resurgence, and prices or rentals of renovated proper-                          !! % Low-Income Households > County Median
ties exceed those of existing ones, newcomers of differ-                           !! % Population 25+ without Bachelor’s Degree
ent demographics and social practices move in, further                                 or Higher > County Median
raising the overall costs of housing. Existing residents                           !! % Non-White population > County Median
then must contend with those neighborhood changes in
                                                                                   !! % Renter Households > County Median
addition to rising rents and property taxes.

Other models of gentrification include alternative out-                           Sociodemographic Change
comes, such as waves of gentrifiers, the addition of                               !! Change in % Population 25+ with Bachelor’s Degree
professionals, construction of luxury condos and apart-                                or Higher > County Change
ment complexes and the effects of natural disasters.16                                             OR
For example, a neighborhood may go through a sudden                                !! Change in Median Household Income >
change, such as flooding or wildfire. Residents who are                                County Change
                                                                                                   AND
unable to afford repairs may opt to sell the property to
investors—a situation that may put existing residents
                                                                                   !! Change in % Non-Hispanic White Population >
                                                                                       County Change
at risk of displacement. In some cases, certain housing
policies and practices may have major consequences in
                                                                                  Investment Change
specific neighborhoods, such as what has happened to the
Freedmen’s Town.
                                                                                   !! Change in Median Monthly Gross Rent >
                                                                                       County Change
                                                                                                   OR
Gentrification Criteria                                                            !! Change in Median Home Value > County Change
Based on these processes of gentrification, our approach
to determine which census tracts17(proxies for neighbor-

Neighborhood Gentrification across Harris County: 1990 to 2016                                                                                    7
WHAT IS GENTRIFICATION

Vulnerability Criteria                                         depending on occupation and family circumstances.
                                                               Thus, we allowed the sociodemographic change compo-
A tract is considered vulnerable to gentrification if it
                                                               nent to be either change in percent population 25 and over
exhibits three out of the four characteristics compared to
                                                               with a bachelor’s degree or higher or change in median
the county median18 in the base year: 1) a higher percent-
                                                               household income higher than the county change.21
age of low-income households, 2) a higher percentage of
individuals 25 years and older without at least a bachelor’s   Furthermore, change in racial and ethnic composition is
degree, 3) a higher percentage of non-white population         also included because gentrification has been shown to
and/or 4) a higher percentage of renter households.            include demographic changes, particularly a dominant
                                                               social group moving into an area with a predominantly
Low-income households were defined as households that
                                                               non-white population.22
had an income below 80 percent of the county median,
which is the standard definition by the U.S. Department
                                                               Investment Change Criteria
of Housing and Urban Development. Low-income neigh-
borhoods are vulnerable because of potential rent gaps.        Finally, we included a component on investment change.
                                                               We used median home value and median gross rent to
Educational attainment is a key indicator of socioeco-
                                                               reflect investment in communities, including the quality
nomic status and highly correlated with personal income.
                                                               of various neighborhood amenities. High rents are indic-
Census tracts with fewer college-educated individuals are
                                                               ative of market demand and home values in the area, but
more vulnerable and at risk of gentrification.
                                                               may not occur in step with each other. Thus, we allowed
Percent non-white is included in the vulnerability criteria    the investment change component to be either change in
because gentrification is linked with changes in racial        rent or change in home value greater than the county’s
composition of a neighborhood, particularly a dominant         overall change.
social group moving into an area with a predominantly
minority population. The dominant social group, in terms       Gentrification vs. Displacement
of political power and socioeconomic status in Houston’s
                                                               Gentrification and displacement are often entangled
context, is non-Hispanic whites.
                                                               concepts, yet it is important to understand their differ-
Generally, renters have less capacity to challenge unwant-     ences, and why we do not measure displacement in this
ed neighborhood change. Increases in property value            report. As previously defined, gentrification is a process
mean higher property tax included in the rent. Thus,           of neighborhood change that includes socioeconomic and
neighborhoods with more rental units are less stable and       demographic change based on income, education, racial
more susceptible to gentrification.19                          makeup and investment in a previously disinvested neigh-
                                                               borhood. Residents of gentrifying neighborhoods are often
Sociodemographic Change Criteria                               non-white and lower-income. As high-income residents
                                                               move into these neighborhoods, existing residents become
Gentrification is predominantly described as a neighbor-
                                                               susceptible to economic pressures, potentially forcing
hood’s transformation over time. A socioeconomic change
                                                               them to move. Displacement, then, is a possible conse-
component is required because the process of gentrifica-
                                                               quence of the process of gentrification.23 Displacement
tion includes an influx of relatively affluent households.
                                                               occurs when residents are unable to afford to remain in
Therefore, we examined whether the tract’s sociodemo-
                                                               their homes because of rising rents or property taxes, and
graphic change was greater than the county’s change from
                                                               involuntarily move out of the neighborhood and settle in
the base year to the end of a given time period.
                                                               less desirable communities. Unfortunately, most aggre-
Both household income and education are measures of            gate data are unable to capture and estimate the true loss
socioeconomic status. Educational attainment is relatively     of low-income residents in a given neighborhood, in addi-
stable compared to median incomes.20 However, col-             tion to their reasons for moving.24 Not all moves out of a
lege-educated individuals may not see increases in income      changing neighborhood count as displacement.

 8                                                                                     Rice University Kinder Institute for Urban Research
GENTRIFICATION TYPOLOGIES
Gentrification Typologies
G entrification occurs in many stages and intensities and can come in waves
over time.25 Cities across the U.S. saw an acceleration of gentrification during
the 2000s compared to the 1990s due to a more dramatic set of economic and
demographic changes.26
This pattern is evident in Houston. Figure 4 shows a side- ic recessions, spikes in housing prices, natural disasters
by-side comparison of the share of Harris County’s census and recovery, etc. This indicates why it is important to look
tracts that are or were vulnerable to gentrification and had at the density of gentrified tracts by time periods.
a greater change than the county’s overall change by attri-
Previous research has relied on data only available at the
bute and time period. For example, among Harris County’s
time, which has been the decennial census, making the
783 census tracts, more than 20 percent had experienced
change in the intervening years obsolete. We find that
increases in median gross rent faster than the county aver-
in the case of Houston, there was much change between
age from 2000 to 2010,27 compared to 11 percent from 1990
2000 and 2010, but the housing market took an upswing
to 2000. This suggests acceleration in gentrification across
around 2012, indicating further change occurring that
Houston since 2000. Figure 4 also shows that socioeco-
could be captured using recent data from 2012–2016
nomic and investment changes differ between the time pe-
American Community Survey.
riods, possibly indicating boom and bust periods, econom-
FIGURE 4 Percent of Census tracts in Harris County vulnerable to gentrification
and seeing a large gain relative to county by attribute and time period
40%
35%
35%
30%
Percent of Census Tracts
30%
25% 22% 21%
19%
20%
15%
15% 14% 13% 14%
11% 12%
10% 9%
5%
0%
% 25+ with Bachelor's+ % Non-Hispanic White Median Gross Rent Median Home Value
1990–2000 2000–2010 2010–2016
Source: Census 1990, 2000, 2010, American Community Survey 2012–2016 5-year estimates, Census Bureau.
Neighborhood Gentrification across Harris County: 1990 to 2016 9GENTRIFICATION TYPOLOGIES
Figure 5 and Figure 6 illustrate the typology key for defin- 1990s and 2000s, 175 in the 2000s and later and six
ing gentrified tracts during the time period in this report. continuously since 1990.
A tract first has to be considered gentrifiable or vulnerable,
!! 165 census tracts (21 percent) were vulnerable to
meaning the neighborhood must be specified as vulnerable
gentrification but did not gentrify between 1990
to gentrification in the first year of the time period based
and 2016.
on the four criteria: share of low-income households, edu-
cated individuals, renters and/or non-white individuals. !! 401 census tracts (51 percent) were not vulnerable to
gentrification and did not gentrify during that time.
As listed in Figure 6:
!! Tracts meeting criteria for gentrification were broken
!! 217 census tracts (28 percent of all tracts) gentrified
out into three categories: “established,” “gentrifying”
sometime between 1990 and 2016, including 36 in the
and “continual” tracts.
FIGURE 5 Gentrification Index Timeline
1990 2000 2010 2016
Established Gentrifying Gentrifying
Established
Gentrifying
Continual
FIGURE 6 Gentrification Typology Description
Type and Time Period Definition # of Tracts
Established / Gentrified
Vulnerable in 1990. Gentrified between 1990 and 2000, but was not gentrifying anytime
1990–2000 24
between 2000 and 2016.
1990–2000 Vulnerable in 1990 and 2000. Gentrified from 1990 to 2000 and 2000 to 2010, but did
12
& 2000–2010 not gentrify from 2010 to 2016.
Gentrifying
Vulnerable in 2000. Gentrified between 2000 and 2010, but did not gentrify between
2000–2010 87
1990 and 2000 or 2010 and 2016.
Vulnerable in 2010. Gentrified between 2010 and 2016, but did not gentrify from 1990 to
2010–2016 53
2000 or 2000 to 2010.
2000–2010 Vulnerable in 2000 or 2010. Gentrified anytime between 2000 and 2016, but did not
35
& 2010–2016 gentrify from 1990 to 2000.
Continual
1990–2000, 2000– Vulnerable in 1990, 2000, or 2010. Gentrified from 1990 to 2000, 2000 to 2010 and from
6
2010 & 2010–2016 2010 to 2016.
Not Gentrifying
1990–2016 Vulnerable in base year, but did not gentrify anytime between 1990 and 2016. 165
Not Vulnerable
1990–2016 Tract was not vulnerable in base year, and did not gentrify between 1990 and 2016. 401
Total Number of Tracts Included in the Analysis: 783
*Note: The data only include census tracts with at least 500 residents in 2010. This removes three census tracts from the dataset. Data sources include 1990 and 2000 U.S. Decennial Census and 2006–2010 (proxy for 2010) and 2012–2016
(proxy for 2016) American Community Survey 5-Year Estimates.
10 Rice University Kinder Institute for Urban ResearchGENTRIFICATION TYPOLOGIES FIGURE 7 Gentrification Typology28 Neighborhood Gentrification across Harris County: 1990 to 2016 11
GENTRIFICATION TYPOLOGIES

Established Tracts                                                Our definition of gentrifying suggests these tracts are
                                                                  recently or currently experiencing gentrification process-
A tract is considered “established” in its gentrification if it
                                                                  es and its effects in the neighborhood. For example, Third
has displayed patterns of gentrification in the past but has
                                                                  Ward is considered a gentrifying neighborhood with gen-
shown little to no signs of current or ongoing neighbor-
                                                                  trification patterns from both the 2000 to 2010 and 2010
hood change. Such a neighborhood exhibits a fixed neigh-
                                                                  to 2016 time periods. Buildings in Third Ward have been
borhood makeup with little room for reversal—at least not
                                                                  demolished at a higher rate than buildings county-wide.
for several more decades. In classifying established tracts,
                                                                  Vacant land, neglected properties and low housing costs
we included tracts that gentrified in both the 1990 to 2000
                                                                  make the community open to development, but what type
and 2000 to 2010 time periods.
                                                                  of development and its impacts on its residents is uncer-
We found 36 established tracts (5 percent of all tracts). Of      tain. For these reasons, over the years, groups like the
these, 24 tracts gentrified between 1990 and 2000 and 12          Emancipation Community Development Partnership are
gentrified during both time periods. Gentrification can           formed, to support the development and implementation
take place over more than a 10-year time frame so chang-          of neighborhood revitalization strategies.30
es from both 1990 to 2000 and 2000 to 2010 may imply
                                                                  Many of the areas gentrifying are on the east side of
change at a slower rate, which is consistent with previous
                                                                  Houston, especially east of State Hwy 288 and U.S. Route
studies on former gentrification.29
                                                                  69, such as Eastex-Jensen, Trinity, Lawndale-Wayside and
Although gentrification has traditionally been studied            Magnolia Park within or near the 610 loop. Slightly south
as a central-city phenomenon, we find several neighbor-           of the 610 loop, neighborhoods like Sunnyside, South
hoods outside the 610 loop and even outside Beltway 8             Park and South Acres are also gentrifying. Southwest of
that gentrified in the 1990s, such as the Tomball neigh-          the 610 loop, pockets of Alief, Sharpstown and Gulfton are
borhood in the northwest corner of Harris County and              showing signs of gentrifying. As expected, however, most
the La Porte area. The Washington Corridor and the                neighborhoods within the 610 loop are gentrifying except
Heights within the 610 loop also gentrified in the 1990s.         the tracts within “Houston’s Arrow” that houses the city’s
Interestingly, the La Porte area and Washington Corridor          most affluent households31.
have different demographics and residential fabrics. La
Porte is highly industrial with working-class households,         Continually Gentrifying Tracts
while Washington Corridor is more affluent. Although
                                                                  Because of continued gentrification, six tracts (less than
Washington Corridor’s socioeconomic changes were much
                                                                  one percent) experienced ongoing gentrification from
greater than La Porte’s, both were classified as established.
                                                                  1990 to 2016. We defined a “continual” tract as gentrifying
                                                                  during all three time periods, between 1990 and 2000,
Gentrifying Tracts
                                                                  2000 and 2010 and 2010 and 2016. Similar to gentrifying
We classify “gentrifying” tracts as those that were gentri-       tracts, continual tracts may still be experiencing ongoing
fying from 2000 to 2010, 2010 to 2016 or during both time         patterns of gentrification. These neighborhoods include:
periods. We found 175 such tracts altogether (22 percent          parts of Washington East, Acres Home, Willow Meadows,
of all tracts in Harris County). Of these, 87 (11 percent)        Third Ward and Spring Branch East. Continual tracts
gentrified between 2000 and 2010 but not afterward, 53            were found both inside the 610 loop and between the 610
(7 percent) gentrified between 2010 and 2016 and 35 (5            loop and Beltway 8.
percent) gentrified in both time periods.

12                                                                                         Rice University Kinder Institute for Urban Research
GENTRIFICATION SUSCEPTIBILITY
Gentrification Susceptibility
W e also undertook a gentrification susceptibility analysis, which revealed that
virtually all census tracts on the east side of the 610 loop are vulnerable to
future gentrification.
Gentrification literature suggests several common probability that it will gentrify post-2016. Tracts suscepti-
characteristics in gentrified areas: income, race, housing ble to gentrification post-2016 are mapped in Figure 8.
stock, security in housing tenure, location, amenities and
Results indicated many of the tracts that have or are
access to jobs and transportation. Principal component
currently experiencing gentrification have a high likeli-
analysis (PCA) was performed analyzing around 30 to 50
hood of continuing to gentrify. Several tracts near neigh-
variables between 2000 and 2016 and between 2010 and
borhoods of Sharpstown, Westwood, Alief and Gulfton
2016.32 Our PCA results in Appendix A indicated multiple
appear to have a higher likelihood of gentrifying in the fu-
key factors driving gentrification across Harris County.
ture. Many tracts just south of the 610 loop and east of the
These results informed the variable selection for our
SH 288, appear to show a high likelihood of gentrifying,
probability analysis.
with an index of 75 percent or more. Neighborhoods like
To identify factors that make a neighborhood likely to Sunnyside, the east side of South Acres/Crestmont Park
gentrify, we applied a multivariate regression technique, and all of South Park exhibit steep probabilities of gentri-
specifically a logit model using forward selection and test- fying. Similarly, most of Northeast Houston appears to be
ed nearly 30 different attributes based on the PCA results. at risk for gentrification, though at different levels. Other
These variables fell into four categories: sociodemograph- neighborhoods in North Central Houston indicated at
ic, housing, transportation and location. For example, the risk include Independence Heights, Greenspoint, parts of
regression results suggest that areas with more renters Klein Far South and Acres Home. In Houston Southeast,
paying more than 35 percent of their income on rent in neighborhoods such as Pecan Park, Magnolia Park and
2000 have a higher probability of gentrifying in 2016. Lawndale/Wayside are also at risk of gentrification. Those
Holding all other variables constant, areas with more with less risk include neighborhoods on the outskirts
married families with children in 2000 are less likely to of Harris County on the east side and several tracts in
be gentrifying in 2016. More detailed specification of the Pasadena and Edgebrook in southeast Harris County.
regression model can be found in Appendix B.
The two tracts with the highest probability of gentrifying
Adopting results from the regression model, we were able (98 percent) are both within Third Ward. At a suscepti-
to predict the likelihood of neighborhoods gentrifying in bility probability of 97 percent, several tracts are various
the near future. The coefficients from the model were used neighborhoods in Denver Harbor, Kashmere Gardens,
in determining the probability of tracts gentrifying in the Sunnyside and Midwest. Neighborhoods with at least a 90
future based on values from 2016 data. Each tract yielded percent chance of gentrifying include Fifth Ward, Gulfton,
a probability in the form of a percentage, indicating the Trinity/Houston Gardens, OST/South Union, Second
likelihood of gentrifying, referred to as susceptibility in- Ward, Acres Home, Near Northside, South Park, Pecan
dex. A tract with a higher susceptibility index has a higher Park and South Acres/Crestmont Park.
Neighborhood Gentrification across Harris County: 1990 to 2016 13GENTRIFICATION SUSCEPTIBILITY FIGURE 8 Gentrification Susceptibility 14 Rice University Kinder Institute for Urban Research
GENTRIFICATION SUSCEPTIBILITY

Susceptible Neighborhoods:                                                               !! The area is gentrifying or vulnerable to gentrification
Case Studies                                                                                 from 2000 to 2016; and

This susceptibility index presents a depiction of where                                  !! The area has a higher probability of gentrifying
Houston may see the most change that could negatively                                        post-2016.
impact existing residents. We have selected three commu-
                                                                                       The three neighborhoods included in the case studies
nities for an in-depth analysis of neighborhood changes in
                                                                                       are OST/South Union, Fifth Ward and Greenspoint.
the past two decades and what efforts are currently being
                                                                                       We drill down the factors used to identify whether the
undertaken to avoid undue hardships on existing resi-
                                                                                       neighborhood will be gentrifying in the near future. These
dents. We selected the three community tabulation areas33
                                                                                       factors can be strategized around in order to implement
based on two criteria:
                                                                                       equitable inclusive development strategies.

FIGURE         9       Selected Neighborhoods

                                                                                                Greenspoint

                                                                                                          Fifth Ward

                                                           OST/South Union

                                                                 Gentrification Typologies                      Susceptibility Index Range

           OST/South Union (6 tracts)                            Gentrifying 00–10, 10–16                       81.6–92.354

                Fifth Ward (4 tracts)                            Gentrifying 00–10, 10–16                       78.5–94.8

              Greenspoint (10 tracts)                            Vulnerable, 90–00, 00–10, 10–16                19.44–88.16

Neighborhood Gentrification across Harris County: 1990 to 2016                                                                                              15
GENTRIFICATION SUSCEPTIBILITY
OST/South Union Luther King Boulevard and Old Spanish Trail adjacent to
the newer commercial development.
The OST/South Union neighborhood area is located in
south-central Houston inside the 610 loop. As defined This community was originally home to working-class
by the Kinder Institute’s Community Tabulation Areas non-Hispanic whites. In the late 1960s, middle-class
(CTAs), it is bound by Old Spanish Trail on the north, African-Americans moved into the area, and the neigh-
State Highway 288 on the west and Interstate 610 on the borhood became majority black during the 1970s due to
south, with a land area of approximately 4.5 square miles. white flight.35 In the 1980s, Palm Center and the neigh-
It is west of the University of Houston, south of Texas boring area fell into decline as many tenants such as
Southern University and east of the Medical Center and Oshman’s Sporting Goods left the shopping center due
NRG Arena. The Old Spanish Trail corridor is home to to neighborhood changes. The city tried to redevelop the
the final destination of the purple Metro rail line and the shopping center but failed due to a dispute with the feder-
Palm Center transit center. The location’s proximity to al government over funds used in the project.36 Currently
major job centers, the area’s easy access to major high- OST/South Union is home to almost 20,000 residents, most
ways and public transit, its volume of older housing and of whom are African-American. Our analysis of neighbor-
its relatively high share of vacant units and lots make it hood changes happening between 2000 and 2016 shows
highly susceptible to gentrification. that this community started gentrifying in the year 2000
and has continued to do so since. The share of African-
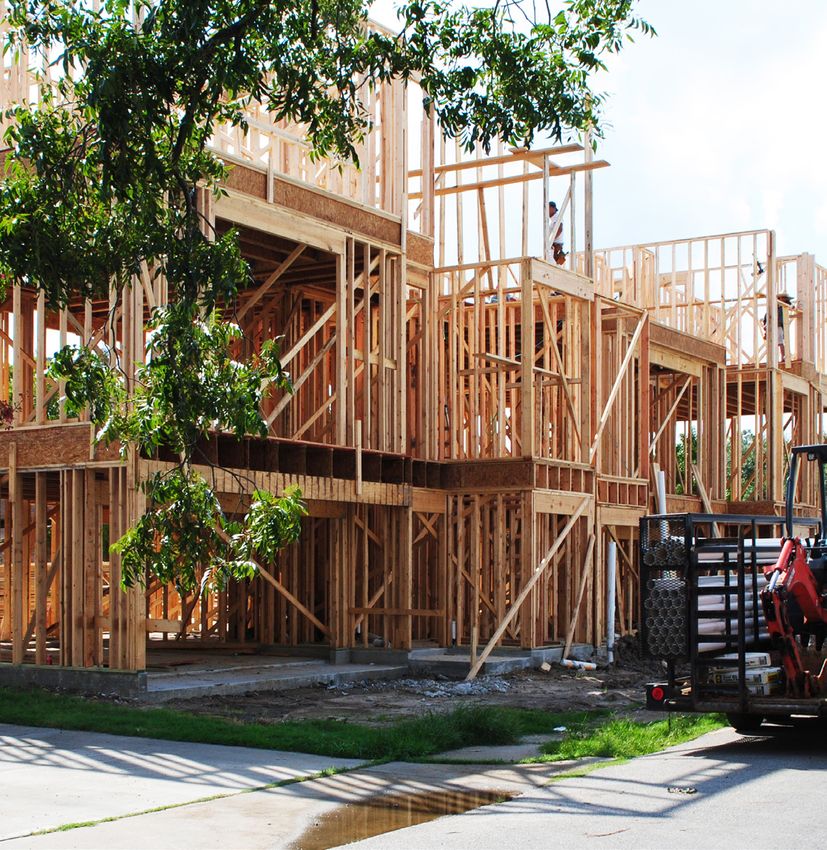
Figure 10 shows the spatial patterns of housing in the
Americans decreased from 84 percent in 2000 to 77 percent
OST/South Union neighborhood area. More than 65
in 2016. At the same time, more Hispanics moved into the
percent of the housing is comprised of single-family
neighborhood, growing from 13 percent of the population
units. Most of the ranch-style homes were built post-
in 2000 to 18 percent in 2016. Overall the neighborhood
1945. Specifically, 16.8 percent of the housing units were
saw a greater increase in its share of non-Hispanic white
built in the 1940s, 32.3 percent in 1950s and 15.7 percent in
residents than the county as a whole. Although this com-
the 1960s.34 These older homes are located along Martin
munity is characterized by a high poverty rate and a high
FIGURE 10 Housing Types in OST/South Union
Single Family Multi Family Condo Commercial/Other
Source: Data from Harris County Appraisal District, 2017.
16 Rice University Kinder Institute for Urban ResearchGENTRIFICATION SUSCEPTIBILITY
FIGURE 11a Percent Change in Median Household Income and Housing Costs (2000–16)
35.0
30.6
30.0 26.9
25.0 23.2 24.0
20.0
15.0 13.9
10.0
4.1 3.4
5.0
0.0
-5.0
-10.0 -9.4
-15.0
Median Household Income Median Gross Rent Median Monthly Homeowner Costs Median Home Value
Harris County OST/South Union
Source: Census 1990, 2000, 2010, American Community Survey 2012–2016 5-year estimates, Census Bureau.
FIGURE 11b Harris County and OST/South Union Housing and Demographic Changes
(2000–16)
-7.2
Percent Married Couples with Kids 4.3
11.8
Percent Pay >35% of Income on Rent 12.5
0.8
Percent Renters 11.3
0.8
Percent Single Family Homes -16.5
-0.4
Percent Housing Units 5+ 7.8
-1.3
Percent Take Transit 2.1
-20.0 -15.0 -10.0 -5.0 0.0 5.0 10.0 15.0 20.0
Harris County OST/South Union
Source: Census 1990, 2000, 2010, American Community Survey 2012–2016 5-year estimates, Census Bureau.
unemployment rate, the share of college degree residents Although the median household income increased by
increased in recent years more than the county change. approximately 4 percent, from $28,377 to $29,531, median
monthly gross rent increased by 27 percent, from $605
Our analysis also suggests that this area will likely con-
in 2000 to $768 in 2016, and median home value went up
tinue to gentrify in the near future, based on some key
by 31 percent, from $52,833 in 2000 to $68,981 in 2016.37
factors. Compared to the percentage change in hous-
The share of renters paying more than 35 percent of their
ing and demographic characteristics in Harris County
incomes went up by 12.5 percentage points. The median
between 2000 and 2016, the OST/South Union has a
monthly owner costs for mortgaged homes also went up
greater increase in its share of renter households and
by 23 percent, from $825 to $1,017, indicating that the hous-
that of multifamily housing units with five or more units,
ing affordability issue is getting worse in this community.
and a larger decline in its share of single-family homes.
There has been an increase in the share of married couple As a historic community, OST/South Union is also
families with children (by 4.32 percentage points), but an characterized by strong civic leadership. Neighborhood
even greater increase in its share of non-families (by 10.8 Recovery CDC has served the community since 1992. As a
percentage points) in this community. result of the National Endowment for the Arts Our Town
Neighborhood Gentrification across Harris County: 1990 to 2016 17GENTRIFICATION SUSCEPTIBILITY
project in 2011, the Southeast Houston Transformation real estate developers identify the potential rent gaps and
Alliance (SEHTA) was founded to make positive transfor- make investments, putting families at risk of increased
mation in the neighborhood through community-based rent and tax burdens. With limited resources and capac-
placemaking.38 In 2013, the OST/South Union was se- ity, community-based organizations cannot fully imple-
lected by Local Initiatives Support Corporation (LISC) ment the tools and strategies to help the community grow
Greater Houston to become a Great Opportunities (GO) while protecting it from undesirable private development.
Neighborhood partner, with a vision to transform this
neighborhood into a healthy, vibrant, safe and econom- Fifth Ward
ically stable community. A total of 29 strategies in eight
The Fifth Ward, one of Houston’s original six histori-
opportunity areas were developed to support this vision.
cal political districts, is located about 2 miles northeast
Besides leveraging resources across different sectors such
of Downtown Houston. When it was originally settled
as economic development, environment, education and
back in the 1860s, half the population was white and half
health, the community is also prepared to use the com-
was African-American. By the mid-1880s, it was filled
prehensive plan as a tool to guide potential development
with black working-class people who worked at the Ship
projects while preserving their culture and histories.
Channel and in industrial areas on the east side of the
In order to create and maintain affordable housing and town. After some growth and decline, the Fifth Ward
preserve social ties, community-based organizations like became predominantly black in the 1920s. It served as a
Agape Development Ministries plan to support existing major economic center for African-Americans from the
residents by providing access to homeownership. Agape 1940s to the 1960s. However, desegregation and reces-
has purchased a plot of land and is currently designing a sions led residents to move out of the Fifth Ward into the
development with input from the families who will be buy- suburbs in the 1970s and 1980s. The community became
ing these homes. The leadership at Agape explained that socially fragmented and economically unstable. It was
the goal of their recent purchase is to preserve affordability also characterized by high crime and high poverty.
without concentrating poverty and to create mixed-income
The Fifth Ward’s close proximity to Downtown Houston
housing. To expand the number of homeowners in the
and easy access to major freeways make it highly vulner-
community, Agape provides career and financial educa-
able to gentrification. New commercial developments and
tion from youth to adulthood and gives renters a voice in a
multifamily complexes have been gradually replacing
powerless housing structure. Similarly, the LISC GO team
sub-standard housing since the 1990s. According to our
has conducted workshops to educate residents on protest-
analysis and the gentrification typology, the Fifth Ward
ing taxes and managing tax exemptions.
was gentrifying between 2000 and 2010. One census tract
At the same time, the OST/South Union community has just north of I-10 continued to gentrify between 2010
a large share of vacant units and land. Inevitably private and 2016. The Fifth Ward saw a slight loss of population
between 2000 and 2016. The share of
African-American population in the
entire community decreased from 63
percent in 2000 to 51 percent in 2016,
while the proportion of Hispanic
population and non-Hispanic white
population increased by 10 percent-
age points and 3 percentage points
respectively. The share of college
Fifth Ward Community Redevelopment Corporation
educated residents increased by 7
percentage points between 2000 and
2016. The percent of low-income pop-
ulation and percent in poverty both
decreased by 4 percentage points.
However, this community still has a
poverty rate of over 43 percent.
18 Rice University Kinder Institute for Urban ResearchGENTRIFICATION SUSCEPTIBILITY
FIGURE 12a Percent Change in Median Household Income and Housing Costs (2000–16)
80.0
69.1
70.0
60.0
50.0 42.1
40.0
29.7
30.0 24.0
20.0 13.9
10.0
2.8 3.4
0.0
-10.0
-9.4
-20.0
Median Household Income Median Gross Rent Median Monthly Homeowner Costs Median Home Value
Harris County Fifth Ward
Source: Census 1990, 2000, 2010, American Community Survey 2012–2016 5-year estimates, Census Bureau.
FIGURE 12b Harris County and Fifth Ward Housing and Demographic Changes (2000–16)
-10.9
Percent Non-Hispanic White 2.7
0.5
Percent Black -12.0
3.1
Percent 25+ with Bachelor's or Higher 7.0
11.8
Percent Pay >35% of Income on Rent 13.4
0.8
Percent Single Family Homes -11.5
-1.3
Percent Take Transit -10.4
-15.0 -10.0 -5.0 0.0 5.0 10.0 15.0
Harris County Fifth Ward
Source: Census 1990, 2000, 2010, American Community Survey 2012–2016 5-year estimates, Census Bureau.
The results of the regression model suggest the entire single-family homes dropped by 12 percentage points
community has a high probability of gentrifying in the from 2000 to 2016. Almost 13 percent of all the housing
future. Sociodemographic factors coupled with housing stock in the Fifth Ward was built during that time.
factors exacerbate the likelihood of gentrification. For
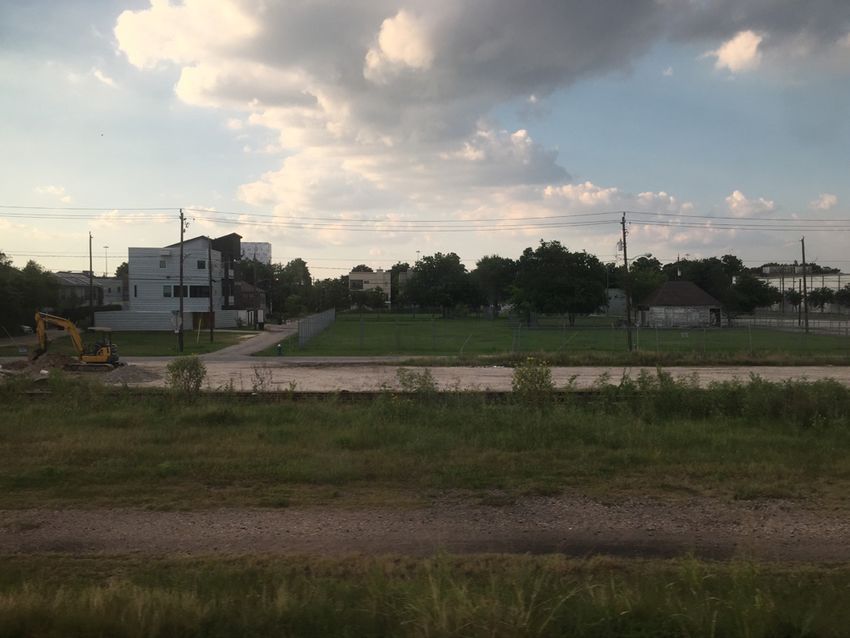
As shown in the map in Figure 13, 73 percent of the
example, median household income across the Fifth Ward
housing units in the Fifth Ward are single-family and
increased from 2000 to 2016, up from $21,295 to $21,892
27 percent are multi-family. The census tract on the east
with inflation adjusted. Median gross rent also increased
side of I-69 and the tract on the south side of the East
from $478 to $620, and median monthly homeowner costs
Freeway contain a lot of commercial and industrial areas.
increased from $742 to $1,054.39 Figure 12a shows the
According to the regression model, the census tract be-
percentage change in median household income, median
tween the East Freeway and the Southern Pacific Railroad
gross rent, median monthly homeowner costs and median
has the highest probability of being gentrified among the
home value in the Fifth Ward between 2000 and 2016, in
four tracts in this neighborhood area.
comparison of those in Harris County. The percentage
of renters paying more than 35 percent of their income In 1989, The Fifth Ward Community Development
increased 13 percentage points. In addition, the share of Corporation (FWCRC) was created to support the re-
Neighborhood Gentrification across Harris County: 1990 to 2016 19GENTRIFICATION SUSCEPTIBILITY
with 108 units. However, the Fifth
FIGURE 13 Housing Types in the Fifth Ward
Ward is still facing high probability
of gentrifying and losing affordable
housing stock.
Natural disasters such as Hurricane
Harvey could potentially amplify
the risk of gentrification. Some areas
in the Fifth Ward were hit hard by
Hurricane Harvey, and as such the
neighborhood may have experi-
enced a loss of “naturally occurring”
(privately held and not subsidized)
affordable housing. Many families
were displaced by the disaster and
forced to sell to speculators.40 Other
families have few tools to protect
themselves from future disasters or
from rapid gentrification which can
be fueled by natural disasters and
recovery efforts. Residents worry
that they have no special mechanisms
to address the unbearable costs of
recovery and rebuilding.
After Hurricane Harvey, many
residents were forced to sell their
homes for a fraction of what it was
originally worth. Two issues emerge:
1) a net loss for the homeowner who
might not be able to replace the
existing home with a new one in the
same area and 2) the presence of out
of town speculators who made the
purchase but actually operate from
as far away as New York and San
Francisco. It is difficult for communi-
ty organizations such as FWCRC to
Single Family Multi Family Condo Commercial/Other
engage property owners who reside
Source: Data from Harris County Appraisal District, 2017.
and operate outside the community.
Furthermore, new and existing resi-
vitalization of the neighborhood. Known as a model of
dents may identify different needs for new business, ser-
nonprofit-private partnership, the organization has been
vices and job development opportunities in the neighbor-
working on increasing new home construction and com-
hood. Many new businesses moving into the area tend to
munity investment. In July 2018, the Fifth Ward became
cater to the new residents with higher incomes rather than
a GO Neighborhood and is eligible to receive funding
old, such as coffee shops that charge up to $4 for a cup of
at a comprehensive level of investment. In addition,
coffee. Generally, new tenants are less engaged with the
several public housing properties are operated by the
existing community. They may raise issues with funding
Houston Housing Authority in the Fifth Ward, such as
mixed-income housing projects such as the St. Elizabeth
Kelly Village at 3118 Green with 333 housing units and
Project41 that is inclusive to all types of residents.
the recently redeveloped Kennedy Place at 3100 Gillespie
20 Rice University Kinder Institute for Urban ResearchGENTRIFICATION SUSCEPTIBILITY
Greenspoint Deteriorating old apartment buildings and repeated
flooding have kept the housing value relatively low, which
Greenspoint lies near the intersection of I-45 and Beltway
provides the rent gap that attracts investors. Our analysis
8 and is very close to major job centers, including the
shows that the area north of Beltway 8 and east of I-45,
George Bush Intercontinental Airport. The original
which has a lot of multifamily housing built after 1980,
neighborhood was developed to meet the needs of work-
gentrified during 1990 and 2000, while the area south of
ing-class families who sought moderately priced homes
Beltway 8 and east of I-45, has gentrified since 2000. The
close to the North Freeway (I-45) and centered around the
one tract that was gentrifying between 2010 and 2016 has
Greenspoint Mall and nearby office development in the
a high concentration of single-family houses built before
1970s and 1980s. Since the late 1980s, lower-income fami-
1980, and it has a probability of continued gentrification
lies have occupied the area’s many apartment complexes.
that is higher than 50 percent.
Its economy suffered since the withdrawal of ExxonMobil
during the mid-2010s. Today, half of its residents make As shown in Figure 15a, neither rent nor home costs have
less than $26,000 a year. Only 16 percent of the housing changed much over the past 16 years. However, median
units are single-family homes, and 85 percent of the household income of Greenspoint’s residents has declined
residents in Greenspoint rent. About 15 percent of the significantly. Since 2000, Greenspoint experienced a big
households do not own a car. Additionally, three-quarters increase in its share of Hispanic population, renter house-
of Greenspoint’s multi-family housing is located within holds, low-income households and housing with five
a floodplain, suffering from several flooding events from units or more. At the same time, the neighborhood saw
Tropical Storm Allison in 2001, the Tax Day floods in a decrease in its share of college degree residents, share
April 2016 and most recently Hurricane Harvey. of non-Hispanic white as well as black population and
FIGURE 14 Housing Types in Greenspoint
Single Family Multi Family Condo Commercial/Other
Source: Data from Harris County Appraisal District, 2017.
Neighborhood Gentrification across Harris County: 1990 to 2016 21GENTRIFICATION SUSCEPTIBILITY
FIGURE 15a Percent Change in Median Household Income and Housing Costs (2000–16)
30.0
24.0
20.0
13.9
10.0
3.4 3.9 2.2
0.0
-10.0 -4.4
-9.4
-20.0
-30.0
-33.8
-40.0
Median Household Income Median Gross Rent Median Monthly Homeowner Costs Median Home Value
Harris County Greenspoint
Source: Census 1990, 2000, 2010, American Community Survey 2012–2016 5-year estimates, Census Bureau.
FIGURE 15b Harris County and Greenspoint Housing and Demographic Changes (2000–16)
8.9
Percent Hispanic 13.9
0.8
Percent Renters 2.8
11.8
Percent Pay >35% of Income on Rent 25.1
18.8
Percent NonFamily Households 3.8
1.7
Percent Low Income 15.1
0.8
Percent Single Family Homes -2.4
-0.4
Percent Housing Units 5+ 1.9
-10.0 0.0 10.0 20.0 30.0
Harris County Greenspoint
Source: Census 1990, 2000, 2010, American Community Survey 2012–2016 5-year estimates, Census Bureau.
a loss of single-family homes. Between 2000 and 2016, properties. Gentrification in the Fifth Ward involves a
the percent of low-income residents increased at a pace low-income minority neighborhood with a strong com-
much faster than the county as a whole. Similarly, the munity identity and rich cultural heritage. Due to the
proportion of renters who spend more than 35 percent of physical and social fabric of this community, the gentrifi-
income on rent grew significantly, compared to the county cation may require large-scale redevelopment, similar to
as a whole. Compared to the other two neighborhoods what has happened to Freedmen’s Town. In comparison,
discussed in this report, Greenspoint has an overall lower the neighborhood changes in Greenspoint are more likely
probability of gentrifying in the future. to be about displacing low-income renters if large afford-
able apartment complexes with deteriorating conditions
As discussed earlier, different types of gentrification
are torn down, making room for new development.
processes are shaped by the existing housing stock, the
ethnic composition of the neighborhood as well as neigh-
borhood conditions. Gentrification in OST/South Union is
mostly based on private sector block-busting. Vacant lots
in the neighborhood are poorly maintained, which made
the remaining residents more likely to sell or rent their
22 Rice University Kinder Institute for Urban ResearchCONCLUSION AND DISCUSSION
Conclusion and Discussion
G entrification is an evolving phenomenon in urban neighborhoods in the late
20th century. It affects a significant share of Houston neighborhoods, both in
the city core and beyond it. As shown, gentrification is a process by which lower-
income neighborhoods undergo reinvestment through the influx of relatively
higher-income households, resulting in economic overburden for lower- and
moderate-income households, often non-white.
This report defines gentrified (established) and gentrify- the Kinder Institute in the next few months, examining
ing neighborhoods across Harris County and identifies the link between transportation and gentrification and
factors that make neighborhoods susceptible to gentri- detailing the housing stock changes in selected gentrify-
fication. Our analyses find that gentrification is distrib- ing neighborhoods.
uted unevenly across Harris County neighborhoods.
Given the prevalence of gentrification and its effects, how
Scarce affordable housing in higher-demand locations
can cities and communities enable low-income homeown-
creates a tight housing market, exacerbating effects of
ers and renters to remain in their neighborhoods? How
gentrification. Socioeconomic, housing, transportation
can they help maintain affordable housing stock to ensure
and location factors impact areas’ susceptibility to gentri-
gentrifying neighborhoods remain diverse and inclusive?
fication. We also found that some neighborhoods sus-
Public housing, housing choice voucher programs and
ceptible to gentrification are also in
flooded areas. Natural disasters and
flooding could potentially amplify the
risk of gentrification.
The case studies in the report exam-
ine the factors we used to identify
whether they will be gentrifying in the
future and highlight the differences
in the process as well as community
responses to gentrification pressures.
Although this report identifies gen-
trified, gentrifying and susceptible
neighborhoods, further research is
needed to explore the relationship be-
tween the identified factors and their
Roy Luck/flickr
effects on gentrifying neighborhoods.
A series of reports will be released by
Neighborhood Gentrification across Harris County: 1990 to 2016 23You can also read