LEICESTER & LEICESTERSHIRE ECONOMIC ASSESSMENT SUMMARY DECEMBER 2009 - Consultation Draft Document
←
→
Page content transcription
If your browser does not render page correctly, please read the page content below
Consultation Draft Document

   LEICESTER & LEICESTERSHIRE ECONOMIC
                ASSESSMENT

                                 SUMMARY

                             DECEMBER 2009

                                                                              1
Leicester and Leicestershire Economic Assessment, December 2009
Summary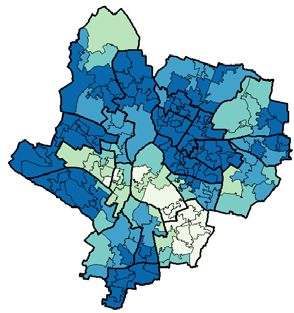
Consultation Draft Document

Leicester and Leicestershire Economic Assessment Summary

Table of Contents

 Section     Subject                                              Page

    1        Introduction                                           3

    2        Demography                                             8

    3        Business and Enterprise                                10

    4        Employment and Skills                                  16

    5        Economic Exclusion and Worklessness                    21

    6        Housing                                                24

    7        Employment Land and Premises                           27

    8        Transport                                              30

    9        Environment                                            35

    10       Rural Issues                                           40

    11       Summary SWOT                                           42

    12       Conclusions                                            44

Map to insert

                                                                              2
Leicester and Leicestershire Economic Assessment, December 2009
Summary
Consultation Draft Document
1 Introduction
1.1 This document is a stand-alone summary of the detailed Economic
Assessment (EA).
Introduction to the Economic Assessment
1.2 The Local Democracy, Economic Development and Construction Act
2009 places a duty on county councils and unitary district councils to
prepare an assessment of the economic conditions of their area. This
new duty comes into force on 1st April 2010, at which point local
authorities must begin to prepare their assessments. The purpose of
the Economic Assessment (EA) is to provide a robust evidence base
that will underpin strategic planning, investment decisions and delivery
plans.
1.3 The Leicester and Leicestershire Leadership Board made a decision to
develop a sub-regional EA in 2009, in advance of the statutory
requirement. It was also agreed that a single EA be developed to
cover Leicester City and Leicestershire County.
1.4 A dedicated EA project team has gathered, analysed and interpreted a
vast amount of evidence over the past few months. The detailed
findings are presented in twelve chapters. This summary follows the
same structure. Where appropriate a “Strengths, Weaknesses,
Opportunities and Threats” (SWOT) analysis has been included at the
end of a themed section. A summary SWOT for the sub-region is
presented in section 11. The key challenges and opportunities in the
sub-region are highlighted in section 12.
1.5 In preparing the EA, consultation has taken place with a wide range of
partners, the business community and the third sector. The following
groups involved in the management of sub-regional economic
development have contributed.
Business and Enterprise Strategy and Performance Group
Employment and Skills Board
Housing, Planning and Infrastructure Strategy and Performance
Group
Transport Strategy and Performance Group
Rural Partnership Strategy and Performance Group
1.6 The environment chapter was developed by Environmental Action for a
Better Leicestershire (ENABLE) with input from colleagues and
partnerships working in Leicester City.
1.7 The EA has already been used to develop an economic strategy for the
sub-region. The more detailed chapters will form the basis for
evidence-based delivery planning.
3
Leicester and Leicestershire Economic Assessment, December 2009
SummaryConsultation Draft Document
1.8 The Leicester and Leicestershire sub-region is considered a sensible,
functional economic geography for an EA. The sub-regional boundary
matches real economic, labour market, travel to work, housing market
and retail catchment areas.
1.9 Recognising the strong economic linkages between Leicester City at
the core and the surrounding Leicestershire County, the sub-region
was one of the first areas of the country to have a signed Multi Area
Agreement (MAA) in January 2009. The evidence presented in this
document and summarised in chapter 12 supports the decision to
conduct the EA on a sub-regional basis and the rationale for the MAA.
Introduction to Leicester and Leicestershire
1.10 Before embarking upon an economic assessment of the area, this
section describes our sub-region from a “place” perspective.
1.12 Leicester is one of the most culturally diverse cities in the UK, whilst
Leicestershire County is renowned for its quality of life. The two
combine to create an area that is popular with residents, visitors,
businesses, shoppers and students, alike.
1.13 Just under one million people live in the Leicester and Leicestershire
sub-region, with about a third living within the Leicester City boundary.
The area has a wide variety of property types and tenures available at
a range of prices. Overall, house prices are sufficiently high to
contribute to economic buoyancy, and relatively affordable compared to
household income and many other areas of the country.
1.14 Leicestershire County comprises seven local authority districts: Blaby,
Charnwood, Harborough, Hinckley & Bosworth, Melton, North West
Leicestershire and Oadby & Wigston.
1.15 A major regeneration programme in the City has physically transformed
the urban landscape with iconic new developments including Curve,
Highcross Leicester and Phoenix Square. The County is characterised
by beautiful countryside, historic market towns, the emerging National
Forest and has benefited from investment in major attractions such as
Twycross Zoo.
1.16 Connectivity is one of the key strengths of the sub-region.
Leicestershire is home to East Midlands Airport with its many
international links. Leicester is the first city on the mainline rail network
north out of London and just four hours from Paris via Eurostar from St.
Pancras. The sub-region is also within easy reach of the major UK
motorway network.
4
Leicester and Leicestershire Economic Assessment, December 2009
SummaryConsultation Draft Document
1.17 Already a significant economy in the East Midlands, with local GVA in
2007 at £18.5 billion1, the area has a strong tradition in the field of
business. It is home to major brands including Next, Walkers, Triumph,
Caterpillar, Samworth Brothers, Wal-Mart, DHL, 3M and AstraZeneca.
1.18 Over 40,000 students study at the three excellent universities in the
City and County – University of Leicester, De Montfort University and
Loughborough University. The area also has strong Further Education
Colleges providing a wide range of academic and vocational training.
1.19 According to the latest research2, annual visitor numbers to the City
and County now stand at 32.5 million, with the visitor economy in
Leicester and Leicestershire growing to £1.3 billion. These figures are
split across both the leisure and business tourism sectors.
History and Heritage
1.20 The area has strong history and heritage with attractions including the
Jewry Wall Museum in Leicester, Bosworth Battlefield, Belvoir Castle
and Ashby-de-la-Zouch Castle.
1.21 Leicestershire has significant links with the history of transport.
Loughborough houses the only double-track mainline heritage railway
at Great Central Railway, the modern-day jet engine was developed by
Sir Frank Whittle in Lutterworth, and the Donington Grand Prix
Exhibition is the largest collection of Grand Prix racing cars in the
world.
1.22 The area’s industrial heritage is also represented at local museums
including Abbey Pumping Station in Leicester and Snibston Discovery
Park in Coalville.
Outdoor Pursuits
1.24 The National Forest in North West Leicestershire spans 200 square
miles, across three counties. It is one of the country's boldest
environmental projects and already, more than seven million trees have
been planted. The County offers a range of country parks including
Bradgate Park, Charnwood Forest and Beacon Hill.
1.25 The waterways network in the City and County is set to undergo a
major development following the recent launch of the River Soar and
Grand Union Canal Strategy.
1
GVA = Gross Value Added Gross Value Added (GVA) is the principal measure of the total value of
goods and services that a geographical area produces. GVA is an important indicator of the overall
health of a local economy. It is calculated by summing the incomes generated in the production
process.
2
STEAM model – via http://tourism.goleicestershire.com/
5
Leicester and Leicestershire Economic Assessment, December 2009
SummaryConsultation Draft Document
1.26 The area has a strong reputation for sport, with successful local teams
including Leicester City Football Club, Leicestershire County Cricket
Club, Leicester Tigers in rugby union, Leicester Riders in basketball,
along with motorsport at Mallory Park and Donington Park. This is
complemented by pioneering sports science, performance and
research work at Loughborough University.
City Culture
1.27 The cosmopolitan city centre offers an improving shopping experience,
from major fashion stores at Highcross Leicester to boutique outlets
along the Leicester Lanes. There is a highly successful out-of-town
retail centre at Fosse Park, and Belgrave Road offers a focus for Asian
food and drink, fashion and jewellery.
1.28 Leicester also offers a range of year-round festivals, to cater for many
cultural interests, including the Leicester Comedy Festival – the
longest-running comedy festival in the UK, and the Diwali (Hindu
Festival of Light) celebrations in Belgrave.
Market Towns
1.29 The market towns throughout the county – Loughborough, Ashby-de-
la-Zouch, Hinckley, Harborough, Melton and Coalville – offer regular
markets, local shopping and access to a range of leisure activities,
including Loughborough Town Hall, Melton Theatre, Hinckley
Concordia, Ashby Venture and Kilworth House Hotel.
Attractions
1.30 Other attractions include the New Walk Museum and Art Gallery,
Twycross Zoo, the National Space Centre, Conkers, Twinlakes Park
and Snibston Discovery Park.
Food and Drink
1.31 The Leicester and Leicestershire area is home to the East Midlands
Food and Drink Festival – the largest regional food festival in the UK.
Melton Mowbray is the UK Rural Capital of Food and Drink, associated
with the world-famous Pork Pie and Stilton Cheese. The city of
Leicester, with its traditional and contemporary forms of Asian cuisine,
is also a Curry Capital of Britain winner. Restaurants throughout the
City and County produce outstanding menus based on the fresh local
produce.
Challenges
1.32 However, like many areas, the sub-region is also facing significant
challenges. The One Leicester Strategy acknowledges that poverty is
the root cause of many of the difficulties facing some City residents and
6
Leicester and Leicestershire Economic Assessment, December 2009
SummaryConsultation Draft Document
that too many people are disadvantaged through poor health. Average
male-resident earnings in Leicester are the lowest in the East Midlands.
Furthermore, one in five City residents are claiming benefits and 21%
are without formal qualifications3. The 2007 Index of Multiple
Deprivation suggests that Leicester is the 20th most deprived local
authority in the country. Although the County is generally more
affluent, five of its neighbourhoods fall within the 20% most deprived
nationally and there are pockets of relatively high unemployment. In
the current economic downturn, unemployment levels have increased
in both the City and County.
Opinions about Leicester and Leicestershire
1.33 The Place Survey4 asked residents to express the level of their
overall/general satisfaction with the local area. 85% of Leicestershire
County residents and 72% of Leicester City residents indicated that
they were satisfied or very satisfied with their local area. This
compares to a national figure of 80%. In terms of social cohesion, 76%
of Leicester residents agreed that people from different backgrounds
got on well together in their local area, which is an important indicator
for a multi-cultural city. This compares to a national figure of 76% and
a Leicestershire County figure of 82%.
1.34 44% of City-based businesses and 53% of County-based businesses
rated the sub-region as a good place to do business.5 About a third
rated it as average and several did not express an opinion. Very few
local businesses considered the area to be “not good for business”.
Arrangements for Updates
1.35 The evidence base will be updated annually and a full refresh of the EA
will be conducted every three years.
3
Annual Population Survey 2008
4
The Place Survey was carried out across all UK local authority districts in the Autumn of 2008 as part
of new government requirements
5
Leicester and Leicestershire Business Survey 2009
7
Leicester and Leicestershire Economic Assessment, December 2009
SummaryConsultation Draft Document
2 Demography
2.1 The current estimated resident population of the sub-region is about
950,000. The population estimate for mid-2008 (National Statistics
August 2009) gave a sub-regional total of 940,500, with about a third of
the population in Leicester City itself. The estimated population age
structure showed 63% of working age, 19% aged 0-15, 18% of state
pension age, similar in proportion to England, but with considerable
variation across the sub-region. Leicester City and Charnwood areas
have higher proportions (65%) in the working age group, influenced in
part by the presence of 40,000 university students in Leicester and
Loughborough.
2.2 The net effects of migration over the last few years are currently
estimated by National Statistics (ONS) to have increased the
population of the sub-region every year. There is particular uncertainty
in the overseas and student migration element of population change
figures at local authority level, especially for the younger working age
population. ONS are making improved estimates of migration, and as
a result, are planning revisions to their current population estimates for
release in May 2010. Indicative figures suggest that this could increase
the Leicester City figures by some 7,000 above the mid-2008
population estimate.
2.3 Current National Statistics migration estimates for each year since
2001 for the sub-region suggest that migration within the UK has
resulted in a net population change each year from -1,100 to +900,
mostly through increases in Leicestershire County. Migration from
overseas has resulted in a net population change each year from +800
to +6,600, mostly through increases in Leicester City. The population
estimate size change is small in relation to the size of in and out
population movements, but considerable change in age structure
occurs through migration.
2.4 Leicester City has a very different population structure to Leicestershire
in many ways – age structure, ethnic composition, household
composition, economic activity. There is also considerable variation
across the districts of Leicestershire in population size and age
distribution.
2.5 Cultural diversity is a distinctive feature of the local economy. For the
2006 resident population, 20% was estimated to be from non White
British ethnic groups (42% in Leicester City and 10% in Leicestershire).
The largest group within this was 95,200 (10%) of Indian ethnic origin
(25% of the Leicester City population and 4% of Leicestershire County
population).
2.6 Nearly half the population of the sub-region live in the ‘urban’ area of
Leicester, and nearly a quarter live in ‘urban’ areas in the remainder of
Leicestershire around Loughborough/Shepshed, Hinckley, Coalville,
8
Leicester and Leicestershire Economic Assessment, December 2009
SummaryConsultation Draft Document
Melton Mowbray, Market Harborough and Ashby-de-la-Zouch. Out of
the population of Leicestershire, about a fifth live in rural areas of small
towns ‘Town and Fringe’ or ‘Village’ areas. Only 2% of the
Leicestershire population live in the most rural ‘Hamlet and Isolated
Dwelling’ areas.
2.7 Future change in households, population and labour force is related to
housing change. Currently, planned future housing change in
Leicestershire and Leicester is outlined in the Regional Plan (adopted
March 2009). From 2006 to 2026, provision is made for an annual
average net addition of 4,020 houses in the sub-region.
2.8 The distribution of housing provision between local authorities in the
sub-region reflects the policy of concentrating growth in existing urban
areas, rather than on past trends. However, because population and
household projections have been revised since this provision was
decided, a review of the planned amount and location of housing
change may be required soon.
2.9 The latest sub-regional population and household projections from
ONS are based on information up to 2006. The projected trends for
higher fertility, life expectancy and migration are subject to future
uncertainty. With changing economic circumstances, the projected
increases in the working age population, especially aged under 40, are
subject to the greatest uncertainty.
2.10 Current 2005-based government age-specific economic activity rate
forecasts suggested the sub-region had a labour force of over 450,000
in 2006. The projected rates suggest that the labour force will increase
up to 2021 by 12% under the ONS 2006 trend-based projections, and
by 5% under projections based on change in housing provided for in
the March 2009 Regional Plan. Projected labour force change varies
considerably across the districts in the sub-region, and is particularly
affected by the distribution of planned housing provision.
2.11 There is a substantial projected increase in the numbers of older
people in the sub-region, due to improved life expectancy, in line with
long-term trends.
2.12 The projected increase in the younger population is mainly influenced
by projections using recent increase in birth rates and in people that fall
within family forming age groups.
9
Leicester and Leicestershire Economic Assessment, December 2009
SummaryConsultation Draft Document
3 Business and Enterprise
Productivity and Investment
3.1 In 2007, total Gross Value Added (GVA)6 in the Leicester and
Leicestershire sub-region was £18.5billion. This represents a quarter
of total regional GVA. Average annual growth rates in GVA over the
last ten years have been slightly lower than national figures.
3.2 Productivity, understood as output per head of the local population, is
an important indicator of the overall health and wealth of an economy.
In 2007, productivity for Leicester City was £21,331/head and for
Leicestershire (and Rutland) was £18,072/head. The Leicester City
figure is above regional and national figures. It is usual for cities to
show higher levels of GVA per head than the areas that surround them.
This is because they provide a focus or core for economic activity to
take place. However, the distinction between core-periphery in the
Derby and Derbyshire and Nottingham and Nottinghamshire sub-
regions is noticeably greater than in Leicester and Leicestershire. This
suggests that the contribution of Leicestershire’s market towns and
rural economy is important and more significant than in other areas of
the region. It also highlights the potential under-performance of
Leicester City as an economic centre (figure 3.1).
Figure 3.1 GVA per Head in Leicester and Leicestershire, Nottingham and
Nottinghamshire and Derby and Derbyshire Sub-regions
GVA/head (£)
0 5,000 10,000 15,000 20,000 25,000 30,000
Leicester and Leicestershire*
Core (City)
Periphery (County)
Derby and Derbyshire
Nottingham and Nottinghamshire
0 5,000 10,000 15,000 20,000 25,000 30,000
*Includes Rutland
Source: Local GVA, 2007
66
GVA = Gross Value Added Gross Value Added (GVA) is the principal measure of the total value of
goods and services that a geographical area produces. GVA is an important indicator of the overall
health of a local economy. It is calculated by summing the incomes generated in the production
process.
10
Leicester and Leicestershire Economic Assessment, December 2009
SummaryConsultation Draft Document
3.3 Leicester City is performing relatively poorly for a city of its size on a
number of economic indicators, including productivity, business survival
rates, earnings, skills and deprivation7.
3.4 The area has a significant competitive advantage in terms of its three
excellent universities and a strong Further Education (FE) sector. This
offers the opportunity to promote a culture of innovation, facilitating
knowledge transfer and improving general business links with
universities and FE Colleges.
3.5 During the financial year 2007/2008, Invest Leicestershire attracted
record levels of investment to the sub-region. This resulted in 1,053
jobs safeguarded or new jobs created, many of these within knowledge
intensive sectors. However, this is a relatively small proportion of the
total 434,000 jobs in the economy, highlighting the importance of
retaining and supporting indigenous businesses.
Sector Structure
3.6 The local economy is diverse and the area is not overly dependent on
any one sector or large employer. This helps to protect local
economies in times of recession. The relatively high proportion of
manufacturing employment (14.8% compared to 10.2% nationally) is a
key feature of the local economy and differentiates the sub-region from
other areas of the country. Food and drink manufacturing is a local
strength and this sector has become increasingly important to the sub-
regional economy, now accounting for 16% of manufacturing jobs.
There is some local specialisation in high technology manufacturing in
Charnwood and the new science park in Leicester will offer
opportunities to strengthen high technology manufacturing in the area.
Supporting high technology sectors will enable the sub-region to take
advantage of the potential links with the three world-class universities
in the sub-region.
3.7 Service sector employment has grown over the last decade and is
projected to continue to grow. Significant sectors include transport and
communications, associated with the sub-region’s central location and
communication links. The retail sector has also grown in importance,
with major retail centres at Highcross, Fosse Park, Loughborough and
in the vibrant market towns.
3.8 The area has less employment in the financial and business services
sector compared to national figures. Whilst this has protected the area
during the recent economic downturn, over the longer term, these
sectors are projected to grow and it could be important for the local
economy to attract some new investment in these areas. The
business services sector covers a wide range of businesses including
7
Earnings, skills and deprivation are covered in sections 4 and 5
11
Leicester and Leicestershire Economic Assessment, December 2009
SummaryConsultation Draft Document
professional services, cultural and creative industries and could
potentially offer a wider range of opportunities for graduates.
3.9 Tourism currently accounts for 7% of all employment in the sub-region
with some high-profile attractions such as Curve and the National
Space Centre in Leicester, and Twycross Zoo and the National Forest
in Leicestershire. There is potential to further develop tourism, with
requisite investment in the sub-region as appropriate. Examples of
development could include short breaks, holidays, business tourism,
themed activities and events.
3.10 The high proportion of public sector employment in Leicester City (one
in three jobs) is a potential concern in the light of potential cuts in public
expenditure. Although public sector employment is important to many
cities, Leicester featured in the top 20 vulnerable cities in a recent
report by the “Centre for Cities”.8
Table 3.1 Proportion of Employment by Sector
Industry Leicester Leicestershire Sub-region East Midlands England
City County
Agriculture 0.1% 0.3% 0.3% 1.2% 0.8%
and fishing
Energy and 0.3% 1.7% 1.2% 0.9% 0.6%
water
Manufacturing 13.8% 15.4% 14.8% 14.8% 10.2%
Construction 4.3% 6.1% 5.4% 5.8% 6.8%
Wholesale and 15.1% 19.9% 18.2% 17.5% 16.6%
retail
Hotels and 4.4% 5.9% 5.3% 5.8% 6.8%
restaurants
Transport and 3.4% 7.8% 6.2% 5.5% 5.8%
communic-
ations
Banking, 19.9% 18.1% 18.8% 17.9% 22.0%
finance and
insurance and
business
services
Public 33.8% 20.3% 25.2% 26.7% 27.0%
administration,
education and
health
Other services 4.8% 4.4% 4.6% 4.5% 5.3%
Total 100% 100% 100% 100% 100%
Source: ABI, 2008
8
Public Sector Cities; Trouble Ahead, Centre for Cities 2009
12
Leicester and Leicestershire Economic Assessment, December 2009
SummaryConsultation Draft Document
Business Structure
3.11 The fact that 96% of local businesses employ less than 50 people has
implications for the provision of business support. Evidence has shown
that promoting local supply chains can be helpful in terms of supporting
smaller businesses and encouraging links with public sector
procurement.
3.12 According to the IDBR9, there were 39,350 VAT-registered and PAYE
registered businesses in 2008 in the sub-region. A quarter of these are
in the property and business services sector and 21% in
retail/wholesale. Only 10% of business units are in the “production” or
manufacturing sector, however, these businesses tend to be larger in
size and account for 15% of employment. Conversely, 10% of
business units fall into the construction sector, but as many of these
businesses are smaller in size, the sector accounts for around 5% of
employment.
Enterprise
3.13 The business registration rates10 for Leicester and Leicestershire were
close to, but slightly below, the national level in 2008. The business
registration rate for Leicester City showed a marked improvement for
2008, up to 53.4 compared to 48.5 in 2006 and is higher than that seen
in Nottingham and Derby. Leicestershire County’s rate was slightly
lower at 51.5. Harborough stands out as having a particularly high
business registration rate at 73.6 compared to the Great Britain figure
of 54.6. Self-employment levels are also high in Harborough. Although
the business registration rate is good in Leicester City, self employment
levels are relatively low compared to other cities.
3.14 Three-year business survival rates are low in Leicester City but better
in the surrounding County. A key concern is the high volume of recent
start-ups in potentially vulnerable sectors – real estate, property
services, retail and construction.
Business Confidence and Performance
3.15 In the October 2008 Leicestershire Business Survey, business
confidence was at its lowest level since the surveys began in 1994.
This, in part, reflected the significant uncertainty in the financial
markets and stability of banks at the time of the survey. By the
summer 2009 survey, confidence had recovered with more businesses
9
Inter Departmental Business Register
10
Business Registration Rate is the number of VAT and PAYE registered for the first time divided by
the local population (per 10,000 that is 16+)
13
Leicester and Leicestershire Economic Assessment, December 2009
SummaryConsultation Draft Document
believing that their situation would improve in the next 12 months than
those who thought it would deteriorate. In addition, whereas a third of
all businesses thought that their market was in decline in October 2008,
by summer 2009, this had reduced to a quarter of businesses. Larger
businesses and those in the service sector are generally more
optimistic about their market sector growing.
3.16 Many businesses have reported reduced turnover and profits in the last
12 months. However, fewer businesses have experienced recruitment
difficulties. Key concerns include cash flow, access to finance and
rising fuel/energy costs. Within the service sector, low consumer
confidence continues to have an impact on turnover and profitability.
Third Sector
3.17 There are over 3,700 third sector organisations in the sub-region11, with
around 40% based in Leicester City. Volunteering makes an important
contribution to the local economy, currently estimated to be at least
£138M.12
3.18 A significant proportion of the area’s third sector businesses are
considered to be social enterprises. The Cabinet Office estimates that
there are now 62,000 social enterprises in the UK and that this number
is on the increase. Based on a recent IPSOS MORI survey, 51% of
third sector organisations in Leicester City and 46% in Leicestershire
County considered themselves to be social enterprises.
11
Source Voluntary Action Leicester (VAL) database
12
VAL estimates and using Place Survey data
14
Leicester and Leicestershire Economic Assessment, December 2009
SummaryConsultation Draft Document
3 Business and Enterprise SWOT
Strengths Weaknesses
GVA per head in Leicester City is above GVA per head in Leicester City is lower
regional and national averages than in Derby and Nottingham
County market towns and rural economy make Potential over-reliance on public sector
a strong contribution to sub-regional GVA employment in Leicester City and Oadby &
Diverse economic structure that is not overly Wigston
dependent on any one sector, some local Much of the recent business start-up growth
strengths in has been in vulnerable sectors – such as
o Food and drink property services, construction
o Transport and communications 3-year survival rates are low in Leicester
o Retail (Highcross/ Fosse Park) City compared to other major cities and to
o High tech manufacturing regional and national figures.
Growing service sector employment across a Relatively low self-employment levels in
range of industries Leicester City
Good growth in small businesses (Consultation Draft Document
4 Employment and Skills
4.1 A major challenge is the contrast between the labour market profiles of
Leicester City at the core of the sub-region and the surrounding
Leicestershire County area. There is a risk that potential investors
might look at the City skills profile alone and reach the conclusion that
the area has a low skill, low wage economy. This conclusion would fail
to take into account the strength of the labour market in the
surrounding County, which is one of the strongest performing areas in
the region. Therefore, improving qualification levels amongst City
residents is one of the most significant challenges facing the sub-
region. Although there has been some improvement, there are still
22.1% of working age City residents with no qualifications. There are
also some pockets of poor performance in the County which are
masked in the high level statistics.
Table 4.1 Summary of Qualification Levels (for the population
aged 19-59 for females and 19-64 for males)
No
qualifications
Level 413 (%) Level 3 (%) Level 2 (%) (%)
Leicester 23.4 36.9 57.0 22.1
Leicestershire 27.4 46.3 66.7 14.7
Leicester &
Leicestershire 26 44 64 16
East Midlands 27.0 46.3 67.0 12.8
England 30.5 49.5 69.4 11.9
Source: APS 2008
4.2 Degree-level qualifications (level 4) in the workforce are below national
levels for the sub-region as a whole and especially low in Leicester
City. In Leicester City over 42% of the workforce do not currently have
a level 2 qualification. Although this is still a high statistic, the situation
has improved considerably in recent years. This results from several
factors including: the success of the Train to Gain programme, a strong
FE sector, employer investment in training and, to some extent, a
higher proportion of those entering the labour market with level two
qualifications.
4.3 Understanding the barriers and needs of learners and retraining those
learners in appropriate job opportunities will be important in improving
13
Level 4 is equivalent to a first degree, level 3 is equivalent to NVQ3 or 2 GCE A levels, level 2 is
equivalent to 5 GCSEs at A* to C or NVQ2
16
Leicester and Leicestershire Economic Assessment, December 2009
SummaryConsultation Draft Document
overall qualification levels in the sub-region. The up-skilling of
residents, particularly those from the most deprived areas, amongst
new communities and those currently out of work, is critically important.
Only 57% of working age females in Leicester City are currently in
employment. This could suggest a need for more flexible working
opportunities, appropriate training and progression opportunities.
4.4 Leicester has relatively low median workplace earnings for a city and
male resident earnings are the lowest in the region. The lack of highly
skilled jobs in the city is a key feature, with below average employment
in management and professional occupations. This in turn makes
graduate retention difficult with a limited range of opportunities
available. Whilst it is important to maintain a diverse economic
structure, some increase in knowledge-based employment is needed if
the sub-region is to increase wealth generation, average earnings and
improve the range of jobs on offer.
Figure 4.1 Variation between Residential and Workplace Median Annual
Earnings in Leicester and Leicestershire, 2008
Source: ASHE 2008
4.5 Median weekly earnings for Leicester City residents are £373.80
compared to £479.90 in Leicestershire County. Weekly resident
earnings in both Nottingham (£406.80) and Derby (£457.70) are
considerably higher.
4.6 In March 2009, the employment rate for the sub-region was 74.4%,
with a lower rate of 63.6% in Leicester City and a higher rate of 79.1%
in Leicestershire County. In terms of occupations, City residents are
more likely to be working in elementary occupations or as process,
17
Leicester and Leicestershire Economic Assessment, December 2009
SummaryConsultation Draft Document
plant and machine operatives than is the case with County residents.
There are also relatively high proportions working in health and social
welfare. Only 11% of Leicester workers are employed as managers or
senior officials compared to a regional average of 16%. This is
reflected in the lower wages of City residents. A relatively high
proportion (17%) of Leicestershire workers are working in managerial
occupations.14
Figure 4.2 Proportion of Employment by Occupation, by Residency
%
20.0
18.0
16.0
14.0
12.0 Leicester
Leicestershire
10.0
East Midlands
8.0 England
6.0
4.0
2.0
0.0
Professional occupations
secretarial occupations
Skilled trades
Elementary occupations
Associate prof & tech
Personal service
service occupations
machine operatives
Managers and senior
Sales and customer
Process, plant and
occupations
Administrative and
occupations
occupations
officials
Source: APS, March 2009
4.7 Some businesses continue to experience recruitment difficulties, skills
shortages and skills gaps. This is more marked in manufacturing
businesses than amongst those in the services sector. 22% of
businesses in the 2009 Leicester and Leicestershire Business Survey
reported that skills shortages were having a serious impact on their
business. However, this has reduced from 35% in 2005. Over half the
businesses surveyed could identify some skills gaps in their current
workforce15. This highlights the importance of local training
infrastructure which needs to meet current and future employer needs.
There is significant variation by sector in terms of recruitment and skills
requirements suggesting the importance of sector-based initiatives and
a role for apprenticeships in developing sector-specific skills.
4.8 In the recent Business Survey, 57% of those with recruitment problems
stated that there was a lack of applicants with suitable skills. 84% of
14
Occupation statistics from APS, March 2009
15
Question asked in 2008 but not 2009
18
Leicester and Leicestershire Economic Assessment, December 2009
SummaryConsultation Draft Document
manufacturing firms stated that this was a reason for recruitment
difficulties. However, 40% of firms with recruitment difficulties stated
that there was a lack of applicants with the right attitude/personality.
4.9 The manufacturing sector employs a high proportion of Leicester City
and BME workers. Although the sector has declined overall, it remains
important and there are potential opportunities for growth in high tech
manufacturing and food and drink.
4.10 There is a significant gap between the attainment of pupils in City and
County schools at key stage 4 (age 16). 52% of pupils in County
schools achieved 5 GCSEs at A*-Cs including English and Maths
compared to 40% of pupils in Leicester City.16
4.11 The under-performance of white students in Leicester City is a
significant issue, with problems concentrated in deprived areas in the
west of the City. This is apparent as early as age 11 (key stage 2). At
present, only 17% of White British pupils living in Leicester progress to
higher education, compared to 62% of Indian pupils. Overall, a high
proportion of 17 year olds in both the City and County remain in
education post-16 compared to the region as a whole.
4.12 Although 15% of secondary school pupils living in the City travel to
County schools, there is little evidence that this has any impact on
attainment.
4.13 Although the sub-region benefits from three large universities, graduate
retention is relatively low. Six months after graduating, 34.6% of De
Montfort University graduates, 24.8% of the University of Leicester
graduates and 9.6% of Loughborough University graduates had found
employment in the sub-region.
4.14 In 2008, 4% of school leavers went into full-time training which includes
apprenticeship programmes. The most popular apprenticeships
applied for in 2008 were bricklaying, hairdressing, children’s care,
learning and development and vehicle maintenance/repair. There was
a fall in those entering plumbing and carpentry.
4.15 Unemployment has increased significantly in the last year and this has
been accompanied by a decrease in notified vacancies, especially in
process, plant and machine operative jobs. It will be more difficult for
those without formal qualifications to find employment and there is a
risk that the long-term unemployed will find it increasingly difficult to
enter or return to the labour market. Unemployment is covered in
more detail in the following section on economic exclusion and
worklessness.
16
Department for Children Schools and Families (DCSF) Statistics
19
Leicester and Leicestershire Economic Assessment, December 2009
SummaryConsultation Draft Document
4 Employment and Skills SWOT
Strengths Weaknesses
Workforce qualifications in the County City wages for both residents and
are amongst the highest in the region workplace jobs are lower than expected
Age 17 County achievements at level 2 for a City
and level 3 are highest in the region and 22.1% of residents in the City have no
above national averages qualifications and workforce
Progression rates to Higher Education qualifications are amongst the poorest
are exceptionally high in the City in the region
(especially amongst Indian population) Marked poor performance of white
The proportion of the workforce qualified young people resident in the City, which
to level 4 has increased in both the City is already apparent at age 11
and County over the last 5 years The 2 most deprived neighbourhoods
Three world-class universities are for education skills and training in the
located in the sub-region and there is a UK are located in the City
strong and improving FE sector The City has a high proportion of
Leicestershire has a slightly higher workers employed in low-skilled
proportion of the workforce employed as occupations and a relatively small
managers and in professional proportion employed in
occupations when compared to the management/professional roles
region Only 57% of working age females in the
The health sector in Leicester City is City in employment
strong and employs large numbers of Lack of graduate retention - especially
women, part time workers, migrants and arts and engineering graduates
graduates.
Opportunities Threats
3 universities produce approximately Significant increase in the claimant
15,000 graduates each year and strong count as a result of the current
FE sector economic downturn
Young and culturally diverse workforce in Decrease in vacancies notified to Job
the City Centre Plus over the past 12 months
Strong growth projected for health sector, Significant proportion of employment in
equivalent to an increase in 6,091 jobs the public sector which is a risk given
Food and drink sector employment is potential future cuts in public spending.
expected to increase Also important source graduate
Completion rates for apprenticeships employment
have improved, which is against the Apprenticeship participation has been
regional trend affected by the economic downturn
Qualification levels in the City are Poor perception of the City’s schools
improving and achievement for levels 2 potentially detracts inward investors
and 3 at age 19 Low aspirations of young people in
Promoting the good progress in City deprived areas of the City
schools rather than league tables would Employers report lack of applicants with
improve reputation of the City, inspire ‘the right attitude’
pupils and encourage inward investment Skills gaps reported by many
businesses especially in manufacturing
.
20
Leicester and Leicestershire Economic Assessment, December 2009
SummaryConsultation Draft Document
5 Economic Exclusion and Worklessness
5.1 In total, 71,810 people were claiming out-of-work benefits in the sub-
region in August 2008. This is a particularly significant problem for
Leicester City, where 19.4% of working age residents were claiming
DWP benefits (compared to 8.7% in Leicestershire County). Within
Leicester City, some wards such as New Parks, have very high
concentrations of residents (29.9%) on such benefits. North West
Leicestershire had the highest rate of benefit claimants in the County at
10.9%.
5.2 The following groups are more likely to experience significant barriers
to employment and skills development: women, those on incapacity
benefit, NEET17, carers, lone parents, older people, Black or Minority
Ethnic Groups and those from new Communities. These groups
contribute to at least 93% of all out of work claimants in the sub-region.
5.3 More recent figures indicate that 6.1% of working age residents in the
City and 3.1% in the County are claiming Job Seekers Allowance
(August 2009). This compares to 4.5% in the City and 1.4% in the
County for the same month last year. It is interesting to note that 25%
of JSA claimants in the sub-region are from BME groups.
5.4 Few barriers to employment exist in isolation and often support is
needed to address a number of related or consequential issues, such
as childcare, housing, health, financial exclusion, debt etc. before a
person can be supported into a sustainable form of employment.
Holistic support needs to be flexible enough to take into account inter-
dependent needs. Research from past recessions suggests that local
action is a determining factor in the success of post-recession
economies.
5.5 Local intervention examples include the Highcross project which was
supported by a number of partnerships including representation both
from the City and County. The partnerships have been successful in
developing and supporting a client routeway approach to meet the
recruitment needs of employers and also providing routeways for the
workless and long-term unemployed to be job-ready to meet genuine
job opportunities. Multi-access centres are now being rolled out across
the sub-region, building on successful partnership-working. The core
services can provide a flexible and holistic approach to tackling social
and economic exclusion.
5.6 Leicester is the 20th MOST deprived local authority in the country (in
terms of the 2007 Index of Multiple Deprivation (IMD) ranked by
average score). Leicestershire County is the 12th LEAST deprived
local authority in the country. Compared to 2004, the County has
17
NEET = those not in education, training or employment
21
Leicester and Leicestershire Economic Assessment, December 2009
SummaryConsultation Draft Document
become relatively less deprived whereas Leicester City’s position has
deteriorated.
5.7 Almost half of Leicester City’s neighbourhoods (87 LSOAs)18 fall into
the 20% most deprived nationally, whereas in the County five
neighbourhoods fall into this category. This suggests that deprivation
is relatively widespread in Leicester, but that Leicestershire also
experiences pockets of deprivation. However, rather than being in
isolated rural areas, the most deprived parts of Leicestershire are those
within urban areas.
5.8 Many areas in the County are more education/skills than employment
deprived suggesting that employment opportunities are relatively good,
although employment is low-skilled in some areas. In the City, types of
deprivation are more varied and there is significantly less correlation
between adult skills deprivation and young people’s education
deprivation. Areas of adult skills deprivation appear to be linked to
income and employment deprivation, whereas education deprivation
has a closer link to health deprivation and income deprivation affecting
children.
5.9 Neighbourhoods exhibiting young people’s education deprivation tend
to be located in wards of social housing on the edge of the city;
Braunstone, Eyres Monsell, Saffron Lane, New Parks and Beaumont
Leys with some individual neighbourhoods toward the centre of the city
such as within Westcotes, Fosse and Castle. Adult skills deprivation
covers large areas, in both neighbourhoods of social housing in the
west of the city and a large section in the east of the City.
18
Lower Super Output Area. These are small communities (generally smaller than wards) which have around 1,500
people living in them. In total, there are 32,482 LSOAs in England and 583 in Leicester and Leicestershire.
22
Leicester and Leicestershire Economic Assessment, December 2009
SummaryConsultation Draft Document
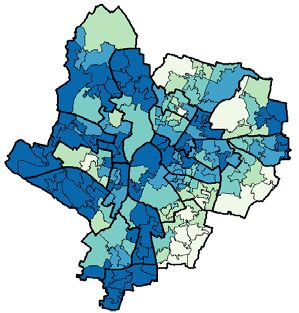
Figure 5.1 Deprivation: Young People, Adult Skills and Employment
Neighbourhoods in Leicester City by YP Neighbourhoods in Leicester City by Neighbourhoods in Leicester City by
Education Adult Skills Employment Deprivation
23
Leicester and Leicestershire Economic Assessment, December 2009
SummaryConsultation Draft Document
6 Housing
6.1 There is a considerable variation in property types and tenures across
Leicester and Leicestershire as a whole, but these tend not to correlate
to demography or actual need. As with most cities in England,
Leicester has ‘prospering suburbs’ which surround the more mixed
and less well-off central areas of the bigger settlements. Overall, the
Housing Market Area (HMA)19 has housing at a range of prices that are
sufficiently high to contribute to economic buoyancy, and relatively
affordable compared to household income. However, variations within
this generalised pattern reveal significant shortage of affordable
dwellings across the HMA, both rurally and in urban areas, to meet
need. This shortage is, at least in the short to medium-term, set to
increase as a result of the current economic climate and the associated
resulting difficulties such as inability to get mortgages, or loss of
homes.
6.2 Affordability is impacted by variations in supply and demand.
Therefore, provision of sufficient housing of the right type, in the right
locations and at the right price is critical to economic buoyancy and the
retention of key workforce participants. The Regional Spatial Strategy
(RSS) suggests that the HMA is to have at least 80,400 new dwellings
in the period to 2026, of which 26,500 are to be affordable. The RSS
has a policy of urban concentration to deliver these numbers through
extension of existing urban areas.
6.3 Funding from both the public and private sectors is essential to the
provision of necessary infrastructure to support and deliver these
numbers. Current estimates identify a deficit in funding of some £1.3bn
that is set to worsen as Public Sector funding becomes greatly
reduced. Correct prioritisation of interventions will be key to ensure
maximum economic benefit and to prevent restriction of deliverability
and adverse impact on affordability. Some 12,500 dwellings are to be
provided in the City Strategic Regeneration Areas, within which delivery
difficulties are compounded by the technical complexities and
constraints of such brown-field sites. The significant costs involved are
a key threat to the delivery of affordable housing in these areas of
significant need, whilst prioritisation of affordable homes here will
impact upon delivery of other essential infrastructure.
6.4 Minimisation of empty properties and the provision of decent homes
are also essential to an efficient economy. Leicester and Melton have
a high proportion of non-decent stock as compared to the national
average. Leicester’s level of non-decent private sector properties is
among the highest in the East Midlands. This is principally a result of
the City having one of the largest proportions of pre-World War 1
housing in the country. Problems around decent homes are likely to
be exacerbated through the current economic down turn.
19
The Housing Market Area or HMA is the Leicester and Leicestershire sub-region
24
Leicester and Leicestershire Economic Assessment, December 2009
SummaryConsultation Draft Document
6.5 Careful consideration and planning of the mix of additional housing to
the existing communities, Sustainable Urban Extensions (SUEs) and
Strategic Regeneration Areas (SRAs), will be needed to ensure a
balanced supply to meet the needs of the anticipated household
growth, and prevent constraint to economic growth. At the same time,
it will be important to avoid the exacerbation of existing problems – city
flight, overcrowding, under-occupation, oversupply of student housing.
The market, on its own, will not deliver a better mix and balance which
will meet the needs and demands of the communities and the
economy. There will need to be some steer in certain directions, based
on evidence and local knowledge.
6.6 Recently commissioned studies have confirmed there is sufficient land
to provide the planned additional dwellings in Leicester and
Leicestershire in an urban concentration approach. However, actual
deliverability of land supply to prevent constraints to deliverability is a
finite balance between sites coming forward and the rate of build, a
relationship that is fraught with difficulties.
6.7 The role of well-timed, enabling strategies, such as the Local
Development Frameworks (LDFs), must not be forgotten in the delivery
of housing and the necessary infrastructure.
6.8 The housing situation in Leicester is no different to that of many large
cities and stems from the growth of the Leicester conurbation over
many years. It cannot be changed quickly or easily and policy
intervention might be necessary to guard against further polarisation
and to gradually improve balance and create more mixed communities.
25
Leicester and Leicestershire Economic Assessment, December 2009
SummaryConsultation Draft Document
6 Housing SWOT
Strengths Weaknesses
Relatively moderately priced housing within Overall housing affordability, but less than in much
the overall UK housing market context of UK
A good mix of types and sizes of housing Shortfall of affordable housing compared to need,
across the wider conurbation and county especially in suburban and rural areas
Many attractive areas and environments Imbalances between housing sub-markets leading
Sufficient housing land availability to meet to :-
the RSS housing required up to 2026 o Poor viability of sites, especially in parts of
Additional housing growth can be provided the city, due to sub-market areas being
in the urban concentration approach stated seen as unattractive and less popular
within the RSS through extension of o High priced sites in suburban and rural
existing urban areas areas leading to development of expensive
up-market housing
o City flight (people leaving the city as they
become more affluent)
Imbalances of occupancy levels, overcrowding in
some areas and under-occupation in others
Some polarised tenure and ethnic concentrations.
Concentrations of deprivation in central and city
areas
Mismatch between housing need and demand
versus availability
Higher levels of non-decent stock in the City than
national average, as high proportion of pre-World
War 1 housing
Opportunities Threats
“Single Conversation” provides a joined up A further round of boom and bust in the generally
approach to public investment dysfunctional and volatile UK housing market
Ongoing regeneration areas and activities Ageing population and increased under-occupation
that could be used to steer housing market of housing
dynamics towards more mixed Polarisation between housing sub-markets
communities, less polarisation, a sub- Oversupply of particular types of housing, such as
market structure less divided between city city centre flats in 2009
and suburbs, and a better balance between Over provision of property types as developers seek
supply and demand safety in sameness and do not link provision to
Managing student housing growth and evidence of demand
provision to both aid graduate retention High or increasing numbers of empty properties,
and release traditional houses as family and more non decent homes, in submarket areas
homes which are unpopular
Planned housing growth could have a Possible re-emergence of low demand patches.
positive impact on jobs in the construction Loss of more economically active, wealth generating
sector households, either out of the city to the suburbs &
rural areas, or out of the county
Competing cities and other growth areas attracting
graduates and skilled workers away with a better
housing and environmental offer
Reductions in public and private sector funding
available to deliver infrastructure
Current economic climate may impact upon levels of
affordable homes needed and cause increasing
levels of non decent properties
26
Leicester and Leicestershire Economic Assessment, December 2009
SummaryConsultation Draft Document
7 Employment Land and Premises
7.1 A balanced supply of employment land and premises is a necessary
pre-requisite for an area to be able to maximise its economic
performance. Sub-regional partners are in agreement that the
Leicester and Leicestershire sub-region has suffered from a structural
shortage of employment land for many years and that this has been a
barrier to maximising growth within the sub-region.
7.2 The evidence base used to identify the amount of additional
undeveloped employment land required in the sub-region to provide a
balanced supply includes forecasts of future demand for land, the
current effective supply of land, an assessment of the gap between
demand and supply and consideration of the current economic and
property market context within the sub-region. The final
recommendations on additional allocations of employment land
required in each district also reflect a number of additional market-
related and policy-related factors.
7.3 At the present time, the sub-region can be characterised as follows:
There is an increasing demand for offices and a decline in demand
for industrial space.
There has been an imbalance in the growth of the office stock, with
significant increases in offices in out-of-town locations and
stagnation in the City.
Conversely, the greatest demand for offices is in Leicester.
Leicester has seen the largest decline in industrial stock and also
has the oldest industrial stock in the sub-region.
Conversely, the greatest demand for land for new industrial stock is
in Leicester.
There is a 20-year supply of land for offices in Blaby.
There is a substantial over-supply of industrial land in North West
Leicestershire.
There is a shortage of land for industrial and warehousing uses in
Leicester.
The un-met demand for industrial and warehousing land in
Leicester must be found in the wider Leicester Principal Urban Area
if the economic potential of the City and the whole sub-region is to
be realised.
7.4 The overall demand-supply assessment and gap analysis for the sub-
region indicated that offices are in balance for the period to 2026 but
that a further 98 hectares are required across the sub-region to meet
demand for industrial and small-scale and strategic warehousing
development. However, following consideration of additional market-
related and policy-related factors, the PACEC Study20 recommended
20
Strategic Study of Employment Land Requirements in Leicester and Leicestershire, PACEC 2008
27
Leicester and Leicestershire Economic Assessment, December 2009
SummaryConsultation Draft Document
the following additional allocations of previously undeveloped
employment land are required, including:
A minimum of 100,300 sq m of offices.
A minimum of 174 hectares of land for light industrial and small-
scale warehousing.
50 hectares for a road-rail strategic distribution centre.
7.5 At the local level, this includes:
Strategic employment land allocations within the New Business
Quarter, Ashton Green in Leicester, North Charnwood, South
Charnwood, Blaby, Coalville in North West Leicestershire and
Barwell and Earl Shilton in Hinckley & Bosworth.
Local employment land allocations in Oadby & Wigston, Hinckley,
Harborough and Melton.
Innovation space for the germination, incubation and growth of
businesses in the science, technology and creative sectors.
Development of speculative Grade A and high-quality offices up to
4,000 sq ft on the edge of Leicester City Centre.
A strategic road–rail distribution centre in North West
Leicestershire.
7.6 The proposed Sustainable Urban Extensions (SUEs) have been
identified as the key to the future supply of previously undeveloped
employment land in the sub-region. In order to realise the full
economic and environmental benefits of employment land allocations
within the SUEs, such allocations need to be of a strategic scale and
will require long lead-in times and investment-in-advance infrastructure
to enable private sector investment. These strategic sites will provide
for sustainable development with a better alignment between homes
and jobs, and provide development platforms for low-carbon
development, where critical mass is required for advance infrastructure.
Retail
7.7 The Leicester and Leicestershire sub-region has a healthy retail offer
that experiences relatively little loss of expenditure to shopping centres
outside of the area. Leicester City’s retail ranking has improved from
14th to 11th nationally21 following completion of the Highcross centre,
and Fosse Park is a retail centre of national significance. Within
Leicester, the market provides a distinctive element to the retail offer,
attracting two million visitors annually.
7.8 The continued strength of the retail sub-regional offer and development
of future retail infrastructure must go hand in hand with the provision of
high-quality public realm and environment to reinforce and further
retain a high level of retail expenditure in the sub-region.
21
Venuescore 2009
28
Leicester and Leicestershire Economic Assessment, December 2009
SummaryYou can also read