FAR WEST TEXAS THE WEST TEXAS ROAD TO ECONOMIC GROWTH: West Texas Comprehensive Economic Development Strategy - City of ...
←
→
Page content transcription
If your browser does not render page correctly, please read the page content below

West Texas Economic Development District

FAR WEST
 TEXAS

  THE WEST TEXAS ROAD TO ECONOMIC GROWTH:
              West Texas Comprehensive Economic Development Strategy
West Texas Economic Development District

        Dave Larson Photography, Austin, TX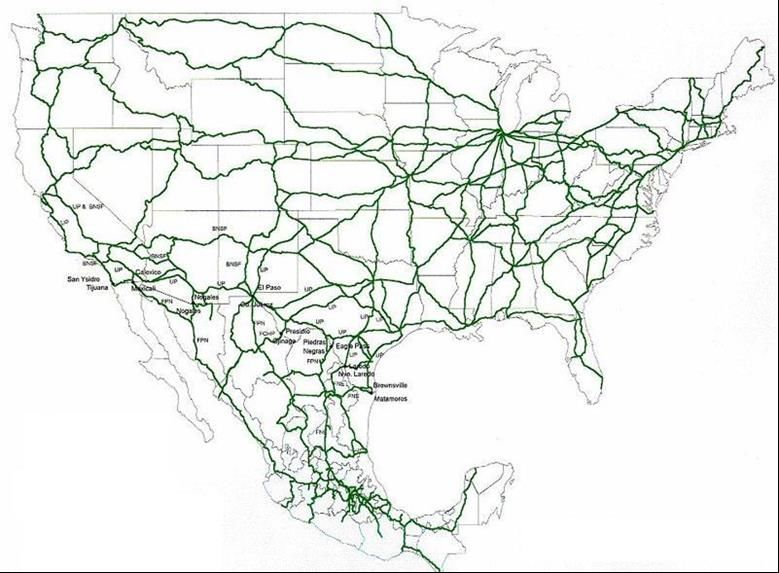
West Texas Economic Development District
        COMPREHENSIVE ECONOMIC DEVELOPMENT STRATEGY: 2016-2020

Table of Contents   Section I: Executive Summary
                    Introduction                                     7
                    Summary of Existing Conditions                   8
                    Economic Opportunities and Barriers              9
                    Regional Vision and Strategic Recommendations   10
                    Transforming the Regional Economy               11

                    Section II: Summary Background
                    State of the Region
                    Population Trends                               12
                    Education and Income                            19
                    Labor Force, Employment, and Wages              22
                    Housing and Transportation                      27
                    Health                                          31
                    Infrastructure                                  32
                    Natural Resources                               36
                    Principal Growth Sectors and Clusters
                    Government, Private, and Farm Employment        37
                    WTEDD Urban County Industry Clusters            38
                    WTEDD Rural County Industry Clusters            41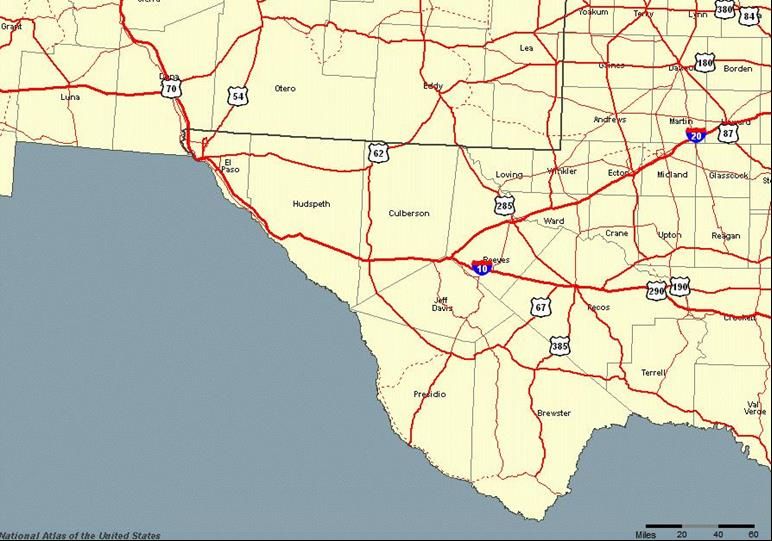
Table of Contents   Section III: Regional SWOT Analysis
                    Urban Counties Strengths and Weaknesses                                                        46
                    Urban Counties Opportunities and Threats                                                       47
                    Rural Counties Strengths and Weaknesses                                                        48
                    Rural Counties Opportunities and Threats                                                       49

                    Section IV: Strategic Direction and Action Plan
                    Regional Vision and Strategic Recommendations                                                  50
                    Recommendation 1: Increase Economic Ties with Mexico and Latin America                         51
                    Recommendation 2: Increase Cooperation between Local Economies                                 52
                    Recommendation 3: Become Known for Quality                                                     53
                    Recommendation 4: Increase Investments in Broadband, Solar Energy, and Public Infrastructure   54
                    Recommendation 5: Leverage the Significant Military Presence in the Region                     55
                    Recommendation 6: Alleviate Regional Housing Issues                                            56
                    Recommendation 7: Strengthen the Region’s Position as a Tourist and Retail Destination         57
                    Recommendation 8: Spur Innovation and Entrepreneurialism                                       58
                    Recommendation 9: Promote Economic Resiliency                                                  59

                    Section V: Performance Measures
                    Plan Implementation                                                                            60
                    Performance Updates                                                                            61
                    Ongoing Public Participation                                                                   62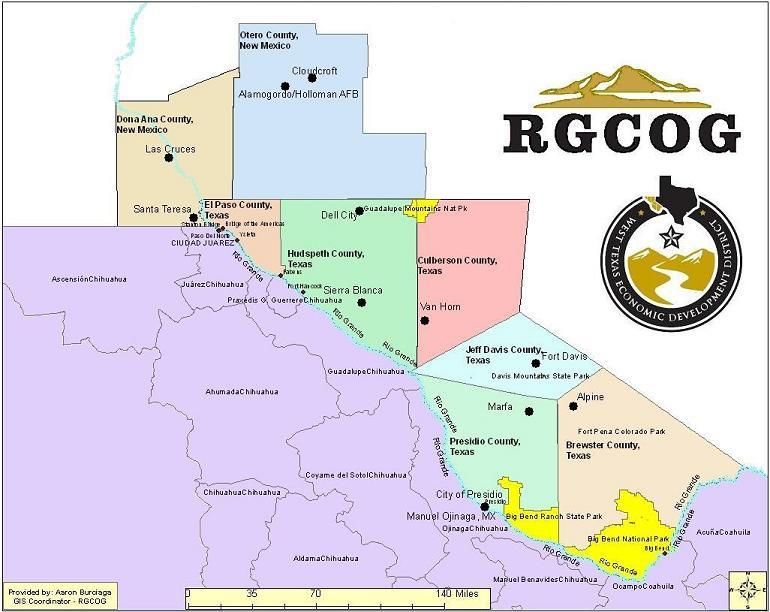
ACKNOWLEDGEMENTS
RGCOG Board Members                                                   Rio Grande Council of Governments Support Staff
Honorable Carlos Leon, El Paso County Commissioner                    Annette Gutierrez, Executive Director
Honorable Jeanette Duer, Jeff Davis County Judge                      Marisa Quintanilla, Regional Services Director
Honorable Andrew Haggerty, El Paso County Commissioner                Rebecca Stauffer, MIS and Resources Director
Honorable Art Fierro, EPCC Board of Trustees                          Omar L. Martinez, Regional Services Coordinator II
Honorable Jesus Calderon, Mayor of the City of Valentine              Jon M. Tabor, EDA VISTA
Honorable Carl L. Robinson, City of El Paso Representative            Catherine Crumpton, 9-1-1 / GIS Coordinator
Honorable Mike Doyal, Hudspeth County Judge                           Aaron Burciaga, 9-1-1 / GIS Coordinator
Honorable Cinderela Guevara, Presidio County Judge
Honorable Ken Miyagishima, Mayor of the City of Las Cruces            Media Provided By:
Honorable Oscar Leeser, Mayor of the City of El Paso                  Dave Larson Photography, Austin, TX – Page 2
Honorable Carlos Urias, Culberson County Judge                        Fort Bliss Bugle – Combat Camera Cover Photo
Honorable Bonnie Moorhouse, Horizon Regional MUD                      Mark Lambie, El Paso Times – San Jacinto Plaza Cover Photo
Honorable Carlos Hisa, Tribal Governor of the Ysleta del Sur Pueblo   Earl Nottinham, Texas Parks and Wild Life – Marfa Courthouse
Honorable Mike Rosales, YISD Board of Trustees
Honorable Lily Limon, City of El Paso Representative
Honorable Veronica Escobar, El Paso County Judge
Honorable Eleazar Cano, Brewster County Judge
Honorable David J. Garcia, Doña Ana County Commissioner
Honorable Walter Miller, Town of Horizon City Alderman
Honorable Diane Dye, EPISD Board of Trustees
Honorable Angelica Rodriguez, SISD Board of Trustees
Colonel Mike Hester, Ft. Bliss Garrison Commander
Honorable Marisa Marquez, Texas State Representative District 77
Honorable Jose Rodriguez, Texas State Senator District 29
Strategy Committee Members
Honorable Madeline Praino, Mayor, Village of Vinton            Kalea Cotton, Alpine Chamber of Commerce
Ruben John Vogt, Rep, El Paso County Judge                     Daniel Hernandez, Marfa Chamber of Commerce
Christopher Villa, Helix Solutions                             Joe Portillo, City of Presidio
Honorable Walter Miller, EFI Global
Honorable Dan Dunlap, Christopher’s
Angelica Rosales, Medical Center of the Americas Foundation
Lydia Nesbitt, Borderplex Alliance
Tony Ramirez, Borderplex Alliance
Laurie Banitch, Borderplex Alliance
Stephen Voglewede, Medical Center of the Americas Foundation
Elizabeth Chavez, Wise Latina International
Jose Quiñones, El Paso County
Leo Dominguez, Sul Ross State University
Loretta Garcia, Small Business Development Center - SRSU
Natalie Littlefield, Workforce Solutions Borderplex
Griselda Martinez, Ph.D., Arrowhead Center NMSU
HonorableHugh Garrett, Commissioner, Brewster County
Robert Starke, El Paso Community College
Patrick C. Schaefer, UTEP Hunt Institute
Jim Mustard, City of Marfa
Leo Dominguez, Sul Ross State University
Melissa Henderson, Fort Davis Chamber of Commerce
Brad Newton, Presidio Municipal Development District
Honorable Eleazar Cano, Judge, Brewster County
Erik Zimmer, Alpine City Manager
Honorable Teresa Todd, Jeff Davis County Attorney
Honorable Glenn Humpries, Mayor, Town of Van Horn
Fran Malafronte, Secretary, Town of Van Horn
Section I
                                                                                                                   Executive Summary

SECTION I: Executive Summary
Introduction
The Comprehensive Economic Development Strategy (CEDS) is the result of an ongoing planning process
that requires the participation and input of the public and private sectors, along with the communities of a
region. The CEDS is designed to guide economic growth by fostering a more diverse, stable, and resilient
economy, to assist in the creation of jobs, and improve the quality of life for residents living in the West
Texas Economic Development District (WTEDD).
The WTEDD is part of the Rio Grande Council of Governments (RGCOG), a multijurisdictional organization
comprised of El Paso, Hudspeth, Culberson, Jeff Davis, Presidio, and Brewster counties in Texas, and Doña
Ana County in New Mexico. The RGCOG is governed by a board of directors that is comprised of 19 local
officials from the region. The RGCOG also provides administrative and operational staff support for the
WTEDD.
In accordance with the Economic Development Reform Act of 1998 (P.L. 105-393), any area, community, or
region that is applying for assistance from the U.S. Economic Development Administration (EDA) requires
that the region develop, maintain, and update a CEDS. This document has been prepared with financial
assistance from EDA.
Spearheading the CEDS process is the CEDS Strategy Committee, a collaborative exchange group composed
of community leaders, economic development professionals, innovators at the forefront of their fields, and
scholars and researchers from the region’s universities, and members of the general public. The CEDS and
the CEDS Strategy Committee coordinate the efforts of individuals, organizations, local governments, and
private industry in the area of economic development.
The CEDS presents a regional economic development strategy that addresses challenges, leverages
opportunities, and is focused on measurable return on investment and results. It serves as a guide for
establishing regional goals and objectives, developing and implementing a regional plan of action, and
identifying investment priorities and funding sources. As a results-driven plan, the CEDS serves a critical role
in the region’s efforts to compete across state, national, and global markets. Finally, the CEDS is an evolving
document that will take into account and, where appropriate, integrate or leverage other regional planning
efforts.

                                                                                                                                     7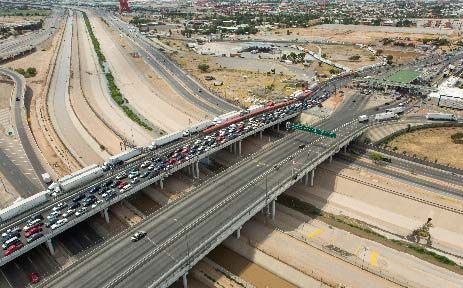
Section I
Executive Summary
Summary of Existing Conditions
The WTEDD Region incorporates an area of 32,143 square miles and includes two
states and eight counties. The region is known for its booming ports of entry, The WTEDD Region
nationally-recognized universities, significant military presence, vast natural
resources, plentiful sun, pristine deserts, and mountainous landscapes.
The WTEDD region has a total population of 1,103,096 (2014) that grew by 13.3%
in just the last 10 years. Across the U.S.-Mexico border, a population of 1,440,669
resides in the municipios of Ciudad Juárez and Manuel Ojinaga. The region is
characterized by significant economic, educational, health, and social
interdependence. Many people living in border communities have families and
businesses on the opposite side, commute daily to school or work, and own homes
on both sides of the border.
The cities of El Paso, Texas and Las Cruces, New Mexico are fast-growing
metropolitan areas with multiple growing industry clusters that have embraced
innovation and have developed an increasingly outward view towards global markets
with over $25 billion in exports. The region is also home to Fort Bliss, White Sands
Missile Range, and Holloman Air Force, which have a combined economic impact of
over $20 billion.
In the rural counties, vast areas of open land, popular hiking and camping areas, and beautiful state and national parks are assets
leveraged by strong tourism and travel industries. Agriculture flourishes along the Rio Grande River and cattle ranching thrives in areas
between mountain ranges suitable for foraging.
Although wages and income are not have not yet reached state and national levels, unemployment is low in most of the region and
educational attainment is increasing rapidly. The regional community colleges and universities have developed highly-specialized
education programs used to attract new employers in the advanced manufacturing, defense, and health industries. A recently-
established medical school, an upcoming dental school, and an airport technology and research acceleration park are among the latest
projects in the region.
The region also offers relatively inexpensive land and housing prices in comparison with larger metropolitan areas across the United
States. Several major and state highways connect the region to the rest of the nation, leading to the presence of a strong
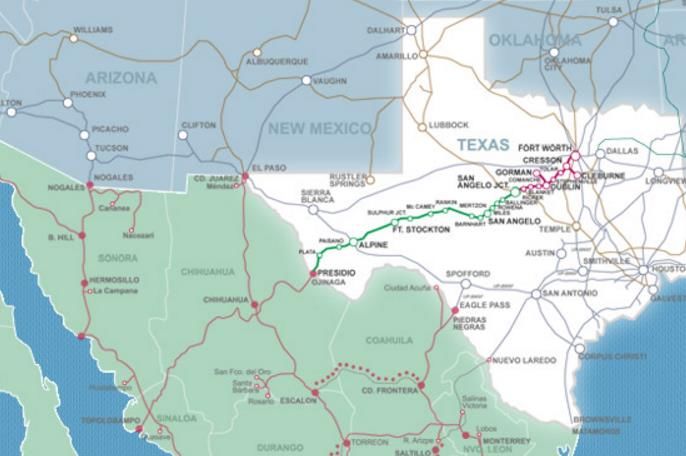
logistics/transportation industry. Located in a strategically-ideal location for national and binational rail trade, the region is also home
to BNSF Railway, Union Pacific Railroad, and the Southern Pacific Transportation Company in the United States and Ferromex in Mexico.
8
Section I
Executive Summary
Economic Development Opportunities and Barriers
STRENGTHS WEAKNESSES
Extensive data collection was performed to guide a regional
SWOT (strengths, weaknesses, opportunities, and
Land, sun, and good weather Inefficient border
threats)analysis process, exploring regional trends in
Central geographic location Access to capital
population, education, income, labor force, jobs and
Military complex Negative perceptions of low
employment, housing, transportation, public health,
Strong collaborations quality and high crime
infrastructure, natural resources, and business growth and
Trade with Mexico High poverty rates
clustering.
Bicultural and bilingual Low education rates
Through the SWOT analysis process, the WTEDD Strategy workforce Outflow of skilled and educated
Committee identified a series of core regional characteristics Strong education programs workforce
under the lens of economic development and quality of life Cooperation between law Need for infrastructure
improvements. enforcement and their development, including
The WTEDD region is blessed with a large number of assets communities broadband and
that can be leveraged to stand above competition, address Strong cultural and natural telecommunications
weaknesses, capitalize on opportunities, and deter threats. assets suited for tourism Non-assimilated border patrol
These have been separated between the urban WTEDD and homeland security
counties and the rural WTEDD counties to better explore the
economic opportunities and barriers impacting each region. OPPORTUNITIES THREATS
Increase participation in BRAC downsizing
A more comprehensive assessment of strengths, weaknesses, international markets Disadvantageous state
opportunities, and threats is also available in Section III in this Further leverage military budgets
document. complex and veteran services Dependence on federal
A benefit of the SWOT analysis process was that it created a Leverage historical, cultural, revenue for community and
channel for dialogue between stakeholders in different states, and natural assets economic development
different time zones, and at times working in different Clean energy production No duplication of utilities in
countries to talk about common regional issues and Make border crossing rural regions
objectives. It revealed that communities across the WTEDD improvements Depopulation in rural regions
region are more similar than they are different. Take advantage of ongoing Lack of industry
infrastructure investments diversification
Attract new industry due to
quality-of-life investments
9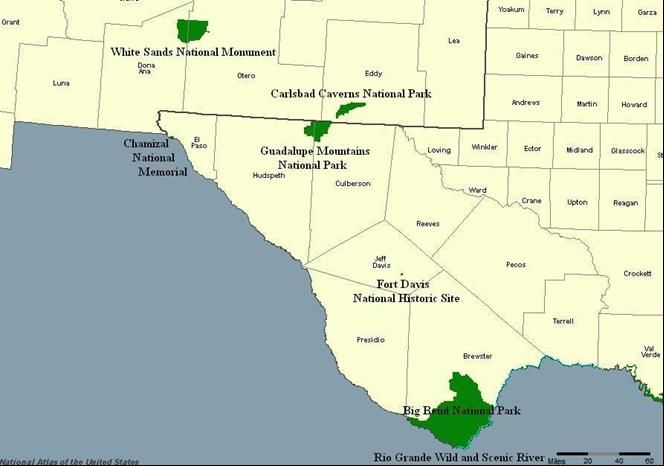
Section I
Executive Summary
REGIONAL VISION
The West Texas Economic Development District (WTEDD) region will become a preferred location for businesses and entrepreneurs
looking for:
A unique region proud of its identity and cultural heritage,
A dynamic, globally-competitive workforce,
World-class public infrastructure,
High quality of life for new and existing residents, and
A supportive environment that is conducive to strong, sustainable, and resilient economic growth and prosperity.
This vision builds upon a strong foundation composed of years of work and leadership from local community and economic
development stakeholders, existing businesses, higher education institutions, and communities within the WTEDD region.
STRATEGIC RECOMMENDATIONS
As the CEDS Strategy Committee worked through the SWOT process, discussion over economic, workforce, and infrastructure
development, affordable market-rate and low-income housing, and quality of life led to the creation of nine Strategic Recommendations
and their respective goals and performance measures. Many of these recommendations come from the strategic planning process of
key regional economic development players such as the Borderplex Alliance, Workforce Solutions Borderplex, the City of El Paso, the
University of Texas at El Paso (UTEP) Hunt Institute for Global Competitiveness, New Mexico State University (NMSU) Arrowhead
Center, the Presidio Municipal Development District, and from publications and discussions with the different municipalities, chambers
of commerce, business development centers, and private businesses in the region.
The CEDS Strategy Committee’s 2016-2020 Strategic Recommendations are:
1. Increase Economic Ties with Mexico and Latin America
2. Increase Cooperation between Local Economies, including Leveraging Presidio/Ojinaga as a Competitive Gateway for Trade
3. Become Known for Quality through Workforce Development and World-Class Education Programs
4. Increase Investments in Broadband, Solar Energy, and Public Infrastructure
5. Leverage the Significant Military Presence in the Region
6. Alleviate Regional Housing Issues
7. Strengthen the Region’s Position as a Tourist and Retail Destination
8. Spur Innovation and Entrepreneurialism
9. Promote Economic Resiliency
10Section I
Executive Summary
TRANSFORMING THE REGIONAL ECONOMY
The CEDS offers strategic recommendations and actions to support regional growth from its current conditions. Measurable performance
metrics are necessary in order to ensure that the recommended Key Actions are implemented by regional stakeholders, economic development
projects receive exposure and support, and that the results from such projects are quantified. The impact of the CEDS on the region will be
evaluated based on the results, frequency, and the visible progress of relevant initiatives and projects. Additionally, county-level changes in the
following core performance metrics will be tracked:
Number of jobs created after the implementation of the CEDS Changes in employment and unemployment
Monitoring of number, type, and dollar amount of Changes in average hourly wages
investments made in the region Changes in poverty rates
Monitoring of county business patterns to quantify business Changes in median household income
growth and decline Changes in per capita income
Monitoring of county industry patterns to quantify private job Changes in educational attainment of 25-44 demographic
creation and losses Changes in county population
Monitoring of county government programs to quantify public Changes in housing occupancy rates and housing costs at the
job creation and losses county level
Monitoring of economic impact from trade with Mexico to Changes in health insurance coverage
include value of exports, retail, and regional collaborations Quality of Life and Well-Being measures as described in
Dollar amount of economic impact of military bases in the Healthy People 2020’s County Health Rankings
region Return on Investment (ROI) on WTEDD initiatives
The CEDS is an evolving document intended to foster meaningful and sustainable grassroots collaboration across public, private, nonprofit, and
traditional and non-traditional political boundaries. As such, the CEDS will be revised on a yearly basis, to include the updating of Strategic
Recommendations and recreating visualizations and figures based on the latest data available.
The CEDS Strategy Committee will reconvene at least four times per year to evaluate the effectiveness of the 2016-2020 Strategic
Recommendations and their respective Key Actions as written. Regional economic and community development projects throughout the region
will be examined for congruency to the 2016-2020 Strategic Recommendations. County-level changes in the aforementioned performance
measures will be reviewed as part of the evaluation process based on the availability of new data.
The 2016-2020 CEDS process involved an ongoing public participation process where a broad and diverse set of stakeholders were engaged to
address economic problems and leverage economic opportunities in the WTEDD region. WTEDD staff traveled across the region to inform city and
county governments of the CEDS process, to gather input about the needs, goals, and strategies of each municipality, and to engage public officials
and staff as Strategy Committee members. Additionally, WTEDD staff engaged stakeholders from the private sector working in the health, tourism,
retail, and business industries.
These actions come together to create an improved business climate, support sustainable economic growth, continued workforce and infrastructure
development, increased community vitality and quality of life, and other factors needed to resolve critical issues impeding growth and factors
necessary to foster economic vitality and wealth creation in the WTEDD region. 11Section II
Summary Background
SECTION II: Summary Background
The West Texas Economic Development District (WTEDD) region includes El Paso, Hudspeth, Culberson, Jeff Davis, Presidio, and
Brewster Counties in Texas, and Doña Ana and Otero Counties in New Mexico. The municipios of Ciudad Juárez and Manuel Ojinaga
in Mexico are also included as part of the regional analysis as the Greater WTEDD Region.
This Greater WTEDD region incorporates an area of 37,684 square miles, includes three states and two countries, and is characterized
by significant economic, educational, health, and social interdependence. The region lies within the Chihuahuan Desert and is the most
arid portion of Texas and New Mexico.
The following State of the Region section highlights key
The Greater WTEDD Region
economic factors such as population and population
projections, education and income levels, labor force,
employment and unemployment trends, regional housing
markets and transportation, the health of the population,
infrastructure, and natural resources. When comparisons
are possible, datasets from WTEDD counties will be
juxtaposed with data from the municipios of Ciudad
Juárez and Manuel Ojinaga.
The WTEDD counties classified as urban are El Paso,
Doña Ana, and Otero, characterized by each having more
than 50,000 residents. The rural WTEDD counties are
Brewster, Culberson, Hudspeth, Jeff Davis, and Presidio.
In this document, most datasets and visualizations will
be separated between rural and urban counties to better
explore the diverse issues affecting each group, as well
as to present data in the format that most benefits
economic development projects, and regional use.
12Section II
Summary Background
State of the Region: Population Trends WTEDD Regional Population Growth (2005-2015)
As of 2015, the total population in the West Texas Economic
Development (WTEDD) region has grown to exceed 1.1 million. 13.3%
of this growth occurred between 2006 and 2015. The population growth
rate slowed in the years following the Great Recession (2007-2009).
The slowdown is attributed to decreased immigration and an outflow
of young, working-age people to other regions in Texas and the United
States with higher employment rates and higher average salaries.
The largest population centers in the region are the City of El Paso in
El Paso County, the City of Las Cruces in Doña Ana County, and the
City of Alamogordo in Otero County. Across the Border, the municipios
of Ciudad Juárez and Manuel Ojinaga are the largest population
centers. With the exception of Alamogordo, all of the major population
centers in the region are situated along the Rio Grande River.
A total of 372 Colonias exist in counties along the Rio Grande River, not
counting those on the Mexican side of the border (Rural Community
Assistance Partnership 2015). The region is sparsely populated in areas
outside of major cities and the suburbs between them, with a
population density a little over one person per square mile.
U.S. Census Bureau: American Fact Finder
Greater WTEDD Region Population per Square Mile (2015)
WTEDD Region,
WTEDD TX WTEDD TX
Region including TX and El Paso Brewster Culberson Hudspeth Jeff Davis Presidio Texas
Counties excluding El Paso
NM Counties
Total population 1,138,042 859,385 23,792 835,593 9,145 2,236 3,379 2,156 6,876 27,469,114
Land area (square miles) 32,143 21,710 20,696 1,014 6,192 3,812 4,571 2,265 3,856 261,232
Persons per square mile 35.4 39.6 1.1 824.1 1.5 0.6 0.7 1.0 1.8 105.2
Greater WTEDD
Total, including WTEDD NM Chihuahua
Region Doña Ana Otero New Mexico Ciudad Juarez Manuel Ojinaga
Chihuahua Counties Total Municipios Total
Municipios
Total population 2,543,765 278,657 214,295 64,362 2,085,109 1,440,669 1,409,987 30,682
Land area (square miles) 37,684 10,433 3,807 6,626 121,298 5,541 1,873 3,668
Persons per square mile 67.5 26.7 56.3 9.7 17.2 260.0 752.8 8.4
U.S. Census Bureau: American Fact Finder 2015 Population Estimates; SECOB CONAPO: Proyecciones de Población
13Section II
Summary Background
WTEDD Regional vs. State Population (2015)
The Texas WTEDD counties combined account for only 3.13% of the total population in the State of Texas, yet account for over 8.3%
of the total land area. Doña Ana and Otero Counties account for 13.3% of the total population in New Mexico, and similarly account for
8.6% of the state’s total land area.
The City of El Paso is closer to the capitals of New Mexico and Arizona than it is to the capital of Texas. Santa Fe, New Mexico is 272
miles away, and Phoenix, Arizona is 348 miles away, while Austin, Texas is 526 miles away from El Paso. This geographic isolation has
had a visible impact on in-state migration, out-of-state migration, and the development of economic, cultural, and social bonds that are
closer to Mexico, New Mexico, and Arizona than to many other regions in Texas.
The WTEDD region also continues to urbanize. Incorporated municipalities and census-
WTEDD Population by County (2015) designated areas surrounding the City of El Paso, the City of Las Cruces, and the City of
Alamogordo have seen substantial growth in the last ten years. The City of Anthony, New
Mexico incorporated in 2010 and the City of San Elizario incorporated in 2014.
73.7% of the total population in the WTEDD region lives in El Paso County. As of 2015, 85%
of the population lives within the El Paso city limits, compared to 81% in 2010.
18.9% of the total WTEDD population lives in Doña Ana County. 47% of the population in
Doña Ana County lives within the Las Cruces city limits as of 2015, compared to 45% in
2010.
5.7% of the total WTEDD population lives in Otero County. As of 2010, 47% of the
population in Otero County lives within the City of Alamogordo, with no recent changes.
Although the Counties of Brewster, Culberson, Hudspeth, Jeff Davis, and Presidio account
for 64% of the total WTEDD land area and 95% of the WTEDD land area in Texas, only
U.S. Census Bureau: American Fact Finder
2015 Population Estimates
1.7% of total WTEDD population resides in these counties.
14
In Doña Ana County in New 46% 2010Section II
Summary Background
Total Population by County, including Juárez Projected Population Growth in WTEDD Counties, including Juárez and
and Ojinaga (2015) Ojinaga (2010-2030)
U.S. Census Bureau: American Fact Finder 2015 Population Estimates; Texas .5 migration scenarios used. Differences in the methodology used to create
Demographic Center 2014 County Population Estimates; The University of New projections between agencies in the United States and Mexico may limit the
Mexico Bureau of Business & Economic Research August 2008 Population accuracy of this analysis.
Projections; SECOB CONAPO: Proyecciones de población 2010-2030
Differences in census and projections methodology used by the U.S. Census Bureau and the Consejo Nacional de Población (CONAPO)
limit the capacity of WTEDD staff to perform cross-analyses. Despite these limitations, it is important to incorporate the best available
data in order to capture the significant economic, educational, health, and social interdependence between the region’s border
communities. It is important to note that the data presented does not reflect the transitional nature of the region’s population. Many
people living in the border communities have families and businesses on the opposite side, commute daily to school or work, and own
homes on both sides of the border.
The total combined population of the WTEDD and the two border communities in Mexico is 2,543,765. 54.7% of the combined
population lives in the municipio of Ciudad Juárez. El Paso County, in comparison, encompasses 32.4%. Doña Ana and Otero Counties
in New Mexico together account for almost 11%. Brewster, Culberson, Hudspeth, Jeff Davis, and Presidio Counties, along with Ojinaga,
account for 2.1% of the combined population. A cross-analysis of county-level population projections reveals minimal changes in the
regional distribution of population in the next decade.
15Section II
Summary Background
Racial and Ethnic Composition by County (2014)
The majority of the population in the WTEDD is of Hispanic origin,
consistent with most counties along the U.S.-Mexico border. The
Hispanic population in the WTEDD region is also growing faster than
other ethnic groups. Greater ethnic diversity exists in the larger
population centers, where universities and military installations are
located, as opposed to rural areas.
As of 2014, 94% of the total population in the WTEDD region identifies
as white, with 75% of these identifying as Hispanic. The percentage of
the Hispanic population is highest in El Paso County, where 81.4% of
residents identify as white Hispanic.
Over 50% of the population in Brewster, Jeff Davis, and Otero Counties
identifies as Non-Hispanic white. In Otero County, 5.8% of the
population identifies as Native American.
WTEDD Population Racial and Ethnic Composition (2014)
County Hispanic White Black Asian Other
Urban
El Paso 670946 110287 24393 8331 9905
Doña Ana 141087 62649 3223 2291 3692
Otero 23230 33794 2350 721 5320
Total 835263 206730 29966 11343 18917
Rural
Brewster 3996 4933 168 0 173
Culberson 1847 427 16 0 35
Hudspeth 2634 671 23 16 0
Jeff Davis 852 1363 3 30 34
WTEDD Racial and Ethnic Composition (2014)
Presidio 6072 1171 19 175 42
U.S. Census Bureau 2014 American Community Survey
Total 15401 8565 229 221 284
U.S. Census Bureau 2014 American Community Survey
16Section II
Summary Background
Median Age by County (2014) WTEDD Regional vs. National Age Distribution (2014)
U.S. Census Bureau 2014 American Community Survey Change in Rural County
Population (2005-2015)
The median age for the United States as a whole has increased in the last decade,
reaching 37.4 years in 2014. The population of the WTEDD urban counties is younger
compared to the population of the United States. In contrast, the population of the
WTEDD rural counties is older.
Consistent with trends across the United States, population growth among Hispanics in
the WTEDD region was fueled primarily by natural increase (births minus deaths).
Additionally, the percentage of population under 24 years of age in the region combined
is 6.8% higher than in the United States.
The population in most of the rural WTEDD counties has decreased since 2005. The
most significant population loss occured in the age groups ranging from 20 to 34 years
of age. High unemployment rates account for some of the outward migration. As the
median age in rural WTEDD counties increases, it is expected that the number of births
U.S. Census American Fact Finder 2015 Population Estimates; U.S.
will decrease, furthering the current depopulation trend. Census Intercensal Estimates of the Resident Population for
Counties: April 1, 2000 to July 1, 2010
17Section II
Summary Background
State of the Region: Education and Income
High School Educational Attainment Historically, high school attainment rates in El Paso and Doña Ana Counties have
in Urban Counties (2014) been lower than the state and national rates, while high school attainment in Otero
County has been at or above the state and national attainment rates.
As of 2014, high school attainment rates in El Paso, Doña Ana, and Otero Counties
have progressed almost to the state and national levels. In all three counties, high
school attainment rates in the 18-24 age group is higher than the state and national
rates in the same age group.
College attainment rates have been substantially lower in El Paso and Otero Counties
compared to their respective state rates. Doña Ana County has college attainment
rates at or above those of New Mexico. However, college attainment rates in all three
counties are substantially lower than the national rate.
High school attainment rates in El Paso, Doña Ana, and Otero Counties are consistent
with rates in counties along the U.S.-Mexico border and in areas with high poverty
rates across the United States. El Paso and Doña Ana Counties have college
College Educational Attainment
attainment rates that are at or above the majority of counties along the U.S.-Mexico
in Urban Counties (2014)
border.
High School and College Educational Attainment by Age Group (2014)
El Paso Doña Ana Otero Texas New Mexico United States
High school, some college, or associate's degree (Age 25+) 74.8% 78.0% 84.5% 81.6% 84.0% 86.3%
Bachelor's degree or higher (Age 25+) 20.8% 27.4% 17.2% 27.1% 26.1% 29.3%
El Paso Doña Ana Otero Texas New Mexico United States
18-24 high school, some college, or associate's degree 79.5% 78.1% 79.8% 74.5% 74.8% 75.3%
18-24 bachelor's degree or higher 5.5% 5.5% 3.7% 7.6% 5.1% 9.6%
25-34 high school, some college, or associate's degree 87.7% 84.8% 84.3% 84.6% 84.9% 88.3%
25-34 bachelor's degree or higher 22.6% 27.5% 13.9% 27.5% 21.7% 32.4%
35-44 high school, some college, or associate's degree 82.5% 79.5% 84.3% 82.0% 84.8% 87.7%
35-44 bachelor's degree or higher 23.8% 26.4% 16.6% 29.1% 25.8% 32.8%
45-64 high school, some college, or associate's degree 73.4% 78.5% 86.2% 82.5% 86.1% 88.0%
45-64 bachelor's degree or higher 21.2% 27.9% 18.7% 27.6% 28.0% 29.1%
65+ high school, some college, or associate's degree 51.4% 59.1% 82.2% 75.2% 78.5% 80.0%
65+ bachelor's degree or higher 13.6% 27.4% 18.3% 23.0% 26.9% 23.2%
U.S. Census Bureau 2014 American Community Survey U.S. Census Bureau 2014 American Community Survey
18Section II
Summary Background
High School Educational Attainment High school attainment rates in the rural WTEDD counties vary. Brewster and
in Rural Counties (2014) Jeff Davis have high school and college educational attainment rates that are
at or above the state and national levels. According to U.S. Census data from
1970 to 2000, Brewster County has historically maintained high school and
college attainment rates above the state and national rates.
Culberson, Hudspeth, and Presidio Counties have high school and college
educational attainment rates that are substantially below the state and national
levels. U.S. Census data from 1970 to 2000 shows a historical trend of low
attainment rates in these counties and are consistent with the low attainment
rates across other counties along the U.S.-Mexico border.
Data from the 2014 American Community Survey shows that high school
attainment rates among 20-24 year olds in Presidio and Jeff Davis Counties are
substantially lower than the other WTEDD rural counties. This is due in part to
a significant decrease in population in that particular age group in both
counties. Although there is a general trend of outward migration throughout
College Educational Attainment the WTEDD rural counties in age groups 20-24 and 25-34, the decrease in that
in Urban Counties (2014) population group is higher in Presidio and Jeff Davis Counties.
High School and College Educational Attainment by Age Group (2014)
Brewster Culberson Hudspeth Jeff Davis Presidio Texas United States
High school, some college, or associate's degree (Age 25+) 86.6% 65.2% 53.2% 85.1% 55.0% 81.6% 86.3%
Bachelor's degree or higher (Age 25+) 36.3% 11.7% 8.4% 38.4% 22.0% 27.1% 29.3%
Brewster Culberson Hudspeth Jeff Davis Presidio Texas United States
18-24 high school, some college, or associate's degree 77.4% 87.0% 72.7% 41.1% 40.9% 74.5% 75.3%
18-24 bachelor's degree or higher 15.1% 2.4% 2.6% 0.0% 10.9% 7.6% 9.6%
25-34 high school, some college, or associate's degree 93.8% 84.5% 70.6% 67.4% 90.4% 84.6% 88.3%
25-34 bachelor's degree or higher 31.0% 11.7% 3.0% 16.0% 47.6% 27.5% 32.4%
35-44 high school, some college, or associate's degree 94.1% 85.2% 38.8% 79.3% 52.4% 82.0% 87.7%
35-44 bachelor's degree or higher 52.5% 15.2% 4.2% 28.4% 22.5% 29.1% 32.8%
45-64 high school, some college, or associate's degree 86.4% 62.7% 56.7% 88.5% 60.7% 82.5% 88.0%
45-64 bachelor's degree or higher 36.6% 9.5% 10.8% 38.0% 21.7% 27.6% 29.1%
65+ high school, some college, or associate's degree 77.7% 41.1% 42.6% 86.7% 34.3% 75.2% 80.0%
65+ bachelor's degree or higher 28.9% 13.7% 11.5% 45.6% 10.5% 23.0% 23.2%
U.S. Census Bureau 2014 American Community Survey U.S. Census Bureau 2014 American Community Survey
19Section II
Summary Background
Median Household Income in Urban Counties (2010-2014) Median household income is an economic measure used to track regional
economic trends and includes wages and salaries, unemployment
insurance, disability payments, child support payments received, regular
rental receipts, and personal business and investment incomes. Median
household income is also used by government programs to determine
eligibility, such as nutrition assistance or need-based financial aid.
Median household income levels in the urban WTEDD counties are
significantly lower than the state and national levels, a trend that began
since the 1950’s. According to data from the 2014 American Community
Survey, after adjusting for inflation from 2005-2015, median household
income has increased 16% in the El Paso metro area and 11% in the Las
Cruces metro area, compared to 8% in the State of Texas, 0% in the State
of New Mexico, and -1% in the United States.
Growth in inflation-adjusted (“real”) median household income is
attributed to improved economic conditions and increased household sizes.
Poverty Rate and Percentage Change in Urban Counties (2000-2014)
The 2014 federal poverty level for a family of four was
$23,850. In El Paso County, 23.4% of the population lived
below the poverty level (ACS 2014), with a 0.4% reduction
since the year 2000 (U.S. Census 2000). In Doña Ana County,
27.8% of the population lived below the poverty level (2014),
with a 2.4% increase since 2000. In Otero County, 22% of
the population lived below the poverty level (2014), with a
2.7% increase since 2000.
With the exception of El Paso County, the increased poverty
rates in Doña Ana and Otero Counties are consistent with
state and national trends. A smaller and declining percentage
of people in poverty are indicators of wealth in a region.
U.S. Census Bureau 2000 Census; 2014 American Community Survey
20Section II
Summary Background
Median Household Income in Rural Counties (2014)
Median household income levels across the rural WTEDD counties are
mixed.
Median household income in Jeff Davis County is comparable to the
state and national levels, consistent with other demographic and
economic trends that affect income levels such as age, high school
and college attainment, and employment rates. Although Brewster
County has similar demographics, median household income is
significantly lower than Jeff Davis County.
Culberson, Hudspeth, and Presidio Counties are demographically
similar. However, Median household income in Culberson higher is
higher than in Hudspeth and Presidio Counties.
Median household income levels in Hudspeth and Presidio Counties
are consistent with levels found in rural counties across the U.S.-
Mexico border.
Poverty rates across the rural WTEDD counties are also Poverty Rate and Percentage Change in Rural Counties (2000-2014)
mixed. Brewster, Jeff Davis, and Presidio Counties have
seen considerable decreases in poverty rates from 2000 to
2014 measures. Hudspeth and Culberson Counties have
seen considerable increases in poverty rates, more than
three times the increase in the State of Texas and more
than twice the increase in the United States.
Trend analysis for median household income levels for the
rural WTEDD counties may be skewed as a result of the
significant outflow of working-age people to other regions
in Texas and the United States. The rural WTEDD counties
have significantly smaller populations and economies that
may be more demographically impacted by temporary
economic shocks and downward trends.
U.S. Census Bureau 2000 Census; 2014 American Community
Survey 21Section II
Summary Background
State of the Region: Labor Force, Employment, and Wages
Average Yearly Labor Force in
Urban WTEDD Urban Counties (2005-2015) Unemployment Rate (2005-2015)
El Paso Doña Ana Otero Total
2005 290,010 85,089 26,815 401,914
2006 291,023 85,792 26,045 402,860
2007 291,099 86,938 25,992 404,029
2008 297,690 88,893 25,888 412,471
2009 307,566 90,210 25,939 423,715
2010 340,841 93,661 24,980 459,482
2011 346,748 93,459 24,754 464,961
2012 347,830 93,925 25,121 466,876
2013 348,123 93,800 25,265 467,188
2014 344,563 93,499 24,707 462,769
2015 343,495 93,179 24,709 461,383
Texas Workforce Commission Labor Market & Career Information Unemployment
Blue = Increase | Red = Decrease LAUS Report; New Mexico Department of Workforce Solutions Economic Data
Releases: Annual Averages; U.S. National Bureau of Economic Research
The Bureau of Labor and Statistics (BLS) within the Department of Labor defines the Labor Force as “all individuals 16 years of age
or over who are part of the civilian non-institutional population and are either working or looking for work.”
Labor force in the WTEDD region is largely concentrated in El Paso and Doña Ana Counties. Labor force has grown in El Paso County
by 18% and in Doña Ana County by 8.7% from 2005 to 2015. There have been small declines in labor force in El Paso and Doña
Ana Counties for the last two years. Otero County has seen a downward trend in labor force and has decreased by 8% from 2005
to 2015.
The labor force is not growing at rates consistent with population growth compared to other regions in the State of Texas. This can
be attributed to an outward migration of the working-age population to other areas in Texas and the United States.
Unemployment rates in the urban WTEDD counties have not followed national trends before, during, and after the 2008 “Great
Recession.” In El Paso County, unemployment rates were higher before the recession, but have decreased at a rate consistent with
national the national rate. In Doña Ana and Otero Counties, unemployment rates were lower prior to the start of the recession,
increased during the recession, and have stagnated at recession levels since 2010.
22Section II
Summary Background
Average Yearly Labor Force in Total Number of Employed People in
Rural WTEDD Counties (2005-2015) Rural WTEDD Counties (2005-2015)
Brewster Culberson Hudspeth Jeff Davis Presidio Total Brewster Culberson Hudspeth Jeff Davis Presidio Total
2005 5,249 1,648 1,328 1,203 3,241 12,669 2005 5,052 1,583 1,236 1,156 2,884 11,911
2006 5,413 1,636 1,424 1,197 3,214 12,884 2006 5,229 1,585 1,326 1,149 2,876 12,165
2007 5,217 1,752 1,525 1,180 3,209 12,883 2007 5,046 1,705 1,449 1,141 2,925 12,266
2008 5,101 1,754 1,592 1,191 3,343 12,981 2008 4,914 1,703 1,530 1,148 2,997 12,292
2009 5,153 1,809 1,719 1,200 3,744 13,625 2009 4,892 1,737 1,626 1,143 3,139 12,537
2010 4,912 1,032 1,413 1,273 3,743 12,373 2010 4,644 959 1,301 1,210 3,052 11,166
2011 4,862 1,018 1,388 1,251 3,781 12,300 2011 4,592 948 1,277 1,189 3,207 11,213
2012 4,567 990 1,328 1,216 3,831 11,932 2012 4,335 930 1,229 1,157 3,322 10,973
2013 4,166 1,022 1,298 1,165 3,764 11,415 2013 3,937 971 1,208 1,117 3,284 10,517
2014 4,067 1,012 1,251 1,147 3,412 10,889 2014 3,879 970 1,172 1,106 3,015 10,142
2015 3,913 1,034 1,230 1,089 3,107 10,373 2015 3,756 989 1,159 1,053 2,770 9,727
Blue = Increase | Red = Decrease Texas Workforce Commission Labor Market & Career Information Unemployment
LAUS Report; U.S. National Bureau of Economic Research
Unemployment Rate (2005-2015)
Labor force in the rural WTEDD counties has been in steady decline
since 2005 due to the outward migration of the working age
population. The number of people employed has also been
decreasing steadily.
Unemployment rates in Hudspeth, Culberson, Brewster, and Jeff
Davis Counties have been lower since 2005 compared to national
rates. Unemployment was less impacted during the 2008 recession
and has returned to post-recession levels.
The unemployment rate in Presidio County increased as high as
18.5% in 2010, but has returned to post-recession levels. However,
unemployment rates in Presidio County remain significantly higher
than regional, state, and national rates.
23Section II
Summary Background
Changes in Average Hourly Wage (2009-2015)
Salaries and wages in the WTEDD region are behind the nation
in most occupational categories. Average wages in West Texas
and Southern New Mexico are at similar levels. However,
compared to the U.S. average in 2015, average wages in the
urban WTEDD counties are $2.33 lower. This wage disparity
has increased by 62% since 2009.
For almost all standard occupations (see page 26), the 2015
average and median hourly wages are below the national
averages. Truck Drivers, which in 2009 had a median hourly
wage in the West Texas region that was $1.84 higher than
national figures, have also seen wages stagnate or decrease.
Average and median hourly wage levels for low-wage, low-
skilled occupations in categories such as retail, cashiers, and BLS May 2015 National Occupational Employment and Wage
food service are at levels similar to other regions in the United Estimates – United States; Texas Workforce Commission Labor
States. Market & Career Information – Tracer Data Link
Median and average wages for top paying occupations in West Texas are mixed and have seen increases since 2009. Occupations
in upper management, real estate, and medical service categories are higher than the national figures (see page 27). Occupations
in information technology, finance, lower management, law, and human resources are at times considerably lower than national
figures.
Over the last 35 years (with the exception of the late 1990s), hourly wages have lagged behind economy-wide productivity
(Economic Policy Institute 2015). This trend has been the primary explanation for the rise of income stagnation and income
inequality over the past generation. Both lower and middle class families have been affected by stagnant wages. However, wages
in most STEM (science, technology, engineering, and math) occupations have growth significantly over the past decade
24Section II
Summary Background
Top Occupations by Number of Jobs: Wage Data in Comparison to the Rest of the United States (2015)
2015 West 2015 West
Texas Texas
Average Median
2015 2015 Entry- 2015 2015 US 2015 US Hourly Hourly
Number of Average Level Median Average Median Wage Wage
Jobs in West Hourly. Hourly. Hourly Hourly. Hourly Compared Compared
Texas Standard Occupational Classification Wage Wage Wage Wage Wage to U.S. to U.S.
299,110 Total, All Occupations $17.80 $8.34 $12.73 $23.23 $17.40 ($5.43) ($4.67)
12,990 Retail Salespersons $11.17 $8.20 $9.06 $11.77 $9.84 ($0.60) ($0.78)
11,350 Office Clerks, General $13.10 $8.52 $11.49 $15.33 $14.22 ($2.23) ($2.73)
9,360 Cashiers $9.01 $8.20 $8.72 $10.10 $9.29 ($1.09) ($0.57)
9,290 Combined Food Preparation and Serving Workers, Inc $8.63 $8.16 $8.61 $9.47 $9.09 ($0.84) ($0.48)
8,740 Personal and Home Health Aides $8.34 $8.19 $8.52 $11.00 $10.54 ($2.66) ($2.02)
7,810 Customer Service Representatives $13.04 $9.66 $11.81 $16.62 $15.25 ($3.58) ($3.44)
5,700 Waiters and Waitresses $8.94 $8.17 $8.73 $11.07 $9.25 ($2.13) ($0.52)
5,580 Registered Nurses $31.88 $25.42 $30.97 $34.14 $32.45 ($2.26) ($1.48)
5,580 Janitors and Cleaners, Except Maids and Housekeeping $10.13 $8.15 $9.59 $12.59 $11.27 ($2.46) ($1.68)
5,250 Truck Drivers, Heavy and Tractor-Trailer $17.95 $11.03 $17.18 $20.43 $19.36 ($2.48) ($2.18)
4,990 Secretaries, Except Legal, Medical, and Executive $13.52 $8.84 $12.85 $16.92 $16.31 ($3.40) ($3.46)
4,980 Stock Clerks and Order Fillers $10.50 $8.21 $9.29 $12.47 $11.17 ($1.97) ($1.88)
4,350 Laborers & Freight, Stock & Material Movers $10.21 $8.22 $9.40 $13.39 $12.02 ($3.18) ($2.62)
3,650 General and Operations Managers $51.21 $22.75 $38.93 $57.44 $46.99 ($6.23) ($8.06)
3,470 First-Line Supervis./Managers of Retail Sales Work $20.82 $10.91 $17.29 $20.63 $18.42 $0.19 ($1.13)
3,080 Security Guards $11.35 $8.19 $9.90 $13.68 $11.84 ($2.33) ($1.94)
3,070 Bookkeeping, Accounting, and Auditing Clerks $15.38 $10.07 $14.70 $18.74 $17.91 ($3.36) ($3.21)
2,880 Cooks, Restaurant $9.54 $8.19 $9.10 $11.74 $11.11 ($2.20) ($2.01)
2,880 Maintenance and Repair Workers, General $14.17 $9.26 $13.43 $18.73 $17.61 ($4.56) ($4.18)
2,820 First-Line Supervisors of Office and Administrative Support $24.81 $15.00 $22.68 $27.01 $25.30 ($2.20) ($2.62)
2,530 Arts, Design, Entertainment, Sports, and Media Occupations $20.27 $8.82 $16.80 $27.39 $22.19 ($7.12) ($5.39)
2,190 Nursing Assistants $10.43 $8.19 $9.41 $12.89 $12.36 ($2.46) ($2.95)
BLS May 2015 National Occupational Employment and Wage Estimates – United States; Texas Workforce Commission Labor Market & Career
Information – Tracer Data Link
25Section II
Summary Background
Top Paying Occupations in West Texas Compared to the Rest of the United States (2015)
2015 2015 2015 US 2015 US 2015 West Texas 2015 West Texas
Average 2015 Entry Median Average Median Average Hourly Median Hourly
Hourly Hourly Hourly Hourly Hourly Wage Compared Wage Compared
Standard Occupational Code/Title Wage Wage Wage Wage Wage to U.S. to U.S.
Chief Executives $106.31 $64.83 $97.78 $89.35 $84.19 $16.96 $13.59
Dentists, General $88.13 $55.21 $73.98 $82.86 $73.42 $5.27 $0.56
Advertising and Promotions Managers $75.27 $31.91 $83.61 $54.62 $46.10 $20.65 $37.51
Purchasing Managers $66.78 $33.11 $56.82 $54.87 $51.98 $11.91 $4.84
Industrial Production Managers $65.45 $29.56 $53.46 $49.87 $45.17 $15.58 $8.29
Lawyers $64.36 $34.33 $49.88 $65.51 $55.69 ($1.15) ($5.81)
Marketing Managers $63.79 $37.56 $60.86 $67.63 $61.90 ($3.84) ($1.04)
Mechanical Engineers $59.53 $27.70 $45.13 $42.40 $40.19 $17.13 $4.94
Sales Managers $58.50 $28.30 $49.40 $62.69 $54.74 ($4.19) ($5.34)
Pharmacists $58.48 $53.53 $58.44 $57.34 $58.41 $1.14 $0.03
Engineering Managers $57.77 $36.14 $56.91 $68.10 $63.85 ($10.33) ($6.94)
Real Estate Brokers $56.48 $41.97 $45.50 $38.56 $27.34 $17.92 $18.16
Public Relations Managers $56.42 $33.14 $53.65 $57.40 $50.07 ($0.98) $3.58
Physician Assistants $55.97 $39.69 $55.05 $47.73 $47.20 $8.24 $7.85
Nurse Practitioners $55.73 $41.16 $53.22 $48.68 $47.21 $7.05 $6.01
Computer and Information Systems Managers $55.64 $35.96 $55.33 $67.79 $63.27 ($12.15) ($7.94)
First-Line Super./Man. of Police & Detectives $55.51 $34.72 $63.22 $41.26 $39.47 $14.25 $23.75
Natural Sciences Managers $52.52 $43.78 $48.15 $65.66 $57.77 ($13.14) ($9.62)
Financial Managers $51.56 $31.20 $45.10 $64.58 $56.73 ($13.02) ($11.63)
Education Administrators, Postsecondary $51.32 $27.26 $44.62 $49.33 $42.59 $1.99 $2.03
General and Operations Managers $51.21 $22.75 $38.93 $57.44 $46.99 ($6.23) ($8.06)
Veterinarians $50.71 $29.18 $42.82 $47.59 $42.54 $3.12 $0.28
Computer Network Architects $49.86 $29.11 $50.49 $49.57 $48.19 $0.29 $2.30
Physical Therapists $49.33 $33.93 $45.46 $41.25 $40.40 $8.08 $5.06
Occupational Therapists $47.51 $32.35 $45.17 $39.27 $38.54 $8.24 $6.63
Administrative Law Judges, Adjudicators, and Hearing Officers $47.28 $39.18 $41.44 $44.78 $43.56 $2.50 ($2.12)
Managers, All Other $47.25 $41.08 $44.15 $53.47 $50.41 ($6.22) ($6.26)
Human Resources Managers $46.34 $29.78 $43.02 $56.29 $50.21 ($9.95) ($7.19)
Healthcare Practitioners & Tech. Workers, Other $46.26 $28.39 $53.49 $37.40 $30.10 $8.86 $23.39
Engineers, All Other $46.16 $26.88 $43.88 $47.19 $46.11 ($1.03) ($2.23)
BLS May 2015 National Occupational Employment and Wage Estimates – United States; Texas Workforce Commission Labor Market &
Career Information – Tracer Data Link
26Section II
Summary Background
State of the Region: Housing and Transportation
Household Occupancy Status (2014) Households with Housing Costs Over 30% (2014)
El Paso Doña Ana Otero Texas New Mexico United States
Owner Occupied Under 35k Costs Over 30% 16.9% 16.4% 16.1% 12.8% 15.2% 13.3%
Owner Occupied Over 35k Costs Over 30% 7.5% 4.4% 6.0% 10.2% 9.0% 14.1%
Renter Occupied Under 35k Costs Over 30% 40.1% 46.7% 32.2% 37.9% 40.4% 38.4%
Renter Occupied Over 35k Costs Over 30% 6.3% 4.4% 5.3% 7.3% 5.1% 9.9%
Households without "Affordable Rate" 70.8% 71.9% 59.6% 68.2% 69.7% 75.7%
Households with "Affordable Rate" 29.2% 28.1% 40.4% 31.8% 30.3% 24.3%
Average Monthly Owner-Occupied Housing Costs $800.00 $709.00 $593.00 $1,028.00 $801.00 $1,108.00
Average Monthly Renter-Occupied Housing Costs $741.00 $705.00 $775.00 $870.00 $774.00 $920.00
Median Monthly Household Income $3,398.58 $3,202.17 $3,384.50 $4,381.33 $3,747.33 $4,456.83
A cost-of-living index is used to measure relative cost of living over time or regions
using factors such as groceries, housing, utilities, transportation, healthcare, and
other miscellaneous goods and services.
El Paso and Doña Ana counties are considered affordable within the national
House Value / Income Ratio across
composite index. However, lower wages in the region offset these perceived cost
Urban WTEDD Counties (2014)
advantages. Additionally, housing costs have risen above wages across the country.
Housing affordability has traditionally been set at 30% of household income.
Households with housing costs above 30% are said to be “burdened.” 70.8% of
households in El Paso County exceed the 30% affordability threshold. Similarly,
71.9% of households in Doña Ana County exceed the 30% affordability threshold.
These figures are consistent with state percentages, but are lower than the national
percentage. In Otero County, only 59.6% of households exceed the 30%
affordability threshold, which is well below regional, state, and national figures.
Renter/owner occupancy status stands close to a 40/60% ratio across the urban
WTEDD region and in state averages. Across the United States, this ratio changes
to 35/65%.
U.S. Census Bureau 2014 American Community Survey
The house value / income ratio is used to determine the affordability of buying a
home in a given region. Historically, the U.S. has maintained a 2.2 ratio. In urban
WTEDD counties, average home prices have risen considerably, making it less
affordable to purchase a home than in the past.
27Section II
Summary Background
Household Occupancy Status (2014) Households with Housing Costs Over 30% (2014)
Brewster Culberson Hudspeth Jeff Davis Presidio Texas New Mexico United States
Owner Occupied Under 35k Costs Over 30% 9.3% 20.7% 24.3% 17.0% 10.8% 12.8% 15.2% 13.3%
Owner Occupied Over 35k Costs Over 30% 7.3% 0.0% 0.0% 0.6% 3.2% 10.2% 9.0% 14.1%
Renter Occupied Under 35k Costs Over 30% 27.4% 38.2% 26.8% 3.5% 20.6% 37.9% 40.4% 38.4%
Renter Occupied Over 35k Costs Over 30% 5.1% 0.0% 3.4% 3.2% 0.0% 7.3% 5.1% 9.9%
Households without "Affordable Rate" 49.1% 58.9% 54.5% 24.3% 34.6% 68.2% 69.7% 75.7%
Households with "Affordable Rate" 50.9% 41.1% 45.5% 75.7% 65.4% 31.8% 30.3% 24.3%
Average Monthly Owner-Occupied Housing Costs $488.00 $381.00 $354.00 $371.00 $346.00 $1,028.00 $801.00 $1,108.00
Average Monthly Renter-Occupied Housing Costs $629.00 $480.00 $660.00 $929.00 $400.00 $870.00 $774.00 $920.00
Median Monthly Household Income $3,215.75 $2,941.83 $1,945.83 $4,279.75 $2,581.92 $4,381.33 $3,747.33 $4,456.83
Although composite index scores are not currently reported for rural WTEDD counties,
the similar relative cost / wage analysis can be made to determine cost of living after
considering housing. It is important to note that cost of goods are consistently higher
in rural counties.
Despite having lower income levels, it is generally more affordable to own a home in
rural WTEDD counties than it is in the urban counties, where the renter/owner ratio
House Value / Income Ratio across benefits homeownership over renting. Excluding Brewster County, house value /
Rural WTEDD Counties (2014) income ratios are closer to or below urban, state, and national figures. This is
consistent with many rural counties across the State of Texas. The higher average age
of the population living in these counties as well as outward migration are likely factors
influencing this trend.
There are also substantially less households under the housing affordability threshold
in the rural WTEDD counties compared to urban, state, and national percentages.
Consistent with seasonal tourist destination across the United States, house values in
Brewster County are well above rural averages. Homeowners in Marfa, TX and
Alpine, TX offer short-term rental options through services like Airbnb. However,
traditional demographics currently do not capture vacant and short-term-rental
housing.
U.S. Census Bureau 2014 American Community Survey
28Section II
Summary Background
Population Working at Home in WTEDD Urban Counties
El Paso Doña Ana Otero TX N.M. U.S.
Worked at home (M) 2.8% 3.8% 2.0% 3.9% 4.4% 4.2%
Worked at home (F) 3.3% 4.7% 3.2% 4.3% 5.3% 4.5%
Population Working Inside/Outside County of Residence in WTEDD Urban Counties
El Paso Doña Ana Otero TX N.M. U.S.
Worked In County (M) 92.2% 79.3% 86.1% 75.0% 82.7% 69.9%
Worked Outside County (M) 1.7% 3.3% 6.2% 23.5% 13.2% 25.6%
Worked Outside of State (M) 6.2% 17.4% 7.7% 1.5% 4.0% 4.5%
Worked In County (F) 97.0% 84.6% 91.5% 80.4% 87.0% 75.3%
Worked Outside County (F) 0.3% 1.3% 2.7% 19.1% 10.6% 21.7%
Worked Outside of State (F) 3.0% 14.2% 5.8% 50.0% 2.3% 3.0%
Mean Travel Time to Work in WTEDD Urban Counties
El Paso Doña Ana Otero TX N.M. U.S.
U.S. Census
Mean Travel Time (M) 24.2 22.1 22.2 26.9 23.2 27.2 Bureau 2014
Mean Travel Time (F) 21.8 18.5 17.7 23.1 20.0 24.0 American
Mean Travel Time 23 20.3 19.95 25 21.6 25.6 Community
Survey
Carpooled (M) 10.6% 10.5% 17.6% 11.2% 11.1% 9.8%
Carpooled (F) 12.1% 8.9% 16.0% 10.9% 9.8% 9.3%
A significant percentage of workers in El Paso, Doña Ana, and Otero counties are employed outside of their home state. Residential
growth and commercial development along the Interstate 10 Highway between the City of El Paso and the City of Las Cruces has
allowed residents to benefit from employment opportunities in both areas.
A smaller percentage of workers work from home compared to state and national averages.
In the City of El Paso, recent congestion in the Interstate 10 Highway and U.S. Route 54 is a result of urban sprawling and
unprecedented growth. Recent, ongoing, and planned infrastructure investments have been made to address the issue. Despite
these challenges, residents of the urban WTEDD counties get to and from work faster than the state and national average.
Unfortunately, transitional workers and drivers crossing from Ciudad Juárez regularly are not captured as part of these datasets.
29You can also read