Housing Action Plan The Municipality of the District of Clare
←
→
Page content transcription
If your browser does not render page correctly, please read the page content below
1

The Municipality of the District of Clare
         Housing Action Plan

              Final Report
             March 31, 2021

                  Prepared by

                                THE MUNICIPALITY OF CLARE DISTRICT
                                        HOUSING ACTION PLAN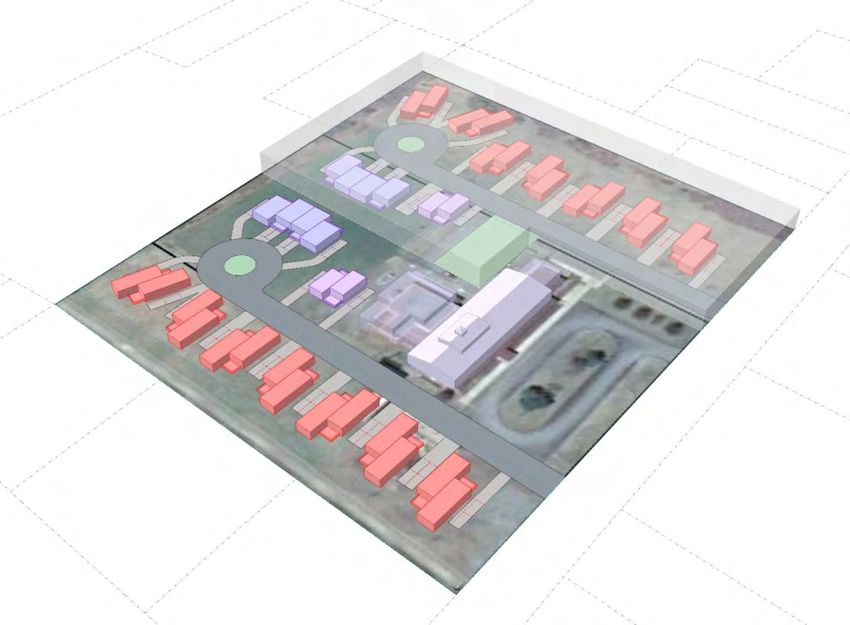
i

Acknowledgements
The Clare Housing Action Plan was undertaken on behalf of the Municipality of Clare
District.
We would like to thank Stéphane Cyr and Pam Doucet for their direction, input, and
assistance throughout the project. We would also like to thank the Standing Committee
as well as the key stakeholders who participated in our interviews and provided valuable
information and insights into housing need in the Municipality.

Project Team:                                    Consulting Team:
Stéphane Cyr, CAO                                The Clare Housing Action Plan was
Pam Doucet, Director of Community                prepared by SHS Consulting, WSP,
Development                                      and Architecture 49 Inc.

Standing Committee:                              The members of the consulting team
Ronnie LeBlanc, Warden                           for this project were:
Andre LeBlanc, Conseil de
développement économique de la                   SHS Consulting
Nouvelle-Écosse                                  Christine Pacini
Frank Anderson, Business owner                   Dalton Wudrich
Noel Depres, Business owner                      Shannon Holness
Gilles Theriault, Business owner                 Arfeen Qaiser
                                                 Atif Siddiqui
Organizations that participated in
Stakeholder Interviews:                          WSP Canada Inc.
Riverside Lobster                                Jared Dalziel
Comeau Sea Food Ltd.                             Anne Winters
AF Theriault & Son
Synergy Seafoods                                 Architecture 49 Inc.
JD Composites                                    Michael Christian
Université Sainte-Anne
Villa Acadienne
CAPENÉ

                                                        THE MUNICIPALITY OF CLARE DISTRICT
                                                                HOUSING ACTION PLAN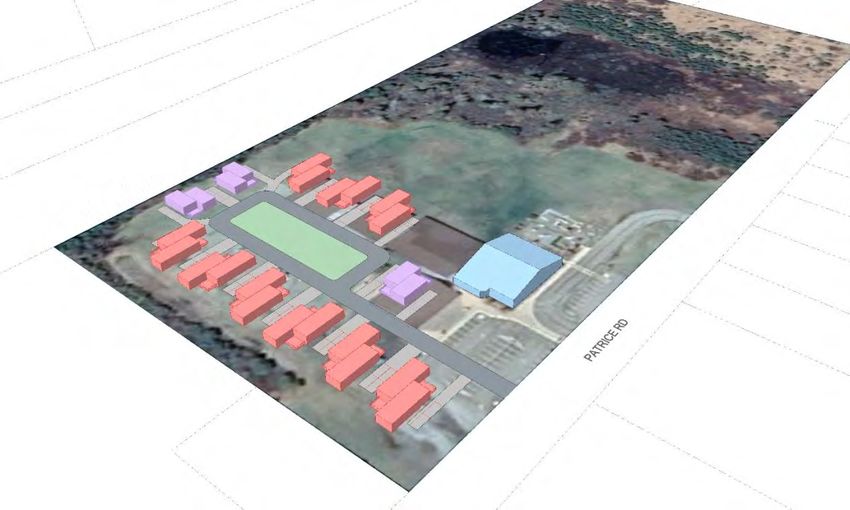
ii

Table of Contents

Executive Summary ........................................................................................................... 1

1.0      Introduction............................................................................................................. 3
         PURPOSE OF THE STUDY .................................................................................................................................. 3
         STUDY APPROACH............................................................................................................................................ 4
             Sources of Information .............................................................................................................................................. 5
             Study Area ................................................................................................................................................................... 5
             Report Format ............................................................................................................................................................. 6

2.0      Local Housing Needs and Issues........................................................................... 7
         POPULATION AND HOUSEHOLD TRENDS .......................................................................................................... 7
             Population Trends ...................................................................................................................................................... 7
             Population Age............................................................................................................................................................ 7
             Households by Type .................................................................................................................................................. 8
             Household Size ........................................................................................................................................................... 9
             Household Income ................................................................................................................................................... 10
             Occupations in Clare ............................................................................................................................................... 11
             Income by Occupation............................................................................................................................................. 13
         HOUSING AFFORDABILITY ............................................................................................................................... 14
             Housing Tenure ........................................................................................................................................................ 14
             Housing Stock and Supply...................................................................................................................................... 15
             Condition of Dwelling ............................................................................................................................................... 16
             Average House Price ............................................................................................................................................... 17
             Average Market Rent ............................................................................................................................................... 18
             Shelter to Income Ratio ........................................................................................................................................... 19
             Affordability by Sector ............................................................................................................................................. 20
         HOUSING GAPS .............................................................................................................................................. 21
             Gap 1: Overall lack of rental housing ................................................................................................................... 21
             Gap 2: Lack of Rental for lower-income single parents ...................................................................................... 22
             Gap 3: Aging stock and cost of operating aging housing................................................................................... 23
             Gap 4: Insufficient housing options for moderate income households ............................................................ 24
         WHAT WE HEARD: HOUSING RELATED ISSUES .............................................................................................. 25
             Additional daycare is a need in the community ................................................................................................... 25
             Transportation is an issue for some residents ..................................................................................................... 25
             Housing in proximity to employment opportunities is needed .......................................................................... 25
             Additional construction tradespeople may be needed ....................................................................................... 26

3.0      Approaches to Meeting Housing Needs .............................................................. 27
         RURAL HOUSING BEST PRACTICE .................................................................................................................. 27
         BEST PRACTICES FOR SURPLUS SCHOOL SITES ............................................................................................ 28
             Best Practice Examples ........................................................................................................................................... 28
             Potential Advantages and Concerns for School Reuse ...................................................................................... 31
         OPTIONS FOR REDUCING DEVELOPMENT COSTS ........................................................................................... 33

4.0      Examination of Potential Development Options ................................................. 36

                                                                                                                      THE MUNICIPALITY OF CLARE DISTRICT
                                                                                                                                       HOUSING ACTION PLAN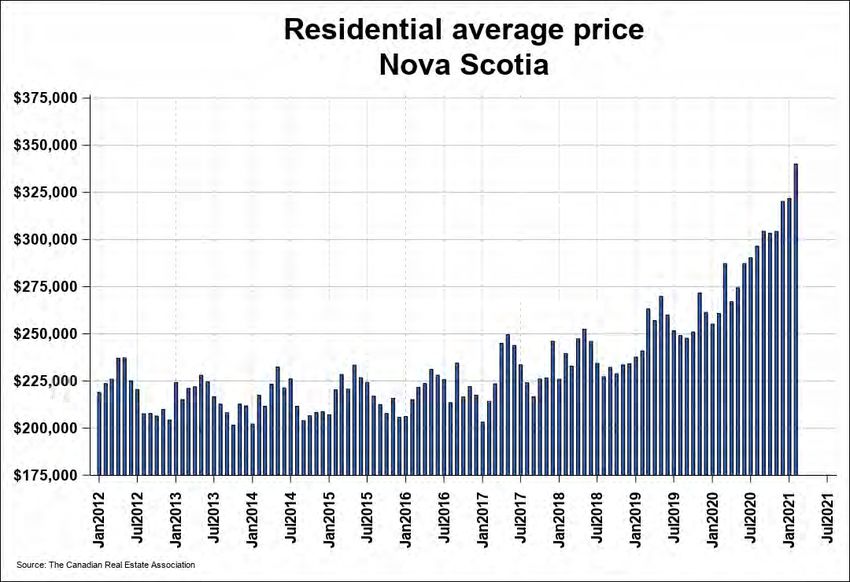
iii
APPROACHES TO DEVELOPMENT .................................................................................................................... 36
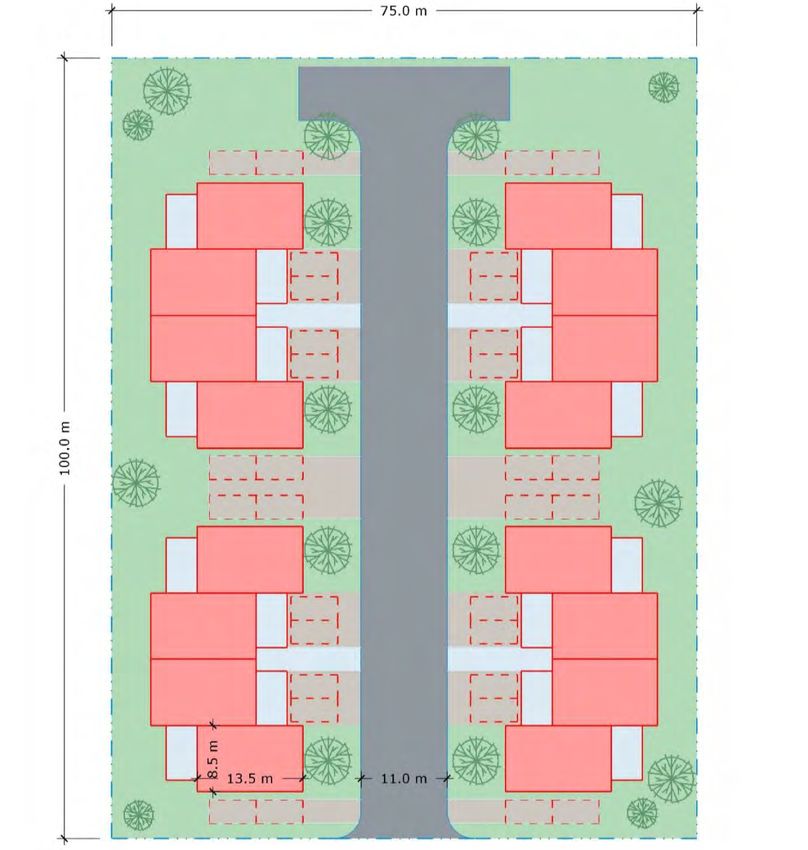
Overview of the Three Sites ................................................................................................................................... 39
Massing Concept Assumptions .............................................................................................................................. 40
École Joseph-Dugas Site ........................................................................................................................................ 40
École Stella-Maris Site ............................................................................................................................................. 43
Prototype Example Site ........................................................................................................................................... 46
PRO FORMA RESULTS .................................................................................................................................... 48
Financial Analysis Key Assumptions...................................................................................................................... 48
Conclusions and observations from the pro forma analysis .............................................................................. 50
5.0 Clare Housing Action Plan ................................................................................... 52
ACTION PLAN GOALS ..................................................................................................................................... 52
Goal 1: Increase the amount of rental housing of all types ................................................................................ 52
Goal 2: Increase the variety of affordable rental housing options ..................................................................... 52
Goal 3: Increase the amount of housing stock available to moderate income households .......................... 52
Goal 4: Increase the amount of total housing stock ............................................................................................ 53
Goal 5: Develop new housing on surplus municipal land ................................................................................... 53
Goal 6: Incorporate daycare spaces in new housing developments ................................................................ 53
RECOMMENDED ACTIONS ............................................................................................................................... 53
6.0 Roadmap to Site Development ............................................................................ 57
FEASIBILITY ..................................................................................................................................................... 57
DEVELOPMENT ................................................................................................................................................ 59
CONSTRUCTION .............................................................................................................................................. 61
OCCUPANCY ................................................................................................................................................... 62
Appendix A: Stakeholder Engagement ........................................................................... 63
STAKEHOLDER ENGAGEMENT ......................................................................................................................... 63
LINES OF INQUIRY ........................................................................................................................................... 63
References ....................................................................................................................... 66
THE MUNICIPALITY OF CLARE DISTRICT
HOUSING ACTION PLAN
1

Executive Summary
The Municipality of Clare District Housing Action Plan is one of the first municipal-level
and municipally-organized housing assessments and roadmaps completed in Nova
Scotia in recent decades.

The report is organized in five main sections:
   1. Introduction
   2. Local Housing Needs and Issues
   3. Approaches to Meeting Housing Needs
   4. Examination of Potential Development Options
   5. Clare Housing Action Plan and Roadmap to Implementation

The housing needs and issues assessment identified four key housing gaps:
       Housing Gap 1: Overall lack of rental housing
       Housing Gap 2: Lack of rental housing for lower-income single parents
       Housing Gap 3: Aging stock and cost of operating housing
       Housing Gap 4: Insufficient housing that is affordable to moderate incomes

Six goals and seven actions were identified in the action plan, to address these gaps:
       Goal 1: Increase the amount of rental housing of all types
       Goal 2: Increase the variety of affordable rental housing options
       Goal 3: Increase the amount of housing stock available to moderate income
       households
       Goal 4: Increase the total housing stock
       Goal 5: Develop new housing on available surplus municipal land
       Goal 6: Incorporate daycare spaces in new housing developments

Most of the actions are intended to address the objectives of multiple goals. The
implementation timelines vary from those that may be started immediately to others that
will require one to two years lead time before full implementation can begin. The
recommended actions are as follows:

                                                           THE MUNICIPALITY OF CLARE DISTRICT
                                                                    HOUSING ACTION PLAN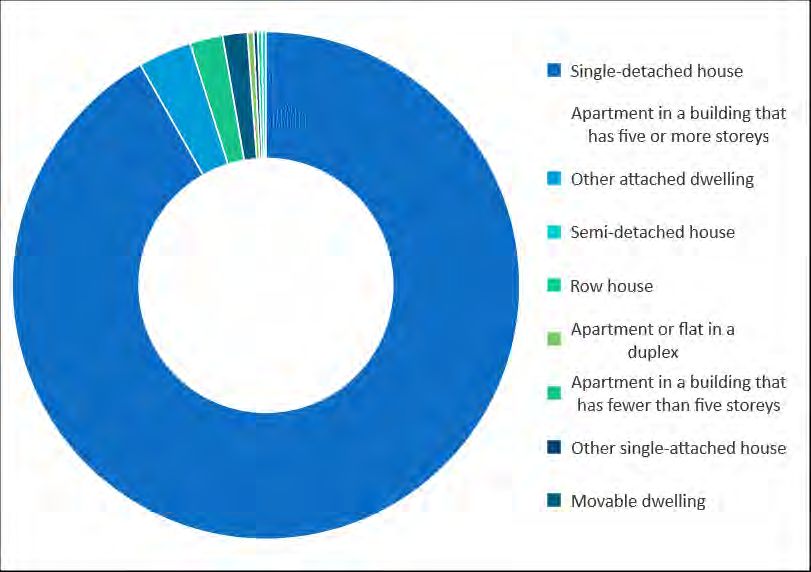
2
      Action 1: Provide surplus municipal land at minimal or no cost for housing
      Action 2: Use the surplus school sites for “workforce housing”
      Action 3: Work with other agencies and major employers to increase the number
      of daycare spots
      Action 4: Provide staff support for a housing development committee composed
      of major employers
      Action 5: Further investigate long term water and sewer servicing with required
      housing growth needs
      Action 6: Advocate for and work with the Province to identify opportunities to
      increase the variety of subsidized affordable housing options in Clare
      Action 7: Identify opportunities for the Municipality to leverage funding from
      other orders of government by contributing to affordable housing projects in
      Clare

The Roadmap to Implementation focuses on the redevelopment of two school sites that
will become surplus in the near future. The actions for the Municipality involve the
project development phases of:
       • Feasibility
       • Development
       • Construction
       • Occupancy

The development concepts and preliminary financial study in this report provides a solid
starting point to begin the formal process to build new affordable housing on these sites,
and the seven actions identified to address current housing gaps will increase the
attractiveness of Clare for new residents and encourage more people to stay in their
community.

                                                         THE MUNICIPALITY OF CLARE DISTRICT
                                                                 HOUSING ACTION PLAN
3

1.0 Introduction
Purpose of the Study
The Municipality of the District of Clare has a rich history with a resilient economy driven
in part by resource richness and a high attraction of natural beauty, prominent Acadian
culture, and an overall joie de vivre that is unlike most areas in Nova Scotia. Despite an
aging and slightly declining population over the past decades, the Municipality remains
economically stable with the fishery, forestry, and many other industries still evolving
and growing within the community. One of the primary issues facing the Municipality is
that the current housing does not meet the needs of the population.

Housing in the Municipality was largely developed organically, led by local builders
throughout the 19th and 20th centuries as different industries flourished along the coast
as well as inland. Due to the nature of housing development during this time, the
housing stock is predominantly older, single-family homes. The Municipality has seen
little recent housing growth, even as demographics shift and the economy continues to
evolve. Like many rural municipalities in Nova Scotia, Clare is experiencing gaps in the
supply, diversity, and availability of its housing stock.

Clare recognizes the challenges its communities have in housing stock and have taken
steps towards a housing action plan that addresses housing needs to support its
diversity of residents while also helping to support the local economy.

One of the great advantages of
Clare is that it rich in local culture,
traditional Acadian heritage, and
coastal and inland natural beauty.
These attributes draw residents to
both the small-town centres (like
Meteghan, Saulnierville, and
Comeauville) as well as to areas
that offer a far more rural lifestyle.
In this sense, Clare does offer a                        Clara Dennis Nova Scotia Archives 1981-541 no. 343

diversity of places to live and work, just not necessarily the appropriate housing-
types/stock in the appropriate locations.

                                                                    THE MUNICIPALITY OF CLARE DISTRICT
                                                                             HOUSING ACTION PLAN
4
The Municipality recognizes that housing is a challenge and has made a commitment to
work with local employers to find a solution that is uniquely suited to Clare and its
current and future residents. Broadly, the Municipality is in need of additional safe and
affordable housing options for its residents, be they seniors, young professionals, or
modest to low-income families. More specifically, local employers are calling on the
Municipality to partner with them on both short-term and long-term solutions, in order
forge a path forward in addressing the current housing shortage which is impeding the
private sector’s recruitment and retention efforts.

The opportunity to develop a Housing Action Plan is coming at the right time – amidst
Provincial and National shifts in employment, a global pandemic that has increased the
instances of tele-commuting and working remotely, and increased funding attention to
housing (e.g. the National Housing Strategy). Clare has identified the opportunity to get
ahead of the coming changes and build for the future. This is the perfect time to find
housing solutions that are forward-thinking, to build community resiliency, to work with
the community to understand the unique needs they have, and to form strong
partnerships with employers to meet those short- and long-term needs.

Study Approach
The approach to this project was to undertake desk research on housing demand and
supply, stakeholder consultations, best practice research on relevant approaches to
addressing identified housing needs, and an analysis of local residential construction
opportunities and challenges to create a housing action plan.

This housing action plan considers municipal policy options, land availability options,
innovative tenure and ownership models, dwelling type and unit mix needs, roles for key
stakeholders, and site design proposals for three locations that include development
cost estimates.

Supplementing the technical work performed by the consulting team, a Standing
Committee of local residents, business owners, municipal staff and a political
representative was formed to provide insight into local issues and rapid feedback on the
findings of the project team. See Appendix A for a list of stakeholder engagements and
key informants interviewed.

                                                          THE MUNICIPALITY OF CLARE DISTRICT
                                                                  HOUSING ACTION PLAN
5
Sources of Information
This study uses data and information from reliable and relevant sources, including:
census profile data from Statistics Canada, data from Canada Mortgage and Housing
Corporation’s Housing Information Portal, and the Commercial Public Distribution
Summary 2020 report from the Property Values Services Corporation (PVSC). In
addition, the approach to this study included a series of engagement activities to gain
information from employers, employees, residents, and key stakeholders.
Study Area
This study looks at the housing needs and opportunities in Clare, Nova Scotia.
Meteghan and Church Point are the primary communities examined as part of this
study.

Figure 1: Study Area Map: Clare, Nova Scotia

Source: ISD Digital Data, NS Geographic Data Directory, NSCAF 2020

                                                                     THE MUNICIPALITY OF CLARE DISTRICT
                                                                             HOUSING ACTION PLAN
6
Report Format
The report is organized in four main sections.

The first section of the report identifies the key local housing needs and issues by
incorporating readily available data from published sources, augmented by information
gathered through interviews with key stakeholders. From this information households
needs to be addressed in the action plan are identified.

The second section of the report examines a range of approaches to meeting the
identified needs, including:
   • A review approaches and models for the provision of affordable housing,
       including examining effective practices in the creation and operation of non-profit
       housing corporations
   • A review of municipal options to reduce development costs
   • An assessment of dwelling and unit mix requirements based on the results of the
       housing needs assessment
   • A review tenure and ownership models, including rent-to-own

The third section of the report identifies and explores potential development options
for the development of new affordable housing. The development options were
identified by the Municipality and are explored in more detail through the discussion of
concept designs for three sites, as well as pro forma costing. The potential roles of key
stakeholders are also discussed in this section of the report.

The final section of the report includes the recommended housing action plan for the
Municipality of Clare District.

                                                          THE MUNICIPALITY OF CLARE DISTRICT
                                                                  HOUSING ACTION PLAN
7
2.0 Local Housing Needs and
Issues
The first section of the report identifies the key local housing needs and issues by
incorporating readily available data from published sources, augmented by information
gathered through interviews with key stakeholders. From this information household
needs to be addressed in the action plan are identified.
Population and Household Trends
Population Trends
In 2016, the population of Clare, Nova Scotia was 8,018. This was down from 8,813 in
2006 representing a 9.0% decrease in population over a ten-year period.
Table 1: Population Trends and Projections: Clare
Population Growth, 2006-2016
Clare Municipal District
Year Population
2006 8,813
2011 8,319
2016 8,018
△ 2006-2016 9.0%
Source: Statistics Canada Community Profiles 2006 and 2016
Population Age
In 2016 a total of 35.8% of the people in Clare were older adults ages 45 to 64, while
17.8% were young adults aged 24 to 44. Seniors (65 years and older) made up 27.2%
and youth (ages 0-24) made up 19.1%.
From 2006 to 2016, the number of seniors in Clare grew from 19.9% of the population in
2006 to 27.2% of the population, as well as the number of older adults which grew from
31.7% in 2006 to 35.8% in 2016. Over the same period, the number of young adults had
a much slower growth rate as the population declined from 24.8% in 2006 to 17.8% in
2016. The population of youth declined by 26.0%. Similar to Clare, the Province of Nova
THE MUNICIPALITY OF CLARE DISTRICT
HOUSING ACTION PLAN8
Scotia also experienced a decline in its young adult population (11.3%) and youth
population (8.8%). The population of seniors grew by 33.0% in Nova Scotia. Unlike
Clare, the population of older adults in Nova Scotia declined slightly (0.9%).
While the population of older adults, young adults and youth in Clare declined over a
ten-year period, they still made up a significant proportion of the population. The decline
in the population of these age groups may be attributed to a lack of diverse housing
stock and affordable housing options. Other factors that have contributed to a decline in
younger, ultimately working age, populations in Nova Scotia include cutbacks in
government services that have resulted in fewer recreational, employment, and
educational resources for teenagers in rural communities1.
Figure 2: Population by Age: Clare, 2006 and 2016
Source: Statistics Canada Community Profiles 2006, 2016
Households by Type
In 2016, couples without children increased by 25.3% from 2006 and made up the
largest proportion of household types in Clare (39.5%), similar to the Province of Nova
Scotia (31.5%). One-person households made up the second largest proportion of
households (29.1%) and grew by 19.4%. In comparison, couples with children
1
My One Nova Scotia Municipalities (2021): https://www.myonensmunicipal.ca/immigration-demographics.html
THE MUNICIPALITY OF CLARE DISTRICT
HOUSING ACTION PLAN9
decreased from 27.1% to 18.4% (or by 32.0%) and lone parent households declined
from 9.1% to 7.4% (or by 17.9%) during the 10-year period from 2006 to 2016.
Figure 3: Household Type for Private Households: Clare, 2006 and 2016
Source: Statistics Canada Community Profile, 2006 and 2016
H o u s e h o l d S i ze
In 2016, one person households grew at a faster rate (18.8%) than other households in
Clare followed by two person households (11.4%). Four person households declined
significantly (34.3%) followed by households with five or more persons (23.3%) and
households with three persons. This trend was similar to Nova Scotia as households
with four or more persons decreased (12.4%) followed by households with 5 or more
persons (11.2%). Households with 3 or more persons declined as well but not at the
same rate (3.8%).
Households with two persons were the highest proportion of households (45.0%) in
Clare followed by one person households (29.1%) and three person households
(13.8%). While the trend of smaller households was similar in the province of Nova
Scotia, the proportions were substantially different. For example, two person households
made up the highest proportion of households (39.0%) followed by one person
households (29.5%) and household with three persons (11.2%).
The increase in smaller households indicates that there is a need for smaller sized
homes that can accommodate one person households and households with two or three
persons.
THE MUNICIPALITY OF CLARE DISTRICT
HOUSING ACTION PLAN10
Table 2: Household Size and Rate of Change: Clare, 2006 and 2016
Household Size for Occupied Private Dwellings
Clare Municipal District
△2006-
2006 2016
Household size 2016
# % # % %
1 person 905 24.5% 1,075 29.1% 18.8%
2 persons 1,490 40.3% 1,660 45.0% 11.4%
3 persons 655 17.7% 510 13.8% -22.1%
4 persons 495 13.4% 325 8.8% -34.3%
5 or more
150 4.1% 115 3.1% -23.3%
persons
Total -
3,695 100.0% 3,690 100% -0.1%
Household size
Source: Statistics Canada Community Profile, 2006 and 2016
Household Income
In 2015, the median income of households in Clare was $53,133 which is estimated to
grow to $57,038 (or by 7.3%) by 2021 based on the Consumer Price Index. In 2015, the
average income of households in Clare was $66,028 which is estimated to grow to
$70,881 in 2021. The median income of households in Clare grew by 28.2% from 2005-
2015. This is slightly similar to the Province of Nova Scotia where the median income of
households grew by 30.4% from 2005 to 2015.
Table 3: Average Income and Median Income for Private Households: Clare: 2005, 2015, 2021
(estimate)
Average Income and Median Income for Private Households
Clare Municipal District
2021
2005 2015 2005-2015 2015-2021
(Estimate)
Median
$41,450 $53,133 $57,038 28.2% 7.3%
Income
Average
$48,785 $66,028 $70,881 35.3% 7.3%
Income
Source: Statistics Canada Community Profiles 2006 and 2016 and SHS Calculations based on 7.35% rate of increase
in Consumer price index
In 2015, there were 7,045 people over the age of 15 in Clare. Approximately 55% of
people had incomes ranging from $10,000 to $39,999 making these incomes the most
prevalent amongst all income groups in 2015. In contrast, the Province of Nova Scotia
THE MUNICIPALITY OF CLARE DISTRICT
HOUSING ACTION PLAN11
had a higher proportion of working age individuals that earned less than $10,000 to
$39,999 than all other income groups (44.9%).
While individual incomes tend to be lower, most households in Clare (57.9%) are
couples (with or without children) meaning that a majority of households have dual
incomes. Dual income households are more likely to have incomes near the median and
average household incomes in Clare and less likely to have issues with housing
affordability. However, 7.4% of households were lone parent households and 19.4%
were one-person households – these households are more likely to have lower-incomes
and consequentially experience affordability challenges.
Occupations in Clare
The population of experienced labour in Clare decreased from 4,445 to 4,000 (10.0%)
from 2006 to 2016. The decline in the population of workers impacted a majority of
sectors such as sales and services (29.3%), business and finance occupations (14.9%),
natural resources and agriculture (13.2%), trades and transport (10.4%), management
occupations (7.3%), social services and education (2.3%) and manufacturing (2.4%). In
comparison, the province of Nova Scotia had an overall 1% decrease in its population of
experienced workers. Occupations such as natural resources and agriculture (-24.9%),
manufacturing (-20.2%) and business and finance (-15.0%) had the most significant
decline in workers during the same period.
THE MUNICIPALITY OF CLARE DISTRICT
HOUSING ACTION PLAN12
Figure 4: Total Labour Force population aged 15 years + by occupation: Clare, 2006 and 2016
Source: Statistics Canada Community Profile 2006 and 2016
The decline in the experienced labour force in Clare indicates that there is a need to fill
labour gaps and an overall demand for workers. The decline also coincides with the
overall decline in youth and young adult populations in Clare. Housing to accommodate
the workforce will be required to ensure that there is population retention. Major
employers identified an economic capacity to grow their workforce over the coming
years but feel limited by the lack of available housing, noting that it’s harder to retain
employees when they have to commute from communities where they were able to find
affordable and suitable housing.
Spotlight: Atlantic Immigration Pilot
The Atlantic Immigration Pilot (AIP) is a federal initiative that aims to address labour market challenges
in the Atlantic provinces which have experienced population declines that have impacted the labour
force. Eligible employers must be endorsed by the province through demonstrating that efforts to hire
locally have not been successful. Once an employer has been endorsed, they must recruit foreign
candidates and provide valid, full-time, non-seasonal job offers as well as provide an individualized
settlement plan that is co-signed with the foreign worker.
Key stakeholders identified the AIP as a significant recruitment opportunity that they will leverage to fill
shortages across the departments of their business. One of the significant aspects of the Pilot that
stakeholders noted was that candidates can become permanent residents through their participation in
this initiative, indicating a potential to retain employees that will be keen to bring their families to
Canada. This initiative is likely to repopulate the Atlantic provinces over time.
THE MUNICIPALITY OF CLARE DISTRICT
HOUSING ACTION PLAN13
Income by Occupation
Statistics Canada provides province-wide data of the total average and median income
of occupations. The following table provides a summary of the average and median
incomes of some key occupations in Clare, in 2021 dollars, projected from 2015 values
based on a 7.35% growth of the Consumer Price Index in Nova Scotia.
Table 4: Average Income by Occupation: Nova Scotia, 2016
Income by Occupation
Nova Scotia
Occupations / Average Average Median
Median Income
Income Source Income Income Income
2015 2020 2015 2020
Construction $54,953 $47,381 $50,863 $50,863
Retail Trade $44,251 $44,251 $50,713 $50,713
Manufacturing $57,817 $57,817 $50,713 $66,120
Agriculture; forestry;
$55,136 $55,136 $38,338 $51,323
fishing and hunting
Educational services $68,370 $68,370 $68,585 $68,585
Health care and social
$52,984 $52,984 $44,439 $44,439
assistance
Full-Time Minimum
$22,256 $26,104 – –
Wage
Part-Time Minimum –
Wage Earner
$16,135 $18,925 –
Source: Statistics Canada CANSIM, 2016
Key stakeholders provided a range of incomes that local businesses such as
manufacturing and trades offer their employees in 2021 which ranged from $14 to $17
per hour for entry-level staff to $20 to 22 for intermediate staff. These incomes are
similar to the province-wide averages reported by Statistics Canada for hourly wages by
occupation in 2020 (see table below).
THE MUNICIPALITY OF CLARE DISTRICT
HOUSING ACTION PLAN14
Table 5: Employee wages by occupation: Nova Scotia 2020
Wages by Occupation
Nova Scotia
Hourly Wage
Occupations
December
2020
Construction $28.17
Retail Trade $22.82
Manufacturing $22.38
Agriculture; forestry;
$21.13
fishing and hunting
Educational services $28.91
Health Occupations $29.58
Social Assistance $19.53
Source: Statistics Canada Table: 14-10-0306-01, 2020
Understanding the incomes by occupation is important because it can be used to help
understand housing demand; although it’s important to note that the total household
income (i.e. the income of all members of the household) is used for estimating
household affordability and targets.
Housing Affordability
Housing Tenure
In 2016, 3,210 households in Clare owned their homes, making up 86.9% of all
households. The number of owner households increased by 1.7% since 2006. This is
similar to the Province of Nova Scotia where owner households increased at a slightly
faster pace (1.8%). There were 480 renter households in Clare in 2016 representing
13.0% of all households in Clare and this number decreased by 11.1% from 2006, which
is a decline of 60 households.
In comparison, the Province of Nova Scotia experienced a 19.0% growth in renter
households from 2006 to 2016, growing faster than owner households which grew by
1.9% during the same period. Overall, in 2016 owner households made up a higher
proportion of households (68.7%) in Nova Scotia than renter households (30.7%).
THE MUNICIPALITY OF CLARE DISTRICT
HOUSING ACTION PLAN15
Figure 5: Private Households by Tenure, 2006 and 2016: Clare
Source: Statistics Canada Community Profile 2006-2016
The decline in the number of renter households suggests that there may be a need to
introduce a more diverse housing stock in Clare to better address the changing needs
of its population. While key stakeholders agree that there is a need for purpose-built
rental housing in Clare, it was also suggested that homeownership is more desirable
amongst the people who live in Clare.
Housing Stock and Supply
In 2016, there were approximately 3,690 dwellings in Clare. Most homes were
constructed in 1960 or before (38%) and from 1961 to 1990 (46%) while 14% of homes
were constructed from 1991 through 2010. One percent of all homes in Clare were
constructed from 2011 to 2016. This trend in development is similar to Nova Scotia
where a significant proportion of all homes were constructed before 1960 (28%) and
from 1961 to 1990 (43%). For Nova Scotia, 2011 through 2016 had the lowest
proportion of housing constructed in Nova Scotia (5%).
Single detached homes made up the highest proportion of housing types in Clare
(94.9%) but had a slow rate of growth from 2006 to 2016 (0.3%). Buildings that have
fewer than 5 stories made up the second largest proportion of housing types in Clare
(2.2%), however this was a 23.8% decrease from 2006. Cumulatively, semi-detached
homes, row houses and apartments in a duplex, other attached homes and moveable
dwellings represented 1.2% of the housing stock in Clare in 2016. Contrastingly in the
Province of Nova Scotia, the number of buildings that have five stories or more grew
significantly (41.5%) while single detached homes grew by a slower pace (3.8%).
THE MUNICIPALITY OF CLARE DISTRICT
HOUSING ACTION PLAN16
Figure 6: Occupied private dwellings by period of construction: Clare, 2016
Source: Statistics Canada Community Profile, 2016
In 2016 3.3% of all occupied dwellings in Clare were multi-unit type homes such as
apartments, townhouses and semi-detached units. Considering this in accordance with
data which shows that 13.8% of households in Clare were renters, it appears that rental
housing need in Clare is predominantly absorbed by the secondary market in semi-
detached and detached houses. This was confirmed by key stakeholders who shared
observations that there are multiple one-person households and small families per
house that are likely roommate situations, demonstrating a need for purpose-built rental
housing. Stakeholders agreed that the housing stock in Clare needs to be diversified in
order to meet the needs of local residents. It was commonly held that an appropriate
form of multi-unit housing would have up to ten units and be no greater than 5-storeys
high.
C o n d i t i o n o f D w e l l i ng
In 2016, 89.8% of homes in Clare required regular maintenance, a 0.3% decline from
2006. The percentage of homes that needed major repair grew slightly from 10.0% to
10.2% (or 1.4% overall). In contrast, the percentage of houses that required regular
maintenance grew by 7.5% from 2006 to 2016 in the Province of Nova Scotia while the
percentage of homes in need of major repair slightly declined (1.0%).
THE MUNICIPALITY OF CLARE DISTRICT
HOUSING ACTION PLAN17
Figure 7: Occupied Private Dwelling by Condition: Clare, 2016
Source: Statistics Canada Community Profile 2006 and 2016
While the proportion of homes that require major repairs grew slowly over time, key
stakeholders identified issues with heating their homes as a persistent issue for many
households, making homes inadequate. A 2018 housing needs assessment that looked
at housing needs in Shelburne, Yarmouth, Digby, Annapolis and Kings County found
that the cost to heat a home was $225 per month, on average. This cost impacts
affordability for low-income households in particular.
What we heard:
“The predominant form of housing in Clare is large, hard to heat houses. Low-
income households cannot afford to keep up with utilities.
~ Focus group participant ~
Average House Price
According to the Nova Scotia Association of Realtors, in 2020 the average cost for a
home in Nova Scotia was $291,244. This trend appears to be rising steeply recently. In
February 2021 Nova Scotia Association of Realtors2 reported that the average price of
homes sold in Nova Scotia rose by 30.4% to a record of $340,096, compared to the
same month in 2020.
2
Canadian Real estate Association (2021). https://creastats.crea.ca/board/nsar?fbclid=IwAR3XtGZakyyor15ow-
uZoME60AIGFgJ5lYdfueoxEV_le5OOuxLABptAcAA
THE MUNICIPALITY OF CLARE DISTRICT
HOUSING ACTION PLAN18
Figure 8: Average Residential Price, Nova Scotia
Source: Canadian Real Estate Association (2021)
Average Market Rent
The Commercial Public Distribution Summary 2020 report from the Property Values
Services Corporation (PVSC) included an overview of residential apartment sales by
region, county or town. While Clare was not included as an area of study, the balance of
apartment sales in Southern Nova Scotia was used for the purposes of this Housing
Action Plan and to provide a point of comparison for the Municipality of Clare to
reference. The PVSC report indicates that the cost of rental housing in Nova Scotia
fluctuates by the age of apartment buildings. As demonstrated in the table below,
apartments that are 60 years old typically being lower in cost than apartments that are
zero to nine or five to nine years old.
THE MUNICIPALITY OF CLARE DISTRICT
HOUSING ACTION PLAN19
Table 5: Apartment Market Parameters, Balance of South 2020
Apartment Market Parameters
Balance of South, Nova Scotia
Rent by Apartment Age Bachelor 1 Bedroom 2 Bedroom 3 Bedroom +
60 PLUS YEARS
$315 $385 $420 $455
(ALL YEARS UP TO 1959)
50 TO 59 YEARS
$360 $440 $480 $520
(1960 to 1969)
40 TO 49 YEARS
$405 $405 $540 $585
(1970 to 1979)
30 TO 39 YEARS
$450 $450 $600 $650
(1980 to 1989)
20 TO 29 YEARS
$495 $495 $660 $715
(1990 to 1999)
10 TO 19 YEARS
$563 $563 $750 $813
(2000'S)
0 TO 9 YEARS (2010'S) or 5
$765 $765 $1,020 $1,105
TO 9 YEARS (2010 - 2014)
Source: Property Valuation Services Corporation, 2020
For new housing development in Clare, it is likely that the average monthly rents will be
similar to rents listed for apartment buildings that are 0 to 9 years old.
Shelter to Income Ratio
CMHC regards unaffordable housing as spending 30% or more of its total before-tax
income to pay the median rent of local housing that is acceptable. In 2016, 11.1% of
households in Clare spent 30% or more of their income on shelter costs. Almost ninety
percent (88.9%) of households spent less than 30% of their income on housing costs. In
contrast, 21.6% of households throughout the Province of Nova Scotia spent 30% or
more of their income on housing and 78.4% did not.
Figure 9: Private dwellings by shelter-cost-to-income ratio: Clare, 2016
Source: Statistics Canada Community Profile, 2016
THE MUNICIPALITY OF CLARE DISTRICT
HOUSING ACTION PLAN20
Affordability by Sector
In the table below, the affordability threshold for occupations that are prevalent in Clare
have been identified. Overall, individuals earning $18,925 to $68,370 can afford a range
of rents and house prices without spending 30% or more on shelter. This would
translate in rents ranging from a low of $473 per month to a high of $1,709 per month
and maximum affordable house prices from a low of $185,211 to $241,991 in 2020.
Table 6: Average Income by Occupation, 2020 Projection
Affordable Housing by Occupation
Clare Municipal District
Affordable Rent
Average
(Average Affordable
Income Source Household
Household Ownership
Income 2020
Income) 2020
Construction $54,953 $1,373 $230,004
Retail Trade $44,251 $1,106 $185,211
Manufacturing $57,817 $1,445 $241,991
Agriculture;
forestry; fishing $55,136 $1,378 $231,992
and hunting
Educational
$68,370 $1,709 $289,754
services
Health care and
social $52,984 $1,324 $226,255
assistance
Full-time $26,104 $652.60 $93,151
Minimum Wage
Part-time $18,925 $473.14 $67,535
Minimum Wage
Source: Statistics Canada, 2016; SHS Calculations based on spending 30% or more of household income on housing
costs; and SHS calculations based on spending 30% of income on housing costs, 5% down payment, 25-year
mortgage, and 4.79% interest rate
THE MUNICIPALITY OF CLARE DISTRICT
HOUSING ACTION PLAN21
Housing Gaps
From the analysis of the Clare’s housing needs and issues, four housing gaps were
identified, along with three issues that affect housing and employment outcomes more
broadly.
Gap 1: Overall lack of rental housi ng
There is an overall lack of rental housing in the primary and secondary rental markets in
Clare. This limits housing options for students, new employees, immigrants and seniors.
“There is a lack of smaller, more affordable units.”
~ Focus group participant ~
“A secondary suite initiative will have value and merit even if just for the company
of having someone else in the home.”
~Key Informant~
13% of households in Clare were renters. Rental housing need in Clare is predominantly
absorbed by the secondary market in semi-detached and detached houses.
Figure 10: Household Tenure in Clare and Nova Scotia; 2016
Source: Statistics Canada Community Profiles 2016
In 2016 there were 250 households living in apartments, townhouses and semi-
detached units. Approximately 230 rental households lived in detached houses.
THE MUNICIPALITY OF CLARE DISTRICT
HOUSING ACTION PLAN22
Figure 11: Housing Built Form by Number of Households in Clare; 2016
Source: Statistics Canada Community Profiles 2016
Increasing the proportion of rental housing options in Clare will provide more
appropriate and affordable options for newcomers, students, young households and
seniors that want to downsize.
Gap 2: Lack of Rental for lower -income single parents
In addition to the overall low availability of rental housing options in Clare, there is a
pronounced challenge for lower-income single parents to find suitable housing for their
household. This specific need and supply issue was discovered through the stakeholder
interviews and focus group session.
What we heard:
“There are multiple one-person households and small families per house
(roommate situations).”
~ Focus group participant ~
“There reason we probably don’t see people sleeping outside is because
someone finally takes a family or individual in.”
~Key Informant~
THE MUNICIPALITY OF CLARE DISTRICT
HOUSING ACTION PLAN23
“Eligibility for community housing requires that a household have no dependents.
Lone parent households are not eligible. There are cases of single parents giving
up their children to foster care in order to access accommodation.”
~Key Informant~
Addressing this need includes ensuring that new affordable housing includes two- and
three-bedroom units, not only one-bedroom units. This also highlights that the need for
affordable or subsidized housing includes families with children, in addition to seniors
and one person households.
Gap 3: Aging stock and cost of operating aging housing
Roughly 68% of the housing stock in Clare is more than 40 years old while a smaller
proportion was built in the past 30 years (16.1%). The predominant form of housing in
Clare tends to be larger single-detached homes which stakeholders have described as
“hard to heat” in reference to the condition of dwellings as well as the cost of utilities.
As described earlier in this report, the cost to heat a home was $225 on average3. While
this cost impacts affordability for low-income households in particular, stakeholders
identified issues with heating their homes as a key issue for many households, making
the condition of a dwelling’s building envelope an important indicator of adequate
housing in Clare.
Figure 12: Occupied Private Dwelling by Period of Construction, 2006 and 2016
Source: Statistics Canada Community Profile, 2016
3
My One Nova Scotia Municipalities (2021): https://www.myonensmunicipal.ca/immigration-demographics.html
THE MUNICIPALITY OF CLARE DISTRICT
HOUSING ACTION PLAN24
Gap 4: Insufficient housing options for moderate income
households
Rental housing and homeownership are affordable for employed households. However,
there are very limited rental and ownership housing options for households with
moderate incomes. The figures below demonstrate that the affordable rent by
occupation is higher than the average rent in the region. This indicates that by adding
housing options that are diverse in tenure, a greater number of households will be
accommodated in the housing market.
Table 7: Affordable Housing by Income and Occupation, 2020
Clare Renter Affordability
Clare Municipal District
Balance of South Average Market Rents & Income
by Occupation 2020
2 3
Income Source Maximum
Bedroom Bedroom
Affordable
Apartment Apartment
Rent
$1,020 $1,105
Full Time Min.
$653 No No
Wage
Part Time Min.
$473 No No
Wage
Construction $1,475 Yes Yes
Retail $1,188 Yes Yes
Manufacturing $1,552 Yes Yes
Agriculture and
$1,480 Yes Yes
Forestry
Education $1,835 Yes Yes
Health care $1,422 Yes Yes
Source: Property Valuation Services Corporation, 2020 and SHS Calculations based on spending 30% or more of
household income on housing costs
THE MUNICIPALITY OF CLARE DISTRICT
HOUSING ACTION PLAN25
What We Heard: Housing Related Issues
To better understand the community of Clare, the project included six one-on-one
interviews with business and community leaders, a focus group session that brought
together a broad group of people for an open discussion, and bi-weekly meetings with a
committee of local residents, business owners, municipal staff, and a political
representative. These rich discussions provided insight into local issues and rapid
feedback on the ongoing findings of the project team.
From these discussions, four important issues arose that are related to housing, and
often must be addressed in parallel with actions on housing issues to get the full benefit
of any potential government investment in housing.
A d d i t i o n al d a y c a r e i s a n e e d i n t h e c o m m u n i t y
In all of the stakeholder meetings, the need for additional daycare was brought up by
participants. The stakeholders stressed that there are economic drivers for providing
daycare. They identified that insufficient daycare:
• Limits earning potential of two-parent families (successful foreign workers)
• Limits earning potential for single-parent families
Transportation is an issue for some residents
We heard that getting around Clare is reasonably easy for households that own a car.
However, transportation costs were mentioned as a challenge for living in Clare most
frequently by elderly and low income households.
Households need a car because Clare is rural. Transport du Clare becomes
costly when used daily.
~ Focus group participant ~
Housing in proximity to employment opportunities is needed
Another common theme in many stakeholder discussions was that there are a
substantial portion of the workforce that lives more than 30 minutes away and commute
to work. During these discussions we heard that the additional transportation costs both
in financial terms and time away from their family are deterrents to working in Clare.
THE MUNICIPALITY OF CLARE DISTRICT
HOUSING ACTION PLAN26
Most people desire to be able to walk to work. Trying to find housing close to part
time employment opportunities is a challenge and limits a lot of the population
that needs affordable housing.
~ Focus group participant ~
At least one employer is providing bussing service for employees to mitigate this
challenge. Having more housing located near major employers would reduce these
costs and improve the quality of life of Clare’s workforce.
A d d i t i o n al c o n s t r u c t i o n t r a d e s p e o p l e m a y b e n e e d e d
In discussions with the standing committee, a backlog in housing construction is
developing, with a one to two year wait list to have a new house built. The delay is
associated with insufficient construction trades to be able to build as fast as current
demand requires.
These four housing related issues are compounding the challenges for households to
live and work in Clare and are experienced across all incomes.
THE MUNICIPALITY OF CLARE DISTRICT
HOUSING ACTION PLAN27
3.0 Approaches to Meeting Housing
Needs
The second section of the report examines a range of approaches to meeting the
identified needs, including:
• Review approaches and models for the provision of affordable housing, including
examining effective practices in the creation and operation of non-profit housing
corporations
• Review of municipal options to reduce development costs
• Assess dwelling and unit mix requirements based on the results of the housing
needs assessment
• Review tenure and ownership models, including rent-to-own
Rural Housing Best Practice
The consulting team gathered best practices for rural housing from across the country,
looking for trends on how smaller communities successfully grow their stock or
affordable and market housing. Nine practices, across four themes, are highlighted in
this section.
Programming and Funding
• Stimulate a secondary rental market by providing funding to assist property
owners in constructing a new, or upgrading an existing, secondary suite4.
• Worker Housing: Housing restricted to people working (at least 20 hours/week) in
the community5.
Education and Awareness6
• Broaden community support and awareness of the housing needs in Clare,
including the need for affordable and market-rate rental housing.
4
Grant Funding for Secondary Suites, City of Edmonton: https://www.edmonton.ca/residential_neighbourhoods/grant-
funding.aspx
5
Whistler Housing Authority: https://whistlerhousing.ca/
6
Northumberland County Housing and Homelessness Plan 2019 – 2029: https://www.northumberland.ca/en/living-
here/resources/Documents/Northumberland-HH-Plan-2019-2029.pdf
THE MUNICIPALITY OF CLARE DISTRICT
HOUSING ACTION PLAN28
• Broaden community awareness of programs, funding, and incentives available to
support the development of affordable housing and rental housing.
Collaborations, Partnerships and Advocacy 7
• Develop partnerships between existing landlords and major employers to develop
a strategy for long-term and short-term rental housing in the community.
• Explore new partnerships between major employers and housing developers or
builders.
• Leverage partnerships among local employers and community agencies to
connect residents who are currently unemployed or under-employed to
employment opportunities.
Monitor Progress8
• Demonstrate the effectiveness of the plan and actions.
• Ensure that the actions are adjusted as the demographic and economic
characteristics of the community evolve.
Best Practices for Surplus School Sites
This research aimed to bring to perspective the possible outcomes for the current
school sites under consideration in the Municipality of Clare. The research centred on
both redevelopment and adaptive reuse with a focus on rural regions across Canada, as
well as, cost of construction, unit mix and target market. For most of these
developments, there was some sort of financial support through a mix of local,
provincial, and/or federal government. Each project below is unique and successful in its
respective domain.
Best Practice Examples
1. Martin Gran Place formerly Martin Gran School
The Martin Gran Place is located in the town of Meadow Lake, Saskatchewan,
which is home to approximately 5,000 residents (2016). The main industries in
the community include forestry, agriculture and tourism. This successful
conversion of a one-storey school to a residential complex for low-income
7
Northumberland County Housing and Homelessness Plan 2019 – 2029
8
Northumberland County Housing and Homelessness Plan 2019 – 2029
THE MUNICIPALITY OF CLARE DISTRICT
HOUSING ACTION PLAN29
families was completed in 2006. This 12 unit building sits on an 11,796 sq. ft site
and has a mix of 1, 2 and 3-bedrooms.
The renovation project was successful through a mix of CMHC and provincial
funding under the Residential Rehabilitation Assistance Program (RRAP) which
provided a forgivable loan of $216,000. The school building was donated by the
Town of Meadow Lake and the project's total cost amounted to $590,000.
2. Project: Allan’s Place formerly a school site in Cannington
Allan’s Place which was formerly the school site in Cannington is a prime
example of a school demolition and redevelopment. The 5-acre site rests on a
flood plain, with only 1-acre deemed developable. The project was recently
completed in 2020 and provides 50 1-bedroom units explicitly to seniors.
THE MUNICIPALITY OF CLARE DISTRICT
HOUSING ACTION PLAN30
The total 47,500 sq. ft project costed around $15 million with $10.5 being hard
costs. This 2-storey development has generous community/amenity space, and
this was something that the town itself was short on. The land price was highly
subsidized and bought by the housing provider for a sum of $100.
3. Project: Willow Lofts formerly Willow Street School
The Willow Lofts was a 2-storey school located in Truro, Nova Scotia which was
purchased and converted to a residential and commercial space by a private
developer. The property was purchased for $110,000 and retrofitted to
accommodate offices on the ground floor and 10 market residential units above.
The project was successfully completed in 2011 and includes a mix of 1 and 2-
bedrooms. All the residential suites can be accessed by a new elevator and the
layout has been designed to provide most suites with only one neighbour.
Although considered a more premium development, the Willow Lofts are a prime
example of the presence and success of the adaptive conversion in the private
development sector.
4. Project: Yarmouth Project formerly Yarmouth High School
The Yarmouth High School located on Parade Street in Halifax is to be turned
into a 54-unit mixed rental housing development, which will include 27 affordable
housing units. The development will get $650,000 from the province and will be
undertaken by the private sector. Provincial funds will go towards 27 affordable
housing units.
THE MUNICIPALITY OF CLARE DISTRICT
HOUSING ACTION PLANYou can also read