ASH DIEBACK: An Action Plan Toolkit for Scotland - The Tree Council
←
→
Page content transcription
If your browser does not render page correctly, please read the page content below
ASH
DIEBACK:
An Action Plan Toolkit for Scotland

                                      Ash ©Sam Village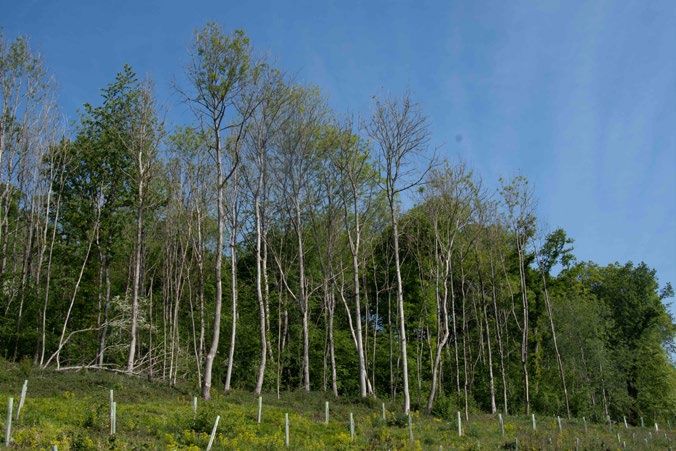
Ash dieback: an Action Plan Toolkit for Scotland

    CONTENTS
    1. PREFACE............................................................................................................................................................ 3
    Executive Summary.............................................................................................................................................................................................4
    Introduction..........................................................................................................................................................................................................6

    2. THE TOOLKIT
        PART 1 | Raising awareness ...................................................................................................................................................................11
        Step 1: Learning about ash dieback..............................................................................................................................................................12
        Step 2: Assessing the impact on your organisation....................................................................................................................................17
        Step 3: Making a case for an Ash Dieback Action Plan (ADAP)............................................................................................................23

        PART 2 | Preparing an Ash Dieback Action Plan .............................................................................................................................. 27
        Step 1: Compiling an assessment of ash trees and their health............................................................................................................... 28
        Step 2: Engaging colleagues with ash dieback and the need for a plan...................................................................................................37
        Step 3: Creating an Ash Dieback Action Plan.......................................................................................................................................... 38
        Step 4: Setting up an internal and/or external plan delivery group.........................................................................................................39
        Existing Ash Dieback Action Plans............................................................................................................................................................40

        PART 3 | How to take action and respond to ash dieback ..................................................................................................................41
        Action 1 – Developing a communications plan for internal and external audiences.............................................................................. 41
        Action 2 – Understanding biodiversity and ash loss................................................................................................................................. 42
        Action 3 – European Protected Species and ash dieback....................................................................................................................... 42
        Action 4 – Developing a common position for ash dieback and current legal practices...................................................................... 44
        Action 5 – Managing ash dieback in high-risk areas................................................................................................................................ 45
        Action 6 – Guidance on tree management............................................................................................................................................... 45
        Action 7 – Highway clearance.................................................................................................................................................................... 46

        PART 4 | Recovery and adaption ........................................................................................................................................................ 47
        Preparing and developing a tree strategy.................................................................................................................................................. 48
        Recovery strategy........................................................................................................................................................................................ 49

    3. CONCLUSIONS ............................................................................................................................................50

    4. ACKNOWLEDGEMENTS AND DISCLAIMER ...................................................................................... 53

    5. APPENDICES ................................................................................................................................................. 55

2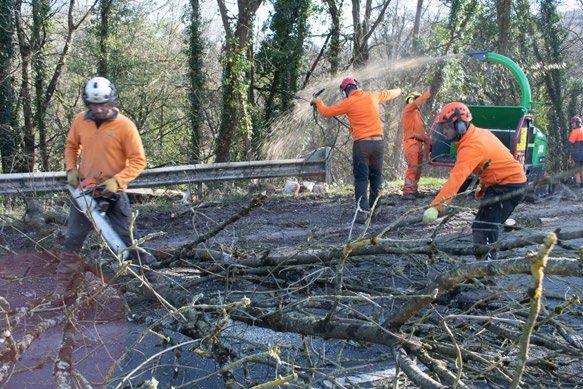
1
Section

Preface

Ash dieback: an Action Plan Toolkit for Scotland                         Section 1 | Preface

                  Executive Summary

    Ash dieback is the most significant tree disease to affect broadleaved trees
    in the UK since Dutch elm disease gained prominence in the 1960s. Unlike
    Dutch elm disease however, ash dieback is caused by a wind-borne fungus
    (Hymenoscyphus fraxineus, popularly referred to as ‘Chalara’ due to its
    previous taxonomic name) whose spores have a much greater dispersal rate
    than the beetles which carry the fungal spores responsible for Dutch elm
    disease, which leads to a more rapid spread around the country. Evidence
    from Europe suggests it will lead to the decline and death of 50%-75%
    of ash trees in Scotland over the next two decades and has the potential
    to infect more than 75 million ash trees (over 64 million saplings and
    seedlings and some 10.7 million mature trees) across the country.

    Dead and diseased ash trees can pose real risks to human safety,
    in addition to considerable economic and environmental impacts.
    Ash dieback will not be ‘business as usual’ for tree and landscape
    managers in Scotland. The focus must be on managing the safety
    and environmental impacts of the decline of ash trees, and initiating
    the recovery process through replanting with proxy tree species
    and the selection and breeding of resistant ash trees. However, this
    will come with challenges for biodiversity loss and reputation as
    residents and visitors notice long-term changes to landscapes.

    Scottish Forestry believes that we are now at a level of infection
    that means land managers must take action to identify and monitor
    infected trees and to manage them accordingly. Therefore, The Tree
    Council is assisting Scottish Forestry through the development of
    this Toolkit to support Scottish local authorities and other bodies to

4
Ash dieback: an Action Plan Toolkit for Scotland Section 1 | Preface
prepare Ash Dieback Action Plans
© Shutterstock – Peter Turner Photography
to respond to the inevitable
safety and environmental
issues that affected trees will
create. Estimates are that the
cost of managing the safety
aspects alone of the disease
across Scotland could cost
land managers collectively
anything from £4 million
to £20 million each year as
the disease progresses.
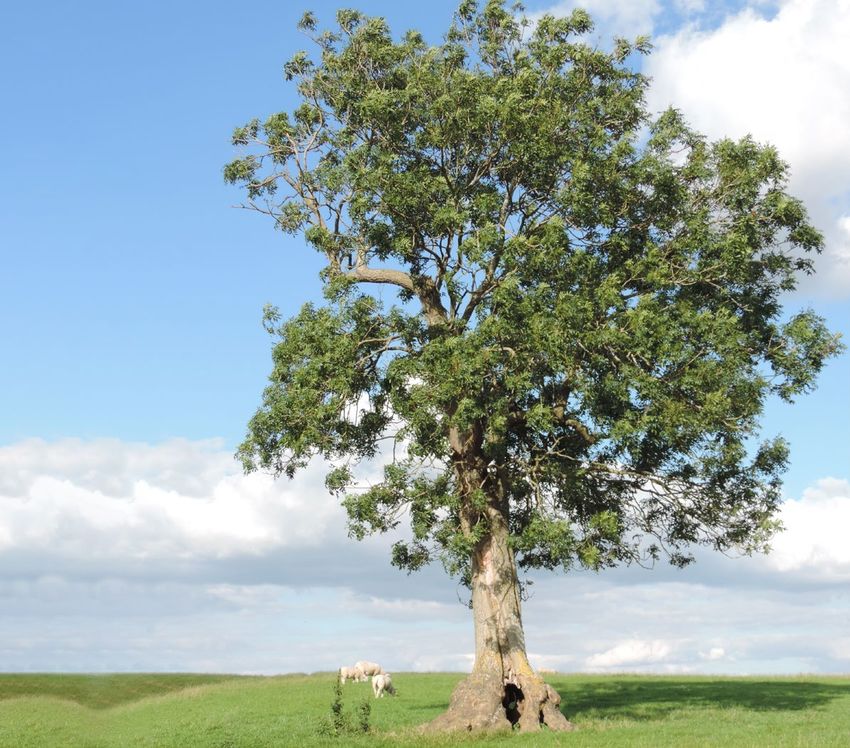
Ash is a common hedgerow tree
This step-by-step guide aims to:
• Increase understanding of the implications of ash dieback
• Provide a framework for preparing an Action Plan
• Work at a strategic level, but be adaptable to any scale
• Focus on the tactical issues that an organisation may face
• Encourage communication, collaboration and
active engagement with communities
The Toolkit contains resources and materials created by a number of
organisations at the forefront of dealing with ash dieback infection in
Scotland (but also drawing on and learning from experience in England).
It provides examples of the processes they have taken as they prepare
to manage the impacts of ash dieback on their land. They are mostly
‘works in progress’ and supplied with their generous agreement. It is not
designed to provide prescriptive answers to ash dieback management
but to help local authorities and others to shape their response locally.
Specific management guidance on, or prescriptions for, safe felling,
the logistics of road closures or how to run surveys is not included
in the Toolkit. Some additional supporting guidance is under
development through the Ash Dieback Risk Group (Scotland).
5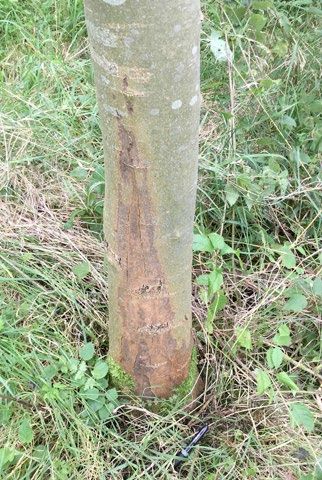
Ash dieback: an Action Plan Toolkit for Scotland                                   Section 1 | Preface

                  Introduction

    Ash dieback was first reported in England and Scotland in 2012 where it
    was found on newly planted imported trees. Tighter restrictions on the
    importing and movement of ash were quickly introduced across the UK.
    Scottish Forestry, with support from the Scottish Tree Health Advisory
    Group, worked on action plans to reduce the spread of the disease. By 2015
    it was clear that stopping the spread of, or eradicating, the disease was
    simply not going to be possible and by 2020 it was not only widespread but
    its impact on even mature trees was starting to become increasingly evident.

    Given that ash is present across some 150,000 hectares of broadleaved

                                                                                                             © Jon Stokes
    woodland in Scotland, with a further 1 million ash trees estimated
    to be growing in parks, gardens, along roadsides and in other urban
    areas, managing ash dieback will lead to a shift away from ‘business
    as usual’ towards new demands and pressures on resources.

    The focus must now be on managing the safety and
    environmental impacts of the decline and initiating the
    recovery process through replanting with proxy tree species
    and the selection and breeding of resistant ash trees.

    Since the arrival of ash dieback, The Tree Council has led widespread
    research into early responses and coping strategies of public
    landowners to this relatively new disease. Inevitable increases in
    potentially dangerous and dying ash trees will require management       Group of ash trees infected
                                                                            with ash dieback
    and, where necessary, removal for safety reasons. However, findings
    indicate that many local authorities and other bodies are not yet
    prepared for the scale of action that may be needed to deal with the

6
Ash dieback: an Action Plan Toolkit for Scotland                                Section 1 | Preface

    public safety issues arising from this tree disease. Ash trees currently
    provide many cultural, landscape and economic and ecological
    benefits, including increased land values and public well-being. Planned
    replanting of suitable alternative species will be needed to recover
    the important ecosystem service benefits of the removed ash trees.

    To help with planning a response to ash dieback across Scotland,
    Scottish Forestry, on behalf of the Scottish Government, formed the
    Ash Dieback Risk Group (Scotland) – the ‘ADRG’ - in January 2020. The
    main purpose of the Group is to advise the Scottish Government as it
    develops policy on ash dieback. For more details, see Appendix 1.

    WHY DEVELOPING A PLAN
    FOR ASH DIEBACK IS NECESSARY
    Ash dieback will lead to changes to Scotland’s landscape and
    tree populations as well as associated changes to biodiversity,
    landscape character and watercourses.

    The national cost of managing trees with ash dieback (which could include
    monitoring, pruning and, where necessary, felling) is difficult to calculate
    but it has been estimated that across the UK, and leaving aside the
    notional cost of the loss of ecosystem services, the cost is likely to exceed
    £15 billion across the UK in the next 10 years. As part of that, Scotland’s
    costs could, potentially, run to £180 million. To understand the specific
    local costs, during 2020 work was undertaken with a group of Scottish local
    authorities to develop estimates of the number of ash trees within their
    jurisdiction and hence the costs that could accrue to the authority. In West
    Lothian, for example, this could eventually require safety interventions
    affecting some 35,000 individual roadside trees (see Appendix 5).

7
Ash dieback: an Action Plan Toolkit for Scotland                                   Section 1 | Preface

    The potential scale of safety risks caused by ash dieback alone will
    mean that it will not be ‘business as usual’ for any organisation
    managing ash trees. Preparing an Ash Dieback Action Plan (‘ADAP’) will
    allow those responsible for managing ash trees to quantify the level of
    risk, the scale of remedial actions required and the costs involved.

    Ash tree failures, including branch shedding and instability, could translate
    into an increase in the number of incidents where people or property are
    harmed/damaged and hence a potential increase in insurance claims.
    The Health & Safety Executive has produced specific guidance on the
    management of the risk from falling trees or branches and organisations
    and others may therefore need to review and, where necessary, make
    changes to tree safety management regimes and practices.

    This Toolkit aims to:
    •   Increase understanding of the implications of ash dieback
    •   Provide a framework for preparing an ADAP
    •   Work at a strategic level, but be adaptable to any scale
    •   Focus around the tactical issues that an organisation may face
        but also incorporates the need to deal with the strategic impact
        of other tree diseases and pests on the wider treescape

    This Toolkit is a step-by-step guide to producing an effective Action Plan and
    contains resources and materials created by a number of agencies at the
    forefront of dealing with ash dieback infection in Scotland (but also drawing on
    experience from England where necessary). It provides examples of the processes
    they have taken as they prepare to manage the impacts of ash dieback on their
    land. These are mostly ‘works in progress’ and supplied with their generous
    agreement. We hope to receive feedback from others as they develop their own
    ADAPs. Through this process, ash dieback best practice will continue to develop.

    For an up-to-date list of all the resources referenced in this
    document, please visit The Tree Council website.

8
Ash dieback: an Action Plan Toolkit for Scotland                                              Section 1 | Preface

    The Toolkit is organised into the four key parts of a response to a tree disease

    These four parts are the basis of your Action Plan.

    •        Part 1: Raising awareness of ash dieback and the issues it may cause
             Raising awareness about ash dieback and the issues it may cause and realising that
             work needs to be undertaken to understand and deal with the challenges ahead.
    •        Part 2: Preparing the Action Plan
             Preparing and developing an ADAP to help manage the issues caused by ash dieback.
    •        Part 3: Taking action and responding to ash dieback
             Undertaking actions (e.g. pruning or, where necessary, felling trees) to remedy the problems
             faced due to ash dieback.
    •        Part 4: Recovering from ash dieback
             Landscape restoration in the wake of ash dieback, is an essential element of any emergency
             process. Figure 1 shows these four key parts of a response to a potential or current tree
             pest or disease. It is based upon the widely-used protocols of Emergency Planners.

                                   an
                                 Pl
                         ti on
                       Ac                              ning
                                                     an
                                                   Pl
                                                                                               Rec
                                                                                                  over
                                                               n
                                                ness

                                                              tio

                                                                                                       y
                                                              Ac
                                        Aw a r e

                                                                    KEY

                                                                    PHASE 1:
                                                                    Awareness

                                                                    PHASE 2:
                                                                    Planning
    EFFORT

                                                                    PHASE 3:
                                                                    Action

                                                                    PHASE 4:
                                                                    Recovery

              TIME
    Figure 1: Phases of a tree pest/disease response

9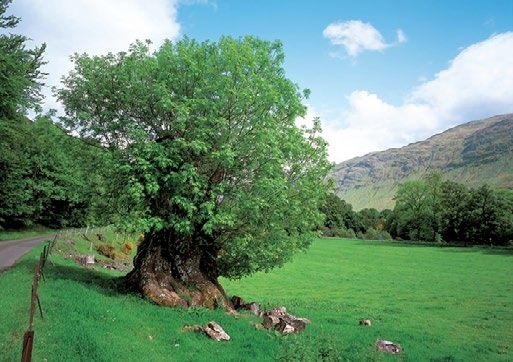
2
Section

The Toolkit
Ash dieback: an Action Plan Toolkit for Scotland                         Section 2 | The Toolkit

         2.         The Toolkit

     PART 1: RAISING AWARENESS
     To make the case for organisational time and resources to be
     spent on developing an Action Plan, it is necessary for each
     interested body to understand the potential impacts on its
     organisation or area.

     Based on the literature and actions of a number of local
     bodies a logical, consistent and robust response to ash
     dieback should be built on the following steps:

     •   Step 1: Learning about ash dieback and deciding if it presents a
         risk to an organisation and its practices/procedures, particularly
         in relation to public safety. This includes understanding
         the disease, how to identify it and where it is found.

     •   Step 2: Assessing the scale of the impact on the
         organisation (e.g. understanding how many ash trees
         you own or manage). This includes how to collect data
         and estimate the number of ash trees and the potential
         cost of dealing with the actual or predicted impacts.

     •   Step 3: Where necessary, making the case to managers/
         budget holders for an ADAP to be created to deal with the
         issues that will arise. This includes assessing corporate risk.

11
Ash dieback: an Action Plan Toolkit for Scotland Section 2 | The Toolkit
Step 1: Learning about ash dieback
© Jon Stokes
WHAT IS ASH DIEBACK?
Ash dieback, formerly known as ‘Chalara’, affects our native ash
and other Fraxinus species of trees and is caused by a fungal
pathogen. The fungus, Hymenoscyphus fraxineus (formerly
Chalara fraxinea), arrived from Asia to Europe during the 1990s
and spread rapidly across the continent. Although the first
official record in Britain was in 20121, evidence now suggests
it had arrived here and was infecting trees in 2004.
This invasive fungus causes a range of symptoms from foliar leaf
spots, to branch dieback, to the death of Fraxinus excelsior (ash) trees
and affects our native ash and other ash species. Once infected, the Ash leaves wilting due to ash dieback
majority of trees are eventually expected to die. A few ash trees may
© Jon Stokes
survive the infection because of genetic factors which give them
resistance to or tolerance of the disease. Evidence from Europe
suggests that around 10% of trees were found to be moderately
tolerant to the disease, with 1-2% having high levels of tolerance. The
environment also has a role in how trees decline from ash dieback, with
trees growing outside of optimal conditions declining more quickly.
However, in some situations, such as urban areas, where trees tend
to experience greater stress but where perhaps the level of inoculum
(fungal spores of H. fraxineus) is lower than in ash woodlands, the
percentage of ash that are likely to be tolerant to the fungus is not yet
well understood. In natural woodlands, evidence from across Europe
published in December 2018 suggests that 50%-75% of ash trees are
likely to die within a period of 30 years from the arrival of the disease,
although mortality in plantations is expected to be nearer to 100%. A roadside ash in Ash Health Class 4
However, experience in Denmark highlights the message “Don’t
panic: focus on finding the truly hazardous trees” and that trees
showing only slight or moderate symptoms should be considered
as potential survivors for many years to come and their condition
Wylder et al., 2018 Evidence from mortality dating of Fraxinus excelsior indicates ash dieback
12
1
was active in England 2004-2005. Forestry: ICF April 2018.Ash dieback: an Action Plan Toolkit for Scotland Section 2 | The Toolkit
monitored accordingly. Effort is best directed at monitoring
Image © Rob Wolton
the health of ash trees and focusing on those trees with severe
symptoms, including root and stem decay, in higher risk locations.
The precise speed of decline of any individual tree is currently
impossible to predict and will be influenced by other
factors including soil type, soil moisture levels, topography
and levels of inoculum in the surrounding area.
As one example, the photographs in Figure 2 show the change
in one tree over one season (photographs taken 06/07/16 and
07/07/17). The pictures show a 10%-15% decline in the canopy in
a single season, and anecdotal reports from areas of Great Britain
currently infected by ash dieback support this as a typical rate
of decline. However, some individual trees (depending on their
health and condition) can decline much more rapidly and will
Image © Jon Stokes
need to be monitored. Some mature ash trees with ash dieback
can decline more rapidly if other pathogens like honey fungus
(Armillaria) or shaggy bracket (Inonotus hispidus) are also present.
Recent research from Switzerland may start to explain the speed of
decline of some larger and slower growing trees. The Swiss research
shows slower-growing trees or trees with smaller crowns before the
arrival of the fungus were more susceptible to dieback and mortality.
Defoliation directly reduced growth as well as earlywood vessel size
which caused a positive feedback loop, amplifying and accelerating
crown dieback by reducing water and sugar flow around the tree.
Infection mostly occurs through fungal spores landing on
Figure 2: Change in one tree
leaves, but infection can also occur at the base of trunks (the in Devon over one season
root collar), probably entering the tree through lenticels.
13Ash dieback: an Action Plan Toolkit for Scotland Section 2 | The Toolkit
The wind-borne spores are produced from fruiting bodies
© Jon Stokes
(very small white mushrooms) on the central stem (the
rachis) of last year’s fallen ash leaves (see Figure 3).
As it grows, the fungus destroys the infected tree’s phloem and
xylem, which results in the tree being unable to move water and
nutrients around its structure. This will cause the branches of the
tree to fail and the tree ‘dies back’, hence the name. Repeated
loss of nutrients and water, the depletion of energy reserves
because of the lack of leaves, and particularly if a secondary
pathogen takes hold (e.g. honey fungus), causes the tree to become
brittle, lose branches and eventually succumb to the disease.
Where basal lesions are observed (see Figure 4) these can develop
Figure 3: Fruiting bodies on the
into a butt or root rot and the affected trees can become unstable
central stem of last year’s leaf
and dangerous. The rot is usually associated with other secondary
pathogens such as honey fungus, shaggy bracket or Ganoderma
sp. and can occur without any obvious dieback symptoms in the
© Jo Clark: Future Trees Trust
canopy. This makes identifying hazardous ash trees considerably
harder. If a tree is suffering with basal lesions and associated root/
butt rots, bark beetles can become established as the tree declines.
Basal lesions have been seen extensively across Europe and seem to
be associated with areas of dense ash populations, and therefore spore
load, where infection has been present for a long time. In particular,
wet woodlands seem to be at highest risk from this form of infection
in Europe, but further evidence is needed to assess the UK context.
Early identification of basal lesions can be difficult. Those conducting
surveys or inspections should look for discrete lesions forming a
triangle at the base of the tree. These can become bigger and more
Figure 4: Basal lesions on ash trees
advanced as the infection progresses. As our understanding of this
issue improves, guidance may change, but currently it seems prudent
that any detailed inspections of ash trees should check for basal lesions.
14Ash dieback: an Action Plan Toolkit for Scotland Section 2 | The Toolkit
HOW TO IDENTIFY ASH DIEBACK
It is important to be able to recognise the visual
symptoms of ash dieback. To help with identification,
there are a variety of online resources available.
Examples include:
The Forestry Field Identification Guide
The Observatree Chalara in the UK
A photo ID guide to symptoms in larger trees The Tree
Commission Chalara ash dieback
ash dieback These pictures were taken by The Tree Council during 2014 in Suffolk and East Kent.
We have annotated them to show various stages of the disease in larger trees.
Photographs - Copyright The Tree Council www.treecouncil.org.uk
Council guide
dieback identification to symptoms
identification guide in larger trees
advice
!
!
Funded by the EU’s
LIFE programme
The disease can affect ash trees of all shapes and size. While the
symptoms are easily visible in young trees, they are often harder
to recognise in more mature trees (see Box 7 on page 32).
There are now also sources of information to show symptoms in
a more interactive way including work undertaken by the James
Hutton Institute who have developed a Virtual Reality model to
present information about the symptoms and different stages
and spread of infection of Chalara ash dieback on woodlands.
The model was designed to represent characteristics of the
vegetation and topography of a site in north-west Scotland.
Interactive functions have been included which enable the
presentation of a narrative about the Chalara ash dieback threat to
woodlands, including scenarios of spread of infection, symptoms of
infection, the death of trees, and the regeneration of woodland.
The model can be downloaded and used in a PC or
virtual reality environment. Guidelines are provided,
and links to the relevant software for its use.
15Ash dieback: an Action Plan Toolkit for Scotland Section 2 | The Toolkit
WHERE IS ASH DIEBACK FOUND?
© Jon Stokes
Ash dieback was first recorded at a nursery in Buckinghamshire
in February 2012. This was followed by the identification of the
infection of new planting in a car park in Leicestershire in May, and
subsequently on young trees in Ashwellthorpe Woods in Norfolk in
the autumn of the same year. In Scotland it was also first found in
2012 on newly planted woodland near Kilmacolm, west of Glasgow.
The fungus is now likely to be present over far more of the UK
than has been officially reported, as the symptoms can be difficult
to detect, especially in large trees. Just because an area of the UK
may not currently be shown on the maps to have ash dieback, it
does not mean it is not there. If you suspect ash dieback in what
is currently showing as a ‘blank’ 10km grid square (see next
Dying ash tree at Ashwellthorpe
paragraph), then this should be reported through Tree Alert.
Wood, Norfolk
In Scotland, by May 2020 ash dieback had been recorded in 21.4%
of all 10 by 10 grid squares (see the data) but it is recognised
that the disease is, or very soon will be, present virtually
wherever ash occurs. You can see an interactive distribution
map of ash dieback here courtesy of Fera Science Ltd.
The official maps only show the presence or absence of the
fungus and not the levels of infection in that area. In addition,
significantly different rates of dieback and levels of mortality have
been recorded across the UK. This may be due to variances in site
conditions, as well as in the genetic heritage of ash trees in different
parts of the country. Therefore, land managers should monitor
the location and spread of the disease on the land they manage
(see page 20 ‘Collecting local ash tree data’), to understand the
levels of infection found there and how that changes over time.
16Ash dieback: an Action Plan Toolkit for Scotland Section 2 | The Toolkit
Step 2: Assessing the impact on your organisation
HOW MANY ASH TREES ARE YOU RESPONSIBLE FOR?
To understand the scale of the potential impact of ash dieback on
you or your organisation, it is necessary to gather all available data to
estimate how many ash trees are in your area of responsibility.
It has been estimated that there are
© Jon Stokes
more than two billion ash trees in the
UK, a figure that includes all trees from
seedlings through to mature trees. Of
these, 125.9 million are trees located in
woods and another 27.2–60 million trees
using the same definition are situated
outside woodlands. (The Forestry
Commission’s definition of a ‘tree’ -
(see page 10 of the document) is one
having a stem greater than 4cm diameter
at 1.3 metres above the ground). Gathering data on roadside ash is especially important
A report by Dr Rick Worrell on behalf of the then Forestry Commission Scotland and
published in 2013 shows that there are approximately 13,500 ha (total) of ash woodland
in Scotland, although ash is a component of some 150,000 ha of native woodland.
The Native Woodlands Survey Scotland (NWSS) showed: ash makes up 4.2% of
upper canopy cover in native woodlands; upland mixed ashwood priority habitat
(where ash is 25% of upper canopy) covers 12,353 ha; and lowland mixed deciduous
woodland priority habitat (where ash is 16% of the upper canopy) covers 23,189 ha.
This represents approximately 10.7 million large ash trees in Scotland, and an estimated
53 million seedlings (18% of all broadleaved seedlings), and 11 million saplings (5%
of all broadleaved saplings). Ash is Scotland’s sixth most abundant broadleaved
tree species (after birch, oak, sycamore, alder and beech); and Scotland’s fifth
most abundant native tree species (after Scots pine, birch, alder and oak).
17Ash dieback: an Action Plan Toolkit for Scotland Section 2 | The Toolkit
In the wider environment:
• There were approx. 970,000 individual ash trees outside woodland (in 1995) in
Scotland. i.e. in hedges, small groups of trees, windbreaks, wood pasture, etc.
• Ash trees also make up 17% of the veteran tree resource in UK and the Ancient Tree Forum have
recorded 300 veteran ash trees in Scotland, though this represents only a small proportion of the total
population. Two of the more nationally notable trees include the Glen Lyon ash and the Tinnis ash.
These ash tree numbers simply provide national context and cannot give a picture of the local situation.
The specific impact of ash dieback will depend upon the number and distribution of ash in any given area.
BOX 1 The Glen Lyon ash
© Edward Parker
One of the largest and oldest examples
of native ash (Fraxinus excelsior) resides
in Perthshire’s beautiful Glen Lyon. The
moss-covered trunk has an exceptional
girth measuring 6.4 metres (21 feet), the
largest so far recorded for this species in
Scotland. Once reaching 30 metres (98 feet)
in height, the crown has been heavily cut
back to a stump of some 4 metres (13 feet). Glen Lyon Ash
The tree appears to have been pollarded at various times throughout its life. This ancient form of
tree management involves cutting the top off the tree to stimulate the production of numerous
straight shoots. These are harvested periodically to provide a sustainable source of timber and
animal fodder. Pollarding is usually carried out 2 to 4 metres (6.5 to 13 feet) above ground level so
that the young growth is out of the reach of grazing animals. Although pollarding can look rather
severe when newly carried out, it can be an effective method for securing the future of veteran trees.
It is possible that this veteran may be between 300 and 400 years old. This is exceptional for ash,
which is not known as a long-lived species. Under normal circumstances in Scotland, ash trees
can be expected to attain a maximum age of 200 to 250 years before decay and decline set in.
18Ash dieback: an Action Plan Toolkit for Scotland Section 2 | The Toolkit
Worrell (2013) produced a table from the ‘The
Native Woodland Survey of Scotland’ which
gives data by council area for the areas of
UK Habitat Action Plan woodland types (see
Appendix 2). “Mixed Upland Ash” and “Lowland
Mixed Deciduous” are those known to contain
Ash Coverage
most ash (though “Wet Woodland” can also
contain a small proportion). This data illustrates
how ash is concentrated in Ayrshire, around Low Density
Glasgow, the Lothians and the Central Belt. Medium Density
(Note: the table ranks council areas by total
High Density
area of these two woodland types combined).
The percentage of ash in the canopy of native
woodland in these council areas is generally
N
between 10 and 25%. These figures will be
important for local council environment
departments, especially in relation to the health
and safety implications of damaged trees.
NERC − Centre for Ecology & Hydrology. All rights reserved.
A further set of data was produced by the Countryside Survey Database Right/Copyright
Centre for Ecology and Hydrology (CEH) in
2012, using the Countryside Survey Dataset to
Figure 5: Ash coverage map
produce a map (Figure 5) showing the density
of ash around the UK. For further details of
this work see this update from CEH, and the full report.
To understand the local impact of ash dieback, an assessment
of the ash population and its distribution is required. To
achieve this, landowners and organisations need to collate
all locally available information on ash and also potentially
undertake some specific local ash tree data gathering.
19Ash dieback: an Action Plan Toolkit for Scotland Section 2 | The Toolkit
COLLECTING LOCAL ASH TREE DATA
The best starting point is to assemble all the existing local ash data from as many sources as possible, such as
the Native Woodland Survey of Scotland, Forestry Commission’s National Inventory of Woodland and Trees,
local authority Tree Preservation Orders or Public Realm Tree Surveys, Ancient Tree Hunt data or records
from the local Biodiversity Record Centre. In autumn 2020, Edinburgh Council reviewed all known ash data
for the city. In particular, they assessed those ash trees adjacent to the road or on council-owned land which
could cause a safety issue if they died or fell on to the road or a public space - see Box 2 for their review.
BOX 2 Edinburgh Council ash data
A review of the known data on ash in Edinburgh was undertaken by City of Edinburgh
Council Tree & Woodland Officers in the autumn of 2020. This showed that:
• An iTree survey was undertaken in Edinburgh in 2013 which estimated a total of 712,000
trees in the city, of which 6% are ash – that’s 42,720 ash trees. The survey also estimated
that 75% of city trees are in private ownership and 25% are owned by the Council. This
suggests 10,680 ash trees within Council ownership and 32,040 on private land.
• There are currently 4,160 individual ash trees recorded on Edinburgh’s tree
management software, however, this data is not complete, with additional
survey work planned for the remaining non-recorded trees.
• In addition, there are many young woodlands on Council sites
which contain around 27,000 young ash trees.
• Ash is a very prolific species and tends to self-seed widely. They are present in every type of
site managed by the Council, including parks, cemeteries, woodlands, schools, care facilities,
Council depots, Council housing gardens, cycle paths, walkways and roadside verges.
• It is a species with a very large mature size – although 6% of the total number of trees
may be ash, it is likely to represent greater than 6% of the total canopy cover.
• Edinburgh’s greenspaces contain a number of specimen ash cultivars, such as the
weeping ash and the single-leaved ash. These are also susceptible to ash dieback,
especially the weeping ash which is extremely vulnerable to the disease.
Following a meeting with a representative of the Tree Council in October 2020, the
City of Edinburgh Council started the process of formulating their Ash Dieback Action
Plan. Officers were able to use existing iTree survey data to estimate ash population
within the city. This estimate was then used to develop a plan to survey and manage
the ash trees. Budget planning is still ongoing as of March 2021, but early estimates
suggest additional budget requirements to manage ash dieback in Edinburgh.
20Ash dieback: an Action Plan Toolkit for Scotland Section 2 | The Toolkit
POTENTIAL COSTS OF ASH DIEBACK
Once there is an estimate of the number of ash trees in an area the next step
is to calculate the potential budgetary costs to the organisation. Scenario
planning can aid this process – for example, asking questions like:
– What would be the impact on expenditure and risk if 60%/75%/90% of ash trees
in the area are in decline/dead because of ash dieback in the next 5–10 years?
– What resources are required if a high number become dangerous in a single season?
When estimating the resources required you should ensure that your costings cover:
• Additional survey work; extra staff and consultant time
• Additional practical tree management costs e.g.
pruning or felling dangerous trees
• Additional staff time to work with other landowners
to ensure removal of dangerous trees
• Staff time to deal with increased public reaction e.g. requests to fell
• Staff time to deal with requests to fell ash trees that have
e.g. TPOs or those containing Protected Species
• Additional costs of any replacement planting that may be undertaken
• Additional communications and consultation needed to
explain ash dieback to relevant stakeholders
Not all of these will be appropriate in all circumstances. Once numbers of trees
have been established, it then becomes possible to begin to estimate the costs
of ash dieback. For example, Dr Rick Worrell’s report in 2013 made an estimate
of costs to Scotland of dealing with urban ash trees. It concluded that “Public
agencies and councils with land holdings along roads and other infrastructure would
face the highest costs. In the eventuality of all the urban ash trees in Scotland needing
to be removed… the total cost of removal might be in the order of £180 million”.
To develop this data further, during 2020 work was undertaken with a sample of
Scottish local authorities and Forestry & Land Scotland to estimate their local costs
of ash dieback. The first estimates of one local authority can be seen in Box 3.
21Ash dieback: an Action Plan Toolkit for Scotland Section 2 | The Toolkit
BOX 3 Assessment of budget implications for a Scottish Local Authority
Basic statistics:
7,439 855 6,584 7,119 11,704
Overall estimated Estimated number Estimated number of Estimated Estimated number of
number of ash of ash trees in ash trees in private number of ash recorded woodland
trees on verges of Council ownership ownership and within trees in Green ash trees adjacent to
A, B, C and U roads (Roads) and within falling distance of the Infrastructure public areas
falling distance of road adjacent public
the road
areas
89% of the recorded ash trees are 6 metres plus in size
(the size that requires work to be undertaken to remove safety risks)
Cost implications of removal:
Assumption: 75% mortality rate with£354 average cost of removal (excluding inspection)
Council ownership (Roads) of 855 trees
x75% mortality rate @ £354 each = £227,002
Private ownership of 6,584 trees
x75% mortality rate @ £354 each = £1,748,052
Green infrastructure with 7,119 trees
x75% mortality rate @ £354 each = £1,890,094
Woodlands with 11,704 trees adjacent public
areas x75% mortality rate @ £354 each = £3,107,412
Tree planting to address loss:
Based on a Free Tree Scheme for 20,337 trees lost on local
authority owned land and adjacent to the road @ £15 per tree = £305,066
Total potential costs = £7,277,626
Total potential costs are calculated at 75% mortality. However, an increase
in mortality (by 10% to 85%) would equate to an additional cost of £552k.
22Ash dieback: an Action Plan Toolkit for Scotland Section 2 | The Toolkit
Once the first estimates of ash trees numbers and the potential costs that
come with ash dieback have been collated, the information can then form,
if required, the basis for making an organisational case for an ADAP.
Step 3: Making a case for an Ash Dieback Action Plan (ADAP)
To make the case for an ADAP, it’s important to consider not only the potential
practical costs that may occur for the organisation (see Step 2 above), but also
whether ash dieback needs to be entered on an organisation’s corporate
risk register. Reviewing both together allows a determination of whether ash
dieback presents a significant risk to the organisation and its operations.
CORPORATE RISK
In our discussions with local authorities and other agencies, the potential
impacts of dying and dangerous trees as a result of ash dieback have always
been accepted as posing a significant corporate risk. Creating an Action Plan
to manage these risks has been recognised as the clearest way to ensure an
organisation can effectively combat ash dieback and the problems it brings.
© Jon Stokes
It is important to not only plan for the removal of dying ash trees but also for their replacement
23Ash dieback: an Action Plan Toolkit for Scotland Section 2 | The Toolkit
The following are examples of how ash dieback may impact a corporate risk assessment,
but they are also highly relevant to others who are contemplating the need for an ADAP:
SAFETY IMPACTS • Risks to Protected Species/ • Increasing prices as a result
sites through alteration of market competition for
• Potential for death or injury
of habitat structure, a limited pool of skilled
as a result of ash dieback
stability and composition tree contractors
related accidents, both to
e.g. loss of bat (a European
professionals working on trees, • Increased direct/indirect costs
Protected Species) breeding/
and to the general public due to increased flood risk
roosting/ feeding sites
resulting from changes in the
• Increased safety issues due to
• Losses of carbon storage way water may be held back by
declining ash trees on roads,
and sequestration tree roots, or absorbed into the
owned and managed land
soil, or taken up by ash trees
such as in county parks, • Loss of biodiversity from
housing, estates, schools, the decline or extinction of • Costs of replanting needed
routes to school, active species which are largely or to retain ecosystem
travel routes and other entirely dependent upon ash services provided by ash
well-used paths e.g. flood reduction, urban
• Loss of shade for farming stock
shading, carbon storage and
• Risks to statutory functions or for people in urban areas
habitat for biodiversity
or service delivery such as
retaining safe schools, public • Increased liabilities and
open spaces or roads ECONOMIC IMPACTS insurance premiums as a result
of risks to adjacent land and
• Risks to staff and community • Increased liabilities in cases of
‘third party’ property from your
from trees on adjacent land death or injury as a result of
trees falling/shedding branches
falling into your estate ash dieback related incidents
• Drop in market prices for
• Risks from falling ash to your • Inadequate staffing levels
ash wood products due to
and others’ infrastructure and the ability (or inability)
excess ash on the market
such as houses, buildings, to undertake the work
structures, particularly required resulting in increased
Scheduled Historic Monuments costs to recruit and retain
REPUTATIONAL DAMAGE
and those of historical or other the necessary staff
importance, buildings, fencing, • Potential for disruption
• Increased expenditure from
signs, equipment stores, as a result of ash dieback
direct and indirect cost due to
electricity lines and railway management e.g. widespread
ash dieback e.g. additional staff
tracks etc. road closures to deal with
and management activities,
and the impacts this may have potentially dangerous trees
on other services and budgets • Political and reputational
ENVIRONMENTAL IMPACTS
• Additional costs if the disposal risks as a result of negative
• Landscape changes with press over ash dieback
of some products from felled
impacts on tourism and management and public
ash need to enter the waste
recreational opportunities outrage and/or anxiety
management system. NB
• Losses to ecosystem services wherever possible the timber • Potentially strained
such as reductions in air should be used and at present relationships with land
quality, potential for increased there is no restriction on the owners and managers as ash
flooding, biodiversity use of this for wood products dieback spreads, particularly
losses, increases in noise and firewood in relation to costs
levels adjacent to roads,
losses of visual screens
24Ash dieback: an Action Plan Toolkit for Scotland Section 2 | The Toolkit
BOX 4 Pest and disease triage and risk registers – an example from England
To enable ash dieback to be added to their emerging corporate risk register, West Sussex County Council
in England developed and trialled a ‘triage’ system to assess the risk posed by any pest or disease.
During 2017, they used the ‘triage system’ to demonstrate the potential impacts of ash dieback and
to justify the resources needed to develop an ADAP. The suggested process is as follows:
– Relevant officers are alerted to a new pest/disease threat by Defra and its agencies
– The impact of the pest or disease is ‘triaged’ against the risks identified in the West Sussex
Community Risk Assessment and organisational risk registers which include:
• Resource risk: loss of environment value, such as ecosystem services at a habitat scale,
and economic value in the shape of budget, staff, direct and indirect costs
• Risk to statutory duties/functions/service delivery: as roads authority (including
public rights of way) and as landowner: schools, other landholdings
• Political/reputational risk: public outrage/anxiety.
• Health and safety risk: fatalities/casualties/social disruption.
Risks are categorised against each item in the risk register as follows: LOW: MEDIUM: HIGH:
LIKELIHOOD
1 – Very Unlikely 2 – Unlikely 3 – Possible 4 – Likely 5 – Certain
1 – Insignificant
IMPACT
2 – Minor
3 – Moderate
4 – Significant
5 – Catastrophic
The rankings of each item are taken independently (not aggregated or averaged), and the
highest-ranking impact determines the ‘triage’ outcome below. This allows the County
Council to respond appropriately. The ‘triage’ pathway includes the following options:
1. If the impact of the pest or disease is insignificant to minor (1 or 2 in the table) to
the organisation or area, the pest/disease should be reviewed at least annually to
ensure no change. If the national threat (as defined by Defra) posed by the pest or
disease is changed within the year, then the pest/disease should be re-triaged.
2. If the impact is moderate (3 in the table), information about the pest/disease should
be monitored regularly. If the pest/disease is present in the area, then monitoring of the
extent/impact may need to be undertaken. If the national threat posed by the pest or
disease (as defined by Defra) is changed, then the pest/disease should be re-triaged
3. If the impact on the organisation is significant or catastrophic (4 or 5 in the table),
then the organisation should prepare and enact a Pest / Disease Local Action Plan.
During its development, it became clear that this system could also be applied to any other pest/disease.
For further details on West Sussex’s process framework for decisions on priorities for action see here.
25Ash dieback: an Action Plan Toolkit for Scotland Section 2 | The Toolkit
West Sussex’s pest and disease triage is influenced by the Sussex
Resilience Forum’s Community Risk Assessment (see here). Using
these thresholds and the available information on the pest/disease,
the County Council has been able to make a comparable assessment
of the likely impact of ash dieback on the various elements of the
County’s risk framework. This has resulted in the production of a
local plant health risk register based on the UK Plant Health Risk
Register. This is a live document to monitor and record the threats.
Ash dieback registered several ‘significant’ impacts against their risk
register and therefore warranted an Action Plan. Every organisation
will have different elements and thresholds for its risk register but
using this approach may help in establishing the need for an ADAP.
26Ash dieback: an Action Plan Toolkit for Scotland Section 2 | The Toolkit
PART 2: PREPARING AN ASH DIEBACK ACTION PLAN
HOW TO PREPARE AN ASH DIEBACK ACTION PLAN
(ADAP) AND WHAT SHOULD BE IN IT
The development of an ADAP requires a number of different
approaches depending on available staff and resources. The
length of time to produce a Plan will also vary depending on the
complexity of the organisation/area and the resources available to
undertake the work.
Experience over the last five years has shown that the
preparation of a fully functioning Plan may take anything
from three to four months to over a year.
The table below (Figure 6) shows the process that you are likely to
undertake as you prepare and then deliver an ADAP, including an
estimate of the timescale it may take to achieve the task, based on
experience. Many of these stages can be run simultaneously.
TOTAL TIME
Step 1: Compile an assessment of your ash trees and their health 3–6 months (average)
ACTIONS
Step 2: Set up cross-organisational meetings on ash dieback 1 month
Step 3: Prepare the Plan 3 months to 1 year
Step 4: Set up an internal and/or external steering group to deliver the Plan 3 months to 1 year
Figure 6: Estimated total time for preparing an ADAP
27Ash dieback: an Action Plan Toolkit for Scotland Section 2 | The Toolkit
Step 1: Compiling an assessment of ash trees and their health
Undertake an initial desktop exercise of the available information about the ash
tree population as described in Box 2: Edinburgh Council case study.
Where data is limited, some targeted data collection is likely to be necessary (which
may need resources and cross-organisational engagement – see Step 2). This survey
may cover items such as high-risk location ash numbers, age classes, geographical
hotspots of ash and, where possible, an assessment of their health. For the purposes
of this Toolkit, ‘high-risk location’ is used to refer to areas used by many people every
day, such as busy roads, railways and other well-used routes, well-used footpaths,
car parks and children’s playgrounds or where property may be affected.
As an example, during the summer of 2020, during the Covid-19 national lockdown, Angus
and South Lanarkshire Councils collected data to determine the potential number of roadside
ash trees within their areas. The road network was prioritised as the land holding most likely
to have the highest population of high target ash trees most susceptible to ash dieback.
Using a similar survey method, both Councils undertook a desk-based study
using images from Google Street View to understand the number and distribution
of ash trees alongside their road networks. The methods varied:
• Angus Council used a sample transect through the authority area, using the
freely available Street View pictures from Google Maps. The Street View verge
images were analysed visually looking for the presence of ash trees and a tally
recorded. The aim was to generate an initial estimate of ash numbers, which was
valid and could withstand external scrutiny. This desktop study took an estimated
16 hours to complete. Full details of the survey can be found in Appendix 3.
• South Lanarkshire Council’s study was based on analysis of A & B roads using Google
Street View and extrapolating the results for lower use U and C roads. The survey
captured trees up to 20m from the road and > 3m tall. For full details, see Appendix 4.
From the analysis, Angus have estimated that there are 4,920 ash trees on their roads network,
with by far the largest proportion growing adjacent to the Class C roads. South Lanarkshire have
estimated 19,143 ash trees in woodlands and other habitats adjacent to the road network.
28Ash dieback: an Action Plan Toolkit for Scotland Section 2 | The Toolkit
ASSESSING ASH TREE HEALTH IN SUMMER AND WINTER
During the development of this Toolkit, it became clear that when gathering data on an ash tree
population it is sensible to assess the current state of ash tree health at the same time. It can
be difficult to identify the symptoms of ash dieback in larger trees. During 2014, Suffolk County
Council developed a system to describe the health of an ash tree using a four-part categorisation
focused on the state of the ash tree’s canopy as a proxy for overall health (see Box 5).
BOX 5 Suffolk County Council Ash Health Assessment System
In Suffolk, the canopies of the ash trees are scored, assessing the percentage of the
crown that remains. Using this four-category framework allows a tree to be assigned to
a health category, which informs subsequent potential action. The four categories are:
• Class 1: 100%–76% remaining canopy • Class 3: 50%–26% remaining canopy
• Class 2: 75%–51% remaining canopy • Class 4: 25%–0% remaining canopy
For further details see here which includes the four reference photographs which
are benchmarks for the percentage of the canopy remaining (also shown below).
Class 1 Class 2 Class 3 Class 4 All images © Gary Battell
It is important to note that poor condition of the canopy might not be a result of ash dieback.
Other problems such as drought stress, root problems or even wood pigeon damage can cause
the ash tree canopy to decline. In addition, surveys of the tree canopy will not reveal other signs of
infection such as basal lesions. However, in the absence of other easy-to-recognise characteristics
in large trees, canopy cover is a useful proxy for health and is relatively easy to assess.
During the winter of 2020/21 Network Rail Scotland wanted to determine whether the
Suffolk canopy assessment method could be undertaken during the winter (Box 6).
29Ash dieback: an Action Plan Toolkit for Scotland Section 2 | The Toolkit
Using work undertaken in Germany by Professor Andreas Roloff
(which formed the basis of the summer ash survey system – see
A. Roloff 2001: Baumkronen. Publisher: Ulmer, Stuttgart/GER), his
descriptions of the trees in summer and winter were located.
This has resulted in a workable system that allows the identification with
some reliability for Class 1 and 2 trees, and the ability to clearly determine
Class 4 trees. There is some difficulty in the exact separation of a Class 2
from Class 3 tree – but work is being undertaken during 2021 to refine
this. Pictorially, the 4 Classes of trees look as shown in Box 6 below.
BOX 6 Network Rail Winter Ash Health Assessment System
• Class 1: Canopy intact. Rounded. Many interval branches
which give a dense ‘filled’ appearance to the crown.
• Class 2: The internal structure begins to be lost as small internal branches
break off. The extremity of the canopy becomes ‘spiky’ and fragmented.
• Class 3: Most of the internal branches have gone. The ends of the branches
begin to become ‘spikey’, and the canopy thins from the inside out.
• Class 4: The structure of the canopy is gone. The branches that
remain are spikey and show little if any branching.
All images © Jon Stokes
Class 1 Class 2 Class 3 Class 4
See Appendix 6 for more details about winter assessments.
30Ash dieback: an Action Plan Toolkit for Scotland Section 2 | The Toolkit
SURVEY RECOMMENDATIONS
© Jon Stokes
Each surveyed ash tree should be assigned to one
of the following four Ash Health Classes:
• Ash Health Class 1 – 100%–76% remaining canopy
• Ash Health Class 2 – 75%–51% remaining canopy
• Ash Health Class 3 – 50%–26% remaining canopy
• Ash Health Class 4 – 25%–0% remaining canopy
Combining surveying tree numbers and making an
assessment of their health is an effective use of resources.
This will allow organisations to understand both the
abundance of ash and their current state of health.
Any subsequent surveys should then be used to monitor Roadside ash survey
changes between Health Classes. This will allow a greater
understanding of the spread and speed of impact of
ash dieback. Monitoring over time is also essential as
reports show that in some years trees may recover
canopy condition, especially during hot and dry summers
when the weather is not ideal for fungal sporulation.
However, over time the tree’s health will usually continue
to decline, so it is essential that even if recovery is noted
in a given year or years, surveying does not stop.
During the summer of 2020, Forestry & Land Scotland
and West Lothian Council undertook a sample survey
of the number of highway ash trees using the Suffolk
Summer Health Class System. See Boxes 7 and 8.
31Ash dieback: an Action Plan Toolkit for Scotland Section 2 | The Toolkit
BOX 7 Case Study - Forestry and Land Scotland (FLS)
Forestry and Land Scotland (FLS) is responsible for the management of 640,000 ha
of national forest and land.
During the spring of 2020, FLS worked with Ash Dieback Resilience Group partners to develop a
survey and data collection ‘App’ (full details in Appendix 7). They then delivered webinar training
to approximately 60 staff in how to use the App, leading to trial surveys of ash in targeted areas.
In the first two months, FLS undertook 2,100 surveys identifying 6,600 ash trees, despite
the additional challenges and restrictions of introducing a new programme and surveying
during the COVID-19 pandemic. In 2021, they plan to revisit these trees to compare scores
from 2020, plus surveying thousands of additional trees, then annually thereafter.
Indicative data set to demonstrate how results can be displayed across the four categories.
Percentage Canopy Cover
120
100
NUMBER OF SURVEYS
80
60
40
20
0
Stage 0: Stage 1: Stage 2: Stage 3: Stage 4:
Healty tree 100% 99-76% 75-51% 50-26% 25-0%
canopy cover canopy cover canopy cover canopy cover canopy cover
FLS will also be exploring a number of alternative data collection options including:
using Google Street View, as used by Angus and South Lanarkshire Councils page 28;
developing Go Pro footage computer models; remote sensing and joint organisational
surveying, some of which FLS will pursue in parallel with their “App surveys” in 2021.
32You can also read