CAN POLICY CHANGE CULTURE? GOVERNMENT PENSION PLANS AND TRADITIONAL KINSHIP
←
→
Page content transcription
If your browser does not render page correctly, please read the page content below
C AN P OLICY C HANGE C ULTURE ? G OVERNMENT
    P ENSION P LANS AND T RADITIONAL K INSHIP
                    P RACTICES
                                              Natalie Bau∗

                                           January 21, 2019

                                                  Abstract

           Policies may change the incentives that allow cultural practices to persist. To test this, I
       study matrilocality and patrilocality, kinship traditions that determine daughters’ and sons’
       post-marriage residences and thus, which gender lives with and supports parents in their old
       age. Two separate policy experiments in Ghana and Indonesia show that pension policies
       reduce the practice of these traditions. I also show that these traditions incentivize parents
       to invest in the education of children who traditionally co-reside with them. Consequently,
       when pension plans change cultural practices, they also reduce educational investment.
       This finding further demonstrates that policy can change culture.

       Keywords: cultural transmission, cultural change, kinship traditions, intergenerational trans-
       fers.

   ∗
    UCLA, CEPR, and CIFAR, Contact: nbau@ucla.edu. I acknowledge the support of the CIFAR Azrieli Global
Scholars Program. I am grateful to Nava Ashraf, David Baqaee, Alberto Bisin, Tim Besley, Pamela Campa,
Raquel Fernández, Paola Guiliano, Asim Khwaja, Eliana LaFerrara, Nathan Nunn, Manisha Shah, Aloysius Siow,
and Alessandra Voena, as well as seminar and conference participants at CIFAR, NYU, LSE, UCL, Simon Fraser,
PSE, Namur, Harvard, H2D2, SIOE, the Galatina Meetings, and UToronto for their helpful comments. Eva Ng
and Palermo Penano provided exceptional research assistance.

                                                      1
1 Introduction
Cultural traditions evolve in response to the conditions in which humans live1 (Boyd and
Richerson, 1988) and can facilitate better outcomes by alleviating market incompleteness and
substituting for laws or policies (Greif, 1993). As modernizing countries adopt new policies,
culture may change. This paper provides some of the first evidence on whether policies lead to
cultural change by studying traditional, ethnicity-level practices that determine whether daugh-
ters (matrilocal), sons (patrilocal), or neither gender (neolocal) live with their parents after mar-
riage. In so doing, it also adds to a nascent literature in economics building on anthropologists’
recognition of the importance of kinship traditions for economic outcomes, particularly in low-
income countries.
I hypothesize that matrilocal and patrilocal practices have two important effects. First, they
ensure old age support for parents in the absence of pension plans and savings mechanisms
by designating which children will care for parents in their old age.2 Second, they provide
parents with an additional incentive to invest in the human capital of these children since they
are more likely to share in the labor and marriage market returns of their human capital invest-
ments. This second effect is consistent with a growing literature that suggests that imperfectly
altruistic parents may invest less than is optimal in their children since their children cannot
credibly commit to repaying that investment in the future (Becker et al., 2016; Banerjee, 2004;
Ashraf et al., forthcoming). Under this hypothesis, large-scale social programs like pension
plans weaken the incentives to practice matrilocality and patrilocality. This also undermines
parents’ incentives to invest in the human capital of matrilocal (patrilocal) daughters (sons).
Thus, observing changes in educational investment related to changes in the practice of ma-
trilocality and patrilocality provides an additional measure of cultural change beyond directly
observing changes in cultural practices.
I formalize these hypotheses in a simple two-period model where parents can choose to edu-
cate their children in the first period as a savings device for the second period. As in Bisin and
Verdier (2001), where parents transmit preferences to their children, I allow parents to choose
whether to transmit matrilocal or patrilocal cultural practices to their children. The model gives
rise to matrilocal, patrilocal, and neolocal equilibria and generates three testable predictions.
First, education rates are higher for daughters relative to sons in matrilocal versus neolocal and
1 As anthropologists Boyd and Richerson (1988) write, “humans adjust their [cultural] phenotypes in response
to their environments through learning and rational calculation” (p. 9).
2 Jayachandran (2015) reviews the literature on patrilocality and its link to old age support by sons, Banerjee
et al. (2014) show that parents perceive children as an importance source of old age support in China, and Jensen
and Miller (2017) shows that in India living together is important for children providing parents with old age
support.
2patrilocal equilibria (and vice versa for patrilocal equilibria). Second, if a sufficiently large
pension plan is introduced to a large enough portion of the population, matrilocal/patrilocal
equilibria with higher levels of education no longer exist. Therefore, the introduction of pen-
sion plans reduces both the practice of matrilocality (patrilocality) and female (male) education.
Third, the effects of offering the plan to a larger share of the population on the share of the pop-
ulation that is educated or practices the kinship traditions are non-linear since once the share
of individuals offered the plan passes a threshold, the matrilocal/patrilocal equilibria cease to
exist.
I test the predictions of the model in Indonesia and Ghana.3 While the primary analyses are
in Indonesia, where there is more detailed data on the roll out of the pension plan, the analyses
from Ghana provide evidence that these results are externally valid. As the model predicts, in
Indonesia, females in traditionally matrilocal groups are more likely to be enrolled in school
relative to their brothers when compared to females from non-matrilocal groups. In Ghana, the
same is true for males from traditionally patrilocal ethnic groups.
Turning to the Indonesian pension plan, I provide – to my knowledge – the first estimates
of the effects of the 1977 introduction of a pension system, Astek, on education and cultural
practices.4 Triple-differences analyses exploit ethnicity-level variation in traditional customs,
variation in pension plan exposure based on birth year, and geographic variation in the intensity
of the roll out. They show that the pension plan differentially reduced educational investments
in females from traditionally matrilocal ethnic groups. These women were also less likely to
practice matrilocality as adults. In line with the model, the effects of the intensity of the plan’s
roll out on both the practice of matrilocality and education are non-linear.
In Ghana, I exploit the timing of the introduction of a 1972 pension policy to provide es-
timates of this policy’s effect on education and cultural practices. Males from traditionally
patrilocal ethnic groups who were exposed to the pension plan for longer received less edu-
cation than non-traditionally patrilocal males and were less likely to practice patrilocality as
adults. Thus, the results from Indonesia replicate in a very different setting.
This paper contributes to several literatures. It builds on the literature on the evolution of cul-
tural practices and attitudes (Giuliano and Nunn, 2016; Lowes et al., 2017; Bidner and Francois,
2011; Anderson and Bidner, 2015). Most empirical papers in this literature study the effects
of large shocks that likely affected culture along many dimensions. For example, Campa and
Serafinelli (forthcoming) and Alesina and Fuchs-Schündeln (2007) study the effects of state
3 Unlike most potential settings, Indonesia and Ghana have within-country variation in matrilocal-
ity/patrilocality across ethnic groups. Both have also introduced pension plans in the recent past.
4 Sudomo (1985), Muliati (2013) and Perusahan Umum Asuransi Sosial Tenaga Kerja (1985) discuss this policy
in more detail.
3socialism on attitudes. Other papers study the effect of different historical empires (Peisakhin,
2010; Becker et al., 2015; Grosfeld and Zhuravskaya, 2015; Wysokinskya, 2015). In contrast,
this paper studies relatively small policy changes5 that come with modernization and shows that
these policies can lead to cultural change.
Additionally, this paper contributes to a growing literature on the importance of family ties
and kinship practices for economic outcomes (Alesina and Giuliano, 2013; Alesina et al., 2015;
Alesina and Giuliano, 2011; Enke, forthcoming; La Ferrara, 2007; Lowes, 2016; Schulz, 2018;
Akbari et al., 2018; Moscona et al., 2017). While anthropologists have long belived that these
kinship traditions are an important driver of outcomes in low-income countries, this understand-
ing is relatively new in economics. I contribute to this literature by showing how a specific set
of kinship practices – matrilocality and patrilocality – affect human capital investment.6
Finally, this paper also adds to an emerging literature on the importance of culture for deter-
mining the effects of different policies (Ashraf et al., forthcoming; World Bank, 2015; Eben-
stein, 2014; La Ferrara and Milazzo, 2017, Schoellman and Tertilt, 2006; Tertilt, 2005), as
well as the growing literature that examines the effects of gender-related cultural traditions
(Fernández, 2007; Fernández, 2011; Fernández and Fogli, 2009; Tertilt, 2006; Alesina et al.,
2013; Giuliano, 2014; Alesina et al., 2015; Corno et al., 2016; Corno et al., 2015; Gneezy et al.,
2009; Becker, 2018; Jayachandran and Pande, 2017).
The paper is organized as follows. Section 2 provides an overview of patrilocal and matrilo-
cal traditions. Section 3 develops a simple model of parental investment in education and the
transmission of cultural traditions in the presence of imperfect altruism. Section 4 tests the pre-
dictions of the model about the gender gap in education in Indonesia and Ghana. Section 5 turns
to the primary analysis of the paper, testing whether the introduction of the pension plan dif-
ferentially reduced female education and the transmission of matrilocality among traditionally
matrilocal groups in Indonesia. Section 6 replicates the key findings for patrilocality in Ghana.
Section 7 reports additional findings and investigates alternative explanations, and Section 8
concludes.
5 In this sense, this paper is related to Gruber and Hungerman (2007), who show that the New Deal’s “modern-
ization” policies crowded out the informal social safety net of church-based charitable spending.
6 Two related papers study the relationship between kinship traditions and human capital investment in Indone-
sia. Levine and Kavane (2003) use the Indonesia Family Life Survey data set to study the relationship between
patrilocality (as determined by an expert respondent at the village-level) and gender biased investment in Indonesia
and do not find a strong relationship. Rammohan and Robertson (2012) find a strong negative relationship between
ex post migration and female education in the IFLS. The analysis on the link between kinship traditions and human
capital in this paper differs from these papers both by using a different, larger data set and a different definition of
matrilocality drawn from the anthropological literature, and also by providing symmetric results on patrilocality in
Ghana. By exploiting exogeneous variation from pension plan introductions to show that reducing the practice of
matrilocality and patrilocality reduces the education of the targeted gender, this paper also provides more evidence
that the link between these kinship traditions and education is causal.
42 Patrilocal and Matrilocal Customs
In this section, I first document how I classify ethnic groups as matrilocal and patrilocal
and the variation in these measures. Then, to provide context for the analyses in this paper
and identify potential sources of bias, I discuss theories on the origins of matrilocality and
patrilocality from the anthropological literature. Finally, to validate the anthropological data,
I show that, even in recent data sets, the assignment of these ethnicity-level traditions predicts
matrilocal and patrilocal practices.
2.1 Variation in Matrilocality and Patrilocality
My analysis requires the measurement of the traditional post-marriage residency practices of
different ethnic groups. To do so, I use data from the Ethnographic Atlas (Murdock, 1967),
which codes ethnic groups’ traditional, pre-modernization cultural practices.7 To arrive at
ethnicity-level measures of traditional matrilocality and patrilocality in the Indonesian and Gha-
nian censuses, I follow methods developed by Ashraf et al. (forthcoming) and Alesina et al.
(2013). I use the Ethnologue (Gordon, 2005) to match the ethnicity or language data collected
by the censuses with the ethnicity-level data on cultural practices available in the Ethnographic
Atlas.
In Indonesia, I match 810 of the 827 languages in the 2010 census to groups with information
on post-marriage residence (matrilocality, neolocality or patrilocality) in the Ethnographic At-
las. Of these, 51 percent are patrilocal (411), 32 percent are neolocal (253), and 17 percent are
matrilocal (137). I focus on variation between matrilocality and patrilocality/neolocality, since
groups that primarily practice patrilocality or neolocality in Indonesia often practice the other
as a secondary practice (Lebar, 1972).8
In Ghana, I successfully match 53 of the 57 ethnic groups in the 2000 census to groups with
information on post-marriage residence in the Ethnographic Atlas. According to this match, 31
7 Of the 1,235 ethnic groups for whom data on ethnicity-level practices are available in the Ethnographic Atlas,
880 are traditionally patrilocal (71 percent), 155 are traditionally neolocal (13 percent) and 200 are traditionally
matrilocal (16 percent).
8 This choice follows from two additional pieces of information. The first piece of information come from the
Ethnographic Atlas, which reports both the primary post-marriage residential practice, which is what is used for
the coding in this paper, and the alternative practice. According to the Ethnographic Atlas, less than 1 percent of
individuals who report matrilocality as their primary practice have an alternative practice. In contrast, among those
who report patriocality as their primary form, 83 percent report neolocality as an alternative. The second piece
of information comes from a secondary match that I created of large ethnic groups in the 2010 Indonesia census
to ethnic traditions using Lebar (1972) and Strouthes (1993). In this match, 50 percent of individuals who were
coded as patrilocal according to the Ethnographic Atlas are now coded as neolocal, consistent with the fact that
in Indonesia, nominally patrilocal and neolocal ethnic groups actually follow a mix of these practices. However,
the coding of matrilocality was very stable across concordances. 99 percent of individuals coded as matrilocal
according to the Ethnographic Atlas are also coded as matrilocal according to the alternative concordance.
5groups (58 percent) are patrilocal and 22 (42 percent) are matrilocal. In an alternative match
using Gil (1964) and Asante and Mazama (2009), the majority of the groups coded as ma-
trilocal in this match are neolocal. Therefore, I focus on the margin between patrilocality and
neolocality/matrilocality.9
Using this assignment of matrilocality and patrilocality, I map the geographic variation in
these practices. Figure 1 reports the district-level percent of individuals in the census who
belong to traditionally matrilocal (in Indonesia) and patrilocal (in Ghana) ethnic groups. While
these traditions are not uniformly distributed in either country, there is still a great deal of
geographic variation in matrilocal and patrilocal traditions.
Figure 1: Distribution of Matrilocal Groups in Indonesia and Patrilocal Groups in Ghana
The figure reports the percent of the population in a district that traditionally practices matrilocality in the Indone-
sia 2010 census (left) and traditionally practices patrilocality in the Ghana 2000 census (right) according to an
ethnicity-level match with the Ethnographic Atlas.
2.2 Origins of Matrilocality and Patrilocality
Theories in anthropology on the origins of matrilocality and patrilocality shed light on other
cultural traits that could be correlated with these traditions. One theory argues that early hunter
gatherer societies were typically matrilineal (lineage and inheritance pass through the mother’s
line, and a son usually inherits from his maternal uncle) because sexual promiscuity made it
difficult to identify a child’s father (Engels, 1942). Matrilocality and matrilineality may in turn
be correlated since matrilocality allows children to grow up with their mother’s family, which
is their lineage group under matrilineality.10
9 If a group is primarily patrilocal according to the Ethnographic Atlas, the second match agrees 76 percent
of the time. This second match, however, never codes groups as matrilocal. The majority of the groups that are
matrilocal in the match from the Ethnographic Atlas (92 percent) are coded as neolocal.
10 Matrilineality doesn’t typically imply women inherit. In Status of Women in Pre-Industrial Societies, Whyte
(1978) notes that in matrilineal societies, “It is perfectly possible for the position of women to be as low as the
6An alternative theory is that matrilineality tends to occur in horticultural societies where
women often have a more dominant role in agriculture (Jones, 2011). Relatedly, Holden and
Mace (2003) argue that patrilineality (and therefore, patrilocality) may be more likely to evolve
in pastoral societies with access to cattle, where men play a larger role in agricultural produc-
tion.
Finally, some anthropologists have also linked matrilineality to dowry and patrilineality to
bride price. For example, Vroklage (1952) suggests that bride price, a payment from the family
of the husband to the family of the bride at the time of marriage, compensates the family of the
bride for taking the daughter from their lineage group.
Using data from the Ethnographic Atlas, I examine whether across- and within-country corre-
lations in traditional practices are consistent with these theories. I also test whether matrilocality
and patrilocality are correlated with other characteristics believed to be related to gender-biased
behavior. Appendix Table A1 estimates the correlation between ethnicity-level matrilocality
and patrilocality and aboriginal plow use, polygamy, bride price, male-dominated agriculture,
and matrilineality. Consistent with the anthropological literature, patrilocality and matrilocality
are strongly correlated with bride price and matrilineality across ethnic groups.
However, the correlations between these traditions and matrilocality and patrilocality may be
weaker within countries, where the traditional practices of the populations are more homoge-
neous. Appendix Table A2 reports the correlations between matrilocality and other traditions
within Indonesia and between patrilocality and other traditions within Ghana. I run these re-
gressions at the individual instead of the ethnic group level to allow larger ethnic groups to have
more weight, as they do in my main analysis, and cluster the standard errors at the ethnicity
level. As the table shows, there is no variation in Ghana in polygamy (all groups are histor-
ically polygamous) and aboriginal plow use (no groups had the plow). In Ghana, only male-
dominated agriculture is highly correlated with patrilocality. Within Indonesia, bride price and
male-dominated agriculture are not correlated with matrilocality, while aboriginal plow use,
polygamy, and matrilineality are. Altogether, though patrilocality and matrilocality are corre-
lated with other cultural traditions in both countries, none of these relationships are systematic
across countries.11 Nonetheless, throughout this paper, I control for a set of cultural traditions
that have been linked with gender-biased behavior consisting of aboriginal plow use, bride price,
male-dominated agriculture, and polygamy.
greatest misogynist would desire” (p. 7).
11 Matrilocality and patrilocality may still be associated with gender biased attitudes that are not measured by
the Ethnographic Atlas. While research in this area is limited, Alesina et al. (2015) provide evidence that there
is no correlation between patrilocality and domestic violence or attitudes toward violence against women in 18
Sub-Saharan African countries.
72.3 Modern Practice of Matrilocality and Patrilocality
I now validate my ethnicity-level measures of matrilocality and patrilocality from the Ethno-
graphic Atlas by testing whether they predict modern behavior. I use the 2000 Ghana census,
the 2010 Indonesia census,12 and the 2000 and 2007 rounds of the Indonesia Family Life Sur-
vey13 (IFLS), which provides more detailed data on matrilocal practices. In the censuses, I
code a household as practicing matrilocality (patrilocality) if a married daughter (son) lives in
the same household as her parents. This is a lower-bound measure of the prevalence of these
traditions. It does not capture cases where a child lives in the same compound or the same
village as a parent but does not live in the same census household.14 Neither does it capture
cases where matrilocality and patrilocality are not possible because there are no living parents
or married children.
Columns 1–2 and 5–6 of Table 1 report the coefficients from regressions of the practice of
matrilocality and patrilocality in the censuses on indicator variables for whether the household
head belongs to a traditionally matrilocal or patrilocal ethnicity. Historical traditions are pre-
dictive of modern-day practices, and given that I will show that the pension plan reduces these
practices, these relationships were likely stronger when the pension plan was introduced. In
Indonesia, belonging to a matrilocal ethnicity increases the likelihood a household practices
matrilocality by 2.3 percentage points (28 percent). In Ghana, belonging to a patrilocal eth-
nicity increases the likelihood a household practices patrilocality by 2.6 percentage points (37
percent).
I next replicate these tests of the predictive power of matrilocal traditions using the IFLS data.
Unlike the censuses, the IFLS asks respondents whether each of their biological parents lives
with them. Respondents may answer yes to this question even if the parent does not appear in
the household roster on the day of the survey. The results from the IFLS suggest that the census
measure of the pervasiveness of matrilocality is a lower-bound. Compared to the 8 percent of
households practicing matrilocality in the census, 15 percent of married females in the IFLS
report that one or both of their biological parents lives with them. Columns 3 and 4 show
that belonging to a matrilocal ethnicity is associated with a 8-18 percentage point increase in
practicing matrilocality (53-120 percent).
12 Both censuses are provided by the Minnesota Population Center (2011).
13 These are the only rounds of the IFLS that include ethnicity data.
14 Beaman and Dillon (2012) show that determining the exact boundaries of a household in low-income countries
is difficult, and the choice of boundaries may affect the results of economic analysis.
8Table 1: Association Between Cultural Traditions and Current Practices
(1) (2) (3) (4) (5) (6)
Indonesia 2010 Census Indonesia Family Life Survey Ghana 2000 Census
HH Practices Matrilocality Respondent Practices Matrilocality HH Practices Patrilocality
Matrilocal Ethnicity 0.023*** 0.036*** 0.079*** 0.176***
(0.011) (0.011) (0.015) ( 0.033)
[0.000] [0.000]
Patrilocal Ethnicity 0.026** 0.023*
(0.012) (0.013)
Ethnicity Tradition Controls N Y N Y N Y
Muslim Control N Y N Y N Y
Mean Dep. Var. 0.081 0.081 0.150 0.150 0.070 0.070
Number of observations 5,955,980 5,951,403 5,610 5,606 346,498 346,498
Clusters 801 801 25 25 54 54
Adjusted R2 0.000 0.002 0.013 0.014 0.003 0.007
For the census data sets, this table regresses an indicator variable for whether a household practices matrilocality (a married
daughter lives in the same household as her parents) or patrilocality (a married son lives in the same household as his parents)
on indicator variables for whether the household head belongs to a traditionally matrilocal or patrilocal ethnicity. An obser-
vation is then a household. For the Indonesia Family Life Survey (rounds 3 and 4), this table regresses an indicator variable
equal to 1 if a female, married respondent between the ages of 25 and 45 reports one or both of her biological parents live
with her on an indicator variable for whether the respondent belongs to a matrilocal ethnic group. Then, an observation is an
individual. Ethnicity controls consist of indicator variables for polygamy, aboriginal plow use, male-dominated agriculture,
and bride price customs, as well as indicator variables for cases where information on these customs is missing. Standard er-
rors are clustered at the ethnicity level. Due to the relatively small number of clusters in the IFLS, wild bootstrapped p-values
appear in the brackets for these regressions. *, **, and *** denote 10 percent, 5 percent, and 1 percent statistical significance
respectively.
3 Theoretical Framework
In this section, I develop a simple model to capture the relationship between the intergener-
ational transmission of co-residence traditions, education, and pension policies to motivate the
empirical analysis in Sections 4–6. In the first subsection, I describe the parent’s decision prob-
lem, where an imperfectly altruistic parent decides whether or not to educate and whether or
not to transmit a cultural tradition to her son or daughter. The existence of the cultural tradition
allows the parent to “save” for old age by investing in the human capital of the same child to
whom she transmits the tradition. There is a reduced-form cultural externality: transmission
of the tradition is more successful if more co-ethnics transmit it. In the second subsection, I
characterize the parent’s equilibrium actions. Reflecting the empirical reality that matrilocal,
patrilocal, and neolocal ethnic groups co-exist, I show that all three types of equilibria exist.
Thus, different ethnic groups can be in different equilibria. In a neolocal equilibrium, cultural
traditions are never transmitted. In a matrilocal/patrilocal equilibria, parents who educate a
child of the targeted gender also transmit the tradition. Then, education rates for the targeted
gender are high relative to in the neolocal equilibrium or the equilibrium that targets the other
gender. When pension plans are sufficiently large, they completely crowd-out parents “saving”
9through investing in the child’s human capital and transmitting the tradition. Then, the matrilo-
cal/patrilocal equilibria cease to exist. Due to the cultural externality, this occurs even if only
part of the population is treated with the pension plan. Thus, the model generates three testable
predictions: (1) education rates are higher for the targeted gender relative to the other gender in
the matrilocal/patrilocal equilibria relative to the neolocal equilibrium, (2) the introduction of
pension plans reduces both education and the practice of the cultural tradition, and (3) the share
of the population exposed to the pension plan will have non-linear effects on education and the
practice of matrilocality/patrilocality.
Setup
The decision-maker in the model is the parent who has a male and female child (types m and
f ). The decision-maker is indexed by her children’s returns to education, vm and v f , which vary
with ability. These are independent draws from the distribution function F. The parent lives for
two periods but make decisions only in the first period. In period 1, she decides whether or not
to transmit the cultural tradition to one of her children and whether or not to invest in the child’s
education. The parent can only transmit the tradition to one gender, as the household cannot
simultaneously have two conflicting traditions. Intuitively, this constraint captures the fact that
part of transmitting a tradition is practicing it oneself, and a household cannot simultaneously
practice patrilocality and matrilocality. The parent consumes in both periods and also have
some altruism towards her children. Suppressing the indices v f and vm , the parent’s preferences
are represented by
U p (e f , em , i f , im , I) =u(c1p (e f , em , i f , im , I))
+ β E u(c2p (e f , em , i f , im , I)) + γU f (e f , i f , I f ) + γU m (em , im , I m ) ,
where c1p > 0 and c2p > 0 are vectors of the parent’s consumption of two different goods in
periods 1 and 2, and U k is the utility of a child of type k ∈ { f , m} in period 2. The parameter γ
measures the parent’s altruism toward the children, while β measures the parent’s discount rate.
The parent’s choice variables are ek ∈ (0, 1) and ik ∈ (0, 1), which denote discrete investments
in education and transmitting the tradition. For education, this assumption matches the reality
in low-income countries, where parents often believe that all or most of the returns to education
come from completing a given level of schooling (e.g. primary or secondary). I is the vector
of the aggregate investments I f = E(i f ) and I m = E(im ), which sum the individual investments
by co-ethnics in im and i f and capture the extent to which the rest of society invests in the
different traditions. The utility functions of the parent and the children are assumed to be quasi-
linear over two goods. So, u = U f = U m = log(ct,1 k ) + ck , where t indexes the time period.
t,2
10Intuitively, the first good can be thought of as the necessities required for subsistence, such as
food and housing. Children in the second period are assumed to be at an interior solution, where
their income is high enough that they spend on both goods. The parent is assumed to be at the
interior solution in the first period and a corner solution in the second period, where she only
spends on the log good. This captures the fact that the retiree’s income is low and often close
to subsistence. Since the retiree’s income is low, quasi-linear utility provides the parent with an
incentive to transfer income across periods.
For simplicity, the model abstracts away from borrowing and formal sources of saving. This
is consistent with the fact that most of the population in Indonesia and Ghana in the 1970s (the
period I study) had little access to the formal banking sector.15 Total parental consumption in
period 1 is equal to some exogenous income y1 net of the cost of education de for each child
and the cost of transmitting the tradition di , as well as an exogenous pension payment p. Then,
∑ c1,p j (e f , em, i f , im) = y1 − ∑ de ek − ∑ di ik − p,
j k∈{ f ,m} k∈{ f ,m}
where j indexes a consumption good. Parental consumption in period 2 is equal to exogenous
income y2 plus transfers from the child and pension returns. Normalizing transfers when e f =
em = 0 to be zero, we can write
∑ c2,p j (e f , em, i f , im) = y2 + ∑ τ k ek sk + rp,
j k∈{ f ,m}
where r is the returns from the pension, τ k is the transfers from the child k when ek = 1, and sk
is a binary random variable. The assumption that transfers increase in a child’s education could
be due to educational returns in either the labor or marriage markets.16
I assume that the child k only pays the transfer to the parent if sk = 1, otherwise reneging
on the tradition. Furthermore, I assume that the probability that sk = 1 is given by g(ik , I k ),
representing a reduced-form cultural externality. By assumption, g(0, I k ) = 0, g(ik , 0) = 0, and
15 As late as 2011, 30–40 years after the pension plans I study were introduced and the first year for which data is
available, only 20 percent of adult Indonesians and 29 percent adult Ghanians had savings accounts (World Bank,
2018).
16 Ashraf et al. (forthcoming) show that marriage market matching in Indonesia is highly assortative in education.
Thus, parents of more educated matrilocal daughters in Indonesia benefit from both the labor market returns to
education and the increased quality/income of the daughter’s spouse.
11∂ g(1,I k )
∂ Ik
> 0. Hence, the expected utility of consumption in period 2 for the parent is
E(u(c2p (e f , em , i f , im , I))) = ∑ k k k k k k k k
1ik =1 g (i , I )u y2 + τ e + rp + (1 − g (i , I ))u (y2 + rp)
k∈{ f ,m}
+ 1i f +im =0 u (y2 + rp) ,
where 1ik =1 is an indicator variable equal to 1 if ik = 1 and 1i f +im =0 is an indicator variable
equal to 1 if i f + im = 0. A child k’s consumption is then
∑ ckj (ek , ik ) = bk + sk ek (vk − dτ ) + (1 − sk )ek vk ,
j
where bk is the child’s baseline income if she does not receive any education, and dτ is the cost
of making the transfer τ to the parent for each child.17 Note the subscript for t is suppressed as
the child only consumes in the second period. Thus, a child k’s expected utility is given by
E(U k ) = g(ik , I k )u(bk + sk ek (vk − dτ )) + (1 − g(ik , I k ))u(bk + ek vk ).
The function g(ik , I k ) is an important ingredient in the model because it captures the impor-
tance of culture for ensuring that children provide old-age support. As noted by anthropolo-
gists, co-residence traditions require “interlocking and coordinated social exchange” (Jordan
and Mace, 2009). If parents unilaterally try to change or instill a new co-residence tradition,
this tradition would conflict with the tradition of the child’s eventual spouse.18 Additionally,
when following cultural traditions is costly, social stigma may play a powerful role in enforcing
the tradition. The cultural externality explains both why culture can be sticky in some circum-
stances (e.g. it is impossible for parents to unilaterally deviate to matrilocality in a neolocal
society) and also why traditional practices may exhibit tipping point behavior, disappearing
quickly when the underlying economic environment changes.
With some abuse of notation, parents belong to one of two exogenously assigned types: a
fraction λ pay p into the pension program and receive returns rp, whereas 1 − λ pay nothing
into the pension program and receive no returns. I consider the one-shot static Nash equilibrium
17 This formulation allows for the fact that it may cost less than τ for the child to provide the parent with a
transfer of τ, as may be the case if parents and children share public goods. dτ = τ is therefore a special cause of
the model.
18 This reasoning assumes that individuals marry within their own ethnic group, and the data is consistent with
this assumption. In the Indonesia 2010 census, only 0.16 percent of household heads have a spouse from an
ethnicity with a different post-marriage residency practice. In the Ghana 2010 census, only 13.8 percent of married
household heads have a spouse from an ethnicity with a different post-marriage residency practice.
12of this game.
3.1 Predictions
Now, we characterize the types of equilibria this model can have, and relate them to the
pension parameters p and λ . Before proceeding to the propositions, I define a “matrilocal”
equilibria to be an equilibria where I f > I m and a “patrilocal” equilibria to be an equilibria
where I m > I f . Matrilocal and patrilocal equilibria are “gendered equilibria.” A “neolocal”
equilibria is one where I f = I m = 0.
Proposition 1. There are three types of equilibria: matrilocal equilibria, patrilocal equilibria,
and a neolocal equilibrium. The neolocal equilibrium always exists. Denote by α k the share of
f m > α f − αm > α f − αm .
children of gender k who are educated. Then, αmat − αmat neo neo pat pat
Proof. See Appendix A.
It is clear that a neolocal equilibrium will always exist since, if I k = 0, gk (ik , 0) = 0, and it is
never rational to invest in the tradition. However, gendered equilibria may also exist if enough
individuals choose to invest in the tradition. In these equilibria, all parents who educate a child
of the targeted gender will also choose to transmit the tradition to her since the returns to trans-
mitting the tradition do not depend on vk . Since the decision to invest in the tradition depends
on the share of co-ethnics who invest in the tradition, a gendered equilibrium is characterized
by a fixed point in I k . There, the number of parents who invest in the predominant tradition I k is
also equal to the number of children of the targeted gender who are educated. Transmitting the
tradition creates an additional incentive to invest in the child’s education as a way of “saving”
for old age, increasing education rates for that gender. As the matrilocal equilibrium gener-
ates stronger incentives to educate females relative to males, the female education rate net of
the male education rate is higher in the matrilocal equilibrium than the neolocal and patrilocal
equilibria. The opposite is true for the patrilocal equilibrium.
Now consider the effects of increasing the size of the pension payments p.
Proposition 2. There exists pH such that if p > pH , no household that receives the pension plan
will invest in transmitting the tradition.
Proof. See Appendix A.
Receiving the pension plan increases a household’s second period income, reducing the value
of saving through transfers from their child. Thus, when the value of the pension payments is
high enough, households no longer invest in transmitting the tradition. Indeed, raising second
period income on its own could eventually lead households to stop transmitting the cultural
13tradition, even if di = 0, as long as dτ , the cost of a child making a transfer to his parent,
is sufficiently high.19 As second period incomes increase, parents will no longer value the
additional consumption extracted from their children more than the loss to the child’s utility of
making those transfers, capturing the fact that higher incomes and economic development can
themselves lead the gendered equilibria to disappear.
To better understand the properties of the equilibria, we consider the conditions under which
the matrilocal equilibria exist. Let i f ∗ (v f , e f , I f ) be the parent’s equilibrium investment in the
tradition conditional on the child’s ability, the choice of investment in education, and the re-
sponse of other families. The parent will invest in a daughter’s education if the returns to
educating are higher than not educating
max
m
U p (1, em , i f ∗ (v f , 1, em , I f ), 0, I) ≥ max
m m
U p (0, em , 0, im , I),
e e ,i
Substituting and rearranging gives a cut-off value v f ∗ (I f ) for ability such that the child is edu-
cated if, and only if, v f > v f ∗ (I f ).20
The parent will choose to invest in the tradition if, and only if the utility from investing in
transmitting the tradition to an educated daughter is higher than the utility of not transmitting it,
U p (1, em , 1, 0, I) ≥ U p (1, em , 0, im∗ , I).
Rearranging this implies that investment in the tradition is only optimal if I f is sufficiently high
such that I f ≥ I f ∗ .21 Crucially, I f ∗ does not depend on v f , hence, if I f ≥ I f ∗ , then every parent
who educates their child will also invest in the tradition, so I f = 1 − F(v f ∗ ).
These relationships are depicted graphically for matrilocal and neolocal equilibria in Figure
2. The left panel of Figure 2 shows an example with three candidate equilibria, which are the
points where the red line (the share of parents who would invest in education given I f ) intersects
the blue line (the 45 degree line). The three candidates for an equilibrium are the case where no
one invests I f = 0, everyone invests I f = 1, and an intermediate case where only some fraction
invest in matrilocality. In this example, the intermediate case is not an equilibrium since I f < I f ∗
(shown by the dotted lines). Hence, the model in the left-panel has equilibria where everyone
invests in matrilocality and where no-one invests in it.
19 One important cost of making the transfer could be the cost of not migrating to pursue better work opportuni-
ties.
g(i f ∗ ,I f ) log(y2 +rp)+γdτ −log(y2 +rp+τ)
= diβ+d
20 v f ∗ e
γ + γ , where i f ∗ is the equilibrium investment in transmitting the
tradition given e f = 1.
21 I f ∗ is characterized by β g(1, I f ∗ ) log(y2 + rp + τ) − log(y2 + rp) − γdτ = di .
14Figure 2: Existence of the Matrilocal Equilibrium and the Introduction of the Pension Plan
1 1
0.8 0.8
0.6 0.6
If
If
0.4 0.4
0.2 0.2
0 0
0 0.5 1 0 0.5 1
If If
This figure illustrates that when there is a fixed point in the number of households that educate their daughters,
1 − F(v f ∗ (I f )), and the number of households who transmit the matrilocal tradition, I f , and it satisfies incentive
compatibility constraints (dotted lines), there is a matrilocal equilibrium (left). If no such fixed point exists, there
is no matrilocal equilibrium (right).
In the right panel, we increase the size of pension payments from zero to a positive number.
Increased second period income reduces the value of transmitting the cultural tradition. So,
the pension plan increases the cut-off I f ∗ since the tradition needs to be practiced more widely
to make the investment worthwhile. At the same time, the pension plan also increases v f ∗ for
every value of I f since it reduces the payoffs of saving through the child. This causes the
red line 1 − F(v f ∗ (I f )) to move to the right (a stochastically dominated shift in the counter-
cumulative distribution). In this case, the matrilocal equilibrium ceases to exist, and only the
neolocal equilibrium is left.
In this comparative static exercise, for an ethnic group initially in the neolocal equilibrium,
there is no decrease in education due to the pension plan. However, for the matrilocal equi-
librium, there is potentially a drastic decrease in female education. If the starting point is a
gendered equilibrium, the pension policy may eliminate this equilibrium, and cause a discon-
tinuous switch to the neolocal equilibrium, which has a lower rate of education for children of
the targeted gender.
The next proposition shows that a similar effect can occur, holding fixed the size of pension
payments p, in response to an increase in pension coverage λ .
Proposition 3. There exists λ H < 1 such that if λ > λ H and p > pH , a gendered equilibria no
longer exists.
Proof. See Appendix A.
15If those who receive the pension plan cease to practice the tradition, the returns to transmitting
the tradition for other households will fall due to the cultural externality. Therefore, when
enough households receive the pension plan, the conditions for a gendered equilibrium will no
longer be satisfied, even for households who did not receive the pension plan. The gendered
equilibrium ceases to exist. Then, the practice of gendered traditions falls even for those whose
parents were not eligible for the plan.
Propositions 2 and 3 suggest that the introduction and expansion of a compulsory pension
program will differentially reduce education for ethnicities that practice gendered co-residence
traditions prior to the introduction of the pension plan by breaking down the tradition. Propo-
sition 3 shows that even households who are not treated directly by the pension program can
undergo dramatic changes in both the practice of the tradition and investment in education
due to equilibrium effects. Because large effects of the expansion occur when the equilibrium
switches, Proposition 3 also suggests that the share of the population treated by a pension plan
will have non-linear, inverse U-shaped effects on both education and the practice of the cultural
traditions.
4 Matrilocality, Patrilocality, and the Gender Gap
In this section, I test the first prediction of the model – that female education rates will be
higher relative to male education rates for traditionally matrilocal ethnic groups and vice versa
for patrilocal ethnic groups.
Empirical Strategy
To estimate the association between patrilocality and matrilocality and within-household dif-
ferences in school enrollment in Indonesia and Ghana, I use the 2010 census data in Indonesia
and the 2000 census data in Ghana to estimate:
enrollie = β1 IiGender + β2 IiGender × IeTradition + ΓXie + HH j + εie , (1)
where i denotes a child of the household head between the ages of 5 and 22, e denotes an ethnic
group, enrollie is an indicator variable equal to 1 if a child is enrolled in school and 0 otherwise.
IiGender is an indicator variable for the relevant gender (female in Indonesia and male in Ghana),
IeTradition is an ethnicity-specific indicator variable for an ethnic group’s traditional practice (ma-
trilocality in Indonesia and patrilocality in Ghana), and HH j is a household fixed effect. I focus
on the sample aged 5–22 since this group is of the appropriate ages to be enrolled in school, in-
cluding college. Xie contains child-specific controls and age fixed effects, and depending on the
16specification, includes controls for parental educational and socioeconomic status,22 controls
for geographic region (province indicator variables in Indonesia and district indicator variables
in Ghana), a control for whether the household head is male, and indicators for aboriginal plow
use, bride price customs, male-dominated agriculture, and polygamy traditions, all interacted
with child gender. This regression estimates the effect of matrilocality or patrilocality on the
gender gap in enrollment for male and female siblings in the same household. β2 , the relative ef-
fect on enrollment of being a traditionally matrilocal female or patrilocal male, is the coefficient
of interest, and we predict that β2 > 0.
By examining the gender gap between siblings, I control for differences in the access to
schooling or household wealth that could be associated with ethnicity-level traditions and af-
fect enrollment. Including rich socioeconomic and geographic controls interacted with gender
accounts for socioeconomic and geographic variables that could be correlated with cultural tra-
ditions and could affect the gender gap in education.
To inform potential sources of bias in regression equation (1), the top panels of Appendix
Tables A3 and A4 document summary statistics and balance by traditional practice for the In-
donesia and Ghana census data used in these regressions respectively. Along most dimensions,
matrilocal and non-matrilocal groups in Indonesia are similar. Conditional on year and province
of birth, the main differences are that matrilocal mothers are more likely to have completed
primary schooling – consistent with the hypothesis that matrilocality incentivizes educational
investment in women – and matrilocal individuals are much more likely to be Muslim. Conse-
quently, in both countries, I also include a control for whether the respondent is Muslim and its
interaction with gender.
In Ghana, Appendix Table A4 shows that there are strong differences between patrilocal and
non-patrilocal groups, indicating that patrilocal groups are poorer and less educated than non-
patrilocal groups. However, Muslim is not correlated with patrilocality.
Results
The estimates from regression equation (1) are in Table 2. As the upper-half of the table
shows, females in matrilocal households are 1.2-2 percentage points more likely to be enrolled
in school relative to their brothers when compared to females in non-matrilocal households
in Indonesia. Neither the gender interactions with household socioeconomic status (column 2),
alternative ethnic traditions (column 3), nor geographic location in Indonesia (column 4) appear
22 These consist of indicator variables for whether the father has completed primary school, whether the father’s
spouse has completed primary school, whether the father works in a high skill sector, whether the father’s spouse
works in a high skill sector, whether the father works in agriculture, and whether the father’s spouse works in
agriculture.
17to explain this result. While the yearly differences in the likelihood of enrollment appear small,
they accumulate. Adding up the 18 years a child could have been enrolled in school between the
ages of 5 and 22, this indicates that there will be a gap in educational attainment of 0.22–0.36
years of schooling between matrilocal and non-matrilocal females (relative to their brothers).
For comparison, Duflo (2001) finds that an additional school per 1,000 children increases male
years of schooling in Indonesia by 0.12-0.19 years. Thus, belonging to a matrilocal ethnic group
increases years of schooling by about the same amount as 1 to 2 extra primary schools per 1,000
children.
The estimates are similar in Ghana. Patrilocal males are approximately 1 percentage point
more likely to be enrolled in school relative to their sisters when compared to non-patrilocal
males in Ghana. This implies a difference of 0.18 years of educational attainment. While the
effect size is not significant in the first two columns, the inclusion of the gender interactions
with ethnicity level traditional practices and the district by gender fixed effects in columns 3
and 4 increases the precision of the estimates.
Additionally, the results for Indonesia and Ghana are not driven by the selection of a sample
of children aged 5-22. Appendix Table A5 re-estimates equation (1) for a sample of children
aged 5-18 and shows that the results are similar in this smaller sample.
I now examine whether these findings apply more broadly outside of Indonesia and Ghana.
Appendix B combines country-level gender gap data with data on the percent of a country’s
population that is traditionally matrilocal or patrilocal to verify the model’s gender gap predic-
tion globally. Appendix Table A6 reports the results of these regressions and shows that the
percent of the population that is traditionally matrilocal and patrilocal affects the gender gap in
the expected directions, consistent with the within-county findings from Indonesia and Ghana.
Together, traditional patrilocality and matrilocality explain 4 percent of the global gender gap.
5 Pension Plan Introduction in Indonesia
In this section, I test whether the introduction of pension plans in Indonesia differentially re-
duced female education and the practice of matrilocality among traditionally matrilocal groups
in Indonesia. I describe the details of the pension plan, my empirical strategy, results, and
robustness checks.
5.1 Astek
Astek was founded in Indonesia in 1977 and developed accident, health care, death, and
provident fund schemes for employees of medium and large firms (greater than 100 employ-
ees). Under the plan, employees were required to save 1 percent of their earnings and employers
18Table 2: Association Between Matrilocality and Patrilocality and the Within-Household Gender
Gap in Enrollment in Indonesia and Ghana
(1) (2) (3) (4)
Baseline +SES Controls +Custom Controls +Geography Controls
Indonesia
IeMatrilocal × IiFemale0.020*** 0.018*** 0.012** 0.012**
(0.003) (0.004) (0.006) (0.005)
Mean Dep. Var. 0.687 0.698 0.698 0.698
Number of observations 6,151,544 5,549,884 5,549,884 5,549,884
Clusters 801 800 800 800
Adjusted R2 0.522 0.515 0.515 0.516
Ghana
IePatrilocal × IiMale 0.011 0.006 0.010** 0.010*
(0.008) (0.007) (0.005) (0.005)
Mean Dep. Var. 0.598 0.595 0.595 0.595
Number of observations 406,840 266,418 266,418 266,418
Clusters 53 53 53 53
Adjusted R2 0.507 0.517 0.517 0.517
This table reports difference-in-difference estimates of the association of the interaction between tradi-
tional matrilocality and female (Indonesia) and traditional patrilocality and male (Ghana) with enroll-
ment for children of the household head aged 5-22 in the Indonesia 2010 Census and the Ghana 2000
Census. All regressions include household and age fixed effects. In addition, column 2 adds indicator
variables for whether the father has completed primary school, whether the father’s spouse has com-
pleted primary school, whether the father works in a high skill sector, whether the father’s spouse works
in a high skill sector, whether the father works in agriculture, whether the father’s spouse works in agri-
culture, whether the household head is male, and whether the individual is muslim interacted with child
gender. Column 3 includes indicator variables for whether a child belongs to an ethnicity with a bride
price custom, male-dominated agriculture, polygamy, or aboriginal plow use interacted with child gen-
der. Column 4 includes province fixed effects (Indonesia) or district fixed effects (Ghana) interacted
with child gender. Data on ethnic practices is drawn from the Ethnographic Atlas. Standard errors are
clustered at the ethnicity level. *, **, and *** denote 10 percent, 5 percent, and 1 percent statistical
significance respectively.
19provided a matching contribution of 1.5 percent. Most funds were allocated to bank time de-
posits with annual interest rates of 9 percent, and retirees received their benefits in lump-sum
form when they retired, as long as they were 55 or older (Perusahan Umum Asuransi Sosial
Tenaga Kerja, 1985). By the end of 1983, 8,602 employers and 1,960,109 employees were
covered by Astek. Coverage expanded rapidly, and in 1985, the government estimated that 5.5
million employees would be covered by 1988 (Perusahan Umum Asuransi Sosial Tenaga Kerja,
1985). While a minority of workers were employed at large firms in the formal sector, the
percent of affected individuals (due to having an affected worker in their household) is much
greater than the percent of affected workers. Though I cannot observe formal sector workers
explicitly in the census, I can assign individuals as likely to be in the formal sector based on
their occupation category.23 Based on this assignment, 12 percent of adults are in the formal
sector, but 35 percent of children between the ages of 5 and 18 live in a household where at
least one individual is employed in the formal sector.
5.2 Empirical Strategy
Linear Specification
My main empirical strategy is a triple-differences. This strategy exploits the fact that two
pieces of variation determine the degree to which females in the 2010 Indonesia census were
affected by the introduction of Astek. First, if a daughter was sufficiently old when the pension
plan was introduced, it will be too late for the pension plan to affect parents’ educational in-
vestments and transmission of the cultural tradition. These investments will have already been
made. Second, when the plan was introduced, some geographic areas were more intensively
treated by the pension plan than others. The cohort variation can be combined with this ge-
ographic variation to create a difference-in-differences estimator of the effect of the pension
plan in Indonesia.24 Additonally, since I am interested in the differential effect of the pension
plan on traditionally matrilocal groups, I also exploit variation in whether a female belongs to
a traditionally matrilocal ethnic group. Combining the geographic, cohort, and ethnicity-level
variation results in the final triple-differences strategy.
Geographic variation in Astek’s rollout comes from the fact that Astek expanded its coverage
over time and initial compliance was imperfect. From 1978 to 1979, the number of enrollees
grew by 24 percent, and from 1979 to 1980, it grew by 12 percent. By 1983, only 40 percent
of eligible individuals were enrolled (Sudomo, 1985). Thus, I exploit the fact that areas with
23 Iconsider occupations likely to be in the formal sector if they are coded as “estate” (large-scale) agriculture,
manufacturing, electricity and gas, info and communications, finance, education, or health in the 2010 Census.
24 This identification strategy is similar to the one used by Duflo (2001) to estimate the effect of the INPRES
school construction on education outcomes in Indonesia.
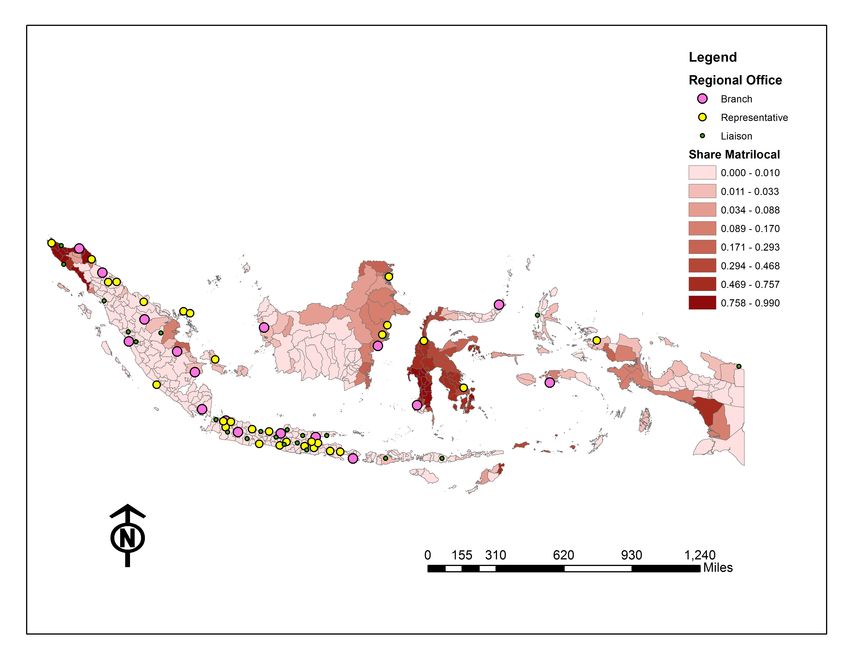
20more Astek branch offices, liaisons, and representatives likely had higher initial enrollment.
Perusahan Umum Asuransi Sosial Tenaga Kerja (1985) reports the locations of these offices in
1982, and Figure 3 plots their locations.
Figure 3: Locations of Astek Offices in Indonesia
The figure documents the locations of the Astek pension plan offices in Indonesia in 1982 according to Perusahan
Umum Asuransi Sosial Tenaga Kerja (1985).
Using the cohort, geographic, and ethnicity-level variation, I estimate the triple-differences
regression for a sample of females born between 1959 and 1985
yicpe =β1 IeMatrilocal × IcFull Treat
× Intensity p + β2 IeMatrilocal × IcPart Treat
× Intensity p + αcp + αe
+ ∑ γ p IeMatrilocal + ∑ λc IeMatrilocal + ΓXipe + εicpe , (2)
p c
where i denotes an individual, c denotes the individual’s birth year, p denotes the province of
an individual’s birth, and e denotes an ethnic group. The outcomes of interest, yicpe , consist of
indicator variables for completing primary and secondary schooling, attending university, and
an indicator variable for practicing matrilocality (a married woman living in the same household
as at least one of her parents). Intensityd is the number of pension offices per 1,000 square
miles in province p, IeMatrilocal is an indicator variable equal to 1 if an individual belongs to
a traditionally matrilocal ethnic group, and IcPart Treat and IcFull Treat indicate the individual’s
21You can also read